Lessons
Lesson 1: Solar and Anaerobic Digestion
Overview
In this lesson, we'll go over solar and anaerobic digestion in a little more detail. We will see some of this in our travels, and I want you to have a better understanding of some of the basics.
Learning Outcomes
By the end of this lesson, you should be able to:
- identify different types of solar technologies;
- explain the basic process by which solar panels generate electricity;
- explain the difference between irradiance and irradiation;
- calculate energy use/generation given power and time;
- evaluate the impact of tilt and orientation on solar PV output;
- calculate the output of a solar array;
- explain how anaerobic digestion converts organic material to biogas; and
- identify some of the benefits of anaerobic digestion.
Lesson Roadmap
| To Read | Lesson 6 Online Content | You're here! |
|---|---|---|
| To Do |
|
|
Questions?
If you have any general course questions, please post them to our HAVE A QUESTION discussion forum located under the Discussions tab in Canvas. I will check that discussion forum regularly to respond as appropriate. While you are there, feel free to post your own responses and comments if you are able to help out a classmate. If you have a question but would like to remain anonymous to the other students, email me through Canvas.
If you have something related to the material that you'd like to share, feel free to post to the Coffee Shop forum, also under the Discussions tab in Canvas.
Solar Energy
As was detailed in an earlier lesson, solar energy is electromagnetic (aka radiant) energy that is generated by the (nuclear) fusion of hydrogen atoms into helium atoms in the sun. The amount of radiant energy that is released by an object is related to its temperature, and since the sun is so hot (~10,000º F!) [1], it is able to reach the ~94,000,000 miles (the distance depends on the time of year) to the earth. It is a massive amount of energy! A commonly cited statistic is that enough solar energy reaches the earth each hour to provide all of humanity's energy for an entire year. There is no shortage of solar energy.
Types of Solar Energy Technologies
Without the sun, life on earth would not be possible. It provides energy for vegetation to grow and provides sufficient heat to allow water to exist in liquid form, among other things. But there are many ways that humans can use this radiant energy more deliberately. The following is an overview of the major types of solar technologies. We could spend weeks analyzing each of these - keep in mind that this is just an overview.
- Solar photovoltaics (solar PV): Certain materials have the natural property of converting energy from the sun into electricity. When the sun hits these materials, electrons start to flow, creating a direct current (DC). This is the photovoltaic effect. This is described in more detail below.
- Solar thermal: This is a broad term for systems that use energy from the sun to heat water (or other material) for a variety of purposes. One common application is heating water for domestic hot water or swimming pools.
- Concentrated solar: There are a variety of ways to concentrate solar power for use. All of them gather solar energy over a wide area (usually by using mirrors) and concentrating it into a smaller location. This very high level of power is then often used to generate electricity. The DOE has a good explanation of some technologies here [2].
- Passive solar: Passive solar is a type of solar thermal that uses passive system design (e.g. south-facing windows, strategically-placed overhangs) to passively heat interiors of buildings. This is a great low-tech way to use solar energy! (Click here for more information about passive solar from the DOE.) [3]
Solar Photovoltaics and Availability of Solar
The rest of the solar lesson will focus on solar photovoltaics or solar PV. As noted above, photovoltaic technology (aka the photovoltaic effect) converts radiant solar energy into electricity. View the short video below from the U.S. Department of Energy for a brief explanation. Note that the narrator of the video indicates that photons provide the energy that is converted into electricity. NASA describes [4] the relationship between photons and electromagnetic energy thusly: "Electromagnetic radiation can be described in terms of a stream of mass-less particles, called photons [5], each traveling in a wave-like pattern at the speed of light [6]." So photons are generally considered to be what carries the energy that is emitted in waves.
All right, we all know that the sun's energy creates heat in light, but it can also be converted to make electricity, and lots of it. One technology is called solar photovoltaics or PV for short. You've probably seen PV panels around for years, but recent advancements have greatly improved their efficiency and electrical output. Enough energy from the sun hits the earth every hour to power the planet for an entire year. Here's how it works.
You see, sunlight is made up of tiny packets of energy called photons. These photons radiate out from the Sun and about 93 million miles later, they collide with a semiconductor on a solar panel here on earth. It all happens at the speed of light. Take a closer look and you can see the panel is made up of several individual cells, each with a positive and a negative layer, which create an electric field. It works something like a battery, so the photons strike the cell and their energy frees some electrons in the semiconductor material. The electrons create an electric current which is harnessed by wires connected to the positive and negative sides of the cell. The electricity created is multiplied by the number of cells in each panel and the number of panels in each solar array. Combined, a solar array can make a lot of electricity for your home or business. this rooftop solar array powers this home, and the array on top of this warehouse creates enough electricity for about a thousand homes.
Okay, there are some obvious advantages to solar PV technology. It produces clean energy. It has no emissions, no moving parts, it doesn't make any noise, and it doesn't need water or fossil fuels to produce power. And it can be located right where the power is needed, in the middle of nowhere, or it can be tied into the power grid. Solar PV is growing fast and it can play a big role in America's clean energy economy anywhere the sun shines.
Okay, so a solar panel converts radiant to electrical energy by using the unique properties of a semiconductor, usually, silicon combined (doped) with other elements (usually boron and phosphorous). But how much energy and power does a panel generate? As you might guess, it depends on a lot of factors. The following is an overview of some of these factors.
- First, a quick primer on power vs. energy.
- Energy is the ability to do work. It is a discrete amount of "something," and that "something" makes things happen (makes things move, generates sound, generates heat, etc.). If one thing has more energy than another thing, then it is hypothetically capable of doing more "stuff." In the U.S., energy is usually measured in Btus, or if it's electrical energy, kilowatt hours (kWh). One kWh is 1,000 Wh, which is also a unit of energy. The international unit of energy is the Joule (J). Since there are 1,000 Wh in one kWh, to convert Wh to kWh you must divide by 1,000. To convert kWh to Wh, you multiply by 1,000.
- Power is the rate at which energy is converted. Practically speaking, it indicates how quickly you are "using" energy or the rate at which energy is being provided. Power is usually measured in watts (W) or horsepower (HP). A light bulb that uses 100 W of power is converting 100 Joules of electricity into heat and light each second. A 200 W light bulb is converting energy twice as quickly. A 1,000,000 W power plant (1 MW) is providing energy twice as quickly as a 500,000 W (500 kW) power plant. (Note that the light bulbs and power plants are all just converting one form to another, but from our perspective, one is "using" energy and one is "generating" energy. It's a matter of perspective.)
- Energy = power x time. For example:
- If you use a 100 W light bulb for 1 hour, you use (100 W x 1 h = ) 100 Wh.
- If you use a 100 W light bulb for 1 hour each day for a year, you use (100 W x 1 hr/day x 365 days/yr = ) 36,500 Wh = 36.5 kWh.
- If you use 10 light bulbs, each 100 W, for 1 hour you use (10 bulbs x 100 W/bulb x 1 hr = ) 1,000 Wh or 1 kWh.
- If a 5,000 W (5 kW) solar array operates at full capacity for 1 hr, it generates (5,000 W x 1 hr = ) 5,000 Wh or 5 kWh of electricity. This is the energy that is generated by the panels, but some of that energy will be lost by the time it is used.
- If a 1,000,000,000 W (1 GW) power plant operates at full capacity for 24 hours, it would generate (1 GW x 24 hr = ) 24 GWh of electricity.
- If a furnace with a 100,000 Btu/hr output operates at full capacity for 2 hours, it would use (100,000 Btu/hr x 2 hr = ) 200,000 Btu of energy.
- Irradiance is the amount of solar power (not energy) incident on a given surface area at any given time. This is usually measured in Watts per square meter (W/m2). All else being equal, more irradiance results in more output from a panel. Irradiance levels change throughout the day, as you can see in the image below. These charts illustrate the average hourly irradiance in State College, PA in July and December. As you can see, the peak irradiance in July averages about 750 W/m2. This is the irradiance on a horizontal surface. If you could tilt the surface (say, a solar panel) so it is perpendicular to the sun, the noon irradiance would be more than 1,000 W/m2. So if you want to imagine 1,000 W/m2, think of how your skin feels on a really hot summer day at Penn State. Hopefully, this gives you a "feel" for irradiance.

- Irradiation is the amount of solar energy that hits a surface over a given period of time. This is usually measured in kWh/day/m2 or kWh/yr/m2. See the chart below for a map of irradiation in the U.S., which illustrates the average daily irradiation levels throughout the year in the U.S. Of course the irradiation will change throughout the year (more in the summer and less in the winter), but this chart provides a clear idea of the overall amount of solar energy that is available all year. (Note that you could easily find the average annual irradiation by multiplying the daily irradiation by 365.) Keep in mind that this is the average daily irradiation on a surface that is "latitude tilt," which will be explained in more detail below. The chart provides an indication of solar potential. (Note that due to panel inefficiency and a few other factors, a solar panel will only convert a fraction of this solar energy into electricity.)

Solar PV
We will experience some solar PV installations and technology while traveling, so I provide some more details about it below.
- In order to maximize panel output, the panel should be as close to perpendicular to the sun's rays as possible, which allows it to capture the most solar energy possible at a given time. (Here is a really good interactive animation [10] of why a perpendicular panel captures the most sunlight.) Most solar panels are fixed, i.e., they don't move. This means that you need to choose your location carefully. For fixed panels, there are two factors to consider in this regard:
- Azimuth/orientation is the compass direction that the panel faces. Typically, 0º is due north, 90º is east, 180º is south, and 270º is west.
- Tilt is the angle above the horizon to which the panel is tilted.
- Shading is a very important consideration as well. All else being equal, more shading means less output.
- In the Northern Hemisphere, the rule of thumb to maximize the output of a fixed panel is that the panel should be faced due south (180º orientation) and at "latitude tilt." You may recall from a Geography class that latitude is how far north or south a location is from the equator. The equator is 0º, the tropics are at 23.5º, and the North and South Poles are at 90º north and south, respectively.
- For example, State College, PA is at just over 40º north, so the ideal array tilt is about 40º, and the ideal azimuth is 180º (south).
- Anchorage, Alaska is at about 61º north, so the ideal tilt and azimuth are about 61º and 180º (south), respectively.
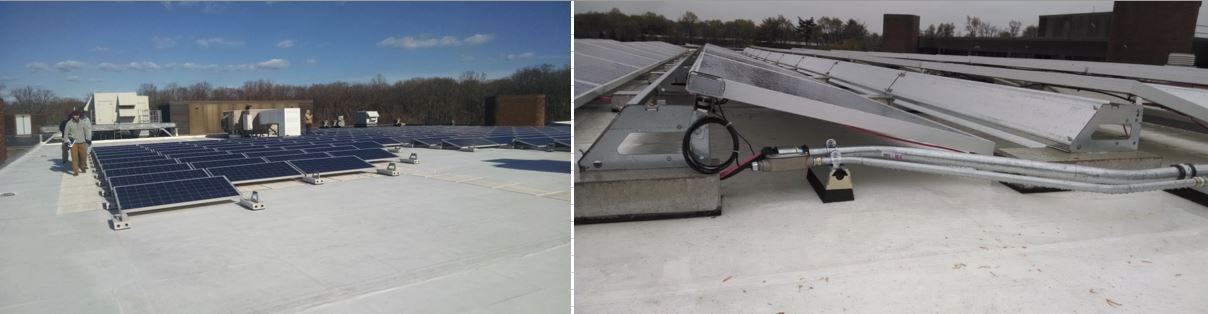
A few more terms that are important to know:
- A solar cell is the smallest current-generating part of an array. They can be any size but are normally around 6 inches by 6 inches. It's difficult to see, but in the image above there are 72 cells in each panel (12 rows, each with 6 cells).
- A solar panel (aka module) is a number of cells wired together in a single panel. They can be any size but are usually about 5 feet by 3.25 feet [11].
- A solar array is a number of panels wired together. The image above shows part of a solar array, which as I noted has 270 total panels.
- Capacity refers to the rated maximum output of a panel or array. Under optimal conditions, a 250 W panel will output about 250 W of electricity. Note that this is only the immediate output. By the time the electricity goes to the building or the grid, some of it is lost due to a variety of factors (usually 10% - 15%).
- The array above has 270 panels, and each panel has a capacity of 305 W. Thus, the capacity of the array is (305 W x 270 = ) 82,350 W, which is 82.35 kW.
- A solar panel outputs DC (direct current) electricity. DC means that the electricity flows in one direction. Household outlets (and the electric grid) use AC (alternating current) electricity, which rapidly alternates direction of flow (60 times per second in the U.S., in case you are interested), so electricity from an array must be converted to AC if it is to be used in a building or distributed to the grid. An inverter is a piece of equipment that converts DC to AC and is a standard part of most solar arrays.
- A grid-tied array is one that is connected to the grid. A standalone or off-grid system is not tied to the grid.
The Impact of Tilt and Orientation
Recall that the rule of thumb is that the optimal tilt is "latitude tilt," and the ideal orientation in the Northern Hemisphere is due south (180º). This begs the question: what happens if the tilt and orientation are not optimal? The answer, as you might guess, is "it depends." This impact can be quantified by something that is called tilt and orientation factor (TOF). The tilt and orientation factor is a decimal that indicates what percent of the maximum solar output you would receive throughout the year at said tilt and orientation. So if you install an array and it has a TOF of 0.85, that means that it will only be able to output about 85% of the energy it would output if it were at the ideal tilt and orientation.
Wilmington, Delaware is at about 40º north. As it turns out, the ideal tilt is closer to 35º (rules of thumb are only rules of thumb, after all!). The tables below show the TOF at different tilts and azimuths. The first table illustrates the TOFs of different tilts, all with an orientation of 180º. The second table shows the TOFs at different azimuths, all at a tilt of 35º (the ideal tilt).
| Tilt (º) | Azimuth (º) | TOF |
|---|---|---|
| 0 | 180 | 0.87 |
| 5 | 180 | 0.905 |
| 10 | 180 | 0.935 |
| 15 | 180 | 0.959 |
| 20 | 180 | 0.978 |
| 25 | 180 | 0.991 |
| 30 | 180 | 0.999 |
| 35 | 180 | 1.0 |
| 40 | 180 | 0.996 |
| 45 | 180 | 0.985 |
| 50 | 180 | 0.969 |
| 55 | 180 | 0.947 |
| 60 | 180 | 0.92 |
| 65 | 180 | 0.888 |
| 70 | 180 | 0.851 |
| 75 | 180 | 0.81 |
| 80 | 180 | 0.764 |
| 85 | 180 | 0.715 |
| 90 | 180 | 0.662 |
| Tilt (º) | Azimuth (º) | TOF |
|---|---|---|
| 35 | 90 | 0.797 |
| 35 | 100 | 0.833 |
| 35 | 110 | 0.897 |
| 35 | 120 | 0.898 |
| 35 | 130 | 0.926 |
| 35 | 140 | 0.951 |
| 35 | 150 | 0.972 |
| 35 | 160 | 0.986 |
| 35 | 170 | 0.996 |
| 35 | 180 | 1.0 |
| 35 | 190 | 0.997 |
| 35 | 200 | 0.989 |
| 35 | 210 | 0.976 |
| 35 | 220 | 0.956 |
| 35 | 230 | 0.932 |
| 35 | 240 | 0.905 |
| 35 | 250 | 0.874 |
| 35 | 260 | 0.839 |
| 35 | 270 | 0.803 |
Calculating Solar Output
Okay, now we're ready to calculate the solar output. There are a number of software programs and a formula or two that can do this, but the National Renewable Energy Laboratory (NREL) provides a free one that is well-regarded in the energy industry called PVWatts [12]. In the video below, I demonstrate how to calculate the annual output of the array in the images above, which has the following specs:
- address: 400 Stanton Christiana Rd, Newark, DE
- 82.35 kW capacity
- 13º tilt
- 222º azimuth
Alright so, I'm going to demonstrate how to use the PVWatts Software from NREL. So, here is the home page. You can Google PVWatts and this will come up. And so, first thing you do is you type in the address. So this is based on the array that's detailed on the course website. So my address here is 400 Stanton Christiana Road in Newark. Ok, so you just click enter. And click go. And so, it used to be that it would come up with a map here, but they changed some things about this. So what it does, it just tells you the latitude and longitude of where you are. And so, I just happen to know that this is the right latitude and longitude, so I'm going to click to go to system info here. Ok, and here is where I can enter the specifics of the system. So, you can see the first window here is the DC system size, so this is the capacity. So mine is a 82.35 kW, you notice this is in kW, so be very careful about that. The module type, you have a couple different kinds. This is standard module. The fixed open rack is fixed meaning it's not, it doesn't move so there's no tracking. I mean you could do one to two-axis tracking here. The system losses, this shows you the overall losses from the rated capacity. So, I'm going to click on this loss calculator just to show you some of the variables here.
So this comes up, you can see that here. So right now the estimated system losses are 14%. And you can see that these are the actual, the individual factors in those losses. So soiling meaning you know, dust and stuff that gets on the panel. Shading, so it's assuming there's some shading part of the time. In this case, 3% of the time. You know, is there snow? Is there panel mismatches? Panels have small imperfections so they might have slightly different voltages. So there's wiring losses anytime you run electricity through a wire. There's heat losses. Connections to this is just sort the you know, the connections between the modules and other components. There's some degradation that occurs through panels getting warm, and it's also they just degrade a little bit over time. This name-plate rating there's slight imperfections, you know, the panels are usually guaranteed to be, have this capacity within a certain percentage. And then if they're older, you would actually, panels degrade over time. And the availability just means sometimes the system goes down for repairs or whatever, ok? And so you can actually change this. So like if I said this is in a perfect location without any shading at all I could put zero in here and you notice this drops to 11%. So we'll just go with our standard 14% and then you can click save. Ok? So that's where all the system losses come from. Now you can enter in your total. In this case, I have 13 degrees. Your azimuth, remember, is your also the same as your orientation. This one happens to be 222 degrees.
Ok, so now, you can also add some cost considerations. There's some other parameters you can feel free to mess around with those. In this case, this is actually commercial and I'm just going to, I happen to know our utility rate at our school. It's about 8 cents a kilowatt hour. Ok. Good, good, good.
Now you could also draw the system. Actually, you can't anymore. You used to be able to draw your system on a rooftop using Google Maps, but you can't do that.
Ok, so now we click to go to the results. And, here you go. So based on the system specs that I put in there, I'm going to generate about 106,000 kWh per year. Keep in mind that, you know, it says 106,365. This, you know, you should take this as a round number. You could have a really good solar year. There's a bunch of extra, you know, energy generated. You could have a bad year the system could go down a lot. There's I don't know a bunch of extra moisture and dust in the air, whatever. So this is just a really good estimate. Ok. Yeah, see it even gives you the range here. Based on this location, 101 to 110 kWh per year. So this actually gives you the month to month break down. Ok. So here's your actual output in AC. Remember panels produce DC, so this is AC output. And this is based on the cost information that I put into the specs on the previous sheet. So it's saying that, you know, I would earn about, or save about 8500 dollars a year with this system. Now what's really cool about this, is you can actually download these results. So, you can download this exact information but in spreadsheet form. And you can even download the hourly results which is really cool. I mean you get this Excel spreadsheet with 8,760 rows in it. It tells you the estimated output under normal typical meteorological conditions throughout an average year. So that's pretty cool. And then you can use, you know, make charts and so forth in Excel. Ok, so that's a basic tutorial on how to use PVWatts.

A Few More Notes
Hopefully, by now you have a relatively good grasp on some of the considerations that go into designing and calculating the output of solar PV. Solar PV really took off in the early- to mid-2000s, led by residential array installations, which generally had capacities of a few kW. The solar industry in the U.S. is now dominated by utility-scale solar, which is much cheaper per W to construct because of economies of scale. Utility-scale arrays can be thousands of watts (multiple MWs) in capacity!
There are a few ways that people can use and pay for solar PV:
- Systems can be purchased and owned by individuals. This can be done out-of-pocket or using loans. Out-of-pocket purchases usually generate the highest return.
- Power purchase agreements allow people or businesses to pay a third party to build an installation on their own roof. The individual or business then pays the third party for the electricity generated at a contractually agreed-upon rate. This is the model that SolarCity (now Tesla Energy) used to rise to prominence. This is a popular model because it requires no up-front cost (among other reasons).
- Community-owned solar or just community solar is used increasingly in the U.S. and elsewhere. Community solar allows individuals to "buy into" a solar array that is installed somewhere else, or perhaps on a shared roof or field space. This provides access to individuals and businesses that would not otherwise be able to use solar due to factors such as not having a suitable site (e.g., a heavily shaded roof) or living in rented space. (The SEIA provides a good overview of community solar here [13], and NREL provides a more robust explanation here [14].)
- Most utility-scale installations effectively act as power plants, and the electricity is sold to the grid.
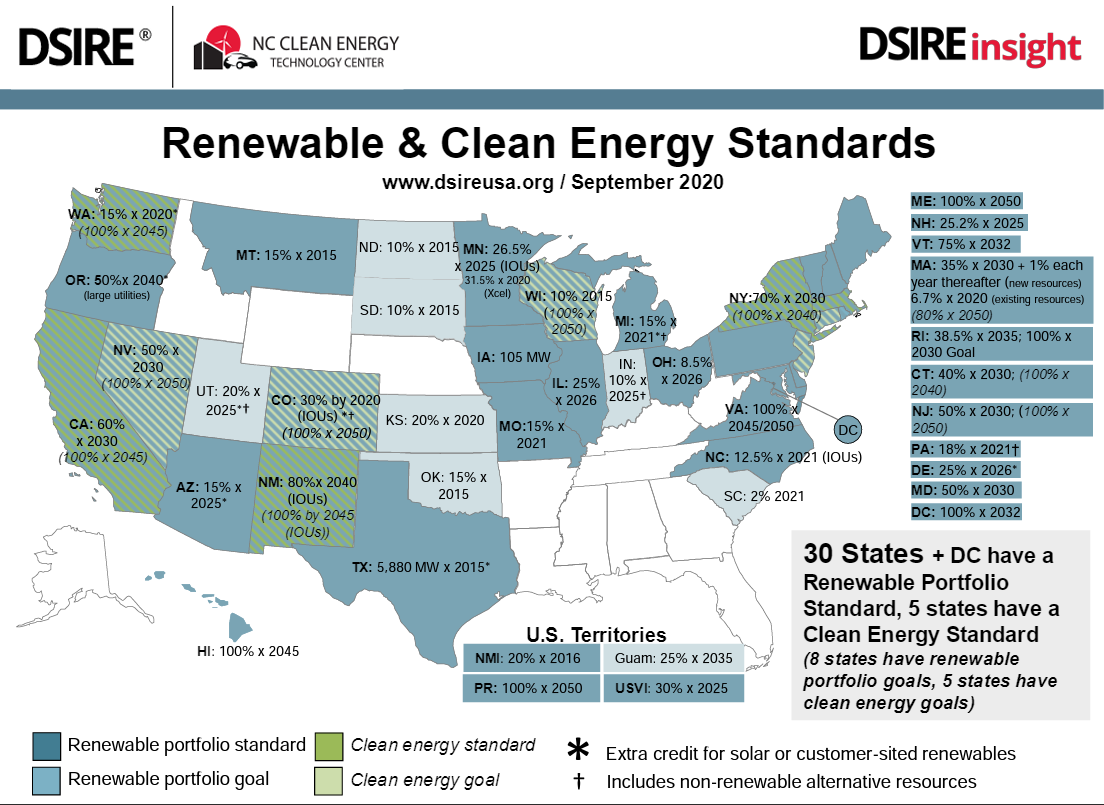
Incentives
Incentives have played a very important role in the growth of the solar industry, and renewable energy in general. The following provides a description of some incentives.
States and countries have implemented a variety of policies meant to incentivize or encourage private investment in clean, renewable energies. The most common of these policies are tax credits, grants/rebates, and performance-based incentives (PBI), including feed-in tariffs (FIT) and renewable portfolio standards (RPS).
A tax credit is just that, a credit. When an individual or business investor earns a tax credit it means that the amount of the credit will be subtracted from a future tax bill. For example, in the United States, we have a Federal Residential Renewable Energy Tax Credit [15] available to the residential (not commercial or industrial) sector which provides a tax credit covering 26% of the cost of an installation. A typical residential system costs about $3/Watt to install. If you put a 7 kW photovoltaic system on your roof, it should cost around $21,000 before incentives (7,000 W x $3/W). If so, you would earn a $5,460 tax credit. The government doesn’t mail you a check for this amount. It means you get to deduct that amount from your next tax payment. To realize this money, you will need to have paid at least $5,460 in taxes, but excess credits can "generally" be carried over to future tax years. Note that even if you were owed a refund, this tax credit can be used to increase your refund, as long as you paid at least $5,460 in federal income tax throughout the year. Other renewable energy technologies qualify for this credit. See the link above for details.
A rebate means that a government agency or other group (sometimes utility companies) will refund some of the investment. These are usually based on the size/capacity of the system. For example, Pennsylvania used to provide a solar rebate program that provided rebates to investors of $1.75/Watt. Rebates are checks mailed directly to the investor (or their designate). Many states still have such programs such this solar PV rebate program in Oregon [16](description from DSIRE of course!). Different states often have different program specifics. See DSIRE for more examples of programs. Specifics vary within states as well. The program in Oregon, for example, has different rebate levels for different utilities and for different sectors (residential, agricultural, industrial, non-profit, government). For example, if you are a residential customer of the PGE utility in Oregon, you would receive $0.25/W up to $1,750. So for a 7 kW system you would recieve a $1,750 (7,000 W x $0.25/W) rebate.
Performance-based incentives (PBIs), also known as production incentives, provide cash payments based on the actual output of the system. For wind and solar electric, this is the number of kilowatt-hours (kWh) generated. This is usually only applied to utility-scale systems.
Rnewable portfolio standard (RPS) are very imnportant policies. Breifly, an RPS requires utilities to use renewable energy credits (RECs) to account for a certain percentage of their retail electricity sales. (RPSs are established by state legislatures, and not all states have an RPS policy.) A REC is earned by a qualified grid-tied facility for every 1,000 kWh (i.e., 1 MWh) of electricity that is generated using a renewable energy resource. The RECs are then bought and sold through a market. The settlement price varies depending on REC supply and demand at any point in time, though special auctions with guaranteed pricing and incentives are sometimes used. If you live in a state that has an RPS policy, you can "sell" your credits on an annual basis and receive a payment. For example, if you generate 7,000 kWh in a years and you can sell your credits for $40/MWh, you would earn $280 (7,000 kWh = 7 MWh x $40/MWh). You would receiv a check for this at the end of the year. See below for states that have RPS policies.
Another type of production-based incentive, a feed-in-tariff (FIT) pays grid-tied renewable energy generators a specified price for the electricity they generate and guarantees them this price for a specified amount of time. This type of policy is widely used in Europe, most notably in Germany, but less so in the USA. This is also usually used on utility-scale systems.
Anaerobic Digestion
You may recall from EM SC 240N that bioenergy is energy that comes from living or recently living things. Common examples include wood from trees used for heating and ethanol from corn used as a gasoline additive. Another form - and one that we will see while traveling - is called anaerobic digestion. "Anaerobic" refers to "without air" and the "digestion" part refers to the microorganisms that digest organic material. Putting it together, anaerobic digestion refers to microorganisms breaking down organic material when no oxygen is present. The following descriptions of anaerobic digestion are from the EPA's Anaerobic Digestion website. All points of emphasis (bold letters) are mine:
Anaerobic Digestion
Anaerobic digestion is the natural process in which microorganisms break down organic materials. In this instance, “organic” means coming from or made of plants or animals. Anaerobic digestion happens in closed spaces where there is no air (or oxygen). The initials “AD” may refer to the process of anaerobic digestion or the built system where anaerobic digestion takes place, also known as a digester.
The following materials are generally considered “organic.” These materials can be processed in a digester:
- Animal manures;
- Food scraps;
- Fats, oils, and greases;
- Industrial organic residuals; and
- Sewage sludge (biosolids).
All anaerobic digestion systems adhere to the same basic principles whether the feedstock is food waste, animal manures or wastewater sludge. The systems may have some differences in design but the process is basically the same
Byproducts of Anaerobic Digestion
Biogas is generated during anaerobic digestion when microorganisms break down (eat) organic materials in the absence of air (or oxygen). Biogas is mostly methane (CH4) and carbon dioxide (CO2), with very small amounts of water vapor and other gases. The carbon dioxide and other gases can be removed, leaving only the methane. Methane is the primary component of natural gas.
The material that is left after anaerobic digestion happens is called “digestate.” Digestate is a wet mixture that is usually separated into a solid and a liquid. Digestate is rich in nutrients and can be used as fertilizer for crops
Uses of Anaerobic Digestion Byproducts
Biogas is produced throughout the anaerobic digestion process. Biogas is a renewable energy source that can be used in a variety of ways. Communities and businesses across the country use biogas to:
- Power engines, produce mechanical power, heat and/or electricity (including combined heat and power systems);
- Fuel boilers and furnaces, heating digesters and other spaces;
- Run alternative-fuel vehicles; and
- Supply homes and business through the natural gas pipeline
How biogas is used and how efficiently it’s used depends on its quality. Biogas is often cleaned to remove carbon dioxide, water vapor and other trace contaminants. Removing these compounds from biogas increases the energy value of the biogas...Biogas treated to meet pipeline quality standards can be distributed through the natural gas pipeline and used in homes and businesses. Biogas can also be cleaned and upgraded to produce compressed natural gas (CNG) or liquefied natural gas (LNG). CNG and LNG can be used to fuel cars and trucks.
Digestate is the material that is left over following the anaerobic digestion process. Digestate can be made into products like:
- Bedding for livestock;
- Flower pots;
- Soil amendments; and
- Fertilizers.
When properly processed, dewatered digestate can be used as livestock bedding or to produce products like flower pots.
Digestate can be directly land applied and incorporated into soils to improve soil characteristics and facilitate plant growth. Digestate can also be further processed into products that are bagged and sold in stores. Some emerging technologies can be employed post-digestion to recover the nitrogen and phosphorus in digestate and create concentrated nutrient products, such as struvite (magnesium-ammonium-phosphate) and ammonium sulfate fertilizers.
The video below from Michigan State University does a great job of explaining how they use anaerobic digestion to convert organic cafeteria and farm waste into useful energy and fertilizer. To view the transcript (and the video on YouTube, click this link [19].)
The South Campus anaerobic digester at Michigan State University aims to reduce odor and emissions from manure, food waste and biosolids, create a closed cycle for recycling organic material, and generate renewable energy. The digester will use a mix of dairy manure, dining hall food waste, biosolids (which are nutrient-rich organic materials), and other organic material from campus in the greater Lansing area. Once delivered, the food waste and biosolids will be treated (heated and pasteurized) at 160 degrees Fahrenheit for one hour to eliminate any potential pathogens. The material will then be mixed with manure from the MSU Dairy Teaching and Research Center and pumped into the digester.
The anaerobic digester is a sealed, airtight tank, which can hold 300,000 gallons. Organic material will be heated to 100 degrees Fahrenheit and will remain in the digester for 20 to 30 days. Inside the tank, mixers in the digester evenly distribute microorganisms. These microorganisms break down the mixture, producing biogas and nutrient-rich digestate. Biogas, which is roughly 60% methane, is a form of renewable energy which will be used to generate electricity. The system will generate enough electricity to offset the MSU DTRC, around 300 kilowatts per hour, with enough left over to help power MSU. The capturing and use of biogas will generate energy, shrink the carbon footprint of campus, and improve sustainability. What's left in the process is digestate, the nutrient-rich mixture that will be held in the final, storage tank until it can be utilized. Mixers in the storage tank will minimize settling for the potential 2.7 million gallons of digestate. Any unused biogas can also be stored in the sealed headspace. The nutrient-rich digestate will be used to fertilize croplands or other biological treatment processes to fuel research opportunities.
By utilizing anaerobic digestion technology, the organic materials from MSU will become resources. Renewable energy is created, while odors are reduced and emissions are eliminated. This project is one example of how Michigan State University is actively working to improve sustainability.
Thermodynamically speaking, the energy conversion process is:
- Sunlight is converted to biomass by plants.
- Plants are either used in the digester and converted to methane and CO2 or...
- Biomass is eaten by animals and converted to another form of biomass.
- Organic waste from animals is used in the digester and converted to methane and CO2.
- The methane can then be used for electricity and/or heat.
It is extremely important to keep in mind that this is a natural process, and thus will occur any time organic material is subjected to low- or no-oxygen conditions. One important implication of this is that organic material that ends up buried in a landfill will convert partially to methane because there is very little oxygen underneath all of that "junk." As I'm sure you recall, methane is about 30 times more potent than CO2 in terms of its global warming impact. If you took the same organic material and let it biodegrade in the open air (i.e., with access to oxygen) it would release mostly CO2. The sad irony of this is that well-meaning people and companies can actually make the (climate change) problem worse if their biodegradable containers end up in the landfill. This methane can be captured, and in many places in the U.S. and throughout the world is. This is also why impoundment hydroelectric facilities (big dams) can cause methane emissions - organic material collects upstream of the dam, and low-oxygen conditions often occur near the bottom of the reservoirs, causing methane to be released. Systems thinking, everyone!
Anaerobic Digestion Examples
Digesters can be pretty much any size. I've seen one as small as a car inner tube that was used to power a gas grill and heat a small greenhouse. Some of them can be larger, as you'll see below.
The pictures below are from a cooperatively-owned anaerobic digester in Lemvig, Denmark. I'm particularly fond of this because the entire setup is owned equally by about 25 farmers, and is a non-profit operation. All of the organic waste from the farms is transported to the digester, including leftover vegetation and various types of manure. The biogas is used to generate electricity in a turbine which is either sold to the grid or used in the digester, and the "waste" heat is used to run the anaerobic digester. The remaining heat is used for district heating for the town - it heats up water, which is then run through underground pipes to be used to heat homes. This type of generator is considered cogeneration, which means it is used to generate electricity and useful heat. Recall that most power plants are about 35% efficient because so much energy is wasted as heat. Believe it or not, this cogeneration system is over 90% efficient when you include all of the "waste" heat that is captured and used! All digestate is then returned to the local farms and used as organic fertilizers. It is truly a closed-loop system!
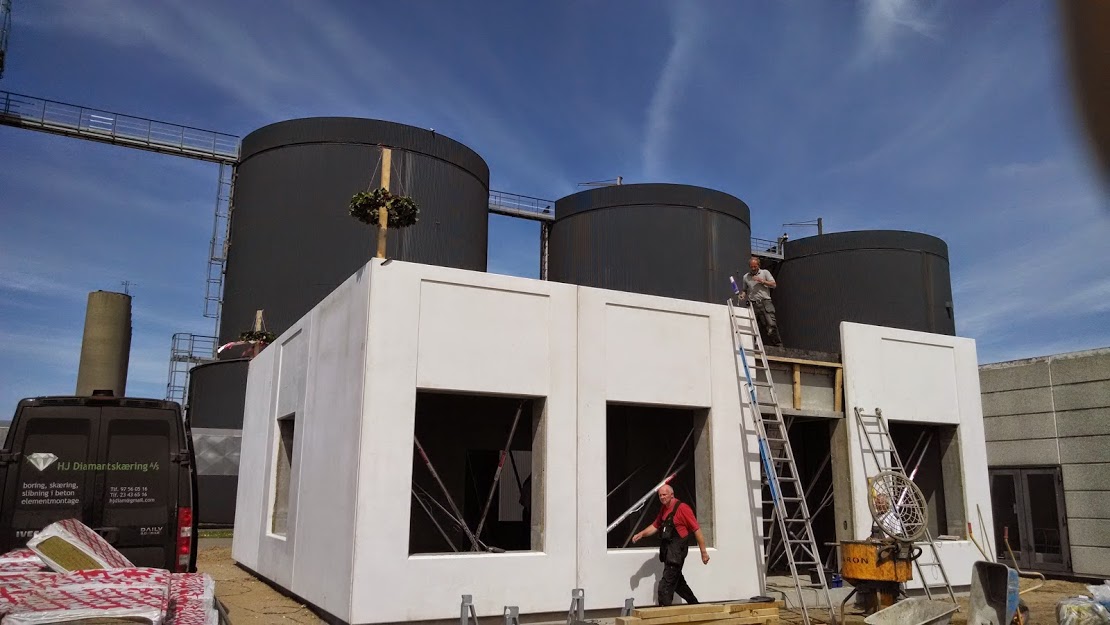
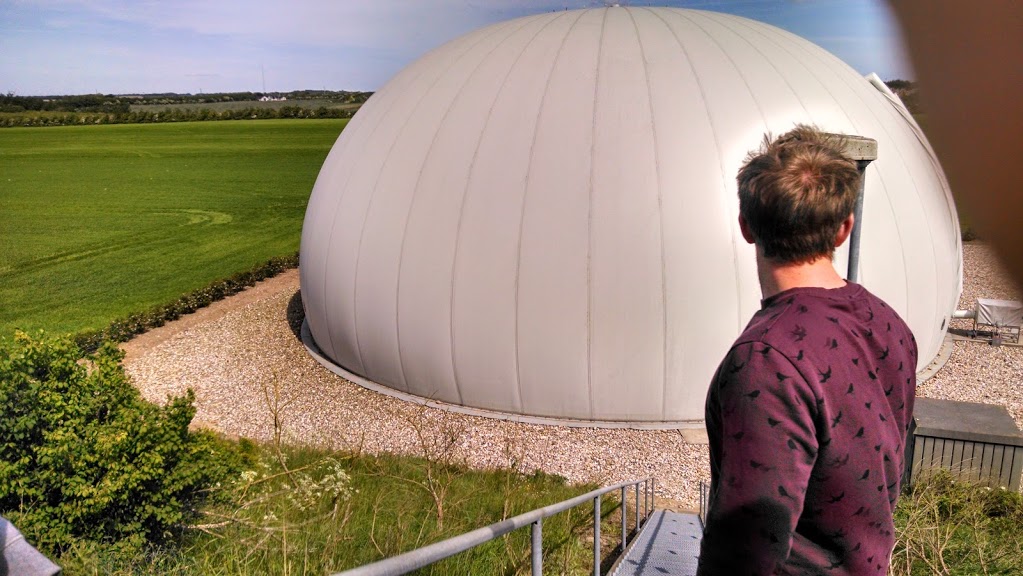
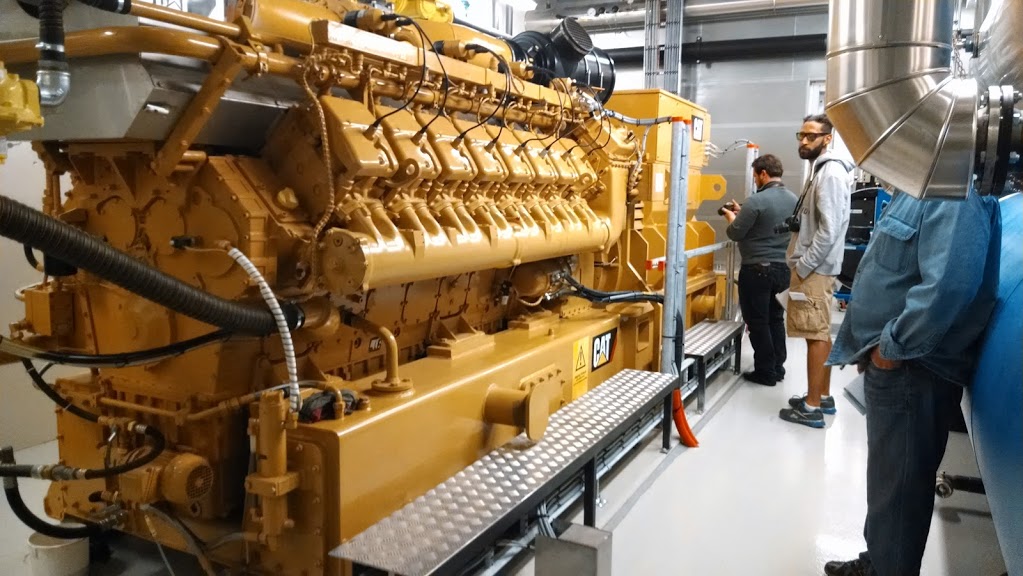
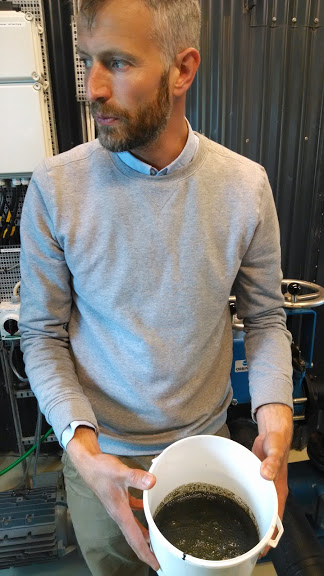
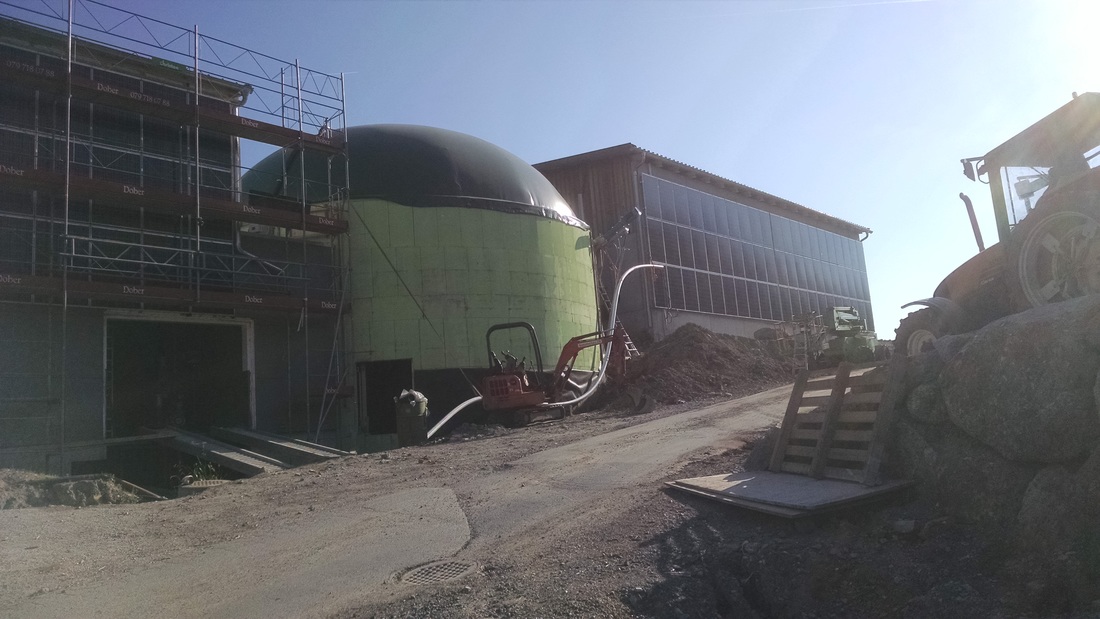
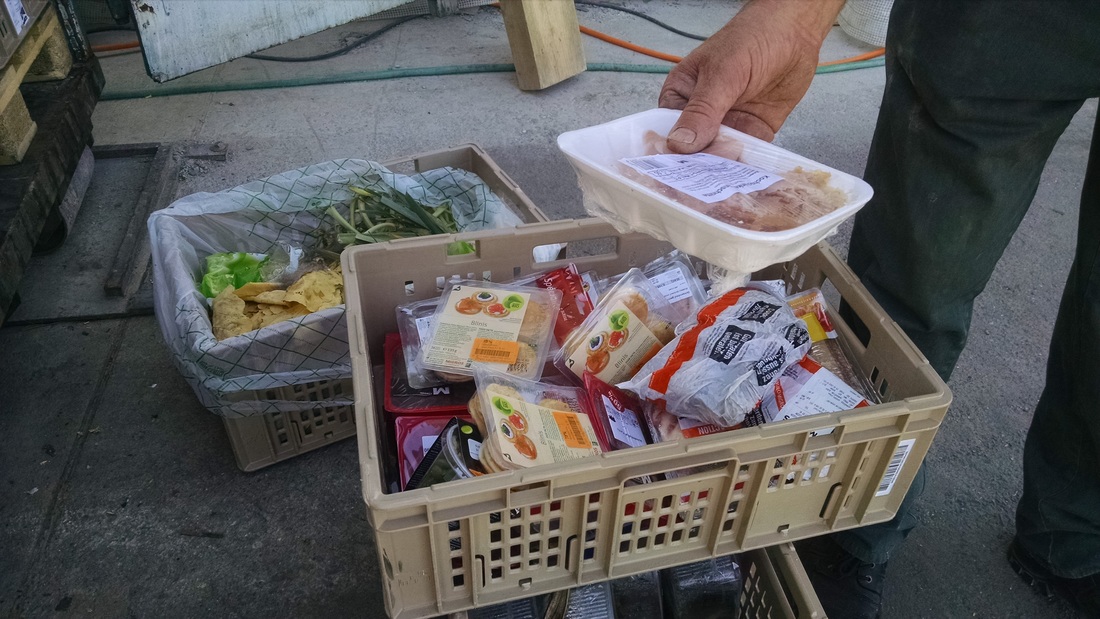
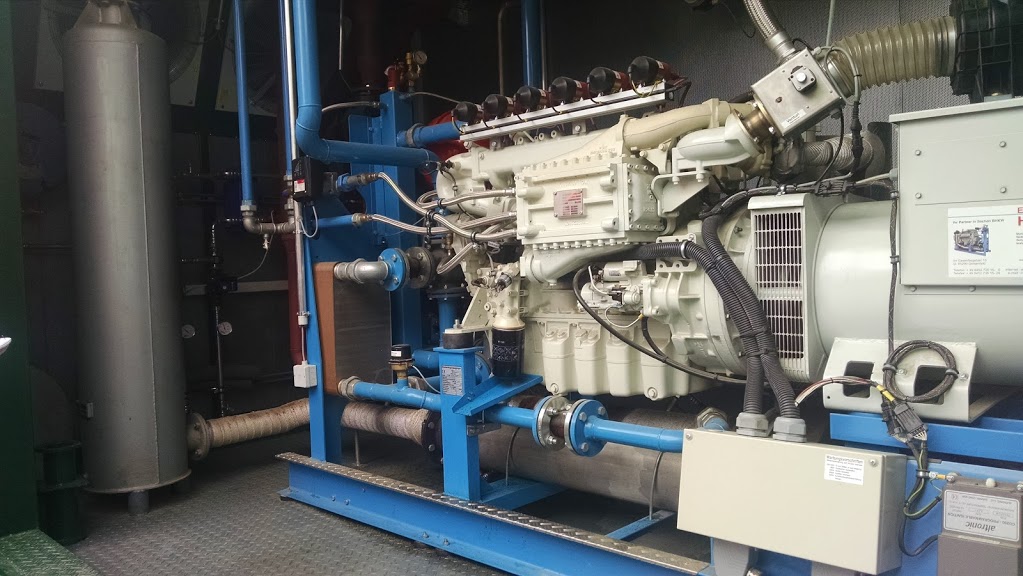
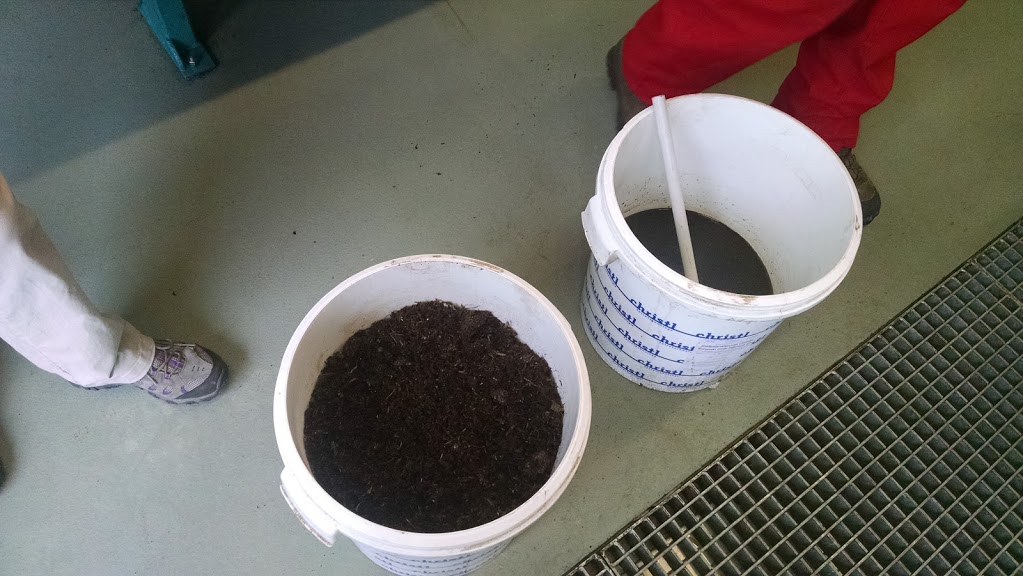
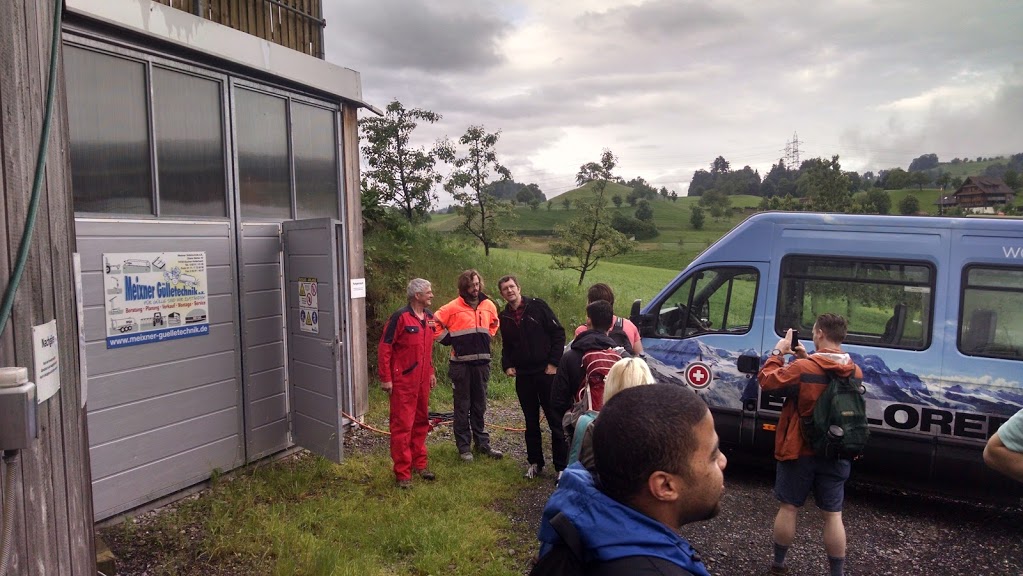
The images below show details of a smaller installation in Kussnacht, Switzerland. This installation is run by a single farmer (Seppi), who collects organic waste from his farm, other local farms, and area restaurants. Like the one above, Seppi collects the biogas and uses it in a cogeneration system that is about 90% efficient (50% heat, 40% electricity, and 10% is wasted). He runs a 100 kW generator and uses the electricity on his farm and sells the leftover to the grid. The heat is used to run the digester, and to provide space and water heating to his farm. He uses some digestate on his farm and gives the rest back to local farmers for free.
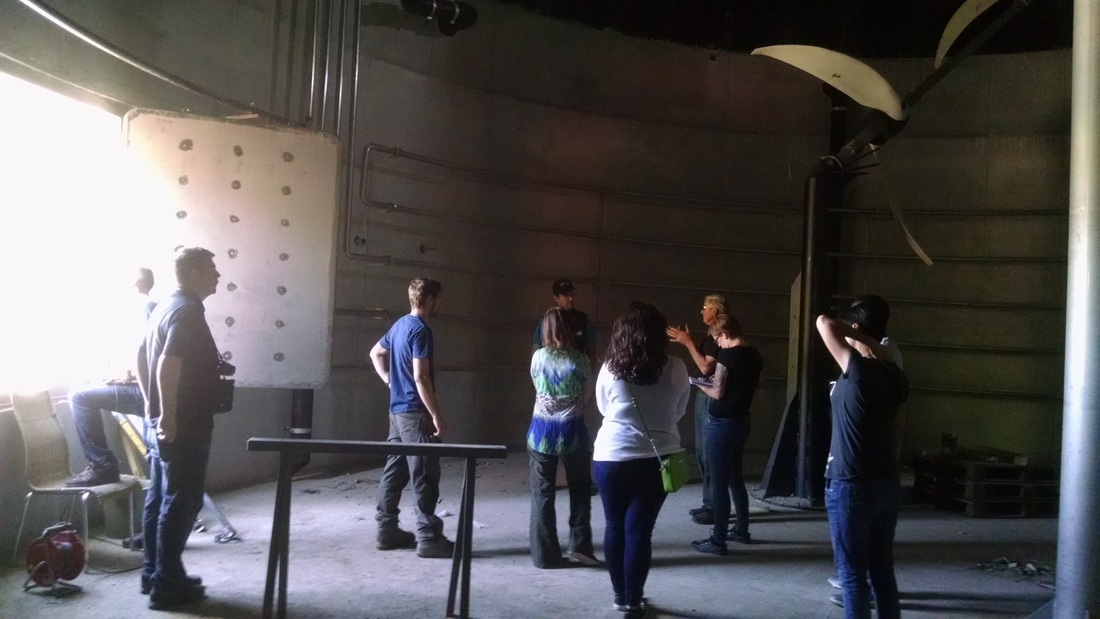
It just so happened that at the time of our visit (I brought students there for a study abroad experience), his previous digester had burnt down due to a generator fire. The upshot of this is that we were able to see inside the digester he was building, which you will see below.
Summary and Final Tasks
Summary
By now you should be able to:
- identify different types of solar technologies;
- explain the basic process by which solar panels generate electricity;
- explain the difference between irradiance and irradiation;
- calculate energy use/generation given power and time;
- evaluate the impact of tilt and orientation on solar PV output;
- calculate the output of a solar array;
- explain how anaerobic digestion converts organic material to biogas; and
- identify some of the benefits of anaerobic digestion.
Reminder - Complete all of the Lesson 1 tasks!
You have reached the end of the lesson! Double-check the to-do list on the Lesson Overview page [20] to make sure you have completed all of the activities listed there before you begin the next lesson..
Lesson 2: Wind and Microhydro
Overview
In this lesson, we'll go over some of the basics of wind and microhydroelectric energy, including how to do some basic output calculations.
Learning Outcomes
By the end of this lesson, you should be able to:
- analyze wind energy maps;
- identify components of wind turbines;
- describe how solar energy is converted to wind and hydropower;
- calculate the output of a wind turbine;
- identify components of microhydro systems; and
- calculate the output of a microhydro system.
Lesson Roadmap
| To Read | Lesson 2 Online Content | You're here! |
|---|---|---|
| To Do |
|
|
Questions?
If you have any general course questions, please post them to our HAVE A QUESTION discussion forum located under the Discussions tab in Canvas. I will check that discussion forum regularly to respond as appropriate. While you are there, feel free to post your own responses and comments if you are able to help out a classmate. If you have a question but would like to remain anonymous to the other students, email me through Canvas.
If you have something related to the material that you'd like to share, feel free to post to the Coffee Shop forum, also under the Discussions tab in Canvas.
Wind Energy
As you may recall, the wind is caused by differential solar heating across the surface of the earth (as well as the shape of the earth), which causes large- and small-scale high and low-pressure systems to form. Air moves from areas of higher pressure to areas of lower pressure, which is what causes wind to occur. (If you are interested, this National Geographic site [21] explains some of the finer points of this process, including a lot of pictures.)
Wind, then, is just air that is moving. Simply put, this air has kinetic energy because wind has mass and is moving. (Anything in motion with mass has kinetic energy.) Because of the First Law of Thermodynamics, the energy in the wind must come from somewhere else. This "somewhere else," is solar energy. This energy (and power) can be quantified. See later in this lesson for an explanation of how to calculate this.
Wind Resources in the U.S.
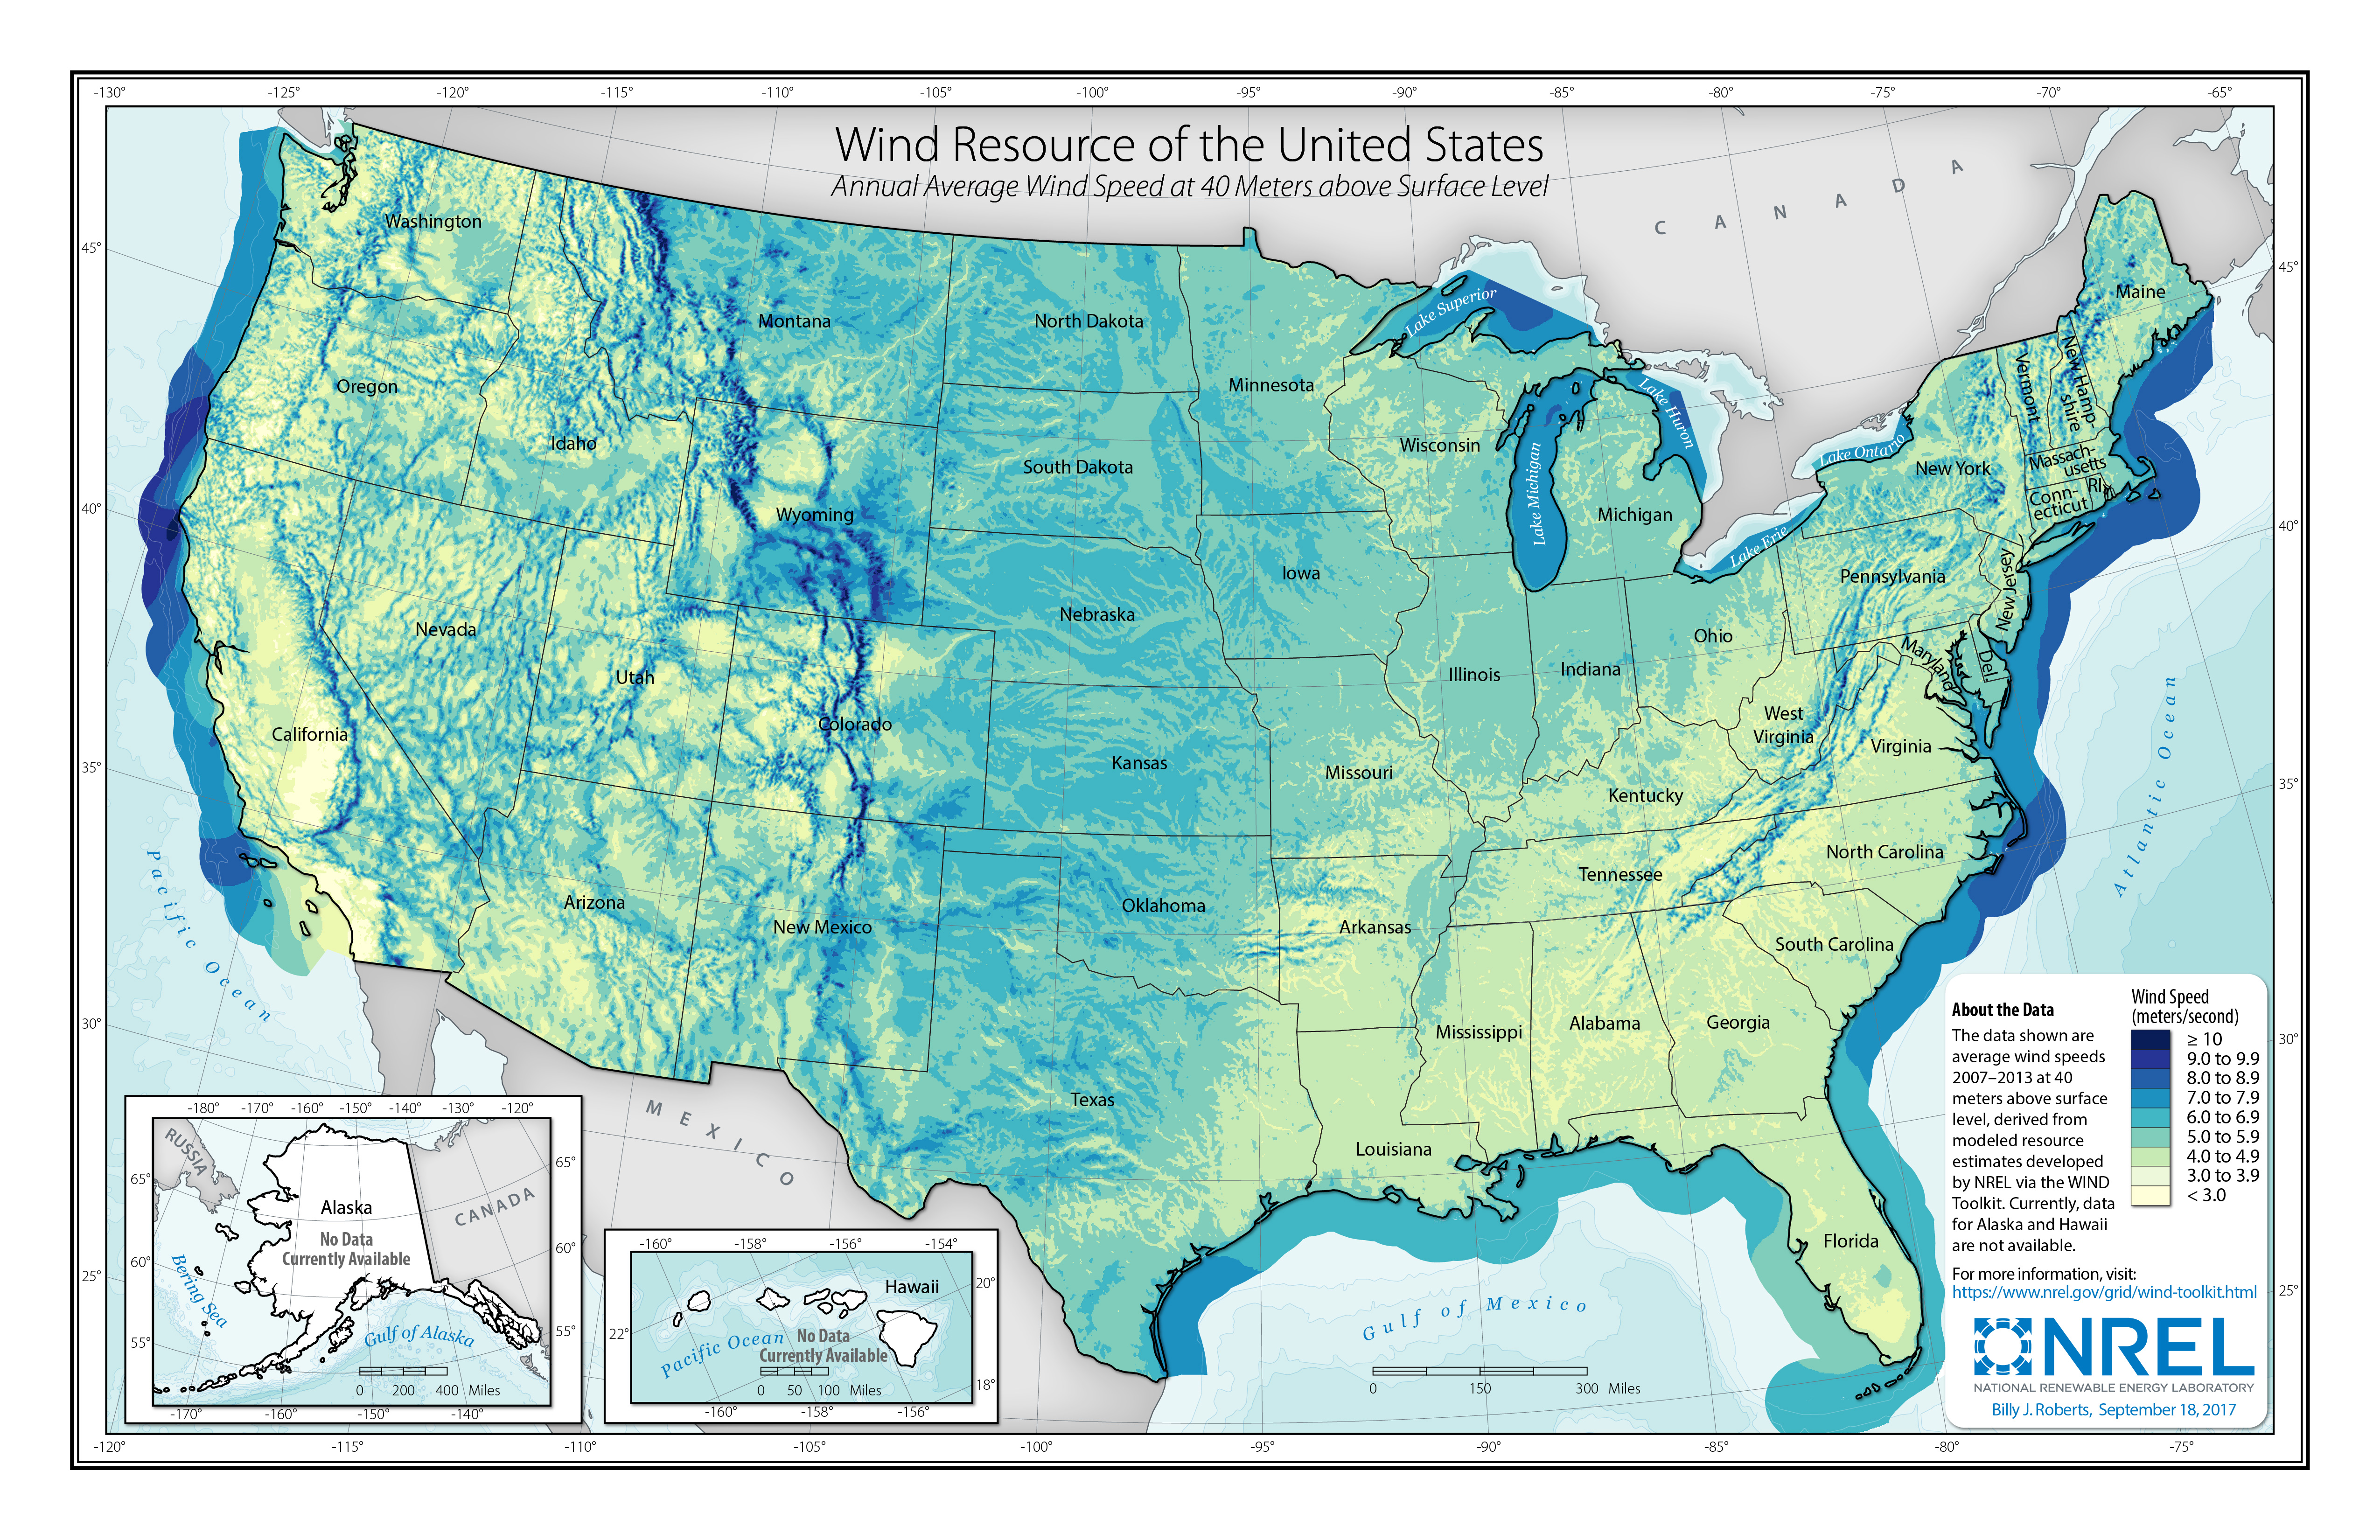
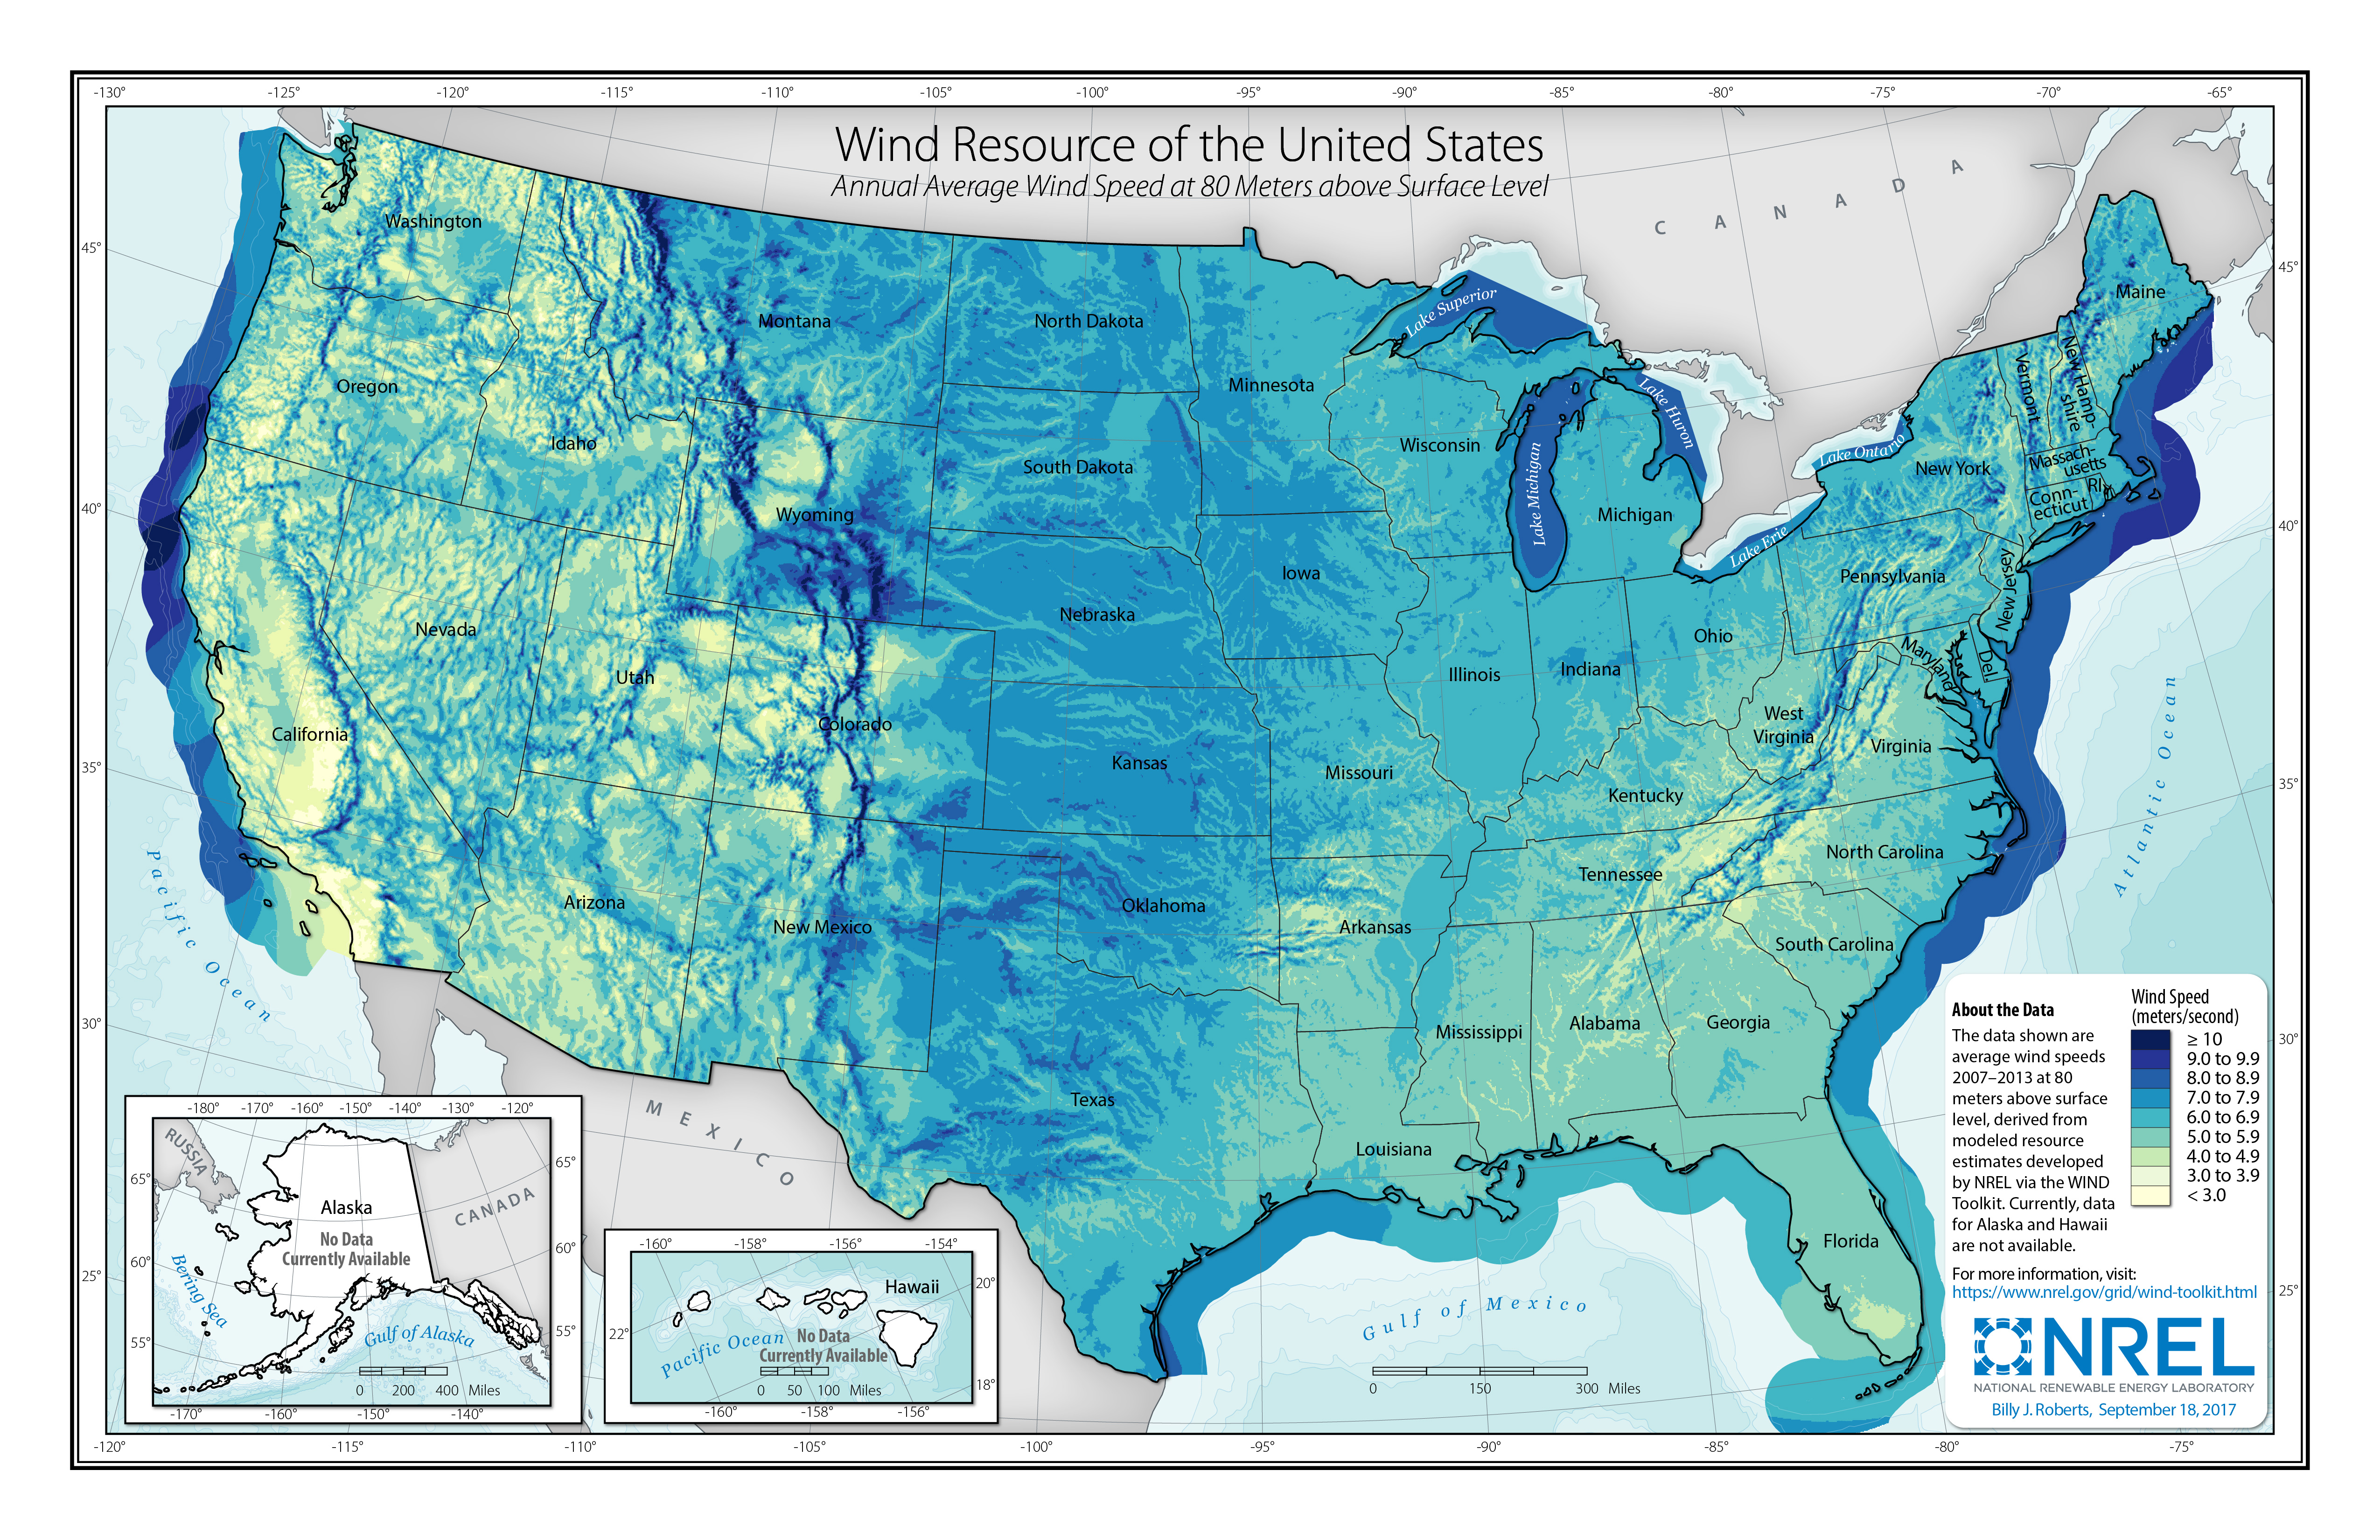
Average wind speeds vary widely by geographical location. Take a few minutes to inspect the wind speed charts from the National Renewable Energy Laboratory below. Note the location of the greatest and smallest wind speeds, and think about the physical characteristics of those areas (e.g., flat, mountainous, on-shore, off-shore, etc.). Click here for a larger version of the 40 m wind speed image [22] and click here for the 80 m image. [23] Note that the average wind speed is higher at 80 m at the same location. Wind speed generally increases with height due to the decreasing influence of friction from the earth's surface and things on it. Modern turbines are generally tall enough to take advantage of 80 m wind speeds.
In addition to variability being a barrier to wind deployment, the location of wind resources is as well. In general - and certainly, in the U.S. - the best onshore wind resources are not located near major population centers. Approximately 50% [24] of the U.S. population lives within 50 miles of the coast, but as you can see in the maps below, this is generally not where the greatest onshore wind is located. This is a problem because transporting electricity over power lines results in energy loss (as heat) due to electrical resistance in wires. The longer the electricity has to travel, the more energy is lost. To minimize this loss, large (and very expensive) power lines must be built. As you can imagine, this type of infrastructure is lacking in areas of the country that do not have large populations.
However, it is clear from the second map that significant offshore wind resources are available very near the coast. Unfortunately, offshore wind is still expensive (remember from a previous lesson [25] that the LCOE is the highest of those listed). That, combined with resistance from local inhabitants had kept the offshore wind at bay until 2016 when the first offshore wind farm (albeit a very small one) in the U.S. was opened in Rhode Island [26]. There are over two dozen in the planning stages [27] as we speak. This is likely an area of growth in the near future.
Wind Turbines
To Read and View Now
- Read through the "Types of Wind Turbines" section of How a Wind Turbine Works [29], and click through the animation from U.S. DOE.
Now for some terminology and other considerations:
- Wind turbines convert wind to electricity. This is different than a windmill, which converts wind energy into mechanical energy that is used for another purpose (e.g., pumping water or in the "old days," grinding grain).
- A wind farm is a number of turbines that are installed in the same area, usually by the same company.
- Like solar panels, turbines have a capacity, which refers to the maximum electrical output of the turbine. A 2 MW turbine will output 2 MW of power at its peak. The amount of power is dictated by the velocity of the wind.
- Remember that energy = power x time, so if a turbine is operating at 2 MW for 1 hr, it will output (2 MW x 1 hr = ) 2 MWh of electricity. 2 MW is now considered a moderately large utility-scale turbine.
- A residential-scale turbine is much smaller, usually being a few hundred watts to a few kilowatts in size. For an example, see the image of the 2.4 kW residential turbine below. If this turbine is generating 2.4 kW for 10 hr, it would generate (2.4 kW x 10 hr = ) 24 kWh of electricity.
- Similar to solar, energy generation by a turbine is maximized by pointing the turbine so it is perpendicular to the wind. Large turbines have a mechanism that rotates the turbine so it faces the wind. This movement is called yaw.
See below for a diagram of key components of wind turbines:
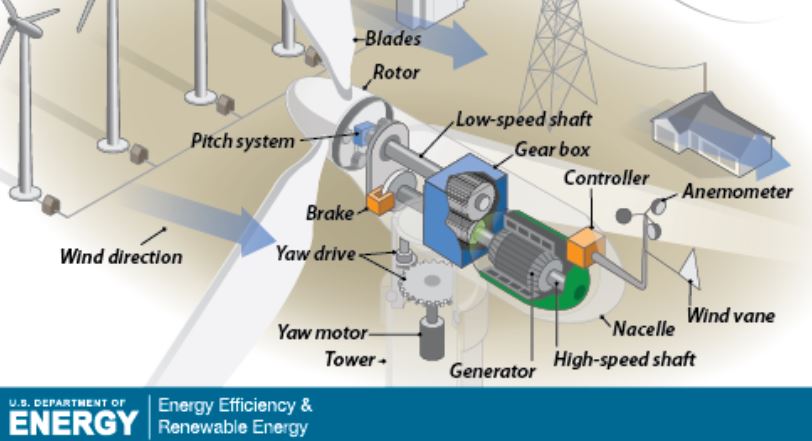
There is a lot to digest here. The components I'd like you to know are as follows. All quoted text is from the U.S. Department of Energy [30]:
- Blades: "Lifts and rotates when wind is blown over them, causing the rotor to spin." The blades convert wind energy into motion energy (the rotating rotor).
- The hub (which is not indicated in the image) is the "nub" in front of the blades. Turbine heights are usually expressed using "hub height," which indicates how far above the ground the center of the hub is.
- The "blades and hub together form the rotor."
- The rotor spins the low-speed shaft, which is then (usually) converted to a higher rotation speed through a gear box.
- The high-speed shaft is attached to the other side of the gear box, which spins the generator. The generator converts this motion energy into electrical energy. Unlike solar panels, wind turbines generate AC electricity.
- The nacelle "sits atop the tower and contains the gear box, low- and high-speed shafts, generator, controller, and brake. Some nacelles are large enough for a helicopter to land on."
- The tower "supports the structure of the turbine." Modern turbines use cylindrical towers made of steel.
- Not pictured, but some modern turbines skip the gear box and use direct drive technology, spinning the generator at the same rpm as the low-speed shaft.
The basic energy conversion process is as follows:
- Solar energy is converted to wind energy.
- Wind energy is converted to motion energy by the blades, which rotates the shaft.
- The rotational velocity of the shaft is increased through the gear box. This does not increase the energy, and in fact, loses some due to frictional heat loss in the gear box.
- The gear box spins another shaft, which spins the generator.
- The generator generates an electrical current.
Turbines come in a very wide variety of sizes and capacities. The images below show some of this. (We will see the second turbine in Golden, CO!)


Wind Energy and Power Calculations
The power in the wind is given by the following equation:
Power (W) = 1/2 x ρ x A x v3
- Power = Watts
- ρ (rho, a Greek letter) = density of the air in kg/m3
- A = cross-sectional area of the wind in m2
- v = velocity of the wind in m/s
Thus, the power available to a wind turbine is based on the density of the air (usually about 1.2 kg/m3), the swept area of the turbine blades (picture a big circle being made by the spinning blades), and the velocity of the wind. Of these, clearly, the most variable input is wind speed. However, wind speed is also the most impactful variable because it is cubed, whereas the other inputs are not.
The following are calculations for power available in the wind at three different velocities for the Northwind 100C turbine. This is the newer version of the Northwind 100A on the previous page. The calculations will show what happens when you double, then triple the velocity. Take a moment to think about how much available power will increase if you double and triple the velocity:
- The standard [34] density of air is 1.225 kg/m3
- The turbine has a 24 m diameter, which means the radius is 12 m. Thus, the swept area of the turbine is: (pi)r2 = 3.14159(122) = 452.4 m2
- We'll start with a 6 m/s wind.
- The power in the wind at 6 m/s is: 1/2 x ρ x A x v3 = 0.5 x 1.225 kg/m3 x 452.4 m2 x (6 m/s)3 = 59,851 W = 59.85 kW
- At 12 m/s: 1/2 x ρ x A x v3 = 0.5 x 1.225 kg/m3 x 452.4 m2 x (12 m/s)3 = 478,808 W = 478.8 kW (8 times as large)
- At 18 m/s: 1/2 x ρ x A x v3 = 0.5 x 1.225 kg/m3 x 452.4 m2 x (18 m/s)3 = 1,615,979 W = 1,616 kW = 1.616 MW (27 times as large)
As you can see, when the velocity doubles, the power increased by a factor of 8 and when the velocity triples, it increases by a factor of 27. This is because the velocity is cubed: 23 = 8 and 33 = 27.
Calculating Wind Turbine Output
The output of a wind turbine is dependent upon the velocity of the wind that is hitting it. But as you will see, the power is not proportional to the wind velocity. Every turbine is different. In order to determine the output of a specific turbine at a given wind velocity, you need its power curve. The power curve and corresponding data for the Northwind 100C can be seen below:

| wind speed (m/s) | 1 | 2 | 3 | 4 | 5 | 6 | 7 | 8 | 9 | 10 | 11 | 12 |
|---|---|---|---|---|---|---|---|---|---|---|---|---|
| power output (kW) | -0.5 | -0.5 | 1.2 | 7.2 | 14.5 | 24.7 | 37.9 | 58.7 | 74.8 | 85.1 | 90.2 | 94.7 |
| wind speed (m/s) | 13 | 14 | 15 | 16 | 17 | 18 | 19 | 20 | 21 | 22 | 23 | 24 | 25 |
|---|---|---|---|---|---|---|---|---|---|---|---|---|---|
| power output (kW) | 95.3 | 95.1 | 94.2 | 92.9 | 91.2 | 88.9 | 87.1 | 84.1 | 81.3 | 78.6 | 75.1 | 74.3 | 71.7 |
As you can see, even though this is a 95 kW turbine, it only provides (approximately) that much power at a very limited number of wind speeds - about 12 m/s through about 15 m/s. Counterintuitively, the power output decreases if the wind speeds up past that point. For safety reasons, the turbine will stop spinning if the wind speed is higher than 25 m/s.
Assuming the turbine is operating properly, the output calculation is pretty straightforward. You just multiply the output at a given velocity by the number of hours the wind is blowing at that velocity. For example, let's assume that the wind hitting a Northwind 100C in a given day has the following velocities. (Note that in reality, the wind would likely change much more frequently than this. I just wanted to make the math relatively easy.):
| velocity (m/s) | number of hours at that velocity |
|---|---|
| 6 | 4 |
| 8 | 8 |
| 12 | 5 |
| 15 | 4 |
| 16 | 3 |
| 16 | 3 |
The total output at 6 m/s would be: 24.7 kW (the output at 6 m/s from the power curve table) x 4 hrs = 98.8 kWh.
Based on the power curve table above, the total output for this day would be:
| velocity (m/s) | number of hours at that velocity | total output (kWh) |
|---|---|---|
| 6 | 4 | 98.8 |
| 8 | 8 | 469.6 |
| 12 | 5 | 473.5 |
| 15 | 4 | 376.8 |
| 16 | 3 | 278.7 |
| 16 | 3 | 278.7 |
| Total | 24 | 1,697.4 |
Capacity Factor
One last consideration to make for wind turbines (or any energy source) is something called capacity factor. Capacity factor indicates how much energy is generated by a source relative to the maximum amount of energy it could provide. This is expressed as a percentage, and is usually determined over the course of a single year. This provides insight into how well-sited the turbine is, but in general indicates how available an energy source is throughout the year. The closer to 100%, the more the energy source is available throughout the year.
The formula is capacity factor = actual output/maximum possible output.
For a wind turbine, the maximum possible output would be the capacity x 8760 hr (there are 8760 hrs in a year). So for the Northwind 100C, the maximum output is: 95 kW x 8760 hr/yr = 832,200 kWh/yr (or 832.2 MWh). If the actual output over the course of a year was 250,000 kWh, the capacity factor would be:
- capacity factor = actual/maximum output = 250,000 kWh/832,200 kWh = 30%
The average capacity factor of the U.S. wind fleet hovers around 32% - 34% [36], but new turbine designs have been tested in the 60%+ range, like the 12 MW behemoth [37] by GE. It's not unusual to see 40% and up capacity factors for well-sited wind farms.
Microhydro
Hydropower
Like moving air, moving water has kinetic energy (it has mass and it is moving). But water is much denser than air - this is obvious to anyone who has waded across a deep stream or played in ocean waves. If you recall, air has an average density of 1.225 kg/m3. One cubic meter of water, on the other hand, has a mass of 1,000 kg, or one metric ton (aka one tonne). It may be hard to believe, but a cube of water that is about 3.3 feet on each side weighs over 2,000 pounds!
Where does this kinetic energy come from? Take a second to think about it...Water only flows downhill, so if you see moving water it came from a higher elevation. This kinetic energy is thus converted from gravitational potential energy. How did it get this gravitational potential energy? Well, something had to take the water up to the higher elevation. The only natural way this happens is through evaporation, which is almost always caused by the sun, in a number of different ways: Water that is heated by the sun may evaporate. Wind also evaporates water, but remember that wind gets its energy from the sun. Plants evapotranspirate water, but again, they get their energy from the sun. Even the minor amount exhaled by humans is solar energy since all of our energy comes from the sun. The only major exception is that some evaporative heat is provided by geothermal energy from the earth, e.g., in volcanoes. At any rate, almost all hydropower/energy comes from the sun
How a Hydropower Plant Works
Humans have been using hydropower for thousands of years [38]. According to the U.S. Department of Energy, the Greeks used water to spin wheels to grind grain over 2,000 years ago. Modern humans figured out how to convert hydropower to electricity by using a turbine and generator (see below), which is called hydroelectricity, for obvious reasons. The first known use of hydroelectricity [39] was in 1878 to power a single lamp in Northumberland, England. Larger plants were installed in 1881 in the U.S., and the first commercial-scale plant was built in the U.S. in 1893 in Redlands, California.
All hydroelectric power plants operate on the same principle. Moving water spins a turbine, which spins an electric generator. See below for an illustration of an impoundment facility, which uses a dam to create a reservoir of water.
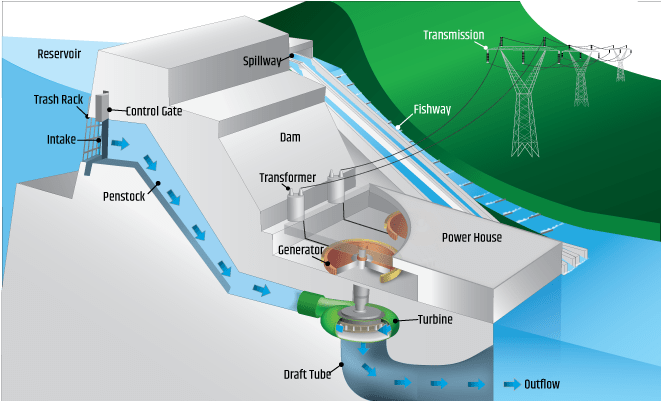 [40]
[40]
Explaining all components in this image goes beyond the scope of this lesson. The important terms for this lesson are:
- The penstock is a conduit through which the water flows from a higher to a lower elevation.
- The turbine spins due to the force of the water flowing out of the penstock.
- The turbine spins the generator, which generates electricity.
This basic process - flowing water spins a turbine, which spins a generator - is common to all types of hydroelectricity installations. There can be any number of other components, and the size/scale may be different, but this core process is the same.
Microhydroelectricity
Like all other electricity sources, hydroelectric power plants have a rated capacity. Large impoundment facilities can have capacities on the order of GWs (billions of watts). The largest facility in the world - the Three Gorges Dam in China - has a capacity of 18 GW. According to the U.S. Department of Energy, a microhydro system has a capacity of up to 100 kW [41]. Most systems are much smaller. A residential-scale microhydro system is more likely to be a few kWs in size.
 [42]
[42]
A typical microhydro system is illustrated in the image above. Systems can vary significantly in style and size, but according to the U.S. DOE, the following components are commonly seen in most systems [44]:
- The water is often diverted from a stream. If so, it is usually transported to a forebay, which is akin to a small impoundment facility that creates a small reservoir.
- There is some kind of conveyance that provides the water to the turbine. In the illustration above, this is done by a penstock, which is often made of PVC pipe. This could also be done by a channel.
- The water spins a turbine, which spins a generator, which provides electricity. This is all contained in the powerhouse in the image above. There are a number of different types of turbines, most of which require a jet of water that is sprayed through a nozzle at the end of the penstock. If you are interested, see details in this reading from the U.S. DOE [44].
Energy and Power in Water
As described above, the kinetic energy in flowing water starts out as gravitational potential energy. The gravitational potential energy of a given amount of water at any elevation can be calculated using the following equation:
- Pe = m x g x h
- Pe = potential energy in Joules
- m = the mass of the water in kg
- g = the acceleration due to gravity (m/s2)
- h = the height of the water in m (usually called the "head")
The force of gravity is essentially a constant (it gets a little bit smaller with height). Thus, all else being equal, as height and mass increase, the potential energy increases. Keep in mind that this equation only illustrates the maximum kinetic energy available to a hydropower system. In reality, there are always losses by the time the kinetic energy is converted to electricity.
The power available in water at height is given by a similar equation:
- P = Q x g x h
- P = power in watts
- Q = discharge of water in kg/s (this is also mass per unit time)
- g = acceleration due to gravity (m/s2)
- h = head (m)
Again, this is only the hypothetical maximum - it is impossible to capture all of this power in a turbine. This equation is almost the same as the potential energy equation - you just substitute discharge for mass. Since the discharge is kg/s, or mass divided by time, if you compare the two equations, the power equation is the energy equation divided by seconds. This makes sense if you think about it: the potential energy is given in Joules, and the power equation is given in watts. Recall that 1 J/s = 1 W. Makes sense, right?
Calculating Microhydro Output
It turns out that calculating the approximate power output of a microhydro system is not terribly difficult. According to the U.S. DOE, a typical system has an efficiency of about 53%. This includes losses from the nozzle, the wiring, the generator, and a few other things. The power of a microhydro system with this efficiency is approximately:
- power = net head x flow /10
- power = electric power in W
- net head = the gross head in ft including the head loss in the penstock
- flow = flow of water in gal/min
- 10 = conversion factor (this can range from 8 - 12, with 10 being about average)
To determine the gross head, you measure how many feet above the generator the penstock starts. Note that this is not the same as the length of the penstock. The penstock is sloped, and thus will be longer than the head. The head loss is based on a few factors, including the diameter of the penstock, the pressure inside the penstock, and the number of turns and fittings there are in the penstock. According to Homepower Magazine, 30% is a typical amount of head loss, which means you would calculate the gross head time 0.7 to determine the net head. The flow of a stream through a penstock can vary wildly, from a few gallons per minute to a few hundred (or more). To provide some context a garden hose usually has a flow of about 20 gallons per minute, though this can also vary significantly depending on a number of factors.
Let's say I have a property in which I can create a diversion channel and forebay 100 ft above a power house, and I measure my flow at 50 gpm. Assuming a good system design which includes a head loss of 30%, my output would be:
- power = net head x flow / 10
- power = 100 ft x 0.7 x 50 / 10 = 350 W
- If I could get this to operate all day, I would get (350 W x 24 h/day = ) 8400 Wh or 8.4 kWh/day
Further Reading/Viewing
This lesson only scratches the surface of microhydro systems. There are many designs and factors to consider. Each site is different. For a more detailed explanation, see this website from the U.S. DOE [45], and for a good case study, see this example from Homepower Magazine ( [46]starting on p. 32). There are dozens of videos on YouTube that detail specific systems, many of which are worth checking out if you are interested.
If you are interested in learning more about the power and energy available in water for hydroelectric, see this video presentation I put together [47]for another course.
Site Visits
Starting this week and moving forward — each week, I will provide links to some of the locations/organizations we will visit. This is not required reading. I suggest browsing through them if/when you have time. This may help inspire your final project proposals!
- Solar Energy International [48] (SEI), Paonia
- GRID Alternatives [49], Denver
- Rocky Mountain Institute [50], Boulder
- Blue Terra Waste Solutions [51], Denver and Longmont
Summary and Final Tasks
Summary
By now, you should be able to do the following:
- analyze wind energy maps;
- identify components of wind turbines;
- describe how solar energy is converted to wind and hydropower;
- calculate the output of a wind turbine;
- identify components of microhydro systems; and
- calculate the output of a microhydro system
Reminder - Complete all of the Lesson 7 tasks!
You have reached the end of Lesson 7! Double-check the to-do list on the Lesson 7 Overview page [52] to make sure you have completed all of the activities listed there before you begin Lesson 8.
Lesson 3: Waste Management
Overview
The focus of this lesson is on ways to sustainably manage natural resources.
Learning Outcomes
By the end of this lesson, you should be able to:
- define natural resources;
- describe why the term "natural resources" is anthropocentric;
- analyze the difference between linear and circular resource flows;
- describe the differences between reduction, reuse, and recycling; and
- identify components of the circular economy and cradle to cradle certification.
Lesson Roadmap
| To Read | Lesson 8 Online Content | You're here! |
|---|---|---|
| To Do |
|
|
Questions?
If you have any general course questions, please post them to our HAVE A QUESTION discussion forum located under the Discussions tab in Canvas. I will check that discussion forum regularly to respond as appropriate. While you are there, feel free to post your own responses and comments if you are able to help out a classmate. If you have a question but would like to remain anonymous to the other students, email me through Canvas.
If you have something related to the material that you'd like to share, feel free to post to the Coffee Shop forum, also under the Discussions tab in Canvas.
Natural Resource Use
I'm sure you've heard the term "natural resources" used many times, e.g., when someone talks about "preserving natural resources" or when you hear about "natural resource management." It's a pretty innocuous term, and seemingly straightforward. If you asked someone what natural resources are, they would probably say something about "resources provided by nature, such as trees, minerals, and food" or something to that effect. (This is actually a pretty good definition, by the way!) When thinking about the definition, it's easy to focus on the "nature" component and look past the "resources" part. Specifically, it is important to note that "natural resources" is an anthropocentric (human-centered or focused) term. It is a concept that only exists because of humans because it refers to things that impact humans. To demonstrate this, let's look at a few definitions of natural resources:
things such as minerals, forests, coal, etc. that exist in a place and can be used by people
~Cambridge Dictionary [53]
industrial materials and capacities (such as mineral deposits and waterpoer) supplied by nature
~Merriam-Webster [54]
a naturally occurring source of wealth, as land or water; the natural wealth of a country, consisting of land, forests, mineral deposits, water, etc.
~dictionary.com [55]
Any way you slice it, without humans natural resources don't exist, they would just "be" or just be "nature." This is important to keep in mind as we go over this lesson: by definition, natural resources only exist as a concept because they can be used by humans.
Hidden Resource Use
Personal consumption expenditures (household spending on goods and services) constitutes nearly 70% of U.S. GDP [56]. Much of this is on services, but Americans now spend over 5.5 trillion dollars on "goods," which includes everything from food, to energy, to cars, houses, clothing, and other goods. See the charts below from the Federal Reserve Bank of St. Louis [57] for these consumption trends over the past 60+ years. They are an excellent, reliable resource for economic data. (For a good explanation of goods and services, see this explanation [58]from thebalance.com.)
The moral of the story: Americans buy a lot of stuff! This has many implications, but one is particularly important with respect to this lesson. Namely, almost all of this spending requires the use of natural resources. Obviously, things like cars and clothes require raw natural resources to produce, though you may be surprised at how many. Take a look at the infographic below from Allianz to get some idea of how many different natural resources from all over the world are needed to make a car.

All goods require some mixture of raw natural resource extraction, manufacturing, processing, shipping, packaging, use, and disposal. All of this requires energy and resources. Most of this use, as indicated in the infographic above, is hidden.
I will give you one more quick example: I used to assist with industrial energy audits on a part-time basis while in college. One of the places we audited was a "feed mill," which is essentially a factory that produces chicken feed. (Related note: Delaware is considered the poultry capital of the U.S.) The facility looked a lot like the one in the image below.
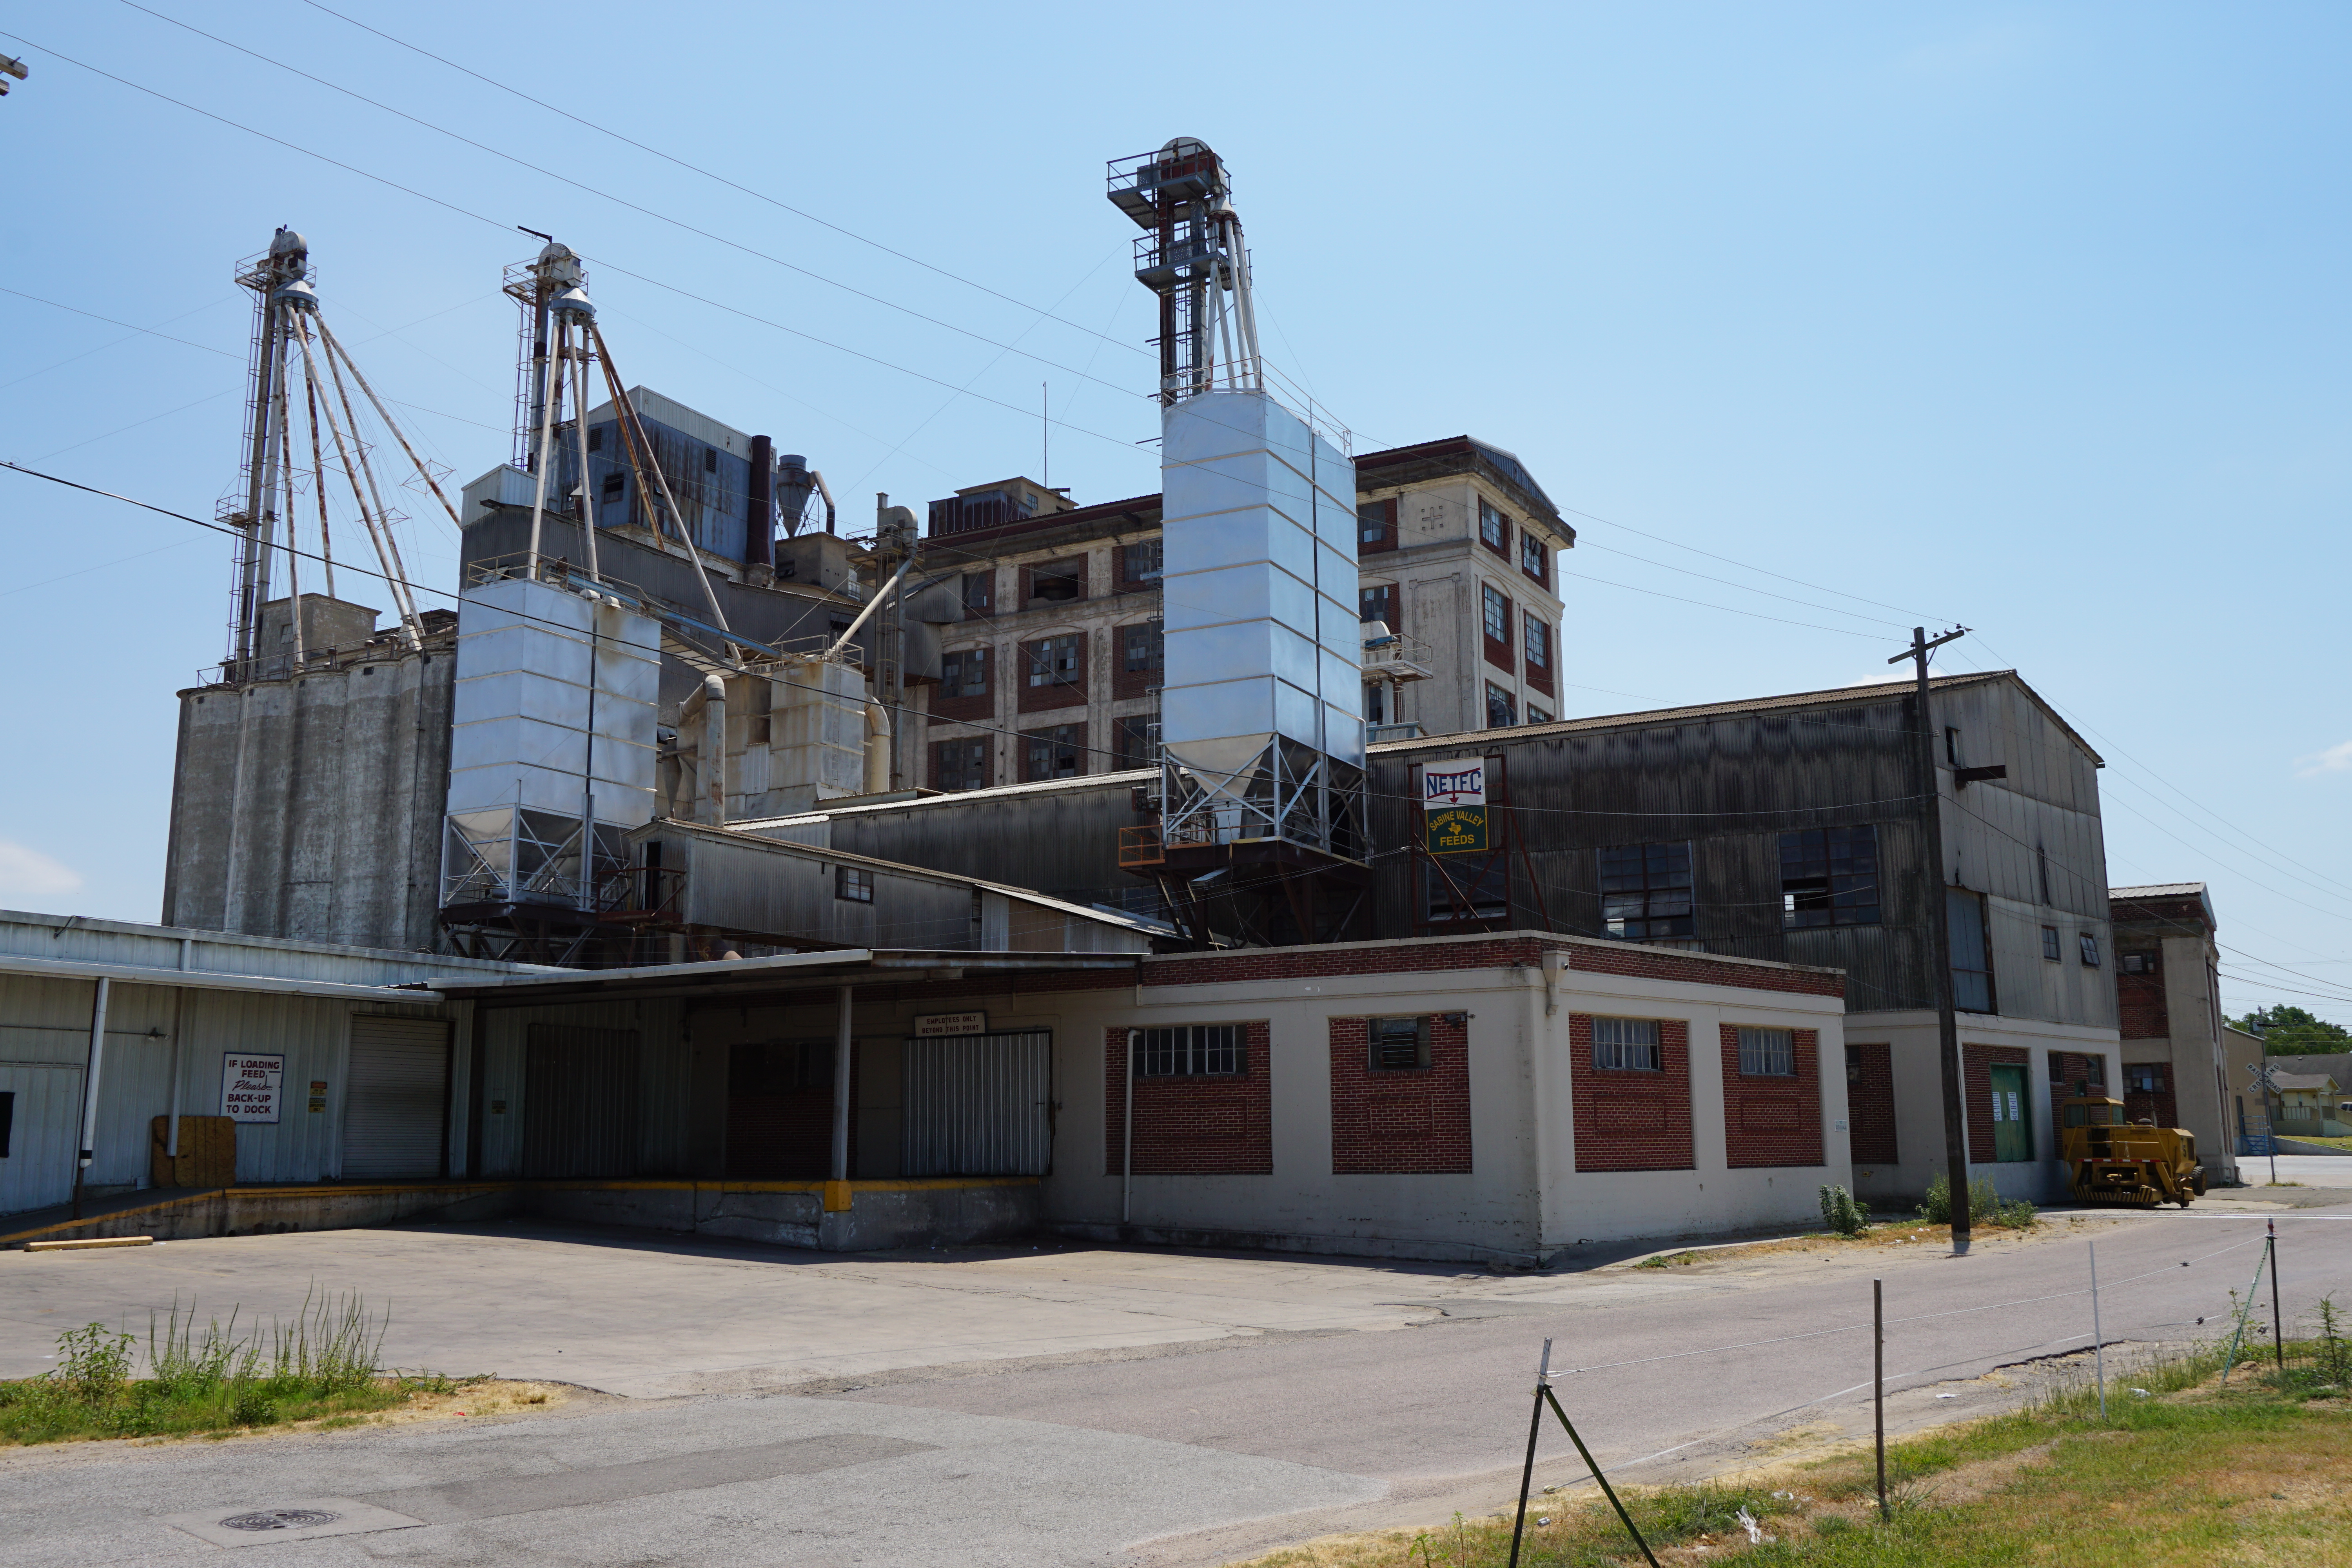
I was dumbfounded at how much energy and resources went into just producing feed for chickens! While I was there, there was a constant arrival of tractor trailers hauling raw ingredients - corn, soybean, nutrient mixes, and other things - and the machinery was massive and energy-intensive. According to Delmarva Poultry Industry, Inc. [65] (Delmarva includes parts of Delaware and the eastern shores of Virginia and Maryland), the Delmarva chicken industry had the following specifics in 2020:
- 5.7 million chickens (4.2 billion pounds) produced
- They purchased "90 million bushels of corn, 36 million bushels of soybeans, 403.000 bushels of wheat," all for chicken feed. Imagine all of the water, fertilizer, and energy that went into the production of these crops.
- They "purchased $270 million in packaging and processing supplies."
The point here is not to go in-depth into the poultry or automobile industries, but to indicate that nearly everything you purchase is the product of a tremendous use of resources, much of which is hidden. But services such as healthcare and education also require the use of resources. Medical facilities need chairs, tables, x-ray machines, paper, and so forth, use a lot of energy, and create an immense amount of waste. Even an online class requires physical resources, in particular, electricity (e.g. cloud-based storage uses [66]about 70,000 - 140,000 times the energy of storing data on your computer), and all of the lifecycle resources used to generate that energy (mines, power plants, power lines, equipment to manage it all, etc.), but also the device you are viewing this on is the result of a global supply chain of goods, and there are natural resource impacts at every step of this supply chain. This type of lifecycle resource use and our consumption-driven economy are major contributors to the fact that we would need nearly 5 planet earths to satisfy humanity's needs if everyone lived like the average American.
Resource Flows
Linear Resource Flow
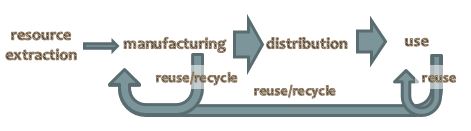
The problems associated with the massive amount of resources used to produce everyday goods and services is compounded by the fact that this system is based mostly on linear resource use. This is often referred to as "take, make, waste." An illustration of the basic resource flow is shown below.
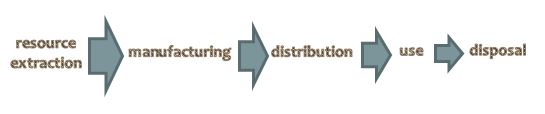
This linear model typically goes something like the following:
- Natural resources are extracted through mining, growing, gathering, etc. They are often shipped all over the world, e.g., as indicated in the automobile infographic above.
- These raw resources are then manufactured into final goods, both perishable and non-perishable. This almost always occurs on an industrial scale (think of the massive factory farms, manufacturing plants, and even the feed mill illustrated above).
- These goods are then distributed, usually globally. Take a look at the label on your clothes (Bangladesh and Vietnam are common), electronics (China, most often), and food (could be anywhere - Chile, Mexico, New Zealand, etc.).
- They are then used by the end user.
- Most of the time, they are then disposed of in a landfill.
- Note that all along the way there are waste and emissions being generated, most of which are emitted or landfilled.
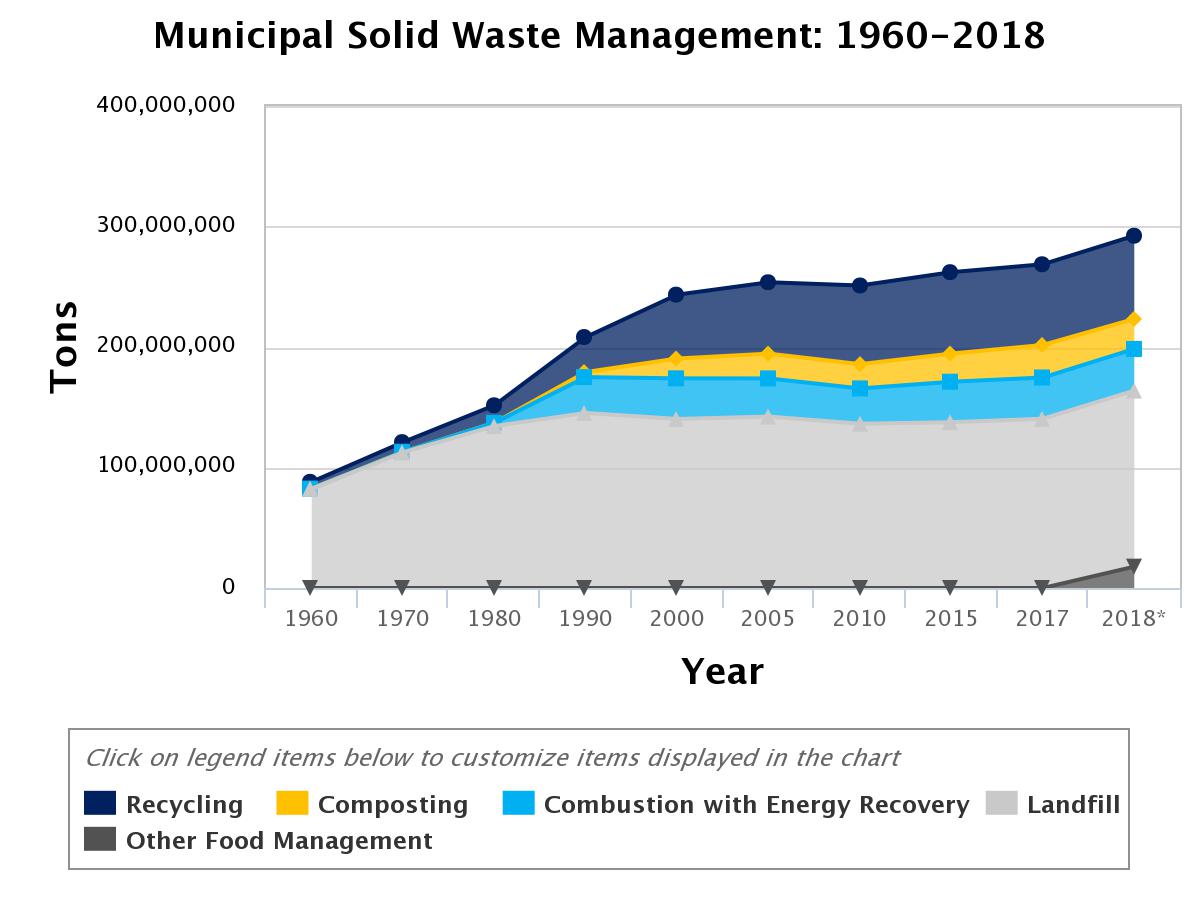
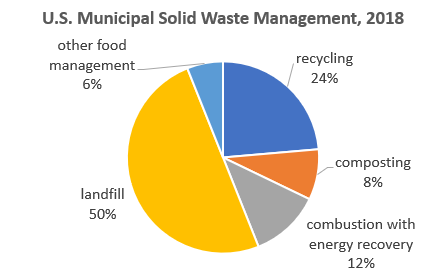
This model requires the constant input of raw natural resources because of the waste and emissions along the way, and because most of the "waste" is dumped in a landfill (and possibly incinerated), and all of this is done primarily with the use of non-renewable energy. This is a major reason why our ecological footprint is so large and we are using natural resources at such a high rate. Globally, only about 12.5% [68] of the primary energy used is renewable (source: BP 2021 Statistical Review of World Energ [69]y). In the U.S., over half of municipal solid waste (MSW) ends up in a landfill. Keep in mind that municipal solid waste is basically household garbage, and does not include construction, industrial, or farming waste, which make up a large portion of the waste stream. All of this adds up to 292.2 million short tons of MSW generated (about 4.9 pounds per person per day, which is up from 4.5 pound per person per day a few years ago), of which about 146 million tons ends up in a landfill, according to the U.S. EPA [70].
Circular Resource Flow
Contrast this with a circular resource flow model, in which there is almost no waste. Any resources that are unused in each step are reintegrated back into the system. Manufacturing "waste" is reused or recycled, as are final products used by the end user. If this could all be run using renewable resources, then much of the pollution would be eliminated as well. In fact, in an ideal circular resource system, the idea of "waste" does not exist. This is the philosophy behind "zero waste" initiatives. Note that because of thermodynamics, there will be some inefficiency, and thus some loss. This is why there will still be some natural resource input required.
It is worth noting that nature utilizes circular resource flow. Recall that it was stated above that the concept of natural resources is anthropocentric. There is no waste in nature - everything is a resource for some other process. Resources move around in continuous flows, and all "waste" is reintegrated back into the system, with the exception of some heat loss that is radiated back to space. All of this is of course driven by renewable energy, and any energy lost to space is offset by energy coming in from the sun. This is why many zero waste (and other sustainability) advocates say that the more we can design human systems to mimic natural systems, the more sustainable those systems will be. As you will see in a future lesson, this is the fundamental philosophy of permaculture.
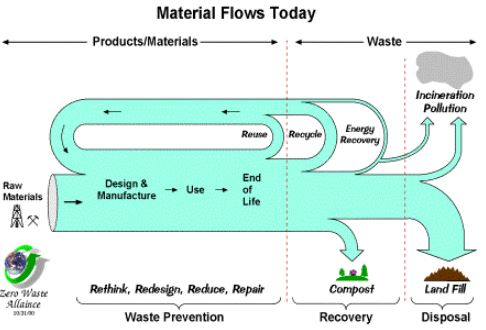
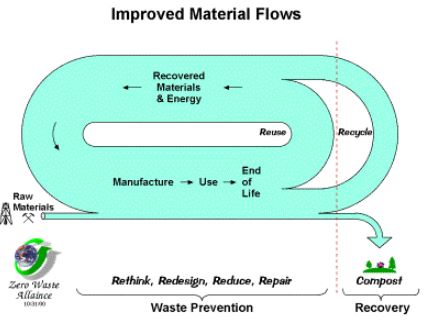
The Zero Waste Alliance provides an excellent visualization of what such a system could look like. The images below show natural resource flows. The thickness of the flows indicates the relative amount of resources flowing through that part of the system. As you can see, by recovering most of the "waste" throughout, the raw materials flow (at the far left of each diagram) is greatly reduced. Note that the second image shows an idealized flow - there will be some loss due to thermodynamics. Even without thermodynamic loss, some natural resource extraction is required because some resources cannot be directly reused in the manufacturing process.
Waste Management Strategies
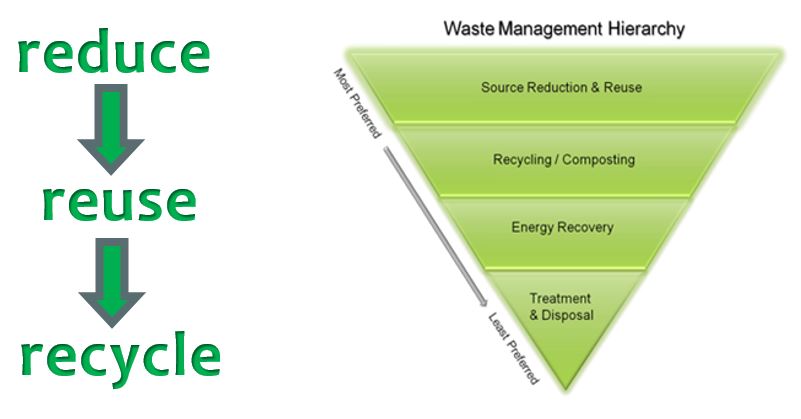
The Three Rs
No doubt you have seen some variation of the image below. Most recyclable packaging has a triangle design, which indicates that it is recyclable. You are probably familiar with the phrase "reduce, reuse, recycle," which is hammered home to (most) kids at a very early age in the U.S. The image clearly gives a nod to circular resource use (follow the arrows!). Each term refers to a slightly different way to manage waste. I provide an example of each in parentheses as it relates to a plastic water bottle:
- "Reduce" refers to not creating the item/material in the first place. (Don't buy or use the plastic bottle in the first place.)
- "Reuse" refers to reusing the item (or at least part of the item) for another purpose. (Examples include refilling it with water and using it again, using the plastic bottle to start a seedling or make a small bird feeder. If you make a new, useful product out of it - such as the bird feeder - it is sometimes considered "upcycling.")
- "Recycle" refers to breaking the item down into smaller components and using these materials as a replacement for materials in newly manufactured goods. (A plastic bottle can be recycled and made into a different plastic product.)
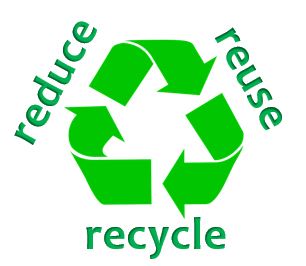
However, what most people do not know is that "reduce, reuse, recycle" is actually a priority list. In other words, the best way to minimize the impact of waste is to not use it in the first place (reduce), the second best way is to reuse it, and the third best way is to recycle it. Recycling requires a lot of inputs: inefficient trucks to pick it up and transport it, massive machinery to sort it and break it down, more machinery to produce the new good (often after shipping the raw resource far away), then more energy and resources to distribute the good. This entire process uses energy and generates waste. Reuse is less impactful because it cuts out all of the downstream impacts of recycling, but it does not eliminate all of the upstream impacts that resulted from producing the good in the first place.
While all of this is true, recycling is still much more beneficial than landfilling! The following are some statistics from the EPA [73]. All information was taken from WARM, the Waste Reduction Model. (Click here to download the Excel file [74] and do your own analysis, or just explore the data.) Note that MMBTU is one million BTUs of energy, and MTCO2e refers to one megaton of carbon dioxide equivalent:
| material | reduction energy savings (MMBTU/ton) | recycling energy savings (MMBTU/ton) | combustion energy savings (MMBTU/ton) | reduction emissions savings (MTCO2e/ton) | recycling emissions savings (MTCO2e/ton) | combustion emissions savings (MTCO2e/ton) |
|---|---|---|---|---|---|---|
| aluminum cans | 89.69 | 152.76 | -0.60 | 4.91 | 9.11 | -0.04 |
| glass | 6.9 | 2.13 | -0.50 | 0.53 | 0.28 | -0.03 |
| PET plastic | 50.26 | 31.87 | 10.13 | 2.20 | 1.12 | -1.21 |
| corrugated cardboard | 33.23 | 0.69 | 6.64 | 5.60 | 3.12 | 0.51 |
| newspaper | 36.46 | 16.49 | 7.53 | 4.77 | 2.75 | 0.58 |
Notice that with the exception of aluminum cans, the energy and emissions reductions are always greater when you reduce than when you recycle. Based on what I could see in the WARM spreadsheet, aluminum cans are the only material for which recycling is more impactful. Also note that some materials require more energy to burn than they do to landfill (see the negative numbers), and for ALL materials listed, combustion is worse for emissions than recycling or reducing.
The Circular Economy
The circular economy, as you will see below, utilizes circular resource use.
Living systems have been around for a few billion years and will be around for many more. In the living world there's no landfill; instead, materials flow. One species' waste is another's food. Energy is provided by the sun. Things grow, then die, and nutrients return to the soil safely. And it works. Yet as humans we've adopted a linear approach. We take, we make, and we dispose. A new phone comes out, so we ditch the old one. Our washing machine packs up, so we buy another. Each time we do this, we're eating into a finite supply of resources and often producing toxic waste. It simply can't work long-term. So what can? If we accept that the living world's cyclical model works, can we change our way of thinking so that we too operate a circular economy?
Let's start with the biological cycle: How can our waste build capital rather than reduce it? By rethinking and redesigning products and components and the packaging they come in, we can create safe and compostable materials that help grow more stuff. As they say in the movies, no resources have been lost in the making of this material.
So what about the washing machines, mobile phones, and fridges? We know they don't biodegrade. Here we're talking about another sort of rethink. A way to cycle valuable metals, polymers, and alloys so they maintain their quality and continue to be useful beyond the shelf life of individual products. What if the goods of today became the resources of tomorrow? It makes commercial sense. Instead of the throwaway and replace culture we’ve become used to, we'd adopt a return and renew one where products and components are designed to be disassembled and regenerated.
One solution may be to rethink the way we view ownership. What if we never actually owned our technologies? We simply licensed them from the manufacturers.
Now let's put these two cycles together. Imagine if we could design products to come back to their makers, their technical materials being reused and their biological parts increasing agricultural value? And imagine that these products are made and transported using renewable energy? Here we have a model that builds prosperity long-term. And the good news is there are already companies out there who are beginning to adopt this way of working. But the circular economy isn't about one manufacturer changing one product. It's about all the interconnecting companies that form our infrastructure and economy coming together. It's about energy. It's about a rethinking of the operating system itself. We have a fantastic opportunity to open new perspectives and new horizons. Instead of remaining trapped in the frustrations of the present, with creativity and innovation, we really can rethink and redesign our future.
Here’s an idea. What if you never had to buy a light bulb again? Instead, you lease light, like you lease a car or an apartment. It's just one idea that’s part of the circular economy. Before we can understand the circular economy, well, it helps to define the linear economy. Most organizations today operate in the linear economy which is based on a 'take, make, and dispose' model. So, for example, a light bulb company takes resources, like glass or metal, to manufacture its products. The company makes the bulb and sells it to a customer like me who uses it. Once the light bulb burns out, I dispose of it. It’s likely neither the company nor I will ever see that light bulb again. For a light bulb company to make money in the linear economy, it tries to buy materials for the lowest cost possible and to sell as many bulbs as possible. This model operates as if there are infinite resources, like glass or metal, in the world. But you and I know that’s not the case. That’s why the circular economy treats materials like they're finite. A company in the circular economy doesn’t just recycle products but maintains ownership of them all along, so the model looks more like this: make, use and return.
Let’s go back to the light bulb example. Instead of buying bulbs, this office in London leases its light from Philips Lighting. It signed a 15-year lease for the service and pays a fee each quarter. Philips still owns the actual lightbulbs and provides maintenance and replacements when needed, no extra cost. This model gives Philips the incentive to produce energy-efficient light bulbs and it saves the office money with fixed lighting costs. It’s a radically different business model that makes companies more like service providers than sellers of a physical product.
And it turns out lots of companies are looking for ways to get involved. Take H&M, one of the world’s largest clothing retailers. It’s working on a strategy to become 100 percent circular. The company collects old garments in its stores and recycles them. Since 2013, H&M says it has gathered more than 55,000 tons of fabric to reuse for new garments. Some governments are getting on board with the circular economy, too. The European Union adopted an action plan in 2015 aiming to make supply chains, you guessed it, more circular. This includes everything from production to consumption, repair and manufacturing, and waste management.
The point isn’t just to become more 'green' and create environmental benefits, there could be economic benefits too. One report estimated a shift toward the circular economy in the E.U. could increase GDP by an additional 12 percentage points by 2050. But moving from the linear economy to the circular economy also brings costs. Companies would need to redesign their supply chains and products in order for them to be used again and again. Manufacturers might be burdened when it comes to the actual logistics of disposing and recycling. A recent report found only 22 percent of U.K. companies are trying to generate value from products that are returned for reuse, recycling or refurbishing. It’s estimated the cost of transitioning to a fully efficient reuse and recycling system across Europe could be as much as 108 billion euros, roughly 130 billion dollars. Cost is one thing. Changing people’s mindsets is another. And that’s what it'll take for the circular economy to go from an idea to reality for everyone.
Hey guys, it's Elizabeth, thanks so much for watching! You can check out more of our videos over here. We're also taking your suggestions for future CNBC Explains, so leave any ideas in the comments section. And while you're at it, subscribe to our channel. See you later!
There are a few ideas underlying the circular economy concept, as described in the videos:
- The current model is take, make, dispose of. (This should sound familiar!) As they indicate, nature does not operate this way - there is no "waste" in nature - and in order for society to be sustainable, we should follow the natural model.
- As CNBC notes in the video: "For a light bulb company to make money in the linear economy, it tries to buy materials for the lowest cost possible and to sell as many bulbs as possible. This model operates as if there are infinite resources, like glass or metal, in the world." They recognize that we cannot continue to use natural resources at an unsustainable rate. (Again, this should sound familiar.)
- People do not actually need to own things, they need/want the service provided by those things. Is the point of purchasing a light bulb to own the light bulb? For most people, no. They just need light. Do you really need a washing machine? Again, the answer is "no." You just need clean clothes. There are innumerable examples of this - cars, microwaves, cell phones, refrigerators, furnaces, even clothes.
- If ownership is retained by companies, then it is in their best interest to make the products last as long as possible by making long-lasting products that can be repaired. It is also often beneficial to them to be able to reuse components from products that are no longer in use.
- The first video (from the Ellen MacArthur Foundation), sums up the concept very nicely: "Now let's put these two cycles together. Imagine if we could design products to come back to their makers, their technical materials being reused and their biological parts increasing agricultural value? And imagine that these products are made and transported using renewable energy? Here we have a model that builds prosperity long-term."
The MacArthur Foundation notes that the circular economy is "about a rethinking of the operating system itself." This is a very important point! The take-make-dispose process is systemic, and is deeply ingrained in society. If we are to get past this mindset, systemic change is required.
Of course, we are socialized to believe that ownership is important (Americans in particular love buying stuff), so the establishment of a circular economy will require social change. This may seem a difficult hill to climb. Well, it is, actually, but allow me to provide one example of why it may be more feasible than you think. Consider the ubiquity of Uber and Lyft. It may be difficult to imagine, but try to think back 10 years ago, before ridesharing existed. Treating automobile transportation as a service was mainly reserved for taking cab rides in cities. Now you can take an Uber in 85 countries [76] across the world, and the service is available even in rural areas of the U.S. The point here is not that Uber and Lyft are examples of the circular economy (though they do minimize the necessity of automobile production), but that personal transportation is increasingly being viewed as a service. It is a rather commonly held belief [77] that autonomous vehicles will reduce vehicle ownership. Rideshare and car companies are already testing driverless vehicles, and in the not-too-distant future, they will increasingly own their own vehicle fleet instead of paying others to drive, or in the case of car companies, expecting consumers to buy their cars. If/when that happens, it will be to their benefit to extend the use of their fleet as long as possible.
Cradle to Cradle Design
Please watch the video below for some insight into an application of the circular economy called Cradle to Cradle Design. (5:49 minutes)
As you can see, cradle to cradle (C2C) concept is an application of the circular economy. The concept is summed up rather well in the video when they state that C2C is all about "keeping all materials in continuous cycles, stimulating the use of renewable energy only, and celebrating diversity," though there is more to it, as you will see below. The following are some of the key points from the video above:
- They characterize the concept of reduce, reuse, recycle as "less bad" and the goal of C2C as "100% good." They acknowledge that the 3 Rs are better than the linear resource use model, but that they will not solve our long term resource and waste problems because there is still some waste, and because the global population is still growing. If C2C were fully implemented, the entire system of design and manufacturing of goods would be reconfigured. In other words, it requires systemic change.
- I remember watching a TED Talk [78]by one of the creators of the C2C concept, William McDonough, and he characterized the 3 Rs as "an efficient pursuit of the wrong goals." In other words, doing things like recycling plastic bottles is better than just throwing them away, but a properly designed container would be designed with the intent of fully reintegrating all of the materials back into the original process. As they state in the video: “The design is thought through on how to disassemble it and how the used materials are valuable to nature or as resources for the production of new products.”
- They note that one of the primary tenets of C2C is "waste = food." They think that the concept of "waste" should not exist. They describe two cycles that should be utilized when products are no longer used: Organic materials should be returned to the biological cycle (compostable packing, etc.) and non-organic materials (metals, etc.) should be reintegrated into the technical cycle. They often refer to these non-organic components as technical nutrients. Just as biological nutrients are used by natural processes, technical nutrients should be reused in technical processes.
The Cradle to Cradle Products Innovation Institute [79] has taken this concept beyond the conceptual phase and created a process to certify products using their Cradle to Cradle CertifiedTM product standard [80]. The standard is described as follows:
The Cradle to Cradle Certified [81]™ Product Standard [81] guides designers and manufacturers through a continual improvement process that looks at a product through five quality categories — material health, material reutilization, renewable energy and carbon management, water stewardship, and social fairness. A product receives an achievement level in each category — Basic, Bronze, Silver, Gold, or Platinum — with the lowest achievement level representing the product’s overall mark.
Product assessments are performed by a qualified independent organization trained by the Institute [82]. Assessment Summary Reports are reviewed by the Institute, which certifies products meeting the Standard requirements, and licenses the use of the Cradle to Cradle Certified™ word and design marks to the product manufacturer. Every two years, manufacturers must demonstrate good faith efforts to improve their products in order to have their products recertified.
The five quality categories [83] are as follows:
Material Health: Knowing the chemical ingredients of every material in a product, and optimizing towards safer materials.
Material Reutilization: Designing products made with materials that come from and can safely return to nature or industry.
Renewable Energy & Carbon Management: Envisioning a future in which all manufacturing is powered by 100% clean renewable energy.
Water Stewardship: Manage clean water as a precious resource and an essential human right.
Social Fairness: Design operations to honor all people and natural systems affected by the creation, use, disposal or reuse of a product.
If a product would like to go for C2C certification, it is evaluated based on these five categories. It receives a score in each category - basic, bronze, silver, gold, or platinum. These are also the five levels of cradle to cradle certification. The certification level is based on the lowest score that the product receives in these categories. For example, if a product earns a "gold" score in material health, material reutilization, renewable energy & carbon management, and water stewardship, but only earns a "basic" score in social fairness, then the product is certified as "basic." Another important aspect to point out is that all products must be recertified every two years, and in that time, must demonstrate good faith efforts to improve the products.
Summary and Final Tasks
Summary
By now, you should be able to do all of the following:
- define natural resources;
- describe why the term "natural resources" is anthropocentric;
- analyze the difference between linear and circular resource flows;
- describe the differences between reduction, reuse, and recycling; and
- identify components of the circular economy and cradle to cradle certification.
Reminder - Complete all of the Lesson 8 tasks!
You have reached the end of Lesson 8! Double-check the to-do list on the Lesson 8 Overview page [84] to make sure you have completed all of the activities listed there before you begin Lesson 9.
Lesson 4: Food and Farming
Overview
The focus of this lesson is to consider the negative sustainability impacts of food production, and investigate solutions to these problems.
Learning Outcomes
By the end of this lesson, you should be able to:
- analyze the water footprint of various foods;
- describe how improper fertilizer management causes dead zones;
- define eutrophication;
- describe the sustainability implications of food deserts and food insecurity;
- demonstrate an understanding of permaculture philosophy and principles;
- describe regenerative agriculture and appropriate technology;
- analyze the sustainability impacts of community gardens; and
- explain the benefits of fair trade certification.
Lesson Roadmap
| To Read | Lesson 9 Online Content | You're here! |
|---|---|---|
| To Do |
|
|
Questions?
If you have any general course questions, please post them to our HAVE A QUESTION discussion forum located under the Discussions tab in Canvas. I will check that discussion forum regularly to respond as appropriate. While you are there, feel free to post your own responses and comments if you are able to help out a classmate. If you have a question but would like to remain anonymous to the other students, email me through Canvas.
If you have something related to the material that you'd like to share, feel free to post to the Coffee Shop forum, also under the Discussions tab in Canvas.
Food and Sustainability
Other than energy, it is through food that most of us most frequently directly interact with sustainability. Humans cannot survive without food, and most (and probably all) of you reading this eat multiple meals each day. The food industry has immense sustainability implications, including soil health and conservation, water use, forest clear-cutting, environmental and social justice, economics and equity, and much more. The following provides some insight into a few of these issues.
Water Use
You probably recall from a previous lesson that irrigation is the single biggest user of freshwater in the United States. You may also recall the large water footprint of some common foods. The following are footprints of common main dishes, according to the Water Footprint Network [85] (see Water Footprint report [86]). (Note that these are global averages. Also, 1 litre/kg equals about 0.12 gal/lb.):
- beef: 15,400 litre/kg (1,848 gal/lb)
- sheep: 10,400 litre/kg (1,248 gal/lb)
- pig: 6,000 litre/kg (720 gal/lb)
- chicken: 4,325 litre/kg (519 gal/lb)
- tofu: 2,517 litre/lb (302 gal/lb)
- rice: 2,497 litre/kg (300 gal/lb)
- pasta: 1,849 litre/kg (222 gal/lb)
If you are interested, the Huffington Post does a nice job of comparing the water footprint of common foods [87]. (They use Water Footprint Network data.)
Almost all of the water used in producing meat is the result of irrigating the crops that are used to feed the animals, and some irrigation methods are more efficient than others. (Oregon State University Cooperative Extension provides a good analysis of various irrigation techniques [88] if you are interested in learning more.)
Dead Zones
One sustainability impact that happens on more of a macro scale is something called a "dead zone." The National Oceanic and Atmospheric Administration (NOAA) explains dead zones [89] thus:
Less oxygen dissolved in the water is often referred to as a “dead zone” because most marine life either dies, or, if they are mobile such as fish, leave the area. Habitats that would normally be teeming with life become, essentially, biological deserts.
Hypoxic zones can occur naturally, but scientists are concerned about the areas created or enhanced by human activity. There are many physical, chemical, and biological factors that combine to create dead zones, but nutrient pollution is the primary cause of those zones created by humans. Excess nutrients that run off land or are piped as wastewater into rivers and coasts can stimulate an overgrowth of algae, which then sinks and decomposes in the water. The decomposition process consumes oxygen and depletes the supply available to healthy marine life.
Dead zones occur in many areas of the country, particularly along the East Coast, the Gulf of Mexico, and the Great Lakes, but there is no part of the country or the world that is immune. The second largest dead zone in the world is located in the U.S., in the northern Gulf of Mexico.
Dead zones happen all over the world and are in fact a natural occurrence. However, humans have significantly increased the incidence of dead zones, including the one in the Gulf of Mexico, which grows to about the size of New Jersey every summer, as you will see in the video below. These dead zones are caused by eutrophication, which is when a body of water has an excessive amount of nutrients (primarily nitrogen and phosphorous) that lead to unusually high plant/algae growth. (Note that eutrophication just refers to excess nutrients, but this often results in a dead zone.) When eutrophic streams and rivers empty into ponds, lakes, or other open bodies of water (such as the Gulf of Mexico), it causes excessive algae growth and ultimately leads to anoxic ("oxygen-less") conditions near the bottom of these bodies of water. NOAA does a good job of explaining eutrophication in the video below.
What is eutrophication? It’s a problem that should matter to you, whether you live near the ocean or not. That’s because it begins wherever people live and ends with damage to resources we all use and enjoy. It all starts when nutrients get into lakes and oceans. Remember, what’s waste to humans can be food to plants and other creatures. Nutrients feed algae like they do other plants. Algae grows and blocks sunlight. Plants die without sunlight. Eventually, the algae die too. Bacteria digest the dead plants, using up remaining oxygen, and giving off carbon dioxide. If they can’t swim away, fish and other wildlife become unhealthy or die without oxygen. But it doesn’t have to be this way. Protecting marine resources starts with sound agricultural and waste management practices.
Eutrophication has a few anthropogenic causes, but the primary one is the use of artificial fertilizers on farms. Fertilizers feed plants, but if they get into bodies of water they feed algae. The video below from NOAA provides a good explanation of this. Please note that the explanation at the end of the video of what causes the dead zone is incomplete: waste from organisms that eat the phytoplankton plays a role in the dead zone, but (as described in the video above) the main cause of dead zones is when bacteria eat the dead phytoplankton after they sink to the bottom.
Did you know that half of the oxygen that we breathe comes from tiny organisms that live in the ocean? It's true! These microscopic marine organisms, called phytoplankton, produce oxygen just like land plants. But phytoplankton are not plants, they are Protists, single celled organisms. They are so small that thousands of them can fit in a single drop of water. In order to study phytoplankton, scientists often use microscopes... or satellites.
From space we see Earth like this. But some satellites see Earth like this… a dance of rainbow colors. In this case, the colors represent the concentration of phytoplankton in the ocean: red is high concentration; blue is low concentration.
Phytoplankton depend on nutrients and proper temperature and light conditions to grow and reproduce. Coastal areas are extremely rich in nutrients, which have been washed off the land by rivers. Areas such as the open ocean have lower concentrations of phytoplankton because of the limited amount of nutrients there.
The mouth of the Mississippi River is a perfect example of how nutrient run-off creates plankton blooms. 41% of the United States drains into the Mississippi River and then out to the Gulf of Mexico. That's a total of 3.2 million square kilometers of land or about 600 million football fields. About 12 million people live in urban areas that border the Mississippi, and this area constantly discharges treated sewage into rivers. However, the majority of the land in the Mississippi Watershed is farmland. Each spring as farmers fertilize their lands preparing for crop season, rain washes fertilizer off the land and into streams and rivers. All of the urban and farm discharges include nutrients such as nitrogen and phosphorus that are very important for the growth of phytoplankton. Incredibly, about 1.7 million tons of these nutrients are dumped into the Gulf of Mexico every year.
Once the Gulf of Mexico receives this huge influx of nutrients, massive phytoplankton blooms occur. These blooms result in an area called the dead zone with such low oxygen concentrations that few organisms can survive there.
But if phytoplankton blooms produce oxygen, then why does a Dead Zone occur? For animals, such as microscopic zooplankton and fish, phytoplankton blooms are like an all-you-can-eat buffet. Small animals eat the phytoplankton, and are, in turn, eaten by bigger fish. All along, these animals are releasing waste, which falls to the bottom of the gulf. There lurk bacteria that decompose the waste, and in the process use up the oxygen, creating hypoxic conditions. The different densities of freshwater from the Mississippi and saltwater from the Gulf create barriers that prevent mixing between the surface and deep waters. Soon there is not enough oxygen for other organisms to use. The Dead Zone has arrived. But as summer turns to fall, winds helps stir up the water, allowing the layers to mix and replenish oxygen throughout the water. Eventually, the Gulf and its fish populations return to normal. Until next year...
Food Deserts
Over the past 10 - 15 years, food deserts have (slowly) become a more prominent issue. The following is a summary from the U.S. Centers for Disease Control [90] (emphasis added):
Food Desert
Food deserts are areas that lack access to affordable fruits, vegetables, whole grains, low-fat milk, and other foods that make up a full and healthy diet (1). Many Americans living in rural, minority, or low-income areas are subjected to food deserts and may be unable to access affordable, healthy foods, leaving their diets lacking essential nutrients.What's the Problem?
Rural, minority, and low income areas are often the sites of food deserts because they lack large, retail food markets and have a higher number of convenience stores, where healthy foods are less available (2). Studies have shown that food deserts can negatively affect health outcomes but more research must be done to show how that influence occurs. There appears to be a link between access to affordable nutritious foods and the eating of these foods, meaning less access may lead to less incorporation of healthy foods into the populations’ diets.Who's at Risk?
Because there is no standard definition of a food desert, estimates of how much of the population is affected vary by quite a bit. However, it’s safe to say that many Americans have limited access to affordable nutritious foods because they do not live near a supermarket or large grocery store. Transportation is specifically part of the USDA food desert definition. Only common theme among food desert definitions is that there is limited access.Can It Be Prevented?
Food deserts can be improved through several different types of efforts. Establishing a community garden where participants share in the maintenance and products of the garden and organizing local farmers markets are two efforts that community members themselves can do (3, 4). Local governments can improve local transportation like buses and metros to allow for easier access to established markets (5). They can also change zoning codes and offer economic or tax incentives to attract retailers with healthier food offerings to the area (6).The Bottom Line
Food deserts are a big problem for many Americans that may limit their ability to eat healthy and nutritious foods on a regular basis. However, there are a variety of ways that local governments and community members can both improve food access in their neighborhoods.Case Example
Maria is a 60-year-old woman living in a low-income area of St. Louis. As she’s gotten older, she hasn’t been able to get around as well and doesn’t have a car. She usually eats a lot of unhealthy and microwavable foods because the closest store to her apartment is the local convenience store around the corner. She wishes that she could eat better and begins talking to some of her neighbors and other families in the building to get their input. Maria and her next-door neighbor Sylvia organize all the residents in their building to establish a community garden on the roof of the building so that they will all have fresh fruits and vegetables to share.
As indicated above, there is no one definition of a food desert, but it is meant to indicate a lack of access to fresh foods. The U.S. Department of Agriculture (USDA) considers three ways to define a food desert [91]. (The number of people in the U.S. in each category as of 2017 are in parentheses.):
- "Low-income census tracts where a significant number (at least 500 people) or share (at least 33 percent) of the population is greater than ½ mile from the nearest supermarket, supercenter, or large grocery store for an urban area or greater than 10 miles for a rural area." (54.4 million, 17.7% of the population)
- "Low-income census tracts where a significant number (at least 500 people) or share (at least 33 percent) of the population is greater than 1.0 mile from the nearest supermarket, supercenter, or large grocery store for an urban area or greater than 10 miles for a rural area." (19 million, 6.2% of the population)
- "Low-income census tracts where a significant number (at least 500 people) or share (at least 33 percent) of the population is greater than 1.0 mile from the nearest supermarket, supercenter, or large grocery store for an urban area or greater than 20 miles for a rural area." (17.3 million, 5.6% of the population)
The USDA has created a Food Access Research Atlas (available here) [92], where you can explore food deserts across the U.S. Feel free to tool around with it. (You will have to explore it for this week's quiz.)
Food Insecurity
A topic closely related to food deserts is food insecurity. The USDA defines food insecurity [93] and very low food security as follows:
- Food insecurity: "Food-insecure households (those with low and very low food security) had difficulty at some time during the year providing enough food for all their members due to a lack of resources."
- Very low food security: "In this more severe range of food insecurity, the food intake of some household members was reduced and normal eating patterns were disrupted at times during the year due to limited resources."
The USDA provides an annual report and analysis on food insecurity in the U.S. through its Economic Research Service. Highlights (okay, lowlights) from the "Household Food Security in the United States 2017 [94]" report summary (full Household Food Security [95]report available here [95]) include:
- "An estimated 11.8 percent of U.S. households were food insecure in 2017, down from 2016 and continuing a decline from a high of 14.9 percent in 2011, while still above the pre-recession (2007) level of 11.1 percent"
- 11.8% of U.S. households were food insecure, which equates to 15.0 million households!
- 4.5% had very low food security, which equates to 5.8 million households.
- 2.9 million households with children (7.7% of all households) were food insecure.
- 250,000 households with children (0.7% of all households) had very low food security.
- "Rates of food insecurity were higher than the national average for the following groups: households with incomes near or below the Federal poverty line, all households with children and particularly households with children headed by single women or single men, women and men living alone, Black and Hispanic-headed households, and households in principal cities and nonmetropolitan areas."
Permaculture
What is Permaculture?
Permaculture is another one of those concepts that have no single definition, but I like the succinct definition offered by Geoff Lawton [96], one of the more well-known permaculture teachers and practitioners in the world when he stated that permaculture is "a system of design that provides all of the needs for humanity in a way that benefits the environment." Another way to describe it is "designing human systems to mimic natural systems" and "designing systems that work with nature instead of against it." No matter how you define it, it refers to a design system - it integrates concepts from a wide array of disciplines/topics (hydrology, soil science, biology, ecology, renewable energy, forestry, and more) - and utilizes them when designing systems, such as gardens, farms, houses, neighborhoods, and more. It is most commonly used to design food systems, though. Everything from a backyard garden to a large farm can be designed using these principles.
The concept and term "permaculture" was coined by Bill Mollison and David Holmgren in Australia in the 1970s. It was originally a concatenation of the terms "permanent agriculture" because it initially focused on food production systems, but came to be known as a shortened form of "permanent culture" because it can be used to address all aspects of human culture/settlements.
To Read Now
The Permaculture Research Institute provides an excellent one-page description of permaculture. Please read through it before continuing.
- "What is permaculture? [97]"
The following are some highlights from the reading:
- "Permaculture integrates land, resources, people and the environment through mutually beneficial synergies – imitating the no waste, closed loop systems seen in diverse natural systems." This should sound familiar! A well-designed permaculture system will have little/no waste, and may actually make the local natural environment better than it was before. As they indicate later on the page: "It is the harmonious integration of landscape and people — providing their food, energy, shelter, and other material and non-material needs in a sustainable way."
- Permaculture "is a multidisciplinary toolbox." It integrates many disciplines, as indicated above.
- "The philosophy behind permaculture is one of working with, rather than against, nature; of protracted and thoughtful observation...and allowing systems to demonstrate their own evolutions." Observation of how existing natural systems work is a key component of permaculture.
- "Recycling of nutrients and energy in nature is a function of many species. In our gardens, it is our own responsibility to return wastes (via compost or mulch) to the soil and plants, "but we rely on nature to replenish natural resources such as clean water and air, so "even anthropocentric people would be well-advised to pay close attention to, and to assist in, conservation of existing forests and to assist in the conservation of all existing species and allow them a place to live."
I want you to consider one additional concept that is mentioned in this summary. They mention that permaculture helps establish resilience. Resilience can be thought of as the ability to return to an original state after encountering a shock to the system. This has become a major focus of sustainability efforts. People recognize that "bad" things such as climate change, oil price spikes, and economic collapse will happen, but we do not know when. Much effort in sustainability design, thought, and policy is focused on establishing resilient communities (and cities, states, and countries) that will be able to withstand such shocks in such a way that suffering and distress will be minimized.
From a climate change perspective, this is primarily a focus on adaptation, i.e., adapting our communities to thrive in an uncertain climate future. This usually involves things such as using renewable energy (and not relying entirely on the national grid, e.g.), producing food locally (instead of relying on world markets), mitigating and/or avoiding flooding in low-lying areas, using more low-carbon transportation methods (e.g., bike and pedestrian infrastructure) and in general becoming more self-sufficient. This is a major focus of the Transition Town movement [98], but cities, towns, and states/provinces all over the world have engaged in planning for resiliency. For example, the state of Colorado has its own Resiliency Resource Center [99], which is operated out of the Department of Local Affairs.
The video below summarizes a lot of these concepts and adds a few others. It also provides a few examples of permaculture.
[ON SCREEN TEXT:] "If your food comes from the grocery store and your water from a tap you will defend to the death the system that brings these to you because your life depends on it...[but] If your food comes from a land base and if your water comes from a river you will defend to the death these systems." - Derrick Jensen
If you happen to pick up a newspaper these days, you'll probably find a growing sense of despair regarding climate change and environmental degradation, but there's been an astounding effort from countless communities to cull the rising tide of environmentally irresponsible actions. And among the surge of modern nature related groups and philosophies lies the promising ideas of permaculture which, when unpacked, provides us with a solid toolkit for not only tackling the difficult environmental challenges ahead, but also for thriving in a transformed world.
Permaculture, a term coined by Australians Bill Mollison and David Holmgren in their 1978 book Permaculture One, was originally a contraction of permanent and agriculture, but has since blossomed into a more inclusive combination of permanent and culture. As Mollison readily admits, permaculture is nebulous. "It's a little difficult to define what the permaculture community is." But those two words permanent and culture hit at the philosophy behind permaculture in the sense that it gives people a set of tools to rethink and redesign their communities so that they can live seamlessly with the natural world. And by working with, rather than against, nature in order to grow food, for example, permaculture bolsters not only the health of the land but also its practitioners. In doing so, the concepts and practices of permaculture build communities that are adaptable to a changing climate.
Jono Neiger sums up these ideas in his book Permaculture Promise wherein he writes,“Permaculture is about rebuilding much needed relationships with the people, land and systems that support us.” Through these relationships and a positive approach to change, agriculture seeks to build resilient cultures and communities. At the core of permaculture teaching lies three ethics: earth care, people care, and fair share. While earth care and people care at their simplest forms are the concerted efforts to nurture natural environments and surrounding communities in your everyday actions, fair share is a bit less self-explanatory. The concept of fair share is essentially the synthesis of earth and people care. It acknowledges that there is one earth that we all need to live on. So surplus, whether that's food, money, or time should be shared with those who are otherwise languishing or be returned back to the earth. These three ethics ultimately intertwine to create an effective moral base on which permaculture practitioners can build and transform their local systems. They're essentially guideposts for tangible change.
In practice, permaculture can take a variety of shapes. For instance Jordan Osmond over at Happen films toured Purple Pear farm, an excellent example of permaculture at work wherein each natural system feeds off each other, thus creating both abundant food for the farmer and a healthier ecosystem. But permaculture can also mean projects like City Repair in Portland which applies permaculture principles to artistic and ecologically minded projects that help reinvigorate local community relationships and the natural world.
Now more than ever, permaculture is important because it brings to the table tangible and ethically based solutions for systemic change. It moves beyond sustainability and into resilience. Looking towards not only surviving, but thriving in a quickly changing natural world. Starting at a local and personal level, the concepts of permaculture work to wean people off an industrialized and consumption centric worldview and replace that materialistic perspective with a new outlook that emphasizes ethical interactions with nature and a community-oriented lifestyle.
Ultimately, this new worldview brings us closer to appreciating the source of our sustenance and our desire for interpersonal connection. And if we can rekindle this understanding that we need thriving natural systems to live, as Derrick Jensen said so perfectly at the beginning of this video, we will then defend those natural systems to the death.
This video is made possible in part by the wonderful people who support me on Patreon. If you're interested in helping me grow this channel, head on over to Patreon and pledge a small amount of money for every video I release. In return, I'll send you gifts like a handwritten thank you note or an Our Changing Climate sticker. As always if you like what you just saw share it around and subscribe. Thanks so much for watching and I'll see you next Friday.
Most of this reiterates much of what is written above, but there are a few more things I'd like to point out:
- First, I think the quote from Derrick Jensen provides important perspective: "If your food comes from the grocery store and your water from a tap you will defend to the death the system that brings these to you because your life depends on it...[but] If your food comes from a land base and if your water comes from a river you will defend to the death these systems." This speaks to one of the problems with our modern food (and consumer) system. Namely, that we are disconnected from the sources of our food (and other products). One negative impact of this is that it allows all of the hidden impacts that have been detailed throughout this course and EM SC 240N, such as water footprint, carbon footprint, ecological footprint, and social/environmental injustice to occur. If we were able to see the true negative impacts of these systems, it is more likely that we would address these problems. Permaculture is one way of many to reconnect us to the sources of our food and other products.
- He mentions that building "resilient cultures and communities" is at the core of permaculture. Again, resilience is a very important topic in sustainability.
- There are three ethics of permaculture, which you will see quoted a lot in permaculture literature. These are meant to underlie all permaculture systems:
- Earth care, which refers to attempting to eliminate negative impacts on the natural environment, or if possible, to actually helping regenerate natural systems.
- People care, which refers to doing everything we can to help as many people as possible.
- Fair share, which refers to always keeping in mind to "share the surplus," whether it be food, money, time, expertise, etc.
- He shows an example of a permaculture farm "where each natural system feeds off each other, thus creating both abundant food for the farmer and a healthier ecosystem." There are examples of this all over the world, but almost all of them share in common the idea that the whole farm/garden should work together as a system and actually improve the local ecosystem, for example by attracting beneficial insects, providing habitat for birds and other animals, and rebuilding soil.
- He also describes an example of more urban-focused permaculture "which applies permaculture principles to artistic and ecologically-minded projects that help reinvigorate local community relationships and the natural world." Permaculture principles will be described in more detail below.
- He notes that permaculture "brings to the table tangible and ethically based solutions for systemic change" and that it seeks to design systems that allow people not only to "survive" but to "thrive." Permaculture focuses on understanding the nature of many sustainability problems, but more importantly on ways to apply practical solutions to these problems. Permaculturalists are "doers" - it is a very solutions-focused, action-oriented concept. Permaculturalists like to discuss things, but they are usually more focused on doing things!
- He also mentions that permaculture seeks to "replace that materialistic perspective with a new outlook that emphasizes ethical interactions with nature and a community-oriented lifestyle." Permaculture is a holistic philosophy that seeks systemic change. Like some of the other content you have seen (e.g., circular economy), they recognize that our systems are not designed properly. Permaculture is also very community-oriented, and in fact, interacting with diverse people and ideas is one of the core principles of permaculture.
Permaculture Design Principles
Hopefully, by now you have a solid understanding of what permaculture is, as well as its core ethics. Permaculture also has a set of 12 principles that should be used to guide all design decisions. The video below from Oregon State University provides a good overview of these principles, and examples of how they can be applied. You will not be expected to memorize them, but it will be helpful to have a general understanding of each.
We’re arrived at the final element of the Permaculture Decision Making Matrix, the Permaculture design principles. Here are my two favorite books, which are the source of the principles. Bill Mollison included a comprehensive list of principles in the Permaculture Designer’s Manual, and later on David Holmgren consolidated and repackaged the principles into 12 in his book, “Permaculture Principles and Pathways beyond sustainability.” So for simplicity’s sake, I’ll present to you Holmgren’s 12 principles.
Principle 1 is “Observe and Interact,” and this is essentially what we’ve been talking about for this entire course thus far. Where am I? What are the forces present on my site that I need to design for? Climate, topography, water, soils, vegetation, wildlife, wind, fire, people, these are some of the elements that are part of our observations.
Principle 2 is “Catch and Store Energy.” Energy is not just electricity, but stored water represents potential energy in the form of irrigation water for future crops. The biomass of a forest represents a living storage of building materials, fuel, nutrients and water. Alternative energy systems can turn wind, sun, and flowing water into electrical energy. So this principle gives us the directive to capture and grow surpluses in our system.
Principle 3 is “Obtain a Yield.” This principle promotes self-reliance and gives us the directive to reap a harvest from our Permaculture system, because you can’t work on an empty stomach. This principle is relevant when making a choice about which tree to plant in a location. Always choose the one with greater and more diverse yields over an ornamental plant. Yields are not just food. Yields can be building materials, fuel wood, nectar for honey. But plenty of food growing all around you is true security.
Principle 4 is “Apply Self-Regulation and Accept Feedback.” This principle directs us to live simply and consciously, limit our own consumption, because no one else is going to do that for us. We need to keep our own consumption and emissions in check because that is our responsibility when we care for Earth and care for people. Accepting feedback means that learning from our successes and mistakes is an imperative, and should lead to better choices as we learn what works and what doesn’t.
Principle 5 is “Use and Value Renewable Resources.” Renewable resources are those which replenish with modest use. This could be sustainable forestry or fishing practices. This could mean planting an orchard downslope from a forest to take advantage of the nutrient and water drift that continually moves down the hill. This is the wind. This is the fact that plants and animals breed, and if we are responsible and careful, many of these resources can provide in perpetuity.
Principle 6 is “Produce No Waste.” This is where we make the waste of one part of our system the food for another. This means we compost, clean and recycle greywater, repair and repurpose broken tools and equipment. Reduce, reuse, repair, recycle. This also means we don’t waste people by having them do hazardous and meaningless work.
Principle 7 is “Design From Patterns to Details.” This is one of my personal favorites. It means that first we study the climate, topography, watershed, ecology, and we get a big picture vision of how we can interact with the land and community in a regenerative way, and then our design decisions are based on that. So this road I just drew in is placed in a way where it harvests the water for this pond. The detail of road placement was based on the overall pattern of water flow in the landscape.
Principle 8 is “Integrate Rather Than Segregate.” This principle says that the more relationships between parts of your systems, the stronger, more productive and more resilient your system becomes. This has to do with community as well. I drew a cluster of dwellings where a cooperative community can get much more done than an individual. Many hands make light work.
Principle 9 is “Use Small and Slow Solutions.” I’ve gone ahead and harvested some of the trees on the forest edge to use for fence posts and replaced them with nut trees that will start bearing in about 10-12 years, and will then live for hundreds of years. I’ve planted new trees over here, which will be new fence posts when these ones rot. I’ve also inoculated edible mushrooms into the stumps of the trees I cut, which will produce for years and then spread to others with the fallen wood. These are all examples of playing the long game, using the small and slow design principle.
Principle 10 is “Use and Value Diversity.” You can see we’ve got housing, gardens, wind power, water storage, composting, greywater, forestry, orchards, and now I’ve added in rotational grazing of animals, both here and in the orchard. I’ve also added more trees and gardens around the homestead, and fish to the pond. Diversity is one of the key aspects of Permaculture. We want to conserve diverse native habitats, and make our human habitats rich with an abundance of many productive elements. Diversity is also resilience: if one part of our system fails, there are others that will thrive.
Principle 11 is “Use Edges and Value the Marginal.” I’ve added edible hedgerows around the animal paddocks, and along the road. I’ve also added bamboo down below the pond, which will be sub-irrigated by water that seeps down. The edges and margins are great locations to add more productive species or habitat zones. And I can use them to create further layers of productivity.
Principle 12 is “Creatively Use and Respond to Change.” I noticed that with the orchards and hedgerows growing in, the forest soils growing spongier from mushroom inoculation, and the soils building from the animal rotation, water has begun to move much more slowly down the hillside. So much so, that this area at the bottom of the hill is becoming somewhat of a marsh. Well, that wasn’t what I planned, but I’m going to creatively use that change, and I’m going to carve out some low areas that’ll stay really wet, which I can use to grow edible wetland plants, and then simultaneously build up these peninsulas, full of edge to grow productive trees which will get their roots down in this water table. Wow, I didn’t even see that yield coming, but there you have it. The Permaculture principles in action!
Permacultureprinciples.com provides an excellent in-depth explanation [100] of each of these principles and also provides a ton of examples of each principle. If you want to explore any of the principles more (this is optional but strongly suggested if/when you have some time), including examples of concrete applications, click on the links to each item below. They even have a song for each principle, which is a nice touch! All quotes are taken from the permacultureprinciples.com site.
- Observe and interact [101]: "By taking the time to engage with nature we can design solutions that suit our particular situation." The most essential step before designing any system is to first observe. You should always seek to utilize immediate resources, e.g., when planning a garden, observe where the sunlight is at certain times, where the wet areas are, where the wind blows through, etc.
- Catch and store energy [102]: "By developing systems that collect resources when they are abundant, we can use them in times of need." Capturing rainwater and utilizing naturally produced fertilizer and mulch are some examples of this.
- Obtain a yield [103]: "Ensure that you are getting truly useful rewards as part of the work that you are doing." Permaculture systems should be productive, e.g., a garden that produces an abundance of food.
- Apply self-regulation and accept feedback [104]: "We need to discourage inappropriate activity to ensure that systems can continue to function well." This goes with observation, but after you have deployed a system, you should ALWAYS look for feedback from the local environment, and adjust accordingly to optimize the system, e.g., if you design a park in a city, but find that people are not using it because it is difficult to get to, think about finding ways to get people there (e.g., a bike path or bus route) or repurpose it (e.g., an urban farm). An important corollary of this is turning problems into solutions, e.g., if you are designing a garden and there is a wet area, grow plants that like a lot of water or divert the water to a drier area.
- Use and value renewable resources and services [105]: "Make the best use of nature’s abundance to reduce our consumptive behaviour and dependence on non-renewable resources." Use renewable resources at a sustainable rate!
- Produce no waste [106]: "By valuing and making use of all the resources that are available to us, nothing goes to waste." Remember, we should design systems like nature does. There is no waste in nature! Waste should be used as a resource, e.g., in a food system you should reintegrate unused organic material into the soil through composting. This goes along with turning problems into solutions.
- Design from patterns to details [107]: "By stepping back, we can observe patterns in nature and society. These can form the backbone of our designs, with the details filled in as we go." Permaculturalists use a lot of natural designs as the basis for intentional design, e.g., by using natural materials and shapes when designing buildings.
- Integrate rather than segregate [108]: "By putting the right things in the right place, relationships develop between them and they support each other." Permaculture focuses on relationships and connections, always looking at the system as a whole. An important corollary of this is to have single things serve multiple functions, e.g., permaculture gardens often use chickens because they provide food, they aerate the soil by scratching it, they eat pests that can destroy crops, and they provide natural fertilizer through manure. Bicycling is another example - it provides exercise, reduces emissions, and allows for more personal connections with the local community.
- Use small and slow solutions [109]: "Small and slow systems are easier to maintain than big ones, making better use of local resources and producing more sustainable outcomes." Think in terms of years and decades when making designs, not weeks or months.
- Use and value diversity [110]: "Diversity reduces vulnerability to a variety of threats and takes advantage of the unique nature of the environment in which it resides." Diverse systems are more resilient, e.g., if you have a biodiverse field or farm and one crop/plant is destroyed by a pest, there are other species remaining to provide resources.
- Use edges and value the marginal [111]: "The interface between things is where the most interesting events take place. These are often the most valuable, diverse and productive elements in the system." This goes hand-in-hand with the previous principle. Diverse systems are more innovative, e.g., a group of people with a diverse set of skills is more creative, and can more easily adapt to a variety of problems.
- Creatively use and respond to change [112]: "We can have a positive impact on inevitable change by carefully observing, and then intervening at the right time." Again, you should constantly observe and adjust.
One other thing that I'd like to note before moving on is that while remembering and applying these principles takes a lot of effort, a properly designed permaculture system significantly minimizes effort once it is established! For example, a well-designed permaculture garden will require almost no active watering (it should be rain-fed), does not require the constant addition of fertilizers (it should be mostly self-sufficient), does not need pesticides (most pests should be eliminated by beneficial insects, chickens, or other natural biological solutions, and things like proper air flow and sunlight), and it minimizes replanting (true permaculture uses mostly perennials, not annual plants). A properly designed urban environment will optimize the use of local resources such as renewable energy, local food sources, and low-impact transportation. Such an urban system should also provide resources to help all people thrive, thus minimizing the need for social services.
Permaculture Summary
Please note that people spend their whole lives researching and applying permaculture - we are only scratching the surface! But hopefully, you have a reasonably good understanding of what permaculture is and how it can be applied. The following is a brief summary of some key points:
- Permaculture can be thought of as "a system of design that provides all of the needs for humanity in a way that benefits the environment." Another way to describe it is "designing human systems to mimic natural systems" and "designing systems that work with nature instead of against it."
- Permaculture integrates a number of disciplines together to apply practical solutions to sustainability problems. It effectively integrates all of the sustainability concepts that we've encountered in this course and EM SC 240N.
- Resiliency is the ability to maintain one's essential identity/character when encountering a shock to the system. It is a major focus of permaculture, and modern sustainability studies, in particular with regards to climate change. Transition towns focus on resilience and have been established all over the world.
- Permaculture focuses mostly on practical, local solutions and seeks to establish self-sufficiency. It is community- and action-oriented.
- Permaculture seeks to reconnect humans with the natural environment and to integrate human systems with natural environments in such a way that it not only minimizes negative impacts but enhances local natural resources to the extent possible.
- The three core ethics of permaculture are earth care, people care, and fair share. They should be considered when making all decisions.
- Permaculture is most often applied to food systems of every scale, but can also be used to design neighborhoods and towns/cities, and even human relationships.
- A properly designed permaculture system will allow humans and nature to not only survive but thrive.
- There are 12 design principles in permaculture, and each should be considered when designing any human system of any scale.
More Sustainability Solutions and Concepts
Permaculture provides a practical framework for addressing food sustainability issues, but there are many other specific practices and concepts that can contribute solutions as well. See below for a description of a few of them. There are many more than this, but these are some that we may/will encounter when traveling.
Regenerative Agriculture
Regenerative agriculture is closely related to permaculture, but not all permaculture food production systems are regenerative. As you might guess, regenerative agriculture refers to food growing methods that improve the natural environment, i.e., they regenerate local ecosystems. Terra Genesis International [113] provides a great synopsis of this concept. Note their use of the term ecosystem services. (If you are so inclined, they have more information on their site.):
Regenerative Agriculture is a system of farming principles and practices that increases biodiversity, enriches soils, improves watersheds, and enhances ecosystem services.
Regenerative Agriculture aims to capture carbon in soil and aboveground biomass, reversing current global trends of atmospheric accumulation.
At the same time, it offers increased yields, resilience to climate instability, and higher health and vitality for farming and ranching communities.
The system draws from decades of scientific and applied research by the global communities of organic farming, agroecology, Holistic Management, and agroforestry.
Common techniques include planting native crops that enhance biodiversity, using biochar to improve soil quality and sequester carbon, integrating animals and crops into a self-sufficient system, only using organic farming methods, and more. Like permaculture, regenerative agriculture recognizes that these systems will provide feedback and change over time and that farmers must be ready to adapt their systems as needed.
Community Gardens
Community gardens are defined by the USDA [114] as "plots of land, usually in urban areas, that are rented by individuals or groups for private gardens or are for the benefit of the people caring for the garden." Community gardens can take on many forms, but the most common one consists of any number of individual beds (from a few to a hundred or more) that are tended by individuals or groups. Most community gardens are structured such that each bed is "rented" out for a nominal annual fee, and the renter manages their bed. Community gardens typically supply water and soil, and sometimes resources such as seeds and labor assistance. They are usually overseen by a manager, but they often host group events and expect individual gardeners to help out with tasks that benefit the whole garden community. These are most common in urban areas where residents do not possess adequate space to grow their own food but can be found in many other areas. They can be found all over the world. Most gardens have a set of rules governing them, such as the types of plants they can grow and what they can use in their beds (e.g., by only using organic growing methods).
Community gardens can also take the form of school gardens located on or near school property. They can be established in elementary, middle, high school, and college environments. The goals of school gardens usually include garden, food, and/or nutrition education, though many urban gardens provide this service as well. Therapy gardens are sometimes established so that they can be accessed by people with physical and/or mental issues, as gardening has therapeutic effects. Many gardens include initiatives to grow food to donate to local organizations such as food banks.
Research has shown that there are many benefits to community gardens, including but not limited to the following. (All links originally gathered from North Carolina State University Cooperative Extension [115]:
- Increased access to and intake of nutritional food. For example, this study in Denver, Colorado [116] found that: "Community gardeners consumed fruits and vegetables 5.7 times per day, compared with home gardeners (4.6 times per day) and nongardeners (3.9 times per day). Moreover, 56% of community gardeners met national recommendations to consume fruits and vegetables at least 5 times per day, compared with 37% of home gardeners and 25% of nongardeners."
- General social benefits. This study in Flint, Michigan found that: "Results suggest that the garden programs provided opportunities for constructive activities, contributions to the community, relationship and interpersonal skill development, informal social control, exploring cognitive and behavioral competence, and improved nutrition. Community gardens promoted developmental assets for involved youth while improving their access to and consumption of healthy foods."
- Community development. A study in New York City [117] found that "the opening of a community garden has a statistically significant positive impact on residential properties within 1000 feet of the garden, and that the impact increases over time. We find that gardens have the greatest impact in the most disadvantaged neighborhoods. Higher quality gardens have the greatest positive impact. Finally, we find that the opening of a garden is associated with other changes in the neighborhood, such as increasing rates of homeownership, and thus may be serving as catalysts for economic redevelopment of the community."
- Particular benefits for low-income communities. Another New York study [118] found that: "Gardens in low-income neighborhoods (46%) were four times as likely as non-low-income gardens to lead to other issues in the neighborhood being addressed; reportedly due to organizing facilitated through the community gardens." This is a very common finding of community garden research in low-income communities.
- Stress relief. A 2010 study [119] concluded that: "Gardening and reading each led to [reduction in stress signals], but decreases were significantly stronger in the gardening group. Positive mood was fully restored after gardening but further deteriorated during reading. These findings provide the first experimental evidence that gardening can promote relief from acute stress."
There are many more studies that demonstrate the benefits of community gardens. If you have ever participated in one, you would probably be able to list a few more! It is important to note that research shows that the benefits of community gardens are particularly pronounced in low-income areas, and thus are a recognized strategy to address equity and social justice (but also environment and economy!).
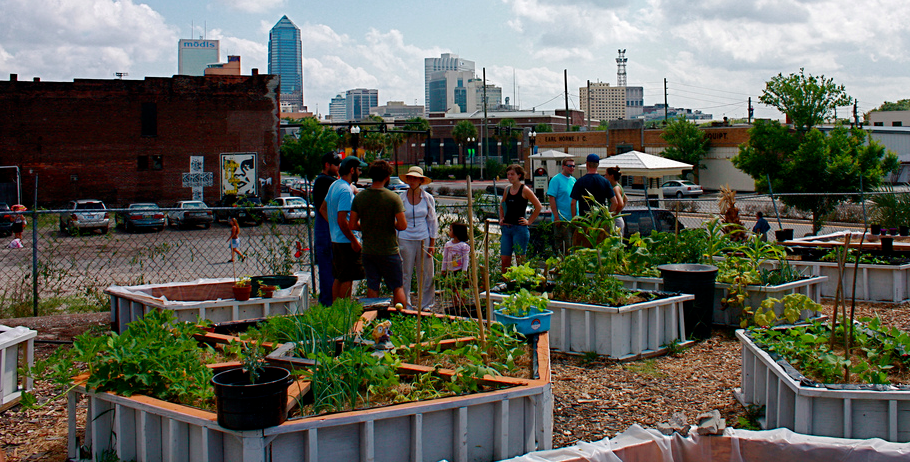

Fair Trade
You may have encountered Fair Trade goods such as coffee or chocolate when food shopping, or perhaps at a coffee shop. A fair trade good usually has a distinctive logo such as the one below. The purpose of fair trade certification is primarily to ensure that the workers throughout the supply chain were paid a fair wage. These certifications are affirmed by third-party certifiers that have no affiliation with the product at hand. They investigate the entire supply chain of the product and certify the product if it meets their standard.
One of the most common certifiers is Fair Trade Certified [122]TM (I cannot show their logo due to copyright.) They list [123] the following four standards that must be met in order to obtain certification:
- Income sustainability: ...Our standards ensure producers, workers, farmers, and fishermen have the money needed to invest in their lives and their work.
- Empowerment: Fair Trade empowers people to make choices for the good of themselves and their community, regardless of gender, status, position in society, or position on the globe. Rigorous standards give farmers, workers, and fishermen a voice in the workplace and the community.
- Individual and community well-being: ...Our model is fueled by committees of farmers, workers, and fishermen who decide how to invest the Fair Trade Premium based on their community's greatest needs: often clean water, education, and healthcare.
- Environmental stewardship: ...Our standards work to keep the planet healthy for generations to come by prohibiting the most harmful chemicals and taking measures to protect natural resources.
As you can see, fair trade can address issues beyond providing living wages. Generally speaking, it is better to buy fair trade certified goods than non-certified goods, but it is best to investigate individual certifiers to ascertain how legitimate they are.
Appropriate Technology
Merriam-Webster [124] provides a good definition of appropriate technology:
technology that is suitable to the social and economic conditions of the geographic area in which it is to be applied, is environmentally sound, and promotes self-sufficiency on the part of those using it.
The use of appropriate technology is a particularly important consideration when providing assistance to low income or otherwise marginalized communities. The idea behind appropriate technology is to make sure that any solutions proposed and/or aid provided is appropriate for the local conditions. These "conditions" can include local natural resources, but very often include local human capital, such as local knowledge, expertise, and physical capabilities. As indicated in the definition, it must promote self-sufficiency (which goes hand-in-hand with the first point).
For example, if a well-meaning organization travels to rural Mongolia or Peru to install a solar array and provide electricity, they must consider whether the locals that they are trying to help have the expertise to repair the system if it breaks down. Perhaps there is existing local expertise, or perhaps they need to be trained. Also, can they get replacement parts if they are needed? Are the solar arrays and components at risk for damage due to local wildlife or human populations? These are all questions that must be asked if self-sufficiency is to be addressed. One of the best ways to utilize appropriate technology is to work with the local populations to help them come up with solutions, instead of telling them what to do. Most likely they will have a wealth of knowledge to offer regarding the local conditions (they live there, after all!), but they likely also have experience trying to implement solutions.
The National Center for Appropriate Technology [125] in the U.S. provides a number of examples and explanations if you are so inclined. They work primarily with low-income populations in the U.S. to provide services such as energy assistance and sustainable, local food systems.
More Site Visits!
Here are some more site visits! Again, this is not required reading. I suggest browsing through them if/when you have time. This may help inspire your final project proposals!
- Sustainable Settings Farm [126], Carbondale
- Denver Urban Gardens [127], Denver
- Jackrabbit Hill Farm [128], Hotchkiss
- Jack's Solar Garden [129], Longmont
Summary and Final Tasks
Summary
By now you should be able to do all of the following:
- analyze the water footprint of various foods;
- describe how improper fertilizer management causes dead zones;
- define eutrophication;
- describe the sustainability implications of food deserts and food insecurity;
- demonstrate an understanding of permaculture philosophy and principles;
- describe regenerative agriculture and appropriate technology;
- analyze the sustainability impacts of community gardens;
- explain the benefits of fair trade certification.
Reminder - Complete all of the Lesson 9 tasks!
You have reached the end of Lesson 9! Double-check the to-do list on the Lesson 9 Overview page [130] to make sure you have completed all of the activities listed there before you begin Lesson 10.
Lesson 5: Sustainable Buildings
Add stuff here...
Overview
The focus of this lesson is on ways to evaluate the sustainability of buildings.
Learning Outcomes
By the end of this lesson, you should be able to:
- Identify and describe the five passive solar principles.
- Describe the benefits of passive design.
- Describe how LEED certification works.
- Describe what is required for a building to achieve Living Building Certification.
- Evaluate pros and cons of LEED vs. Living Building Certification.
- Describe principles of Energy Star buildings, Passive House Certification, and Energy Use Index.
- Describe the energy efficiency benefits of benchmarking.
- Evaluate the sustainability of cob, straw bale, cooperative housing, and tiny homes.
Lesson Roadmap
| To Read | Lesson 5 Online Content | You're here! |
|---|---|---|
| To Do |
|
|
Questions?
If you have any general course questions, please post them to our HAVE A QUESTION discussion forum located under the Discussions tab in Canvas. I will check that discussion forum regularly to respond as appropriate. While you are there, feel free to post your own responses and comments if you are able to help out a classmate. If you have a question but would like to remain anonymous to the other students, email me through Canvas.
If you have something related to the material that you'd like to share, feel free to post to the Coffee Shop forum, also under the Discussions tab in Canvas.
The Need for Energy Efficiency and Passive Design
I am going to start this lesson with a very simple question: What is the purpose of a building? The U.S. EPA says that [131]Americans spend on average around 90% of their lives indoors, so there must be a good reason to use them. Please think about an answer before moving on.
When you think about it, the use of buildings boils down to two primary objectives. In no particular order, these are 1) safety/securty and 2) to control the climate and to "keep nature out" of the building. There is no disputing the need for safety, from the earliest human habitations to modern buildings. Climate control is of course very important as well: Most of the things you do in buildings - eating, sleeping, gathering with family or friends, getting work done, relaxing, etc. - often require, or at least are much easier to accomplish with, some form of climate control. Have you ever tried to get a good night's sleep in a cold, pouring rain with no shelter, get some work done on your computer in the middle of an unbearably hot, humid, sunny day, or try to read a book on a cold, windy winter day? I can't say that I have, but I know it would not turn out well.
Over time, humans have gotten better and better at controlling the climate inside of buildings. While some ancient societies clearly understood the benefits of using natural means to make buildings more comfortable and minimize heating, cooling, and lighting needs (as you will see below), in the U.S. it was not until 1978 [132]that there was any federal requirement for states to enforce energy efficiency in new buildings. Two consistent feature of colonial-era buildings in the U.S. is that they were cold (they did not hold heat well in the winter) and drafty (aka leaky). This is not unique to the U.S. The United Kingdom, for example, has some of Europe's oldest building stock [133] (that is saying something, considering how old most European cities and towns are!). About 50% of residential buildings and 39% of non-residential buildings in the UK were built before energy standards were widely introduced in the 1970s (source: RICS [134]). There have been major movements in recent decades [135] to reduce energy use in UK buildings, with limited success.
That stated, buildings built after the 1970s have generally become more efficient, largely due to increasingly robust energy standards in the U.S. [136] required by the federal government (though some states, e.g. California, consistently have more stringent standards than required). Most of these codes are based on international energy standards such as the International Energy Conservation Code [137] (IECC). Technology related to things such as insulation, air sealing, and high performance windows has also improved.
Generally speaking, we are headed in the right direction in terms of energy efficiency of buildings. But anecdotal evidence and published research indicate that there are still an abundance of opportunities to improve energy efficiency. One important consideration ist that a lot of existing houses in the U.S. and elsewhere were built before energy standards were implemented. I can tell you from personal experience and from talking to folks that have been in the industry for decades that any building - commercial or residential - that was built around or before 1980 (unless it has been retrofitted) has negligible insulation and is very leaky. Modern buildings must be more efficient because of codes but are still usually built with the idea that we should just use technology such as heating and cooling equipment, insulation, air sealing, and lighting to reduce energy usage. The overall point is that very little consideration has been given to how the building can utilize the surrounding natural conditions to reduce energy usage and increase occupant comfort. Enter passive design principles.
To Read Now
Before moving on to learn about passive design, please read the following articles about the benefits of energy efficiency.
- Read the Introduction, Description, and Adoption of Energy Codes Sections of "Energy Codes And Standards [136]" from the Whole Building Design Guide (WBDG), a great resource for building energy use statistics and reduction measures and technologies.
- Read "How Much Does Energy Efficiency Cost? [138]" from the American Council for an Energy Efficient Economy (ACEEE), another excellent resource for energy efficiency research and information.
- Finally, read the "State Level Electric Energy Efficiency Potential Estimates [139]" summary from the U.S. Department of Energy. If you want more information, you can read the full report [140], watch the presentation [141] from DOE, look through the DOE PowerPoint [142], read the fact sheet [143], or see selected additional information [144] from the DOE.
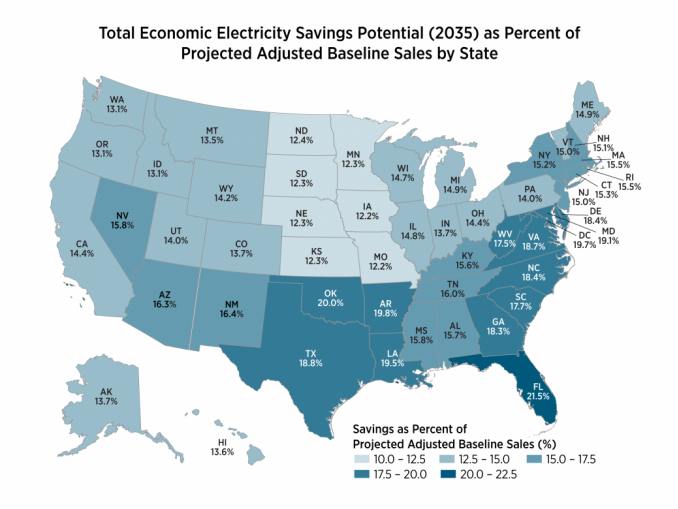
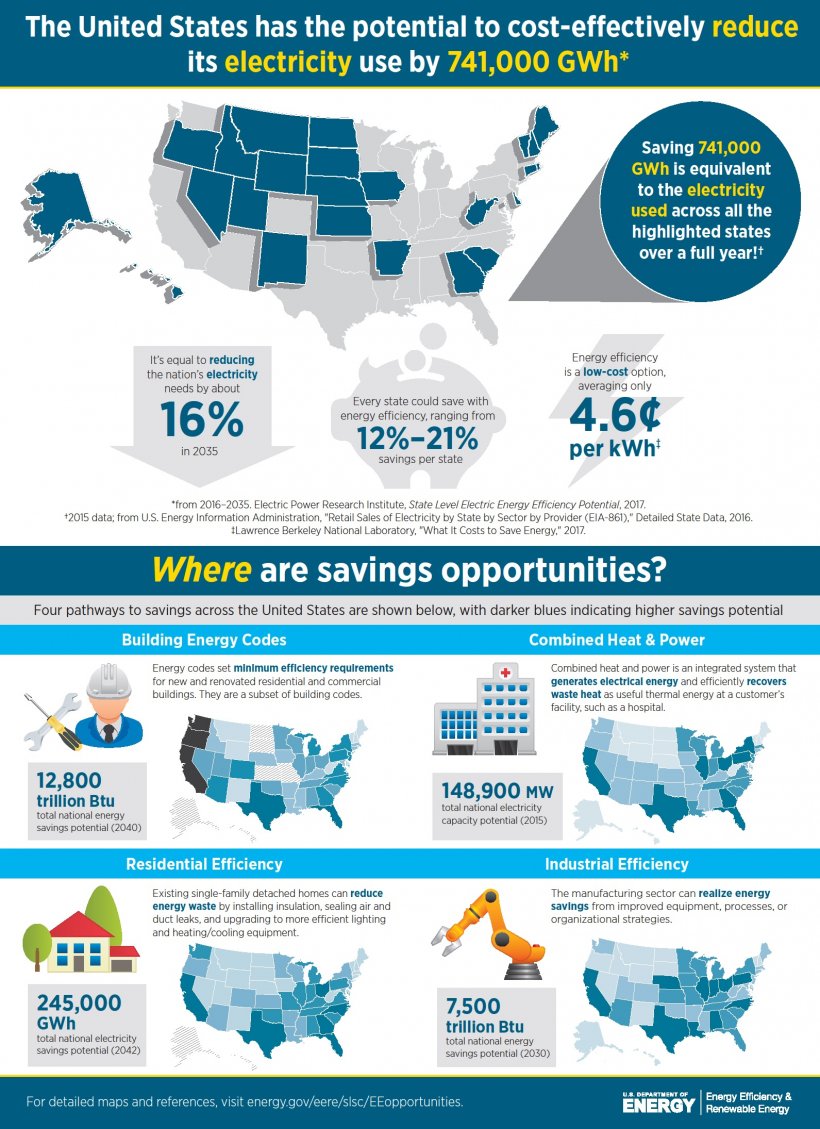
Passive Design
It is a widely agreed-up fact that the sun provides enough energy every hour to provide all of humanity's energy needs for one year. Thus, it stands to reason that there is likely enough sunlight to provide the average household's energy needs throughout the year. We will save that calculation for a later time, but some related research from the National Renewable Energy Laboratory (NREL) has shown that much of the electricity in the U.S. could be provided by solely installing PV arrays on suitable rooftops in the U.S. The images below show 1) the percent of buildings in each state that have suitable rooftop space and 2) the percent of the total electricity sales that could be provided by suitable rooftop space in each state. You can read the full report here [146]if interested.
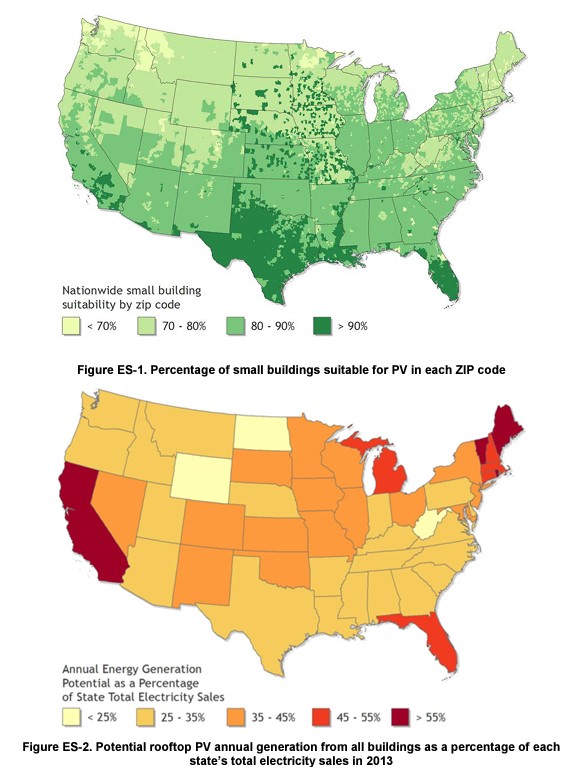
Active and Passive Design
Passive design - including passive solar design - seeks to minimize heating, cooling, and lighting energy use in a building using passive strategies. Before we begin, please note the difference between passive and active solar design, as described by the California Energy Commission [147]:
"Homes constructed with passive solar design use the natural movement of heat and air to maintain comfortable temperatures, operating with little or no mechanical assistance. It's called passive solar because the design of the home maximizes the benefits it receives from the sun with standard construction features. Passive solar takes advantage of local breezes and landscape features such as shade trees and windbreaks, and uses a simple system to collect and store solar energy with no switches or controls.
On the other hand, active solar systems use mechanical devices such as pumps and fans to move heat from collectors to storage or from storage to use. Photovoltaic panels that collect solar energy, turning it into electricity, are also considered an active solar system."
It is important to distinguish between passive and active strategies. While active strategies such as solar PV and high-efficiency heating and cooling equipment are essential components of minimizing energy use and reliance upon unsustainable energy sources, passive design requires a different mentality and in some ways, design intent. For example, many homes in the U.S. have enough roof (and/or yard) space to accommodate enough solar PV modules to provide all of their electricity needs even if the houses were not originally designed with that intent. This is especially possible if the home upgrades to highly efficient heating and cooling, as well as improved insulation and air sealing. However, it would be difficult for most houses in the U.S. to become truly passive, because passive design principles are more specific than simply having enough properly-oriented roof or yard space.
Though you may see some minor disagreements on these depending on which source you use, the following are generally accepted to be essential passive solar design principles. It is important to note that you can minimize energy use by selectively implementing these, but in order for a building to be truly passive, all of them must be used. As you will see, they often complement each other, and some simply do not "work" if not combined with others. These principles are orientation/azimuth, overhangs/shading, windows, insulation/air sealing, and thermal mass. Please read through the following descriptions of passive solar design and some passive solar design principles. Note that I provide a link as well as a .pdf since the links are archived and don't always work. All of the readings are from the California Energy Commission.
To Read Now
Please read through the following descriptions of passive solar design and some passive solar design principles. Note that I provide a link as well as a .pdf since the links are archived and don't always work. All of the readings are from the California Energy Commission.
- Passive Solar Design [147], (PDF Version [148])
- Proper Orientation [149], (PDF Version [150])
- Overhangs and Shading [151], (PDF Version [152])
- Windows [153], (PDF Version [154])
- Thermal Mass [155], (PDF Version [156])
- Everything in Balance [157], (PDF Version [158])
Please read the following for some additional insight into thermal mass, which is essential for passive design but is not often used.
- Using Thermal Mass for Heating and Cooling [159], Smarter Homes
The foolwing provides a brief summary of these principles:
- Orientation/azimuth: As you should know at this point, orientation and azimuth refer to the direction the building is faced. In the northern hemisphere, the long side of buildings should be oriented east-west, which means the long side of the building will be faced south.
- Overhangs and shading: If your building is faced south it should be able to capture winter sunlight and reduce heating costs, but conversely it may also capture summer sun, which would cause you to increase cooling costs. Properly deployed overhangs and/or seasonal shading (such as deciduous trees) can allow winter sun in and block the most intense summer sun.
- Windows: Windows must be used with both of the above, otherwise sunlight will not be able to penetrate the builiding envelope and warm up the house in the winter. Windows should mostly be on the south side. The north side of the builiding will rarely if ever get direct sunlight, and so too many windows will increase energy use because they are such poor insulators.
- Insulation and air sealing: This is pretty straightforward. Insulation and air sealing minimizes heat loss in the winter and heat gain in the summer.
- Thermal mass: This is what really separates a passively designed house from just an efficient one. Thermal masses are materials that have a high specific heat, which means that they absorb a lot of heat before they get warm and they release a lot of heat before they cool down. Essentially, they are good at storing heat. This means that they take a long time to heat up even if they are exposed to a lot of radiant energy, and after the heat/radiant source is removed, they can have a lot of heat stored up and release it very slowly.
Generally speaking, most of these principles are easy to understand. It's all but common sense that you need good insulation and air sealing for an efficient home, and understanding that good orientation is important is easy to understand if you know that the sun is usually in the south in the northern hemisphere. We all know that windows allow sunlight in. There is some subtlety and basic trigonometry (uh oh) to overhangs, since you must consider sun angle at your latitude for proper design, so that can be a little tricky. But the fact that deciduous trees lose their leaves once a year is common knowledge. Thermal mass is the least commonly understood, but the basics are not difficult to understand (things that heat up slowly and release heat slowly). It bears repeating that for a fully passive solar design, all of these elements must be present and work in conjunction. As noted above, this almost certainly must be considered in the design process, since the building's orientation cannot be changed after it is built and some overhangs are difficult to retrofit. Windows, air sealing, insulation, and possibly thremal mass can generally be added after it is built, though.
To Watch Now
Here is an example of a modern home that uses some passive design principles. See if you can find examples of using orientation, windows, shading, insulation, and air sealing.
Passive Design
Passive solar design refers to taking advantage of ambient daily and seasonal sunlight (or lack thereof) to heat and cool a building. Passive design in a more general sense includes any measure that reduces energy use by taking advantage of local conditions. Natural ventilation is one way to do this, as the video below details.
To Watch Now
Note the use of prevailing breezes, orientation, and windows to help passively cool a home.
Ancient Uses of Passive Design
One final note about passive design before we move on: In case you think that these principles represent some modern breakthrough in knowledge, well, you are off by a few thousand years! Many ancient and historic civilizations all over the world not only understood these principles, but deployed them on a wide scale.
To Read Now
Please read through the following descriptions of how passive design has been used for thousands of years.
- Passive Solar Design [147], (PDF Version [160])
Sustainable Building Ratings - LEED and Living Buildings
There is a saying that "if you want to pay attention to something, you need to measure it." As you are hopefully aware, there are many ways that buildings and urban/suburban development impact sustainability, e.g. through energy use, natural resource use, waste generation, impact on ecosystems, impact on biodiversity, impacts on pollution, and more. If we want to minimize these impacts and to be more sustainable, we need to figure out a way to measure these impacts. Enter green building ratings systems, aka green building metrics. There are too many ratings sytems to fully cover here, but the following provides some insight into some of the more common ones, as well as some that are less common.
Leadership in Energy and Environmental Design
Take a minute or two to think about the following (feel free to write down your answers): If you wanted to compare how sustainable one building is compared to another building, what would you look for? Think of specific things that 1) impact sustainability and 2) can be measured.
In the 1990s, the U.S. Green Building Council [161] (USGBC) undertook the same exercise. The result of this was Leadership in Energy and Environmental Design (LEED). LEED was the first widely-accepted "green" building rating system, and is now recognized worldwide. (Side note: the USGBC is a non-profit organization that provides an incredible amount of resources related to sustainable builiding design, many of them freely available. See their Courses and Events [162] site for details. There are also many local chapters [163] that host events.)
To Read/Watch Now
LEED is one of the most commonly recognized and used green building ratings systems in the U.S. and the world. You have almost certainly seen a LEED building, even if you did not know it was certified. Please read and watch the following summaries of how LEED "works."
- LEED Rating System [164], U.S. Green Building Council
As you can see, LEED is a points-based rating system. Remember all of those aspects of sustainable buildings you listed at the beginning of this page? LEED almost certainly provides "points" for each one of them. On a basic level, a building gets a specific amount of points for sustainable physical features such as water reduction, energy efficiency, renewable energy, use of native plants, use of local materials, use of non-toxic materials, and more subtle ones such as promoting public transportation, providing bike infrastructure, and designing the building to be used as an educational tool. Afte the building is designed and tested, the building achieves a certification level based on the points earned:
- LEED Certified: 40-49 points
- LEED Silver: 50 - 59 points
- LEED Gold: 60 - 79 points
- LEED Platinum: 80+ points
There are more complexities to actually getting certification, e.g. the the builiding owner works with a LEED professional and registers with USGBC from the outset, etc., but that goes beyond the scope of this course. There are also a number of different types of certifications, from single new buildings to interior design to operations and maintenance and more. More information on these is here [165]. If you are interested in reading more about the full LEED process, you can dig into the details here [166]. Note that there are job and training opportunities in this process. For more information see their Credentials [167]site.
To Watch Now
Here is one example of a LEED building. Note the variety of sustainable features it has, from water to waste to energy and more. If you are so inclined, you can browse for LEED projects on the U.S. Green Building Council [168] website, including with a searchable database.
OPTIONAL - You can play around with the LEED for Homes checklist here [169], and access other checklists here [170].
One of the common critiques of LEED is that building owners/designers are not required to check all of the boxes (literally, in this case). In other words, it is possible to have a LEED building that overuses water, does not provide 100% of it's own energy, does not use entirely non-toxic or local resources, and so forth. You can pick and choose what you want to address, and the only penalty is that you might not get the certification level that you wanted. In addition, a building receives its LEED rating before the building is used. This can be a problem if the folks using the building do not operate it in such a way that the LEED goals are accomplished. For example, if the building has high levels of insulation and air sealing but the building occupants turn the thermostat up too high or low, or leave windows open, etc., then the building may use much more energy than the design claims.
The Living Building Challenge seeks to address these points, but more importantly it seeks to be the most robust and holistic sustainable building rating system available.
Living Buildings
The Living Building Challenge is overseen by the Living Future Institute. Their goal is to "move beyond merely being less bad and to become truly regenerative." Based on personal experience and extensive research, Living Building Certification is indeed the most robust and holistically sustainable building rating system available today.
To Read/Watch Now
Please read and watch the following introductions from the International Living Future Institute. They provide a good overview of the intent and philosophy behind Living Buildings.
- Living Building Challenge 4.0 Basics [171], International Living Future Institute
- OPTIONAL: Read the full standard here [172]. This describes all aspects of Living Building Certification.
As you read [171]and saw, the core questions asked by the International Living Future Institute (ILFI) are:
- What if every single act of design and construction made the world a better place?
- What does 'good' look like?
It is important to take a minute to think about the implications of the first question in particular. The goal of ILFI goes beyond simply not making things worse in terms of sustainability to actually making things better by building buildings. The intent is summarized when they say: “Nothing less than a sea change in building, infrastructure and community design is required. Indeed, this focus needs to be the great work of our generation. We must remake our cities, towns, neighborhoods, homes and offices, and all the spaces and infrastructure in between. This is part of the necessary process of reinventing our relationship with the natural world and each other—reestablishing ourselves as not separate from, but part of nature, ‘because the living environment is what really sustains us.’” The Living Building Challenge is nothing if not ambitious!
The Living Building Challenge has seven (7) "petals" for certification. Each petal represents a different category of sustainability:
- Place: restoring a healthy coexistence with nature
- Water: creating water independent sites, buildings and communities
- Energy: Relying only on current solar income
- Health + Happiness: Maximizing physical and psychological health and well being
- Materials: endorsing products and processes that are safe for all species through time
- Equity: supporting a just, equitable world
- Beauty: celebrating design that creates transformative change
There are twenty (20) total "imperatives" within these petals. Each imperative has a specific, measurable standard that must be met in order to receive certification.
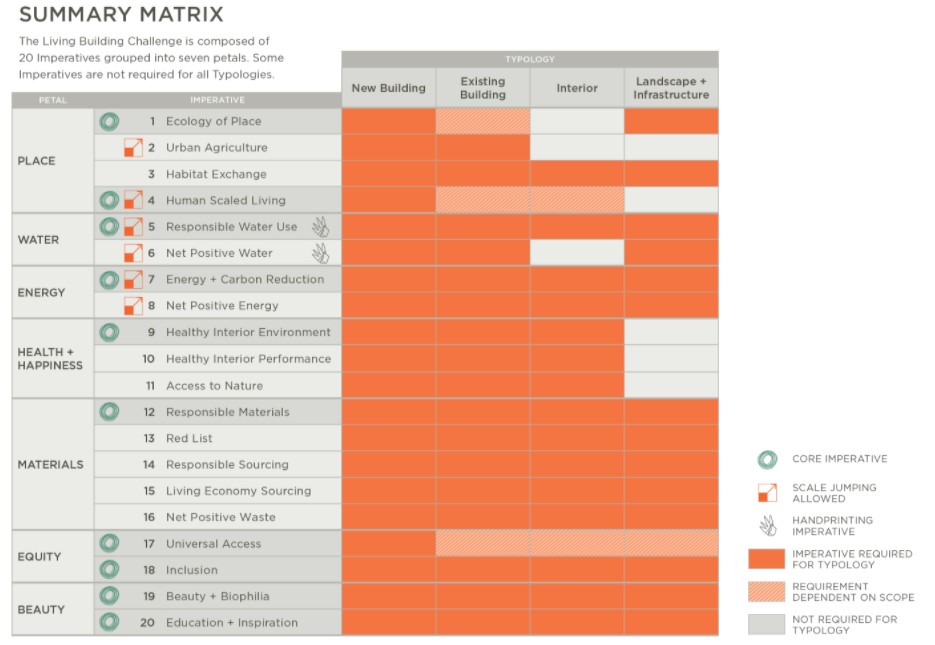 [171]
[171]
Among the standards required are:
- Net positive water: "Project water use and release must work in harmony with the natural water flows of the site and its surroundings. One hundred percent of the project’s water needs must be supplied by captured precipitation or other natural closed-loop water systems, and/or by recycling used project water, and must be purified as needed without the use of chemicals. All stormwater and water discharge, including grey and black water, must be treated onsite and managed either through reuse, a closed loop system, or infiltration. Excess stormwater can be released onto adjacent sites under certain conditions" (source: ILFI [173]).
- Net positive energy: "One hundred and five percent of the project’s energy needs must be supplied by on-site renewable energy on a net annual basis, without the use of on-site combustion.15 Projects must provide on-site energy storage for resiliency" (source: ILFI [174])
- Habitat exchange: "For each hectare of development, an equal amount of land away from the project site must be set aside in perpetuity through the Institute’s Living Future Habitat Exchange Program or an approved Land Trust organization. The minimum offset amount is 0.4 hectare." (source: ILSI [175])
- No red-listed products: The ILSI maintains a list of "red-listed" chemicals that cannot be used in Living Buildings because they are "materials, chemicals, and elements known to pose serious risks to human health and the greater ecosystem that are prevalent in the building products industry" (source: ILFI [176]).
As you can see, there are a few things that separate Living Buildings from LEED (and other) sustainable building metrics. The list is long, but primary among them are the following "Principles that govern the standard":
- "Living Building Challenge compliance is based on actual, rather than modeled or anticipated, performance. Therefore, projects must be operational for at least twelve consecutive months prior to audit to verify Imperative compliance.
- All Living Building Challenge projects must be holistic—addressing aspects of all seven Petals through the Core Imperatives." (Source: ILFI [171])
As a result of this being such a robust standard (and the fact that it must be used for a year prior to certification), there are only 30 fully certified Living Buildings [177] in the world, as compared to thousands of LEED buildings.
To Watch Now
The following provides a description of a Living Building. As of 2018, this was only the second one in existence.
Energy Rating Systems
LEED and Living Buildings are holistic rating systems. There are a number or energy-only rating systems in the U.S. The following is a sampling of a few of them.
Benchmarking and Energy Use Index
Energy Use Index (EUI) and Benchmarking are very common metrics in the energy management industry and energy policy world. They focus solely on energy use, and are relatively simple ways to assess and influence the energy efficiency of buildings.
To Read/Watch Now
First, read the following short reading about Energy Use Index (sometimes called "Energy Use Intensity") and watch the video below.
- Energy Use Intensity [178], EPA EnergyStar
Benchmarking is a common practice in the commercial energy efficiency industry. The most commonly used software for this is Portfolio Manager from the U.S. Environmental Protection Agency (EPA). Read the summary of both of these below
- Portfolio Manager [179], U.S. EPA
An energy use index (EUI) is relatively easy to determine. You just take a year's worth of energy bills, convert the total energy use to kBTU (thousands of BTUs), then divide by square footage. That's it! This gives you a snapshot of the general energy efficiency of a building, though not a comprehensive one. It is a helpful basis of comparison for other buildings, which is exactly what EPA Portfolio Manager does. Portfolio Manager compares your building's EUI with other similar buildings. What is meant by "similar?" Well, that depends on a few factors, but the most important aspects are 1) buildings in a similar climate zone and 2) buildings that are used for similar things. For example, the mean EUI of an education building in the U.S. is 51 kBTU/ft2, while the mean EUI of a hospital is about 188 kBTU/ft2 (source: Lawrence Berkley National Laboratory Buildings Performance Database [180]). Why the difference? Think about the difference in operating hours and equipment used in these buildings. Given this, it would be unfair to compare the "typical" energy use of a hospital with the "typcial" energy use of a college or middle school. Similarly, you would expect slightly different energy use based on the climate. The exact same building in a temperate climate such as, say, Coastal North Carolina would use less energy than one in a cold climate such as Minnesota or Maine or a hot, humid climate such as Florida.
EPA provides you with an "Energy Score" based on other buildings in their database. A score of 25 means you have a lower EUI than 25% of comparable buildings, a score of 50 means you have a lower EUI than 50% and higher than 50%; a 90 means you have a lower EUI than 90% of buildilngs, and so on. EPA provides the option of being Energy Star rated if you have a score of 75 or above. Some municipalities (such as Philadelphia [181]) require buildings to obtain their Energy Score every year so that they may constantly see how they compare to other buildings. The benefit of doing this every year is that you are forced to keep up with your peer buililngs. Let's say you get a score of 75, then think: "Cool, I'm very efficient. I don't need to make any upgrades." But then if other buildings become more efficient over time, your score will drop. In this way, the process of improving efficiency in theory never ends.
Energy Star Buildings
Energy Star is a program created and run by the U.S. Environmental Protection Agency (EPA). As the name implies, this is an energy efficiency rating system that has the following four components:
-
a high efficiency thermal enclosure system (thermal envelope!)
- high efficiency heating and cooling
- proper water management to protect building components from water damage
- energy efficient lighting and appliances
To Read/Watch Now
According to the EPA [182], Energy Star certified homes "are at least 10% more efficient than homes built to code and achieve a 20% improvement on average." Please read the following summary of the Energy Star Residential New Construction Program:
- About the ENERGY STAR Residential New Construction Program [182], U.S. EPA
Here is a great video that introduces some of the benefits of Energy Star Homes. It is geared towards builders but is a helpful introduction for anyone.
OPTIONAL
- Take a look at specific Energy Star Certification requirements [183], which are slightly different depending on the climate zone the building is in.
- View the Energy Star Certification requirements [184]for Philadelphia buildings.
Passive House Certification
Passive House Certification is effectively a more robust version of Energy Star Certification. There are actually two different certifying bodies in the U.S. - Passive House Institute (PHI) and Passive House Institute U.S. (PHIUS) - as detailed by ecohome here [185]. The distinction is not important for our purposes, but we will focus on PHIUS standards. The image below provides a sense of how robust Passive House standards are relative to Energy Star and other standards. See this [186] document for a fuller explanation.
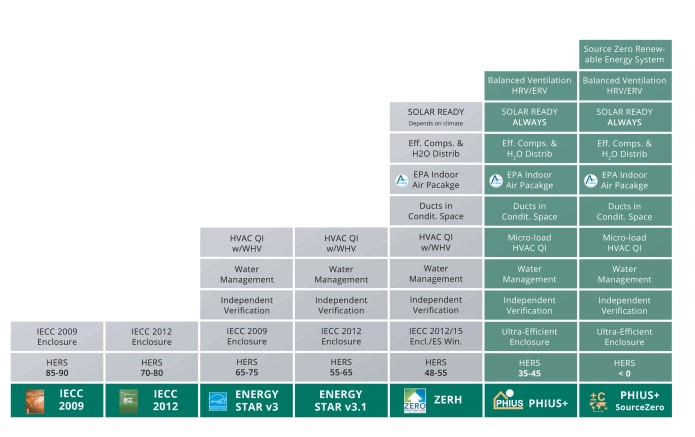
To Read Now
Please read the overview below and click on the second link to look at some of the differences between PHIUS and other energy efficiency standards:
- PHIUS+ Certification Overview [187], PHIUS
- PHIUS+ 2015 Passive Building Standard, [188] PHIUS
The following is a summary of the energy-only rating systems:
Benchmarking:
- EUI = energy use/ft2/yr
- General indicator of energy efficiency
- Must consider climate and use
- Easy to do – just requires utility bills and size, and a comparison to other buildings.
- Benchmarking overseen by the U.S. EPA via Portfolio Manager
Energy Star Certification
- Overseen by the U.S. EPA
- Energy Star Homes must meet specific efficiency standards and address insulation, air tightness, appliances, efficient heating and cooling, and more
- Average energy use reduction 20%
Passive House Certification
- Most robust energy standard
- Includes everything that Energy Star does, plus more.
- Can reduce energy use up to 60% - 70%
Other Sustainable Building Types
Finally, let's go over a few other sustainable building types and techniques. Tiny homes have been gaining in popularity for over a decade now (there are multiple shows and documentaries dedicated strictly to tiny homes, for example), mostly as a solution to exponentially increasing housing prices. But there is an element of sustainabiliy and freedom (e.g. "van life") to a tiny house as well, and many people are simply tired of the overconsumptive American lifestyle. We will also briefly go over a few less common examples, including straw bale, cob, earth bags, and cooperative housing.
Straw Bale, Cob, and Earth Bags
Straw bale, Cob, and earth bags are much less common than most of the examples on previous pages, but are perhaps the most sustainable in terms of materials use since most of the structure is made from natural and local materials - mud, straw, gravel, and/or soil.Straw bale also provides excellent insulating value, and as you will see in the video below, cob is a good thermal mass and can be made into almost any shape.
To Read/Watch Now
Please read the following for an overview of each of these, then watch the video that provides details of a cob/straw bale hybrid house. in the video, note also all of the passive design principles that are used!
- Cob, Straw Bale or Earthbag: Which Is the Best? [189], Mother Earth News
Cooperative Housing
There is no single definition of cooperative housing, but at a fundamental level refers to housing that is co-owned and co-managed by a group of people. There are many different kinds of cooperative housing, and it has been practiced for thousands of years. In a Western context, cooperative housing usually refers to intentional communities that cooperatively own and manage a building and share resources and spaces. The following provides a good intro to some of the key ideals behind most cooperative housing.
To Watch Now
Tiny Homes
Finally, tiny homes! Tiny homes were a niche application but have become much more mainstream now. They are small (usually less than 500 ft2), but relatively inexpensive ($10,000 - $100,000, depending on how fancy), and most of them are on wheels and so can be moved seasonally and avoid some permitting issues due to not having a foundation.
To Watch Now
Here is a nice introductory video to tiny homes.
Here is one interesting application for tiny homes that helps address homelessness and substance abuse issues in Colorado.
Cooperative Housing Examples
I have visited and toured a number of cooperative buildings in Switzerland. Feel free to take a look at the pictures below for some insight into what they look like and how they operate. Note that there is no single set of rules for cooperative housing. The examples below only describe the ones that I saw in Switzerland. That stated, the types of rules at these Swiss examples are fairly typical for cooperative housing in that they are meant to foster low-impact, community-oriented living. One aspect that all cooperative housing shares in common is that the buildings are owned and managed cooperatively. All of the buildings below are owned by all occupants, including any businesses. All photos are my own.
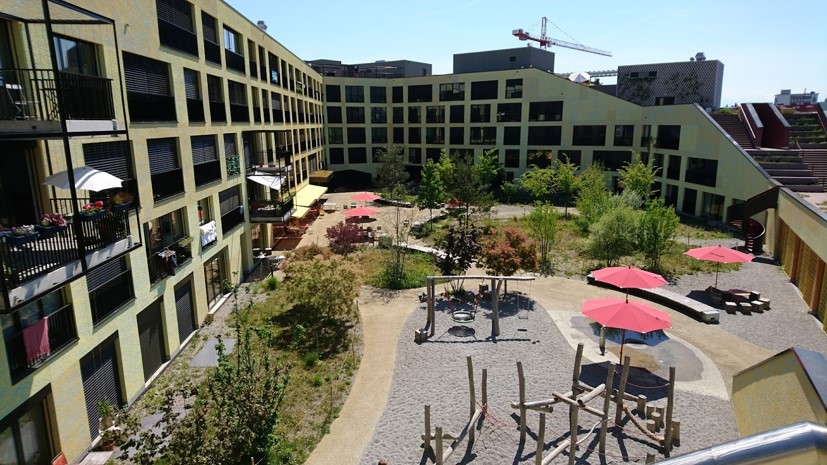


More Site Visits!
Here are some more site visits! Again, this is not required reading. I suggest browsing through them if/when you have time. This may help inspire your final project proposals!
- Geos Neighborhood [190], Denver
- LEED Building at the Denver Zoo [191], Denver
- New Belgium Brewery Sustainability Initiatives [192], Fort Collins
Summary and Final Tasks
Summary
By now you should be able to do all of the following:
- Identify and describe the five passive solar principles.
- Describe the benefits of passive design.
- Describe how LEED certification works.
- Describe what is required for a building to achieve Living Building Certification.
- Evaluate pros and cons of LEED vs. Living Building Certification.
- Describe principles of Energy Star buildings, Passive House Certification, and Energy Use Index.
- Describe the energy efficiency benefits of benchmarking.
- Evaluate the sustainability of cob, straw bale, cooperative housing, and tiny homes.
Reminder - Complete all of the Lesson tasks!
You have reached the end of Lesson 9! Double-check the to-do list on the Lesson Overview page [193] to make sure you have completed all of the activities listed there before you begin Lesson 6.
Lesson 6: Geography, Water, and Energy in Colorado
Overview
In the final full lesson of this course, you will learn some basics of Colorado geography (and geology), energy, energy policy, water, and water policy.
Learning Outcomes
By the end of this lesson, you should be able to:
- identify and describe major geographic regions and features of Colorado;
- analyze population and precipitation patterns in Colorado;
- describe the basic geology of the Rocky Mountains and the Front Range;
- explain the concept of "first in time, first in right" in terms of Colorado water policy;
- define RPS, REC, SREC, ITC, and PTC as they relate to energy policy;
- explain how renewable portfolio standards incentivize renewable energy.
Lesson Roadmap
| To Read | Lesson 6 Online Content | You're here! |
|---|---|---|
| To Do |
|
|
Questions?
If you have any general course questions, please post them to our HAVE A QUESTION discussion forum located under the Discussions tab in Canvas. I will check that discussion forum regularly to respond as appropriate. While you are there, feel free to post your own responses and comments if you are able to help out a classmate. If you have a question but would like to remain anonymous to the other students, email me through Canvas.
If you have something related to the material that you'd like to share, feel free to post to the Coffee Shop forum, also under the Discussions tab in Canvas.
Colorado Geography
Welcome to Colorado!

Colorado is known as the "Centennial State" and is the 8th largest state [195] in the U.S. by area, at a little over 104,000 square miles. As a point of reference, it is over twice the size of Pennsylvania. However, it has only the 21st highest population [196], at just over 5.6 million people as of 2018. (Pennsylvania is 5th at around 12.8 million people.) The capital is Denver, which is known as the "Mile High City" because most of the city is at or above 1 mile above sea level. While known for its mountains, a significant portion of Colorado is part of the Great Plains and is nearly flat. Even the plains are at a high elevation, and in fact, Colorado has the highest average elevation of any state in the U.S. Colorado has more peaks higher than 14,000 feet (58 of them!) [197] than any state in the country. If you travel to Colorado for any amount of time, you will no doubt overhear discussions about these "fourteeners." It is nearly a universal pastime to climb fourteeners.
As you will read below, Colorado has a very diverse landscape and culture. It is known for the availability of outdoor activities (hiking, skiing, camping, white water rafting, biking, etc.), but also has an interesting mixture of modern and historic culture and practices. Farming and ranching are important to its economy and culture, but so are tourism, higher education, and high tech industries, among many other things. It is a wonderful state to explore!
As you probably recall, we will spend most of our time in Denver, but will also visit Boulder and drive through the mountains to the Western Slope towns of Paonia and Ouray (pronouned "ooh-ray"). We will thus experience a variety of Colorado culture and scenery, from the Eastern Plains to the Front Range, as well as the Western Slope. More details on these regions below.
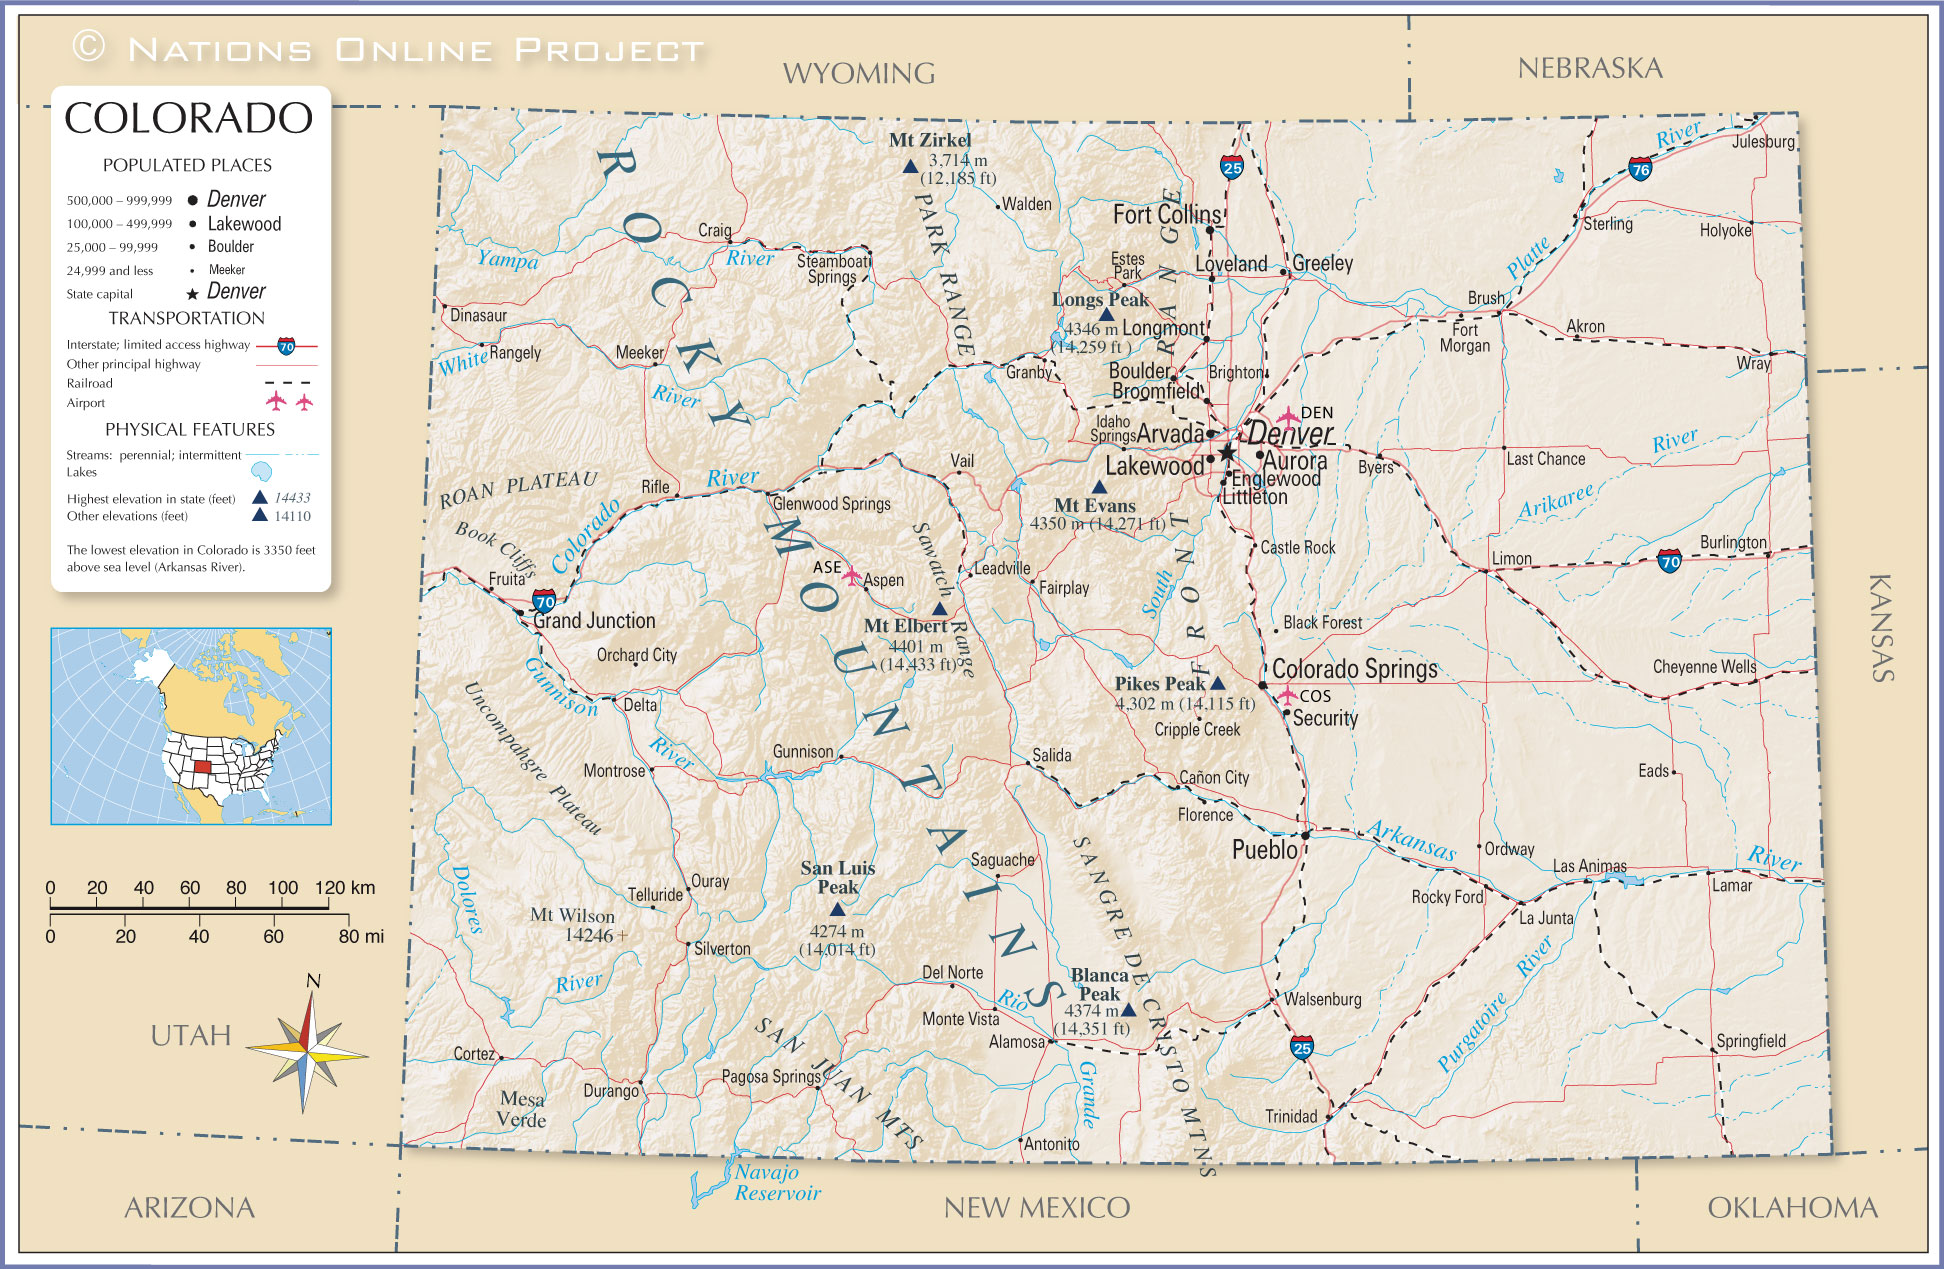 [199]
[199]
Regions and Geography
Colorado has many local regions and other geographic features [200], but the major ones that we will experience are as follows:
- The Front Range [201], which is where most of the population of the state resides. In figure 6.4 below, the front range is roughly the easternmost portion of the Southern Rocky Mountains but also is generally understood to encompass the westernmost portion of the Great Plains, including parts of the Colorado Piedmont. (The boundaries of the Front Range are not distinct). The Front Range is often thought of as the foothills of the Rockies, and you will see why that is when we travel there. All of the major population centers of Colorado, including Denver, Fort Collins, Boulder, and Colorado Springs are considered part of the Front Range. According to the Colorado Encyclopedia, about 4.5 million of the state's 5.6 million people live in the Front Range. Red Rocks Amphitheater [202], the famous outdoor concert venue and geologic feature lies in the Front Range just outside of Denver. (We'll visit this, too!)
- The Western Slope [203], which is generally understood as the area of the state that is on the other side of the Continental Divide (see below). In Figure 6.4 below, you can visualize the Western Slope if you mentally draw a north-south line through the middle of the Southern Rocky Mountains province - the Western Slope is everything to the west of that line. (Sorry, I could not find an image of this exact province.) The Western slope covers the eastern third of the state, but only has about 10 percent of the residents. Perhaps most importantly, it has about 70 percent of the state's water. The Western Slope is mostly mountainous and contains most of the "classic" Rocky Mountain geography (e.g. the image of Rocky Mountain National Park above). Most of the mountain towns and ski resorts (Vail, Aspen, Keystone, Breckenridge, etc.) lie in the Western Slope. However, most of the westernmost portion is part of the Colorado Plateau and has desert features such as mesas and plateaus. Paonia is a very small town and does not appear on the map below, but it lies almost directly on the boundary between the Southern Rocky Mountains and the Colorado Plateau, just northeast of Montrose.
- The Eastern/Great Plains [204], as you can see in the image below, covers about the eastern third-to-half of the state. This is characterized by mostly flat land covered in prairie grasses and dotted with small towns. Between the towns are generally wide open spaces covered in farms, ranches, and some public lands. We won't really experience this area, but Denver lies at the edge of it, and you can see the Great Plains' physical geography while traveling from the Denver airport to the city.
See the video below the image for a good explanation of how the Rocky Mountains and the Front Range formed. Note the explanation of why Red Rocks and other parts of the Front Range are sedimentary rocks (made from ancient sediments such as sand and silt) that were originally layered on top of the granite "basement" rock, and the Rocky Mountains themselves are made of granite that was pushed up via oceanic subduction. Some of this granite core is over 1 billion years old! (Side note: Geology is awesome!)
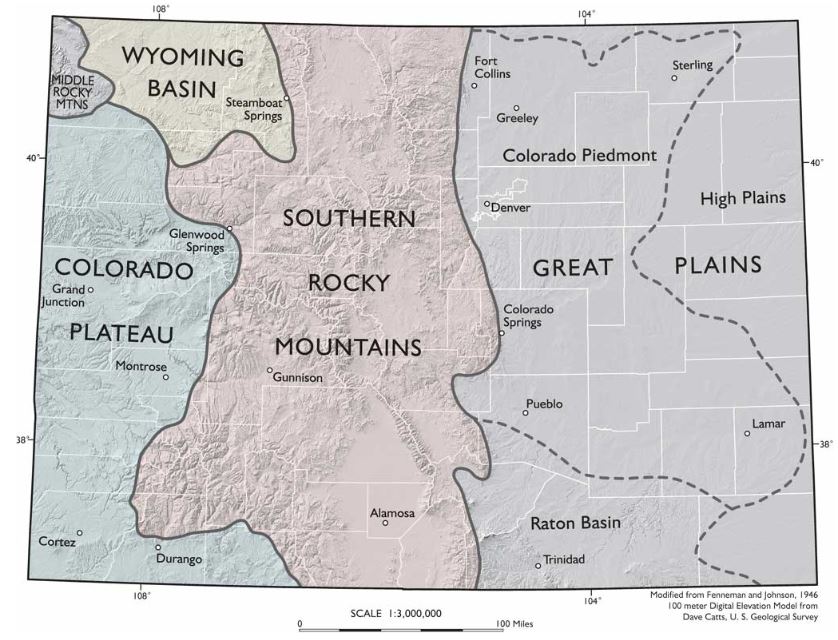
NARRATOR: On our journey south along the Rocky Mountains we're entering a very different landscape. From Montana southward the Rockies are made from ancient granite 1.7 billion years old. Granite makes up much of the deepest part of the continental crust. That's why geologists call this rock the basement.
The Canadian Rockies are built from sedimentary rocks piled up on top of the continental foundations. So why does granite suddenly appear here in the American Rockies? But there's an even greater puzzle. Mountains usually form close to plate boundaries, but the southern Rockies sit a long way from the plate margin.
The Front Range in Colorado is a thousand miles from where the Pacific and North American plates actually meet. Geologists have come up with an explanation. They believe that the subducting Pacific ocean plate is responsible. Ocean crust had been pushed deep into the mantle beneath North America for a hundred million years when something unusual happened. Plates started to subduct at a shallower angle. Instead of plummeting steeply, it sliced beneath North America horizontally. This change had dramatic consequences.
DR. KIRK R. JOHNSON: The big oceanic plate in the Pacific didn't go deep down it went in shallow like a spatula under a pizza. So something happened sixty-eight million years ago over in California. That plate drives under North America but instead of diving deeply it comes in shallow and a thousand miles away from the coast up from the ground throughout the Rocky Mountains.
NARRATOR: For millions of years the ocean plate scraped along the underside of North America. It created friction breaking up the basement granite of the North American plate and punching it upward. Structural geologist Karl Karlstrom demonstrates.
PROF. KARL E. KARLSTROM: Because it was at a shallower angle beneath North America it was scraping along the base of North America. When that happens it puts the plate under compression like this because it's being both pushed at the end and scraped along at the bottom. So it squeezes, pushes up the mountains, and it transferred this mountain building from the edge to great distance from the plate margin.
NARRATOR: The shallow angle trajectory of the Pacific Ocean plate explains why these mountains formed so far inland and it also explains the presence of granite. Thrust up through layers of sedimentary rock the broken granite became the Rocky Mountains of the south.
Red Rocks Park, Denver Colorado, a landscape forged by granite uplift. The granite mountains here have been pushed up for miles. On top of the granite lie spectacular red slabs of rock known as flat irons. They're the patchwork remains of sedimentary rock that once blanketed the entire granite basement. Kirk Johnson demonstrates how these granite peaks punched up through the layers of red rock around them.
KIRK JOHNSON: I'm going to use my assistants Veronica and Ian to help me explain how the Rocky Mountains in Colorado formed. Imagine if you will that Veronica and Ian are composed of 1.7 billion-year-old metamorphic rocks, the basement Rock of Colorado.
NARRATOR: Before the mountains grew, layers of sedimentary rock covered the granite.
KIRK JOHNSON: And then in about sixty-eight million years ago the mountain where Ian is starts to break and lift up and move up so you see the uplift forming. What's happening is that layer of sediments being deformed is bent and these are the flatirons at Red Rocks. As the mountain comes up overlying sediment eroded off and deposited into the adjacent basin and eventually Ian's granitic back is exposed as the core of the Rocky Mountains. Veronica remains deeply buried beneath Denver still covered with deep sediments and the sediments eroded off the uplifting Rocky Mountains.
To Read Now
Please read the following sections of this article from Encyclopaedia Britannica [207]:
- Intro
- Land
- Climate
- Settlement patterns
Continental Divide
Another well-known feature of the state is the Continental Divide, sometimes referred to as the Great Divide. A continental divide is defined by National Geographic [208] as "a naturally occurring boundary or ridge separating a continent’s river systems. Each river system feeds into a distinct ocean basin, bay, or sea." As you can see in the image below, there are a number of continental divides in North America. Each of these lines is the boundary between two major drainage basins. The rivers and streams in each basin lead to a specific large body of water.
For example, the Eastern Continental Divide runs through Pennsylvania. Flowing water to the east of the divide ends up in the Atlantic Ocean, and west of the divide ends up in the Gulf of Mexico. In Colorado, water to the west of the Continental Divide flows to the Pacific Ocean, and to the east flows to the Gulf of Mexico (and ultimately the Atlantic Ocean). You may see signs while traveling through the mountains of Colorado like the one below that mark portions of the Continental Divide. There is also a trail that roughly follows the divide that is a national park - Continental Divide National Scenic Trail [209].
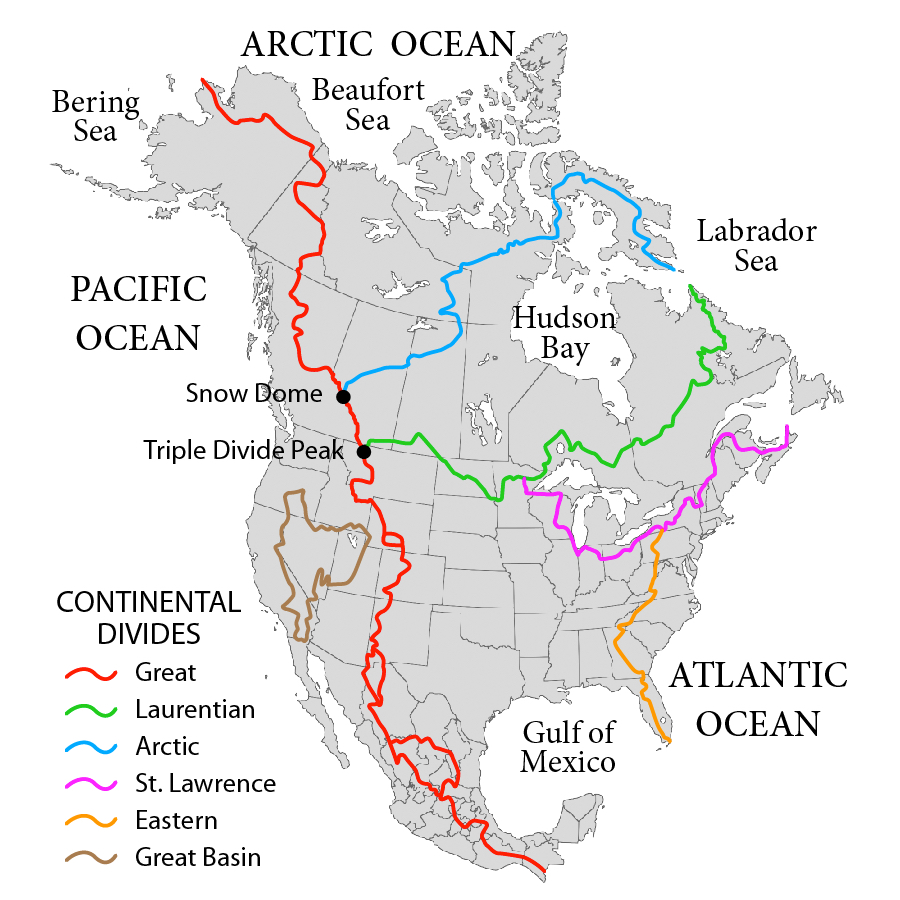
.jpg)
Water and Policy in Colorado
As the saying goes: "Whiskey's for drinking, water is for fighting." This is not far from the truth in Colorado! Water use and water rights are prominent issues in the state. It is an unusual experience for anyone that grew up on or near the East Coast, where the issue of water rights almost never comes up, to move to Colorado and find out that the "average" person is conversant in water rights. Water is such an important issue for Coloradans (and many who live in the western United States) because it is relatively scarce. As you can see in the maps below, most of the state receives under 20 inches of precipitation per year, and in fact, the average rainfall across the state is 15 inches per year, according to Denver Water [214]. This makes most of the state semi-arid, which means that it is climatologically not far away from a desert (arid) environment. As a point of comparison, most of the land east of the Mississippi receives more than 35 inches per year, with State College, PA receiving about 40 inches per year [215].
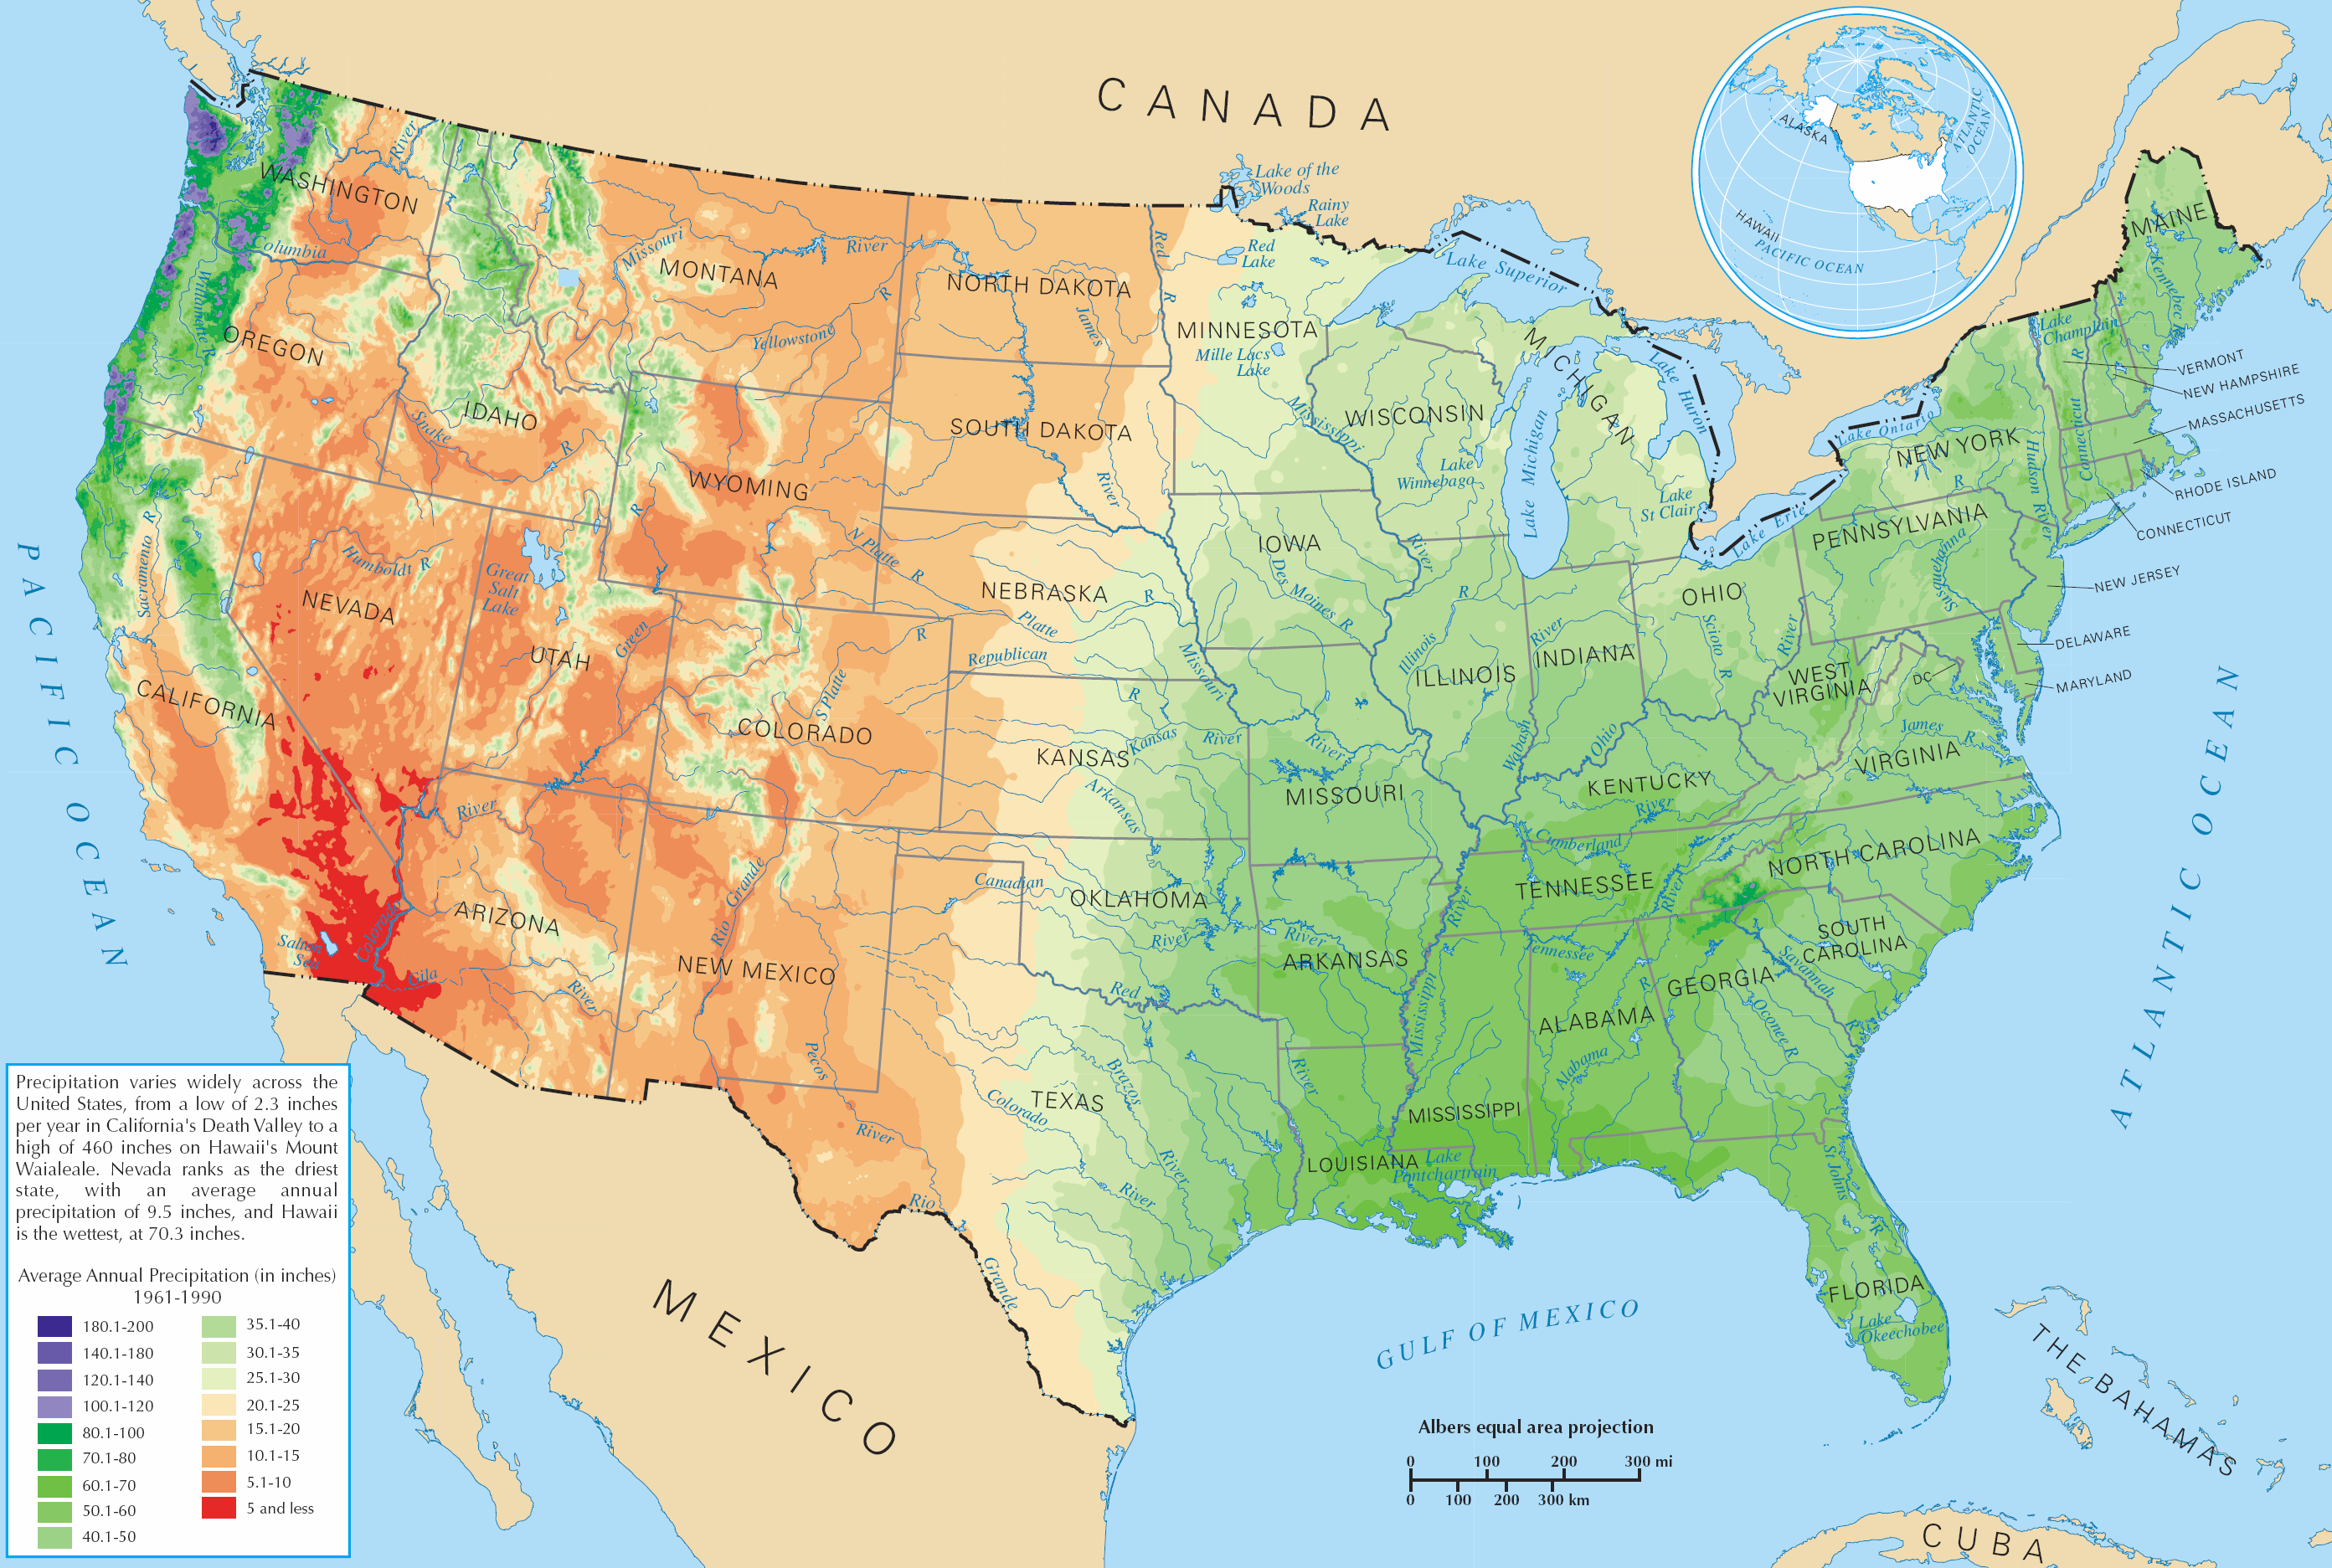
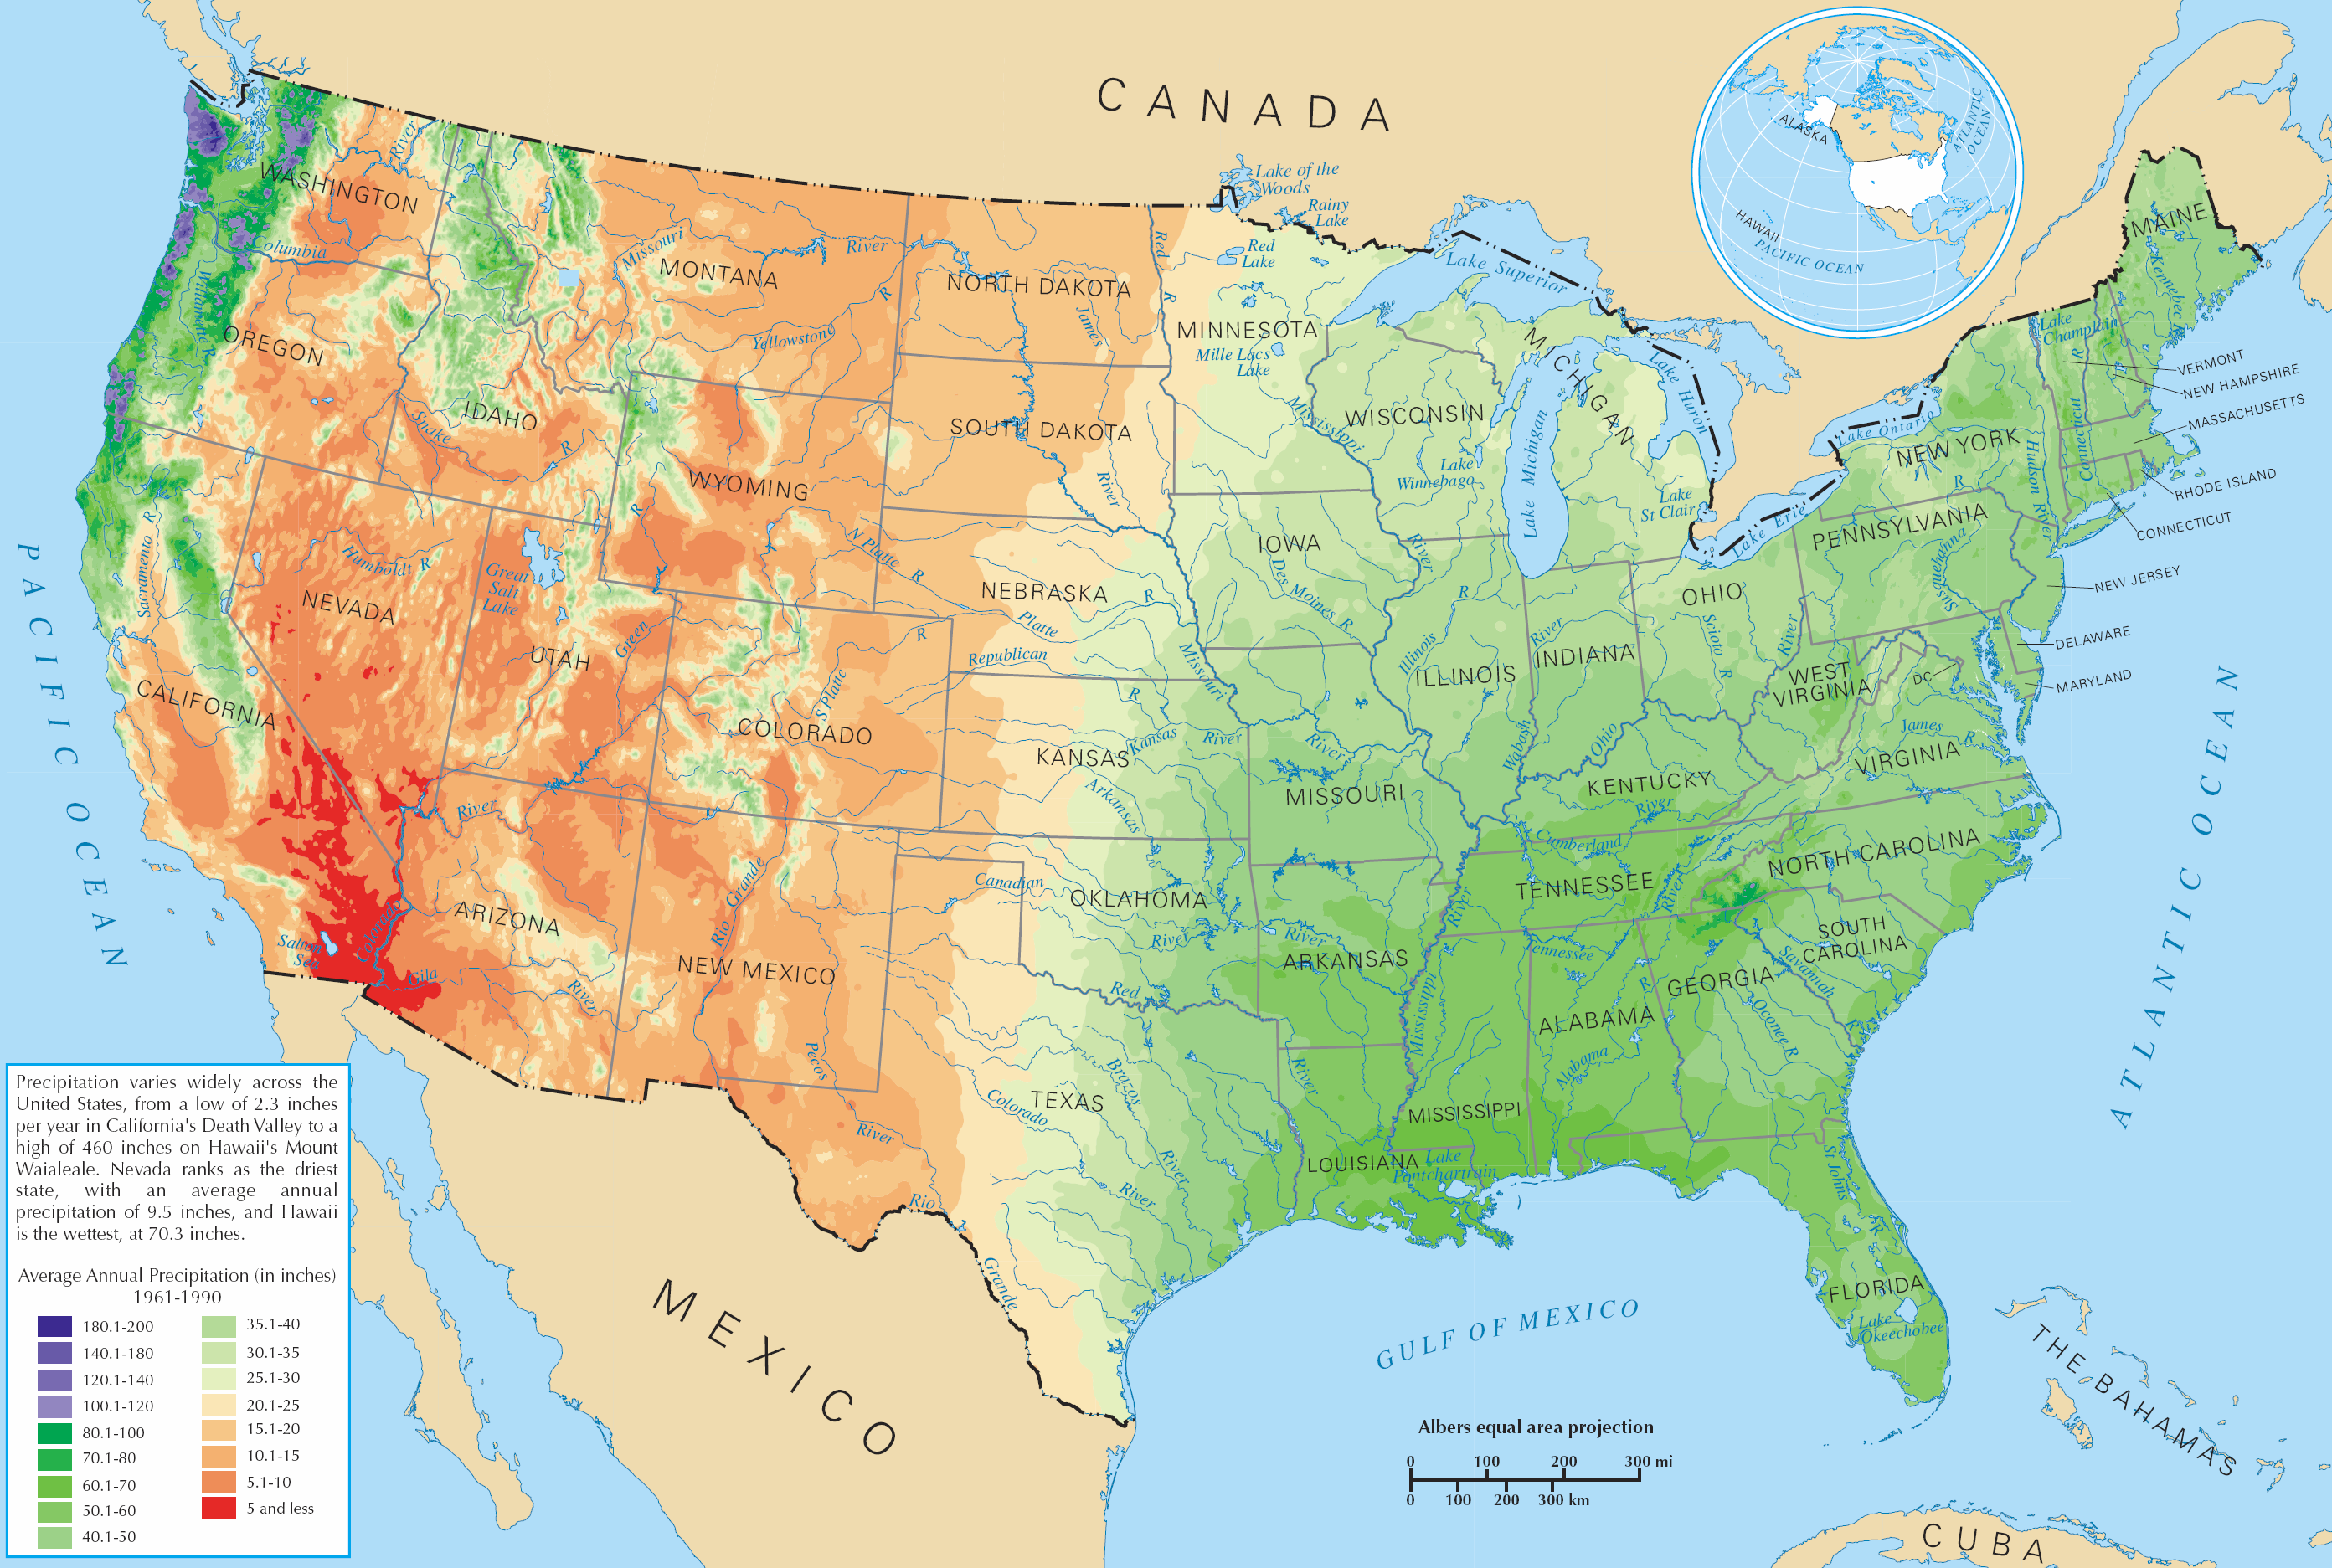

Further complicating matters is the comparison of the rainfall and population geographies of the state. Recall that the Western Slope of Colorado lies west of the Continental Divide and the Eastern Slope (including the Front Range) to the east. According to "Water Law" (Denver Water) [214], 10 percent of the state's residents live on the Western slope, but it contains 33 percent of the state's land and 70 percent of its water. Because of this, Western Slope water is often used on the Eastern Slope. This, in addition to relative scarcity and Colorado water laws, has contributed to water being a major issue in the state.
To Read Now
Please read the following summary of Denver and Colorado water policy. Read the sections entitled "Water law," "Water rights," "Rain barrels," and "Graywater use."
- "Water Law" (Denver Water) [214]
Energy and Policy in Colorado
Colorado has a very diverse and often contentious energy landscape. For example:
- On the one hand, the oil and gas industry is very important to the state. According to the U.S. EIA, Colorado is the fifth-largest oil producing state in the country [219] and the 7th largest gas producer. About 36% of its electricity comes from coal.
- There are more than 37,000 unconventional wells (aka fracking sites) in Colorado as of February 2022, according to Fractracker [220]. The oil and gas industry appears to provide a few percent [221]of total GDP (around $11 billion) in Colorado and a little over 1% of all jobs. The oil & gas industry wields relatively significant power, and oil and gas are a frequent target of bills and referenda, both for and against.
- On the other hand, the state is home to the National Renewable Energy Laboratory [222] (NREL), which is one of the premier renewable energy research organizations in the U.S. It is one of the U.S. national labs and is the only national lab that focuses on renewable energy. The EIA notes that: "Since 2010, Colorado's renewable electricity net generation has more than tripled, led by increased wind and solar, and accounted for 30% of the state's total generation in 2020."
While traveling through Colorado, it is not uncommon to see oil pump jacks, wind turbines/farms, fracking operations, solar arrays, and coal-fired power plants. (We will probably see more than a few of each during our time there.) Solar Energy International [48] has its training headquarters in Paonia on the Western Slope (we will visit them), yet fracking wells dot the local landscape and it is not uncommon to see train cars full of coal while traveling to and from Paonia. This variety can and does cause conflict, with fossil fuel advocates having strong disagreements with renewable energy advocates on personal and political levels.
The image below shows Colorado's 2019 fuel mix (the latest data available). You have seen this type of chart in EM SC 240N. Remember that this is called a "Sankey" chart and indicates energy flows. The numbers are all Trillions of BTUs (TBTUs) of energy, and the lines indicate the energy flows to different sectors. Remember that you read the chart from left to right, and can follow each primary energy source (the sources to the left) to see where they are used.
- For example, of the 273 TBTUs of coal burned in 2019, 369 TBTUs were used in electricity generation (98.5%), and 4.2 TBTUs were used in the industrial sector (1.5%).
- You can also analyze individual sectors (electricity, residential, commercial, etc.) by using the chart. For example, the industrial sector used 321 TBTUs in 2019, of which 189 TBTUs were from natural gas, so 58.9% of industrial energy came from natural gas in 2019.
- You can determine the efficiency of whole sectors by dividing the total energy used in the sector by the "useful" energy (useful energy is referred to as "energy services" on the chart).
 [223]
[223]
Energy Policies
Energy policy can be very intricate and can vary significantly from state-to-state and even within states. If you are interested in finding out which energy policies exist in each state (and nationally), hands-down the best website for details is DSIRE [225], which is out of NC State University but is managed in conjunction with the U.S. Department of Energy. Believe it or not, DSIRE lists 133 energy policies [226] that apply to the state of Colorado! (Note that some of these are federal policies that apply in all states.) Obviously, we do not have time to go over all of them, but a few of the most prominent ones are below.
Renewable Portfolio Standards (RPS)
Renewable Portfolio Standards (RPSs) are created through legislation and require electricity providers to provide a certain percentage of their electricity from renewable (or alternative) sources. Each state is able to pass its own RPS law (or not), as there is no national RPS in the U.S. Each RPS dictates the percent targets compliance years (see below), and also indicates which energy sources can be used to meet the RPS goal.
Utilities must prove that the required percentage of the electricity they sell is from one of the eligible renewable sources. The three primary ways they do this is a) build and generate their own renewable electricity installations (e.g. a large solar array or wind farm), b) purchase renewable energy from a dedicated supplier (e.g. an independent owner of a large solar array or wind farm), or c) "take credit" for renewable electricity generated by customers on their grid. Utilities rarely build their own generation facilities nowadays (option a), but signing long-term contracts with independent suppliers is becoming very common (option b).
It is very common for utilities to "take credit" for customer-generated electricity, in particular through residential solar arrays. They do this by paying the customer a fee to take credit for the electricity they generate. Each credit is called a "renewable energy credit (or certificate)" (REC), though solar credits are often referred to as SRECs (solar renewable energy credits). REC and SREC prices are set by different mechanisms, but usually, they are sold on the open market. There are too many details to go into here, but here is an example of how this could work: Let's say I have a solar array and I generate 1,000 kWh of electricity in a year (this is 1 MWh of electricity). If the utility agrees to pay $50/SREC, then they would pay me an additional $50 at the end of the year. If I generate 2 MWh, I would get $100, and so on. This is in addition to me not having to pay for the electricity that I generate! In other words, if I generate 1,000 kWh, that is 1,000 fewer kWh that I have to pay the utility for. (This is referred to as net metering.)
RPS benchmarks gradually increase, e.g. 5% in year one, 7.5% in year two, and so on. If a utility does not meet the benchmark in a given year, they are penalized (usually fined).
For example, Colorado passed an RPS in 2004. Details can be found here [227]. Some details relevant to the discussion above are as follows:
- Investor-owned utilities must get 30% of electricity from renewable sources by 2020, with the yearly benchmarks as follows:
- 3% by 2007
- 5% from 2008 - 2010
- 12% from 2011 - 2014
- 20% from 2015 - 2019
- 30% from 2020 moving forward
- Eligible technologies include: "Geothermal Electric, Solar Thermal Electric, Solar Photovoltaics, Wind (All), Biomass, Hydroelectric, Landfill Gas, Wind (Small), Anaerobic Digestion, Fuel Cells using Renewable Fuels Recycled Energy, Coal Mine Methane (if the PUC determines it is a greenhouse gas neutral technology), Pyrolysis of Municipal Solid Waste (if the Commission determines it is a greenhouse gas neutral technology)." As of 2021, renewable energy storage is considered an eligible technology.
- There are a lot of "multipliers," which provide extra incentives for specific types of renewable energy projects. For example, each kWh generated by a community solar project counts as 1.5 kWh toward the RPS goal.
- There are many, many more details of this single policy! I suggest taking a look at the policy to see how intricate policies like this are (and to see one reason why Energy and Sustainability Policy is a useful major!).
 [17]
[17]
Investment and Production Tax Credits
A tax credit is just that, a credit. When an individual or business investor earns a tax credit it means that the amount of the credit will be subtracted from a future tax bill. In the United States, we have a Federal Residential Renewable Energy Tax Credit [229] which provides a tax credit covering 26% of the cost of installation. This is commonly referred to as the investment tax credit or ITC. If you put a photovoltaic system on your roof at a cost of $30,000, you earn a $7,800 tax credit. The government doesn’t mail you a check for this amount. It means you get to deduct that amount from your next tax payment. To realize this money, you will need to have paid at least $9,000 in taxes, but excess credits can "generally" be carried over to future tax years. Note that even if you were owed a refund, this tax credit can be used to increase your refund, as long as you paid at least $7,800 in federal income tax throughout the year. Eligible energy sources include "solar water heat, solar photovoltaics, geothermal heat pumps, wind (small), [and] fuel cells using renewable fuels." This is only applicable to residential customers.
Essentially the same ITC (but it is technically the Business Energy Investment Tax Credit [230]) applies to corporate owners in the following sectors "commercial, industrial, investor-owned utility, cooperative utilities, and agricultural." So basically everyone except for residential, and non-profits. The incentive levels are a little different for some of the energy sources, but solar, wind, and fuel cells earn a 26% credit in 2021, which then decreases at the same rate as the residential ITC afterward.
A production tax credit (PTC) [231] provides an incentive for each kWh of renewable electricity generated and is not based on the up-front cost of the technology. This is a federal incentive. Well, was, anyway. It expired at the end of 2021. This is a per kWh incentive applied to specific installations that were completed prior to the expiration date. The incentives last for 10 years. For example, there was a $0.015/kWh incentive for wind installations prior to 2022. This may not seem like much, but adds up over 10 years! For example, a 2 MW turbine with a 40% capacity factor would generate the following revenue:
- 2 MW = 2,000 kW x 8760 hrs/yr x 0.4 = 7,008,000 kWh/yr
- 7,008,000 kWh/yr x $0.015 = $105,120/yr
A 2 MW turbine is actually on the smaller end of new wind turbine sizes, so even a seemingly meager PTC can be a big deal!
Again, these are only a few of the many, many energy policies that apply to the State of Colorado! This will help provide some context for our experience there, and knowing where to access energy policy information will be helpful for your projects.
Summary and Final Tasks
Summary
By now you should be able to do the following:
- identify and describe major geographic regions and features of Colorado;
- analyze population and precipitation patterns in Colorado;
- describe the basic geology of the Rocky Mountains and the Front Range;
- explain the concept of "first in time, first in right" in terms of Colorado water policy;
- define RPS, REC, SREC, ITC, and PTC as they relate to energy policy;
- explain how renewable portfolio standards incentivize renewable energy.
Reminder - Complete all of the Lesson 6 tasks!
You have reached the end of Lesson 6! Double-check the to-do list on the Lesson 6 Overview page [232] to make sure you have completed all of the activities listed there before you move on to the next lesson.