Wind Energy and Power Calculations
The power in the wind is given by the following equation:
Power (W) = 1/2 x ρ x A x v3
- Power = Watts
- ρ (rho, a Greek letter) = density of the air in kg/m3
- A = cross-sectional area of the wind in m2
- v = velocity of the wind in m/s
Thus, the power available to a wind turbine is based on the density of the air (usually about 1.2 kg/m3), the swept area of the turbine blades (picture a big circle being made by the spinning blades), and the velocity of the wind. Of these, clearly, the most variable input is wind speed. However, wind speed is also the most impactful variable because it is cubed, whereas the other inputs are not.
The following are calculations for power available in the wind at three different velocities for the Northwind 100C turbine. This is the newer version of the Northwind 100A on the previous page. The calculations will show what happens when you double, then triple the velocity. Take a moment to think about how much available power will increase if you double and triple the velocity:
- The standard [1] density of air is 1.225 kg/m3
- The turbine has a 24 m diameter, which means the radius is 12 m. Thus, the swept area of the turbine is: (pi)r2 = 3.14159(122) = 452.4 m2
- We'll start with a 6 m/s wind.
- The power in the wind at 6 m/s is: 1/2 x ρ x A x v3 = 0.5 x 1.225 kg/m3 x 452.4 m2 x (6 m/s)3 = 59,851 W = 59.85 kW
- At 12 m/s: 1/2 x ρ x A x v3 = 0.5 x 1.225 kg/m3 x 452.4 m2 x (12 m/s)3 = 478,808 W = 478.8 kW (8 times as large)
- At 18 m/s: 1/2 x ρ x A x v3 = 0.5 x 1.225 kg/m3 x 452.4 m2 x (18 m/s)3 = 1,615,979 W = 1,616 kW = 1.616 MW (27 times as large)
As you can see, when the velocity doubles, the power increased by a factor of 8 and when the velocity triples, it increases by a factor of 27. This is because the velocity is cubed: 23 = 8 and 33 = 27.
Calculating Wind Turbine Output
The output of a wind turbine is dependent upon the velocity of the wind that is hitting it. But as you will see, the power is not proportional to the wind velocity. Every turbine is different. In order to determine the output of a specific turbine at a given wind velocity, you need its power curve. The power curve and corresponding data for the Northwind 100C can be seen below:
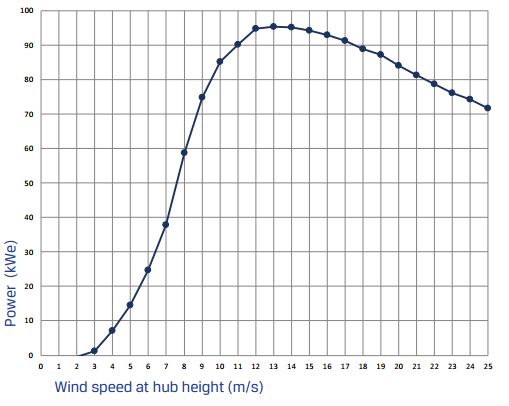
| wind speed (m/s) | 1 | 2 | 3 | 4 | 5 | 6 | 7 | 8 | 9 | 10 | 11 | 12 |
|---|---|---|---|---|---|---|---|---|---|---|---|---|
| power output (kW) | -0.5 | -0.5 | 1.2 | 7.2 | 14.5 | 24.7 | 37.9 | 58.7 | 74.8 | 85.1 | 90.2 | 94.7 |
| wind speed (m/s) | 13 | 14 | 15 | 16 | 17 | 18 | 19 | 20 | 21 | 22 | 23 | 24 | 25 |
|---|---|---|---|---|---|---|---|---|---|---|---|---|---|
| power output (kW) | 95.3 | 95.1 | 94.2 | 92.9 | 91.2 | 88.9 | 87.1 | 84.1 | 81.3 | 78.6 | 75.1 | 74.3 | 71.7 |
As you can see, even though this is a 95 kW turbine, it only provides (approximately) that much power at a very limited number of wind speeds - about 12 m/s through about 15 m/s. Counterintuitively, the power output decreases if the wind speeds up past that point. For safety reasons, the turbine will stop spinning if the wind speed is higher than 25 m/s.
Assuming the turbine is operating properly, the output calculation is pretty straightforward. You just multiply the output at a given velocity by the number of hours the wind is blowing at that velocity. For example, let's assume that the wind hitting a Northwind 100C in a given day has the following velocities. (Note that in reality, the wind would likely change much more frequently than this. I just wanted to make the math relatively easy.):
| velocity (m/s) | number of hours at that velocity |
|---|---|
| 6 | 4 |
| 8 | 8 |
| 12 | 5 |
| 15 | 4 |
| 16 | 3 |
| 16 | 3 |
The total output at 6 m/s would be: 24.7 kW (the output at 6 m/s from the power curve table) x 4 hrs = 98.8 kWh.
Based on the power curve table above, the total output for this day would be:
| velocity (m/s) | number of hours at that velocity | total output (kWh) |
|---|---|---|
| 6 | 4 | 98.8 |
| 8 | 8 | 469.6 |
| 12 | 5 | 473.5 |
| 15 | 4 | 376.8 |
| 16 | 3 | 278.7 |
| 16 | 3 | 278.7 |
| Total | 24 | 1,697.4 |
Capacity Factor
One last consideration to make for wind turbines (or any energy source) is something called capacity factor. Capacity factor indicates how much energy is generated by a source relative to the maximum amount of energy it could provide. This is expressed as a percentage, and is usually determined over the course of a single year. This provides insight into how well-sited the turbine is, but in general indicates how available an energy source is throughout the year. The closer to 100%, the more the energy source is available throughout the year.
The formula is capacity factor = actual output/maximum possible output.
For a wind turbine, the maximum possible output would be the capacity x 8760 hr (there are 8760 hrs in a year). So for the Northwind 100C, the maximum output is: 95 kW x 8760 hr/yr = 832,200 kWh/yr (or 832.2 MWh). If the actual output over the course of a year was 250,000 kWh, the capacity factor would be:
- capacity factor = actual/maximum output = 250,000 kWh/832,200 kWh = 30%
The average capacity factor of the U.S. wind fleet hovers around 32% - 34% [3], but new turbine designs have been tested in the 60%+ range, like the 12 MW behemoth [4] by GE. It's not unusual to see 40% and up capacity factors for well-sited wind farms.