Lesson 6: Solar and Anaerobic Digestion
Overview
In this lesson, we'll go over solar and anaerobic digestion in a little more detail. We will see some of this in our travels, and I want you to have a better understanding of some of the basics.
Learning Outcomes
By the end of this lesson, you should be able to:
- identify different types of solar technologies;
- explain the basic process by which solar panels generate electricity;
- explain the difference between irradiance and irradiation;
- calculate energy use/generation given power and time;
- evaluate the impact of tilt and orientation on solar PV output;
- calculate the output of a solar array;
- explain how anaerobic digestion converts organic material to biogas; and
- identify some of the benefits of anaerobic digestion.
Lesson Roadmap
| To Read | Lesson 6 Online Content | You're here! |
|---|---|---|
| To Do |
|
|
Questions?
If you have any general course questions, please post them to our HAVE A QUESTION discussion forum located under the Discussions tab in Canvas. I will check that discussion forum regularly to respond as appropriate. While you are there, feel free to post your own responses and comments if you are able to help out a classmate. If you have a question but would like to remain anonymous to the other students, email me through Canvas.
If you have something related to the material that you'd like to share, feel free to post to the Coffee Shop forum, also under the Discussions tab in Canvas.
Solar Energy
As was detailed in an earlier lesson, solar energy is electromagnetic (aka radiant) energy that is generated by the (nuclear) fusion of hydrogen atoms into helium atoms in the sun. The amount of radiant energy that is released by an object is related to its temperature, and since the sun is so hot (~10,000º F!) [1], it is able to reach the ~94,000,000 miles (the distance depends on the time of year) to the earth. It is a massive amount of energy! A commonly cited statistic is that enough solar energy reaches the earth each hour to provide all of humanity's energy for an entire year. There is no shortage of solar energy.
Types of Solar Energy Technologies
Without the sun, life on earth would not be possible. It provides energy for vegetation to grow and provides sufficient heat to allow water to exist in liquid form, among other things. But there are many ways that humans can use this radiant energy more deliberately. The following is an overview of the major types of solar technologies. We could spend weeks analyzing each of these - keep in mind that this is just an overview.
- Solar photovoltaics (solar PV): Certain materials have the natural property of converting energy from the sun into electricity. When the sun hits these materials, electrons start to flow, creating a direct current (DC). This is the photovoltaic effect. This is described in more detail below.
- Solar thermal: This is a broad term for systems that use energy from the sun to heat water (or other material) for a variety of purposes. One common application is heating water for domestic hot water or swimming pools.
- Concentrated solar: There are a variety of ways to concentrate solar power for use. All of them gather solar energy over a wide area (usually by using mirrors) and concentrating it into a smaller location. This very high level of power is then often used to generate electricity. The DOE has a good explanation of some technologies here [2].
- Passive solar: Passive solar is a type of solar thermal that uses passive system design (e.g. south-facing windows, strategically-placed overhangs) to passively heat interiors of buildings. This is a great low-tech way to use solar energy! (Click here for more information about passive solar from the DOE.) [3]
Solar Photovoltaics and Availability of Solar
The rest of the solar lesson will focus on solar photovoltaics or solar PV. As noted above, photovoltaic technology (aka the photovoltaic effect) converts radiant solar energy into electricity. View the short video below from the U.S. Department of Energy for a brief explanation. Note that the narrator of the video indicates that photons provide the energy that is converted into electricity. NASA describes [4] the relationship between photons and electromagnetic energy thusly: "Electromagnetic radiation can be described in terms of a stream of mass-less particles, called photons [5], each traveling in a wave-like pattern at the speed of light [6]." So photons are generally considered to be what carries the energy that is emitted in waves.
All right, we all know that the sun's energy creates heat in light, but it can also be converted to make electricity, and lots of it. One technology is called solar photovoltaics or PV for short. You've probably seen PV panels around for years, but recent advancements have greatly improved their efficiency and electrical output. Enough energy from the sun hits the earth every hour to power the planet for an entire year. Here's how it works.
You see, sunlight is made up of tiny packets of energy called photons. These photons radiate out from the Sun and about 93 million miles later, they collide with a semiconductor on a solar panel here on earth. It all happens at the speed of light. Take a closer look and you can see the panel is made up of several individual cells, each with a positive and a negative layer, which create an electric field. It works something like a battery, so the photons strike the cell and their energy frees some electrons in the semiconductor material. The electrons create an electric current which is harnessed by wires connected to the positive and negative sides of the cell. The electricity created is multiplied by the number of cells in each panel and the number of panels in each solar array. Combined, a solar array can make a lot of electricity for your home or business. this rooftop solar array powers this home, and the array on top of this warehouse creates enough electricity for about a thousand homes.
Okay, there are some obvious advantages to solar PV technology. It produces clean energy. It has no emissions, no moving parts, it doesn't make any noise, and it doesn't need water or fossil fuels to produce power. And it can be located right where the power is needed, in the middle of nowhere, or it can be tied into the power grid. Solar PV is growing fast and it can play a big role in America's clean energy economy anywhere the sun shines.
Okay, so a solar panel converts radiant to electrical energy by using the unique properties of a semiconductor, usually, silicon combined (doped) with other elements (usually boron and phosphorous). But how much energy and power does a panel generate? As you might guess, it depends on a lot of factors. The following is an overview of some of these factors.
- First, a quick primer on power vs. energy.
- Energy is the ability to do work. It is a discrete amount of "something," and that "something" makes things happen (makes things move, generates sound, generates heat, etc.). If one thing has more energy than another thing, then it is hypothetically capable of doing more "stuff." In the U.S., energy is usually measured in Btus, or if it's electrical energy, kilowatt hours (kWh). One kWh is 1,000 Wh, which is also a unit of energy. The international unit of energy is the Joule (J).
- Power is the rate at which energy is converted. Practically speaking, it indicates how quickly you are "using" energy or the rate at which energy is being provided. Power is usually measured in watts (W) or horsepower (HP). A light bulb that uses 100 W of power is converting 100 Joules of electricity into heat and light each second. A 200 W light bulb is converting energy twice as quickly. A 1,000,000 W power plant (1 MW) is providing energy twice as quickly as a 500,000 W (500 kW) power plant. (Note that the light bulbs and power plants are all just converting one form to another, but from our perspective, one is "using" energy and one is "generating" energy. It's a matter of perspective.)
- Energy = power x time. For example:
- If you use a 100 W light bulb for 1 hour, you use (100 W x 1 h = ) 100 Wh.
- If you use a 100 W light bulb for 1 hour each day for a year, you use (100 W x 1 hr/day x 365 days/yr = ) 36,500 Wh = 36.5 kWh.
- If you use 10 light bulbs, each 100 W, for 1 hour you use (10 bulbs x 100 W/bulb x 1 hr = ) 1,000 Wh or 1 kWh.
- If a 5,000 W (5 kW) solar array operates at full capacity for 1 hr, it generates (5,000 W x 1 hr = ) 5,000 Wh or 5 kWh of electricity. This is the energy that is generated by the panels, but some of that energy will be lost by the time it is used.
- If a 1,000,000,000 W (1 GW) power plant operates at full capacity for 24 hours, it would generate (1 GW x 24 hr = ) 24 GWh of electricity.
- If a 100,000 Btu/hr furnace operates at full capacity for 2 hours, it would use (100,000 Btu/hr x 2 hr = ) 200,000 Btu of energy.
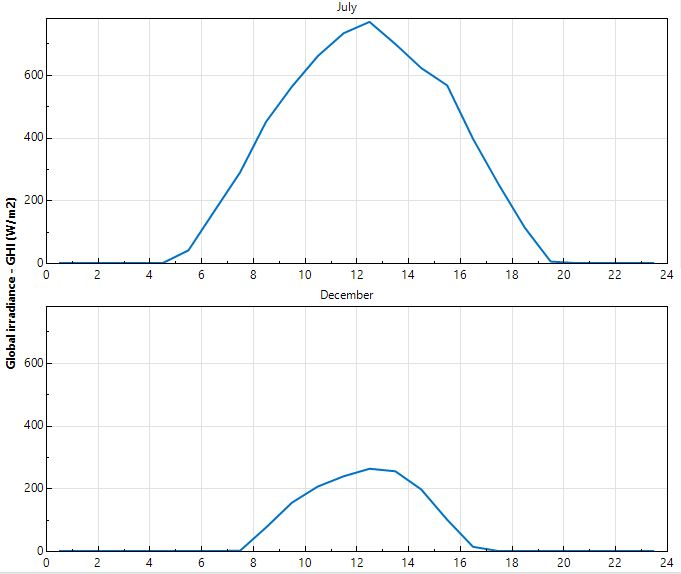
- Irradiance is the amount of solar power (not energy) incident on a given surface area at any given time. This is usually measured in Watts per square meter (W/m2). All else being equal, more irradiance results in more output from a panel. Irradiance levels change throughout the day, as you can see in the image below. These charts illustrate the average hourly irradiance in State College, PA in July and December. As you can see, the peak irradiance in July averages about 750 W/m2. This is the irradiance on a horizontal surface. If you could tilt the surface (say, a solar panel) so it is perpendicular to the sun, the noon irradiance would be more than 1,000 W/m2. So if you want to imagine 1,000 W/m2, think of how your skin feels on a really hot summer day at Penn State. Hopefully, this gives you a "feel" for irradiance.
- Irradiation is the amount of solar energy that hits a surface over a given period of time. This is usually measured in kWh/day/m2 or kWh/yr/m2. See the chart below for a map of irradiation in the U.S., which illustrates the average daily irradiation levels throughout the year in the U.S. Of course the irradiation will change throughout the year (more in the summer and less in the winter), but this chart provides a clear idea of the overall amount of solar energy that is available all year. (Note that you could easily find the average annual irradiation by multiplying the daily irradiation by 365.) Keep in mind that this is the average daily irradiation on a surface that is "latitude tilt," which will be explained in more detail below. The chart provides an indication of solar potential. (Note that due to panel inefficiency and a few other factors, a solar panel will only convert a fraction of this solar energy into electricity.)

Solar PV
We will experience some solar PV installations and technology while traveling, so I provide some more details about it below.
- In order to maximize panel output, the panel should be as close to perpendicular to the sun's rays as possible, which allows it to capture the most solar energy possible at a given time. (Here is a really good interactive animation [10] of why a perpendicular panel captures the most sunlight.) Most solar panels are fixed, i.e., they don't move. This means that you need to choose your location carefully. For fixed panels, there are two factors to consider in this regard:
- Azimuth/orientation is the compass direction that the panel faces. Typically, 0º is due north, 90º is east, 180º is south, and 270º is west.
- Tilt is the angle above the horizon to which the panel is tilted.
- Shading is a very important consideration as well. All else being equal, more shading means less output.
- In the Northern Hemisphere, the rule of thumb to maximize the output of a fixed panel is that the panel should be faced due south (180º orientation) and at "latitude tilt." You may recall from a Geography class that latitude is how far north or south a location is from the equator. The equator is 0º, the tropics are at 23.5º, and the North and South Poles are at 90º north and south, respectively.
- For example, State College, PA is at just over 40º north, so the ideal array tilt is about 40º, and the ideal azimuth is 180º (south).
- Anchorage, Alaska is at about 61º north, so the ideal tilt and azimuth are about 61º and 180º (south), respectively.
A few more terms that are important to know:
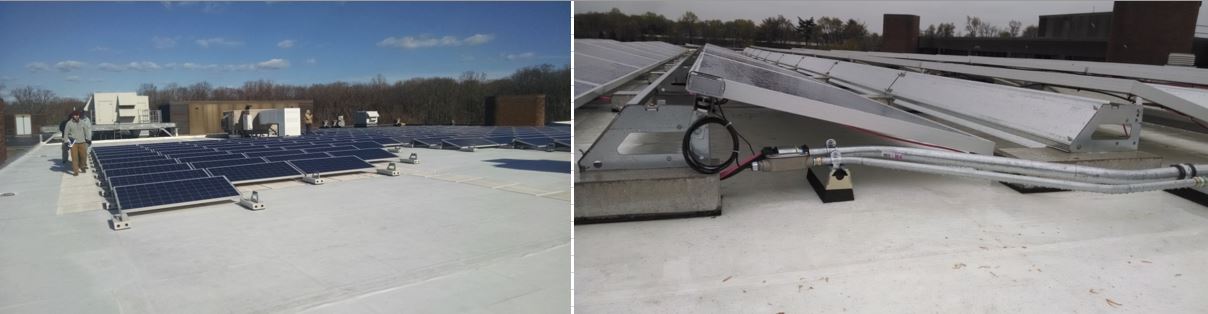
- A solar cell is the smallest current-generating part of an array. They can be any size but are normally around 6 inches by 6 inches. It's difficult to see, but in the image above there are 72 cells in each panel (12 rows, each with 6 cells).
- A solar panel (aka module) is a number of cells wired together in a single panel. They can be any size but are usually about 5 feet by 3.25 feet [11].
- A solar array is a number of panels wired together. The image above shows part of a solar array, which as I noted has 270 total panels.
- Capacity refers to the rated maximum output of a panel or array. Under optimal conditions, a 250 W panel will output about 250 W of electricity. Note that this is only the immediate output. By the time the electricity goes to the building or the grid, some of it is lost due to a variety of factors (usually 10% - 15%).
- The array above has 270 panels, and each panel has a capacity of 305 W. Thus, the capacity of the array is (305 W x 270 = ) 82,350 W, which is 82.35 kW.
- A solar panel outputs DC (direct current) electricity. DC means that the electricity flows in one direction. Household outlets (and the electric grid) use AC (alternating current) electricity, which rapidly alternates direction of flow (60 times per second in the U.S., in case you are interested), so electricity from an array must be converted to AC if it is to be used in a building or distributed to the grid. An inverter is a piece of equipment that converts DC to AC and is a standard part of most solar arrays.
- A grid-tied array is one that is connected to the grid. A standalone or off-grid system is not tied to the grid.
The Impact of Tilt and Orientation
Recall that the rule of thumb is that the optimal tilt is "latitude tilt," and the ideal orientation in the Northern Hemisphere is due south (180º). This begs the question: what happens if the tilt and orientation are not optimal? The answer, as you might guess, is "it depends." This impact can be quantified by something that is called tilt and orientation factor (TOF). The tilt and orientation factor is a decimal that indicates what percent of the maximum solar output you would receive throughout the year at said tilt and orientation. So if you install an array and it has a TOF of 0.85, that means that it will only be able to output about 85% of the energy it would output if it were at the ideal tilt and orientation.
Wilmington, Delaware is at about 40º north. As it turns out, the ideal tilt is closer to 35º (rules of thumb are only rules of thumb, after all!). The tables below show the TOF at different tilts and azimuths. The first table illustrates the TOFs of different tilts, all with an orientation of 180º. The second table shows the TOFs at different azimuths, all at a tilt of 35º (the ideal tilt). (You can investigate the TOF for locations throughout the U.S. by going to the Solmetric website [12].)
| Tilt (º) | Azimuth (º) | TOF |
|---|---|---|
| 0 | 180 | 0.87 |
| 5 | 180 | 0.905 |
| 10 | 180 | 0.935 |
| 15 | 180 | 0.959 |
| 20 | 180 | 0.978 |
| 25 | 180 | 0.991 |
| 30 | 180 | 0.999 |
| 35 | 180 | 1.0 |
| 40 | 180 | 0.996 |
| 45 | 180 | 0.985 |
| 50 | 180 | 0.969 |
| 55 | 180 | 0.947 |
| 60 | 180 | 0.92 |
| 65 | 180 | 0.888 |
| 70 | 180 | 0.851 |
| 75 | 180 | 0.81 |
| 80 | 180 | 0.764 |
| 85 | 180 | 0.715 |
| 90 | 180 | 0.662 |
| Tilt (º) | Azimuth (º) | TOF |
|---|---|---|
| 35 | 90 | 0.797 |
| 35 | 100 | 0.833 |
| 35 | 110 | 0.897 |
| 35 | 120 | 0.898 |
| 35 | 130 | 0.926 |
| 35 | 140 | 0.951 |
| 35 | 150 | 0.972 |
| 35 | 160 | 0.986 |
| 35 | 170 | 0.996 |
| 35 | 180 | 1.0 |
| 35 | 190 | 0.997 |
| 35 | 200 | 0.989 |
| 35 | 210 | 0.976 |
| 35 | 220 | 0.956 |
| 35 | 230 | 0.932 |
| 35 | 240 | 0.905 |
| 35 | 250 | 0.874 |
| 35 | 260 | 0.839 |
| 35 | 270 | 0.803 |
Calculating Solar Output
Okay, now we're ready to calculate the solar output. There are a number of software programs and a formula or two that can do this, but the National Renewable Energy Laboratory (NREL) provides a free one that is well-regarded in the energy industry called PVWatts [13]. In the video below, I demonstrate how to calculate the annual output of the array in the images above, which has the following specs:
- address: 400 Stanton Christiana Rd, Newark, DE
- 82.35 kW capacity
- 13º tilt
- 222º azimuth
Alright so, I'm going to demonstrate how to use the PVWatts Software from NREL. So, here is the home page. You can Google PVWatts and this will come up. And so, first thing you do is you type in the address. So this is based on the array that's detailed on the course website. So my address here is 400 Stanton Christiana Road in Newark. Ok, so you just click enter. And click go. And so, it used to be that it would come up with a map here, but they changed some things about this. So what it does, it just tells you the latitude and longitude of where you are. And so, I just happen to know that this is the right latitude and longitude, so I'm going to click to go to system info here. Ok, and here is where I can enter the specifics of the system. So, you can see the first window here is the DC system size, so this is the capacity. So mine is a 82.35 kW, you notice this is in kW, so be very careful about that. The module type, you have a couple different kinds. This is standard module. The fixed open rack is fixed meaning it's not, it doesn't move so there's no tracking. I mean you could do one to two-axis tracking here. The system losses, this shows you the overall losses from the rated capacity. So, I'm going to click on this loss calculator just to show you some of the variables here.
So this comes up, you can see that here. So right now the estimated system losses are 14%. And you can see that these are the actual, the individual factors in those losses. So soiling meaning you know, dust and stuff that gets on the panel. Shading, so it's assuming there's some shading part of the time. In this case, 3% of the time. You know, is there snow? Is there panel mismatches? Panels have small imperfections so they might have slightly different voltages. So there's wiring losses anytime you run electricity through a wire. There's heat losses. Connections to this is just sort the you know, the connections between the modules and other components. There's some degradation that occurs through panels getting warm, and it's also they just degrade a little bit over time. This name-plate rating there's slight imperfections, you know, the panels are usually guaranteed to be, have this capacity within a certain percentage. And then if they're older, you would actually, panels degrade over time. And the availability just means sometimes the system goes down for repairs or whatever, ok? And so you can actually change this. So like if I said this is in a perfect location without any shading at all I could put zero in here and you notice this drops to 11%. So we'll just go with our standard 14% and then you can click save. Ok? So that's where all the system losses come from. Now you can enter in your total. In this case, I have 13 degrees. Your azimuth, remember, is your also the same as your orientation. This one happens to be 222 degrees.
Ok, so now, you can also add some cost considerations. There's some other parameters you can feel free to mess around with those. In this case, this is actually commercial and I'm just going to, I happen to know our utility rate at our school. It's about 8 cents a kilowatt hour. Ok. Good, good, good.
Now you could also draw the system. Actually, you can't anymore. You used to be able to draw your system on a rooftop using Google Maps, but you can't do that.
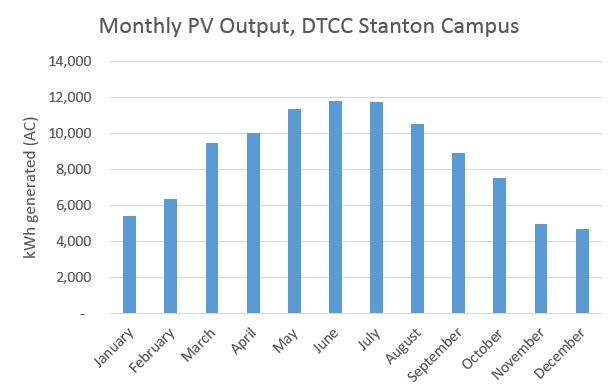
Ok, so now we click to go to the results. And, here you go. So based on the system specs that I put in there, I'm going to generate about 106,000 kWh per year. Keep in mind that, you know, it says 106,365. This, you know, you should take this as a round number. You could have a really good solar year. There's a bunch of extra, you know, energy generated. You could have a bad year the system could go down a lot. There's I don't know a bunch of extra moisture and dust in the air, whatever. So this is just a really good estimate. Ok. Yeah, see it even gives you the range here. Based on this location, 101 to 110 kWh per year. So this actually gives you the month to month break down. Ok. So here's your actual output in AC. Remember panels produce DC, so this is AC output. And this is based on the cost information that I put into the specs on the previous sheet. So it's saying that, you know, I would earn about, or save about 8500 dollars a year with this system. Now what's really cool about this, is you can actually download these results. So, you can download this exact information but in spreadsheet form. And you can even download the hourly results which is really cool. I mean you get this Excel spreadsheet with 8,760 rows in it. It tells you the estimated output under normal typical meteorological conditions throughout an average year. So that's pretty cool. And then you can use, you know, make charts and so forth in Excel. Ok, so that's a basic tutorial on how to use PVWatts.
A Few More Notes
Hopefully, by now you have a relatively good grasp on some of the considerations that go into designing and calculating the output of solar PV. Solar PV really took off in the early- to mid-2000s, led by residential array installations, which generally had capacities of a few kW. The solar industry in the U.S. is not dominated by utility-scale solar, which is much cheaper per W to construct because of economies of scale. Utility-scale arrays can be thousands of watts (multiple MWs) in capacity!
Finally, there are a few ways that people can use and pay for solar PV:
- Systems can be purchased and owned by individuals. This can be done out-of-pocket or using loans. Out-of-pocket purchases usually generate the highest return.
- Power purchase agreements allow people or businesses to pay a third party to build an installation on their own roof. The individual or business then pays the third party for the electricity generated at a contractually agreed-upon rate. This is the model that SolarCity (now Tesla Energy) used to rise to prominence. This is a popular model because it requires no up-front cost (among other reasons).
- Community-owned solar or just community solar is used increasingly in the U.S. and elsewhere. Community solar allows individuals to "buy into" a solar array that is installed somewhere else, or perhaps on a shared roof or field space. This provides access to individuals and businesses that would not otherwise be able to use solar due to factors such as not having a suitable site (e.g., a heavily shaded roof) or living in rented space. (The SEIA provides a good overview of community solar here [14], and NREL provides a more robust explanation here [15].)
- Most utility-scale installations effectively act as power plants, and the electricity is sold to the grid.
Anaerobic Digestion
You may recall from EM SC 240N that bioenergy is energy that comes from living or recently living things. Common examples include wood from trees used for heating and ethanol from corn used as a gasoline additive. Another form - and one that we will see while traveling - is called anaerobic digestion. "Anaerobic" refers to "without air" and the "digestion" part refers to the microorganisms that digest organic material. Putting it together, anaerobic digestion refers to microorganisms breaking down organic material when no oxygen is present. The following descriptions of anaerobic digestion are from the EPA's Anaerobic Digestion website. All points of emphasis (bold letters) are mine:
Anaerobic Digestion
Anaerobic digestion is the natural process in which microorganisms break down organic materials. In this instance, “organic” means coming from or made of plants or animals. Anaerobic digestion happens in closed spaces where there is no air (or oxygen). The initials “AD” may refer to the process of anaerobic digestion or the built system where anaerobic digestion takes place, also known as a digester.
The following materials are generally considered “organic.” These materials can be processed in a digester:
- Animal manures;
- Food scraps;
- Fats, oils, and greases;
- Industrial organic residuals; and
- Sewage sludge (biosolids).
All anaerobic digestion systems adhere to the same basic principles whether the feedstock is food waste, animal manures or wastewater sludge. The systems may have some differences in design but the process is basically the same
Byproducts of Anaerobic Digestion
Biogas is generated during anaerobic digestion when microorganisms break down (eat) organic materials in the absence of air (or oxygen). Biogas is mostly methane (CH4) and carbon dioxide (CO2), with very small amounts of water vapor and other gases. The carbon dioxide and other gases can be removed, leaving only the methane. Methane is the primary component of natural gas.
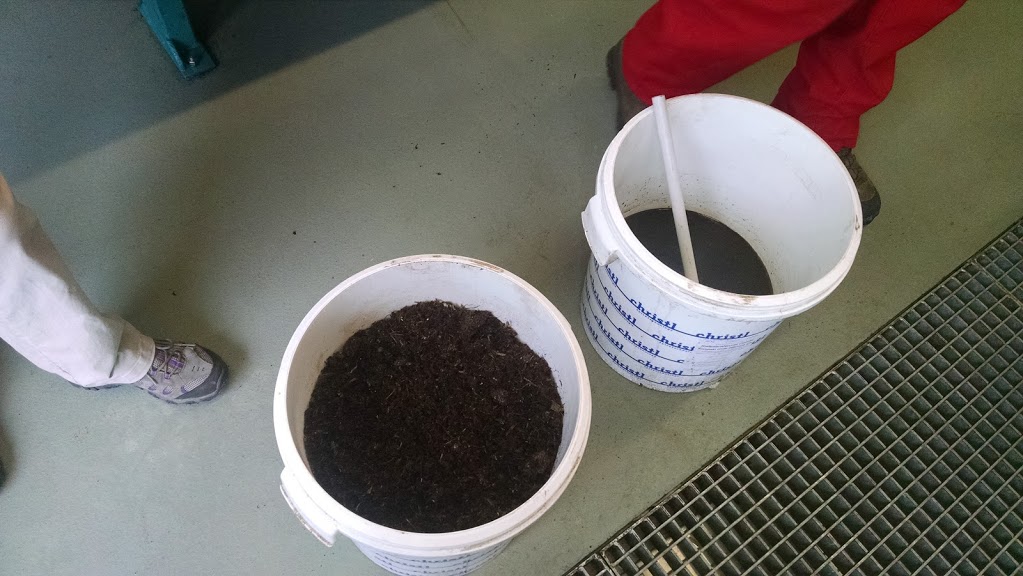
The material that is left after anaerobic digestion happens is called “digestate.” Digestate is a wet mixture that is usually separated into a solid and a liquid. Digestate is rich in nutrients and can be used as fertilizer for crops
Uses of Anaerobic Digestion Byproducts
Biogas is produced throughout the anaerobic digestion process. Biogas is a renewable energy source that can be used in a variety of ways. Communities and businesses across the country use biogas to:
- Power engines, produce mechanical power, heat and/or electricity (including combined heat and power systems);
- Fuel boilers and furnaces, heating digesters and other spaces;
- Run alternative-fuel vehicles; and
- Supply homes and business through the natural gas pipeline
How biogas is used and how efficiently it’s used depends on its quality. Biogas is often cleaned to remove carbon dioxide, water vapor and other trace contaminants. Removing these compounds from biogas increases the energy value of the biogas...Biogas treated to meet pipeline quality standards can be distributed through the natural gas pipeline and used in homes and businesses. Biogas can also be cleaned and upgraded to produce compressed natural gas (CNG) or liquefied natural gas (LNG). CNG and LNG can be used to fuel cars and trucks.
Digestate is the material that is left over following the anaerobic digestion process. Digestate can be made into products like:
- Bedding for livestock;
- Flower pots;
- Soil amendments; and
- Fertilizers.
When properly processed, dewatered digestate can be used as livestock bedding or to produce products like flower pots.
Digestate can be directly land applied and incorporated into soils to improve soil characteristics and facilitate plant growth. Digestate can also be further processed into products that are bagged and sold in stores. Some emerging technologies can be employed post-digestion to recover the nitrogen and phosphorus in digestate and create concentrated nutrient products, such as struvite (magnesium-ammonium-phosphate) and ammonium sulfate fertilizers.
The video below from Michigan State University does a great job of explaining how they use anaerobic digestion to convert organic cafeteria and farm waste into useful energy and fertilizer. To view the transcript (and the video on YouTube, click this link [16].)
The South Campus anaerobic digester at Michigan State University aims to reduce odor and emissions from manure, food waste and biosolids, create a closed cycle for recycling organic material, and generate renewable energy. The digester will use a mix of dairy manure, dining hall food waste, biosolids (which are nutrient-rich organic materials), and other organic material from campus in the greater Lansing area. Once delivered, the food waste and biosolids will be treated (heated and pasteurized) at 160 degrees Fahrenheit for one hour to eliminate any potential pathogens. The material will then be mixed with manure from the MSU Dairy Teaching and Research Center and pumped into the digester.
The anaerobic digester is a sealed, airtight tank, which can hold 300,000 gallons. Organic material will be heated to 100 degrees Fahrenheit and will remain in the digester for 20 to 30 days. Inside the tank, mixers in the digester evenly distribute microorganisms. These microorganisms break down the mixture, producing biogas and nutrient-rich digestate. Biogas, which is roughly 60% methane, is a form of renewable energy which will be used to generate electricity. The system will generate enough electricity to offset the MSU DTRC, around 300 kilowatts per hour, with enough left over to help power MSU. The capturing and use of biogas will generate energy, shrink the carbon footprint of campus, and improve sustainability. What's left in the process is digestate, the nutrient-rich mixture that will be held in the final, storage tank until it can be utilized. Mixers in the storage tank will minimize settling for the potential 2.7 million gallons of digestate. Any unused biogas can also be stored in the sealed headspace. The nutrient-rich digestate will be used to fertilize croplands or other biological treatment processes to fuel research opportunities.
By utilizing anaerobic digestion technology, the organic materials from MSU will become resources. Renewable energy is created, while odors are reduced and emissions are eliminated. This project is one example of how Michigan State University is actively working to improve sustainability.
Thermodynamically speaking, the energy conversion process is:
- Sunlight is converted to biomass by plants.
- Plants are either used in the digester and converted to methane and CO2 or...
- Biomass is eaten by animals and converted to another form of biomass.
- Organic waste from animals is used in the digester and converted to methane and CO2.
- The methane can then be used for electricity and/or heat.
It is extremely important to keep in mind that this is a natural process, and thus will occur any time organic material is subjected to low- or no-oxygen conditions. One important implication of this is that organic material that ends up buried in a landfill will convert partially to methane because there is very little oxygen underneath all of that "junk." As I'm sure you recall, methane is about 30 times more potent than CO2 in terms of its global warming impact. If you took the same organic material and let it biodegrade in the open air (i.e., with access to oxygen) it would release mostly CO2. The sad irony of this is that well-meaning people and companies can actually make the (climate change) problem worse if their biodegradable containers end up in the landfill. This methane can be captured, and in many places in the U.S. and throughout the world is. This is also why impoundment hydroelectric facilities (big dams) can cause methane emissions - organic material collects upstream of the dam, and low-oxygen conditions often occur near the bottom of the reservoirs, causing methane to be released. Systems thinking, everyone!
Anaerobic Digestion Examples
Digesters can be pretty much any size. I've seen one as small as a car inner tube that was used to power a gas grill and heat a small greenhouse. Some of them can be larger, as you'll see below.
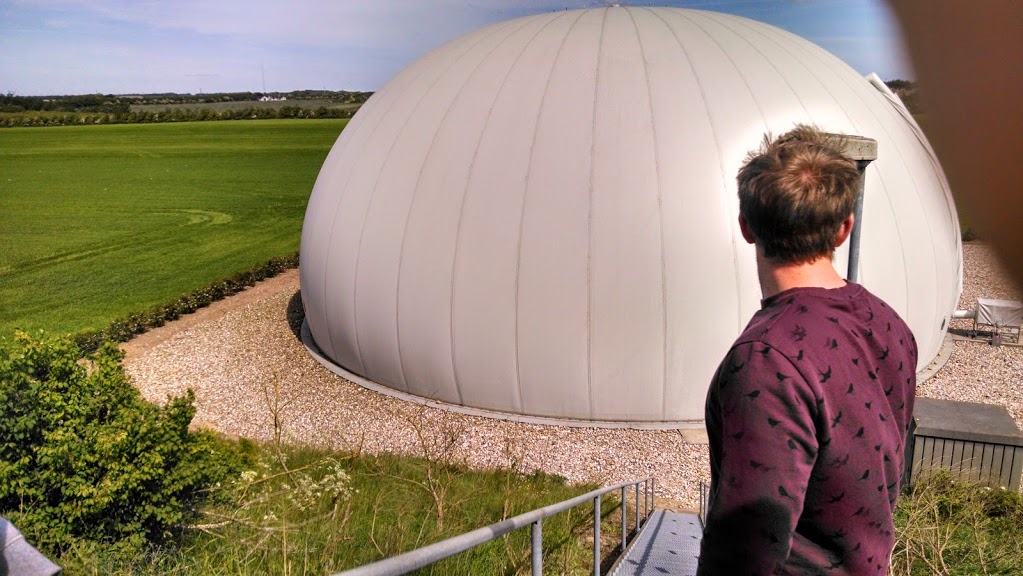
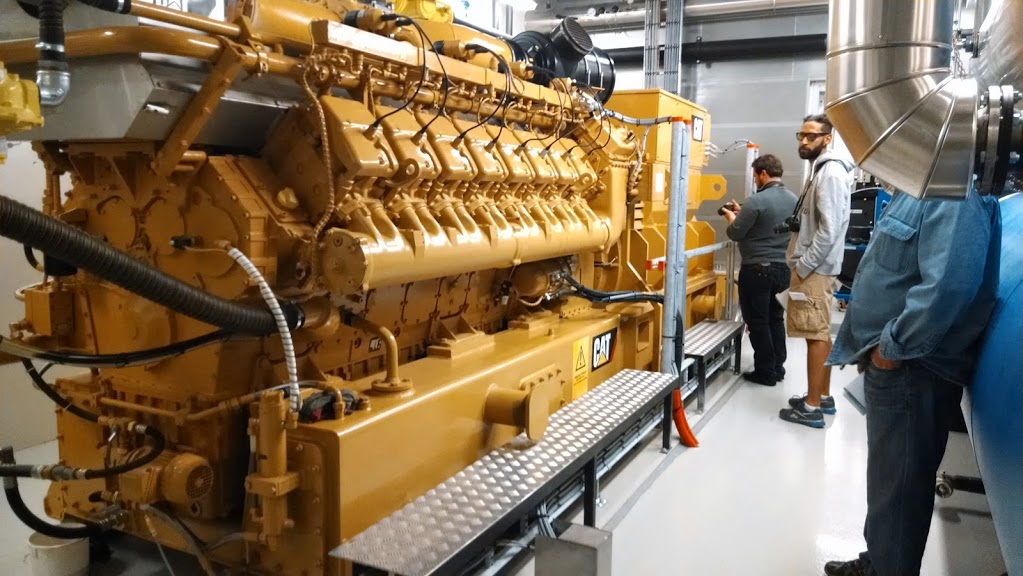
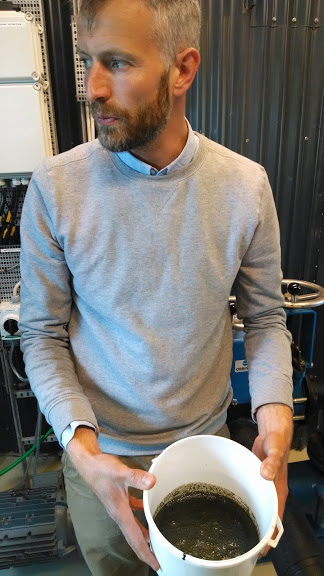
The pictures below are from a cooperatively-owned anaerobic digester in Lemvig, Denmark. I'm particularly fond of this because the entire setup is owned equally by about 25 farmers, and is a non-profit operation. All of the organic waste from the farms is transported to the digester, including leftover vegetation and various types of manure. The biogas is used to generate electricity in a turbine which is either sold to the grid or used in the digester, and the "waste" heat is used to run the anaerobic digester. The remaining heat is used for district heating for the town - it heats up water, which is then run through underground pipes to be used to heat homes. This type of generator is considered cogeneration, which means it is used to generate electricity and useful heat. Recall that most power plants are about 35% efficient because so much energy is wasted as heat. Believe it or not, this cogeneration system is over 90% efficient when you include all of the "waste" heat that is captured and used! All digestate is then returned to the local farms and used as organic fertilizers. It is truly a closed-loop system!
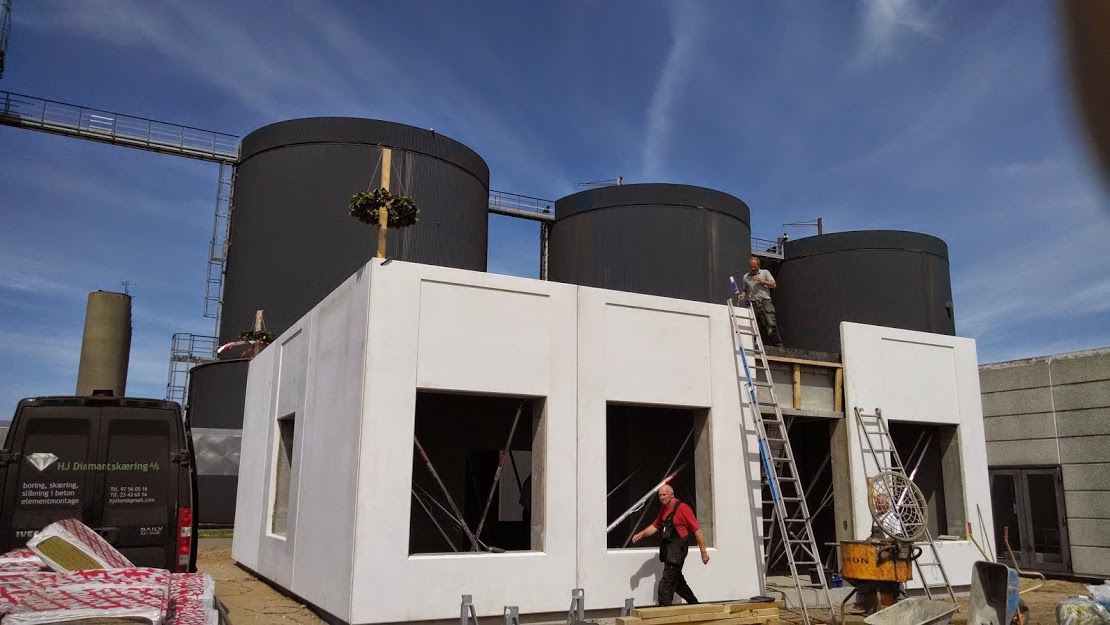
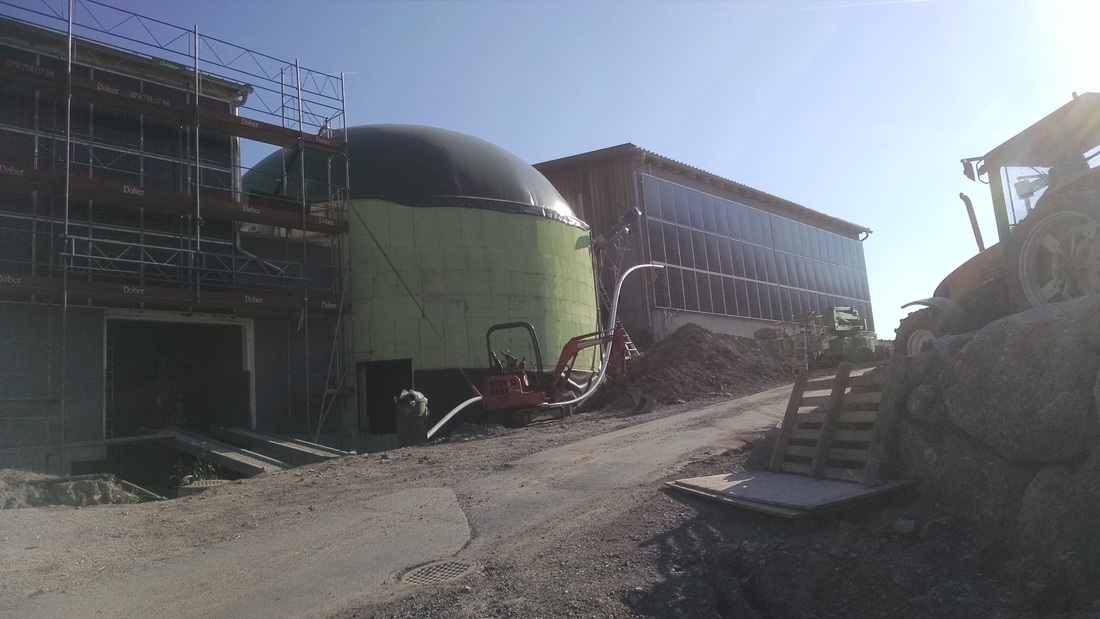
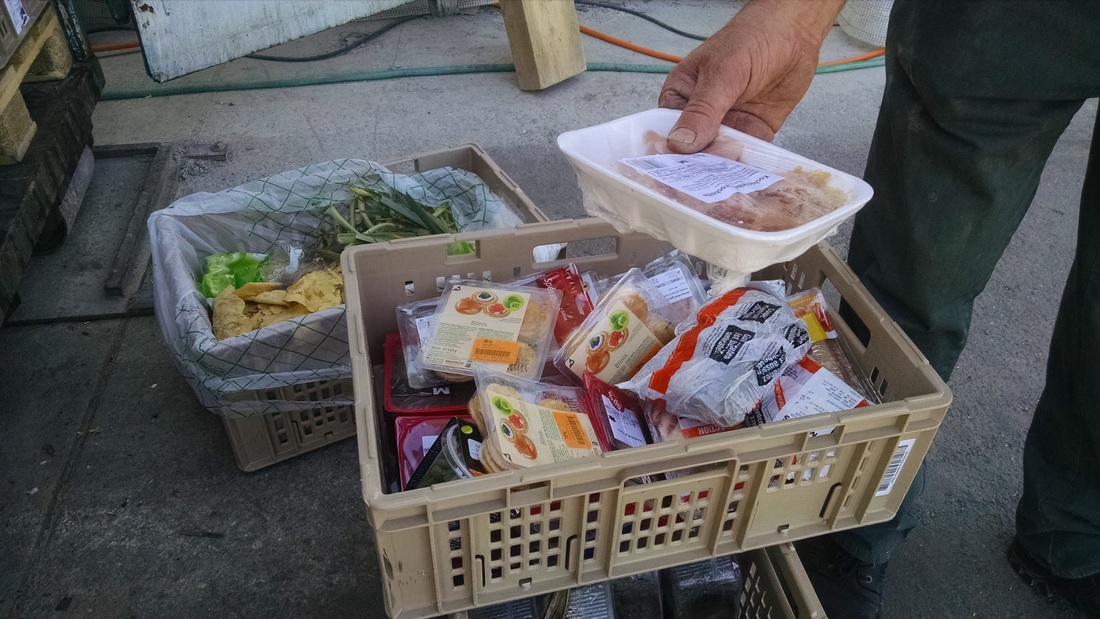
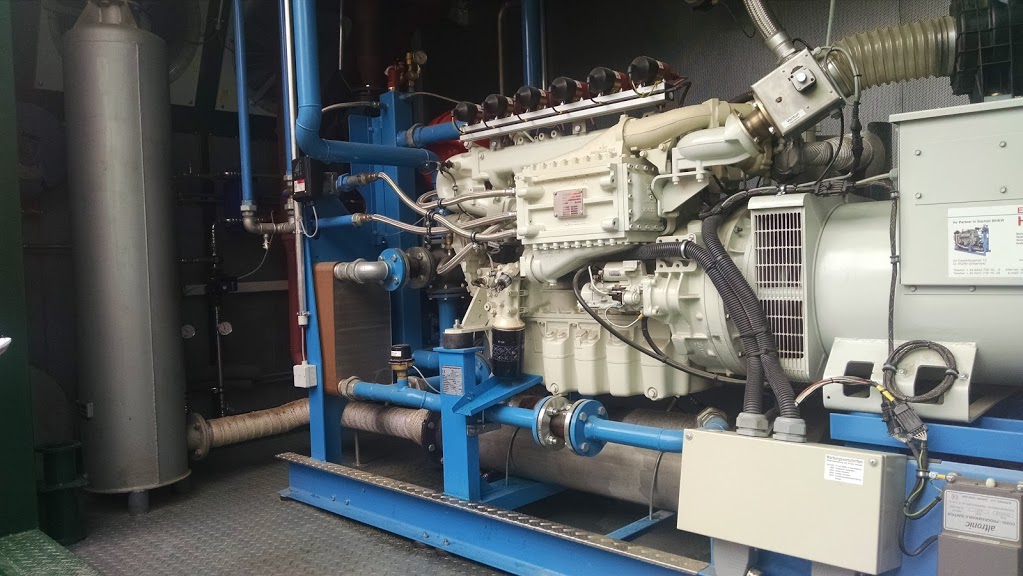
The images below show details of a smaller installation in Kussnacht, Switzerland. This installation is run by a single farmer (Seppi), who collects organic waste from his farm, other local farms, and area restaurants. Like the one above, Seppi collects the biogas and uses it in a cogeneration system that is about 90% efficient (50% heat, 40% electricity, and 10% is wasted). He runs a 100 kW generator and uses the electricity on his farm and sells the leftover to the grid. The heat is used to run the digester, and to provide space and water heating to his farm. He uses some digestate on his farm and gives the rest back to local farmers for free.
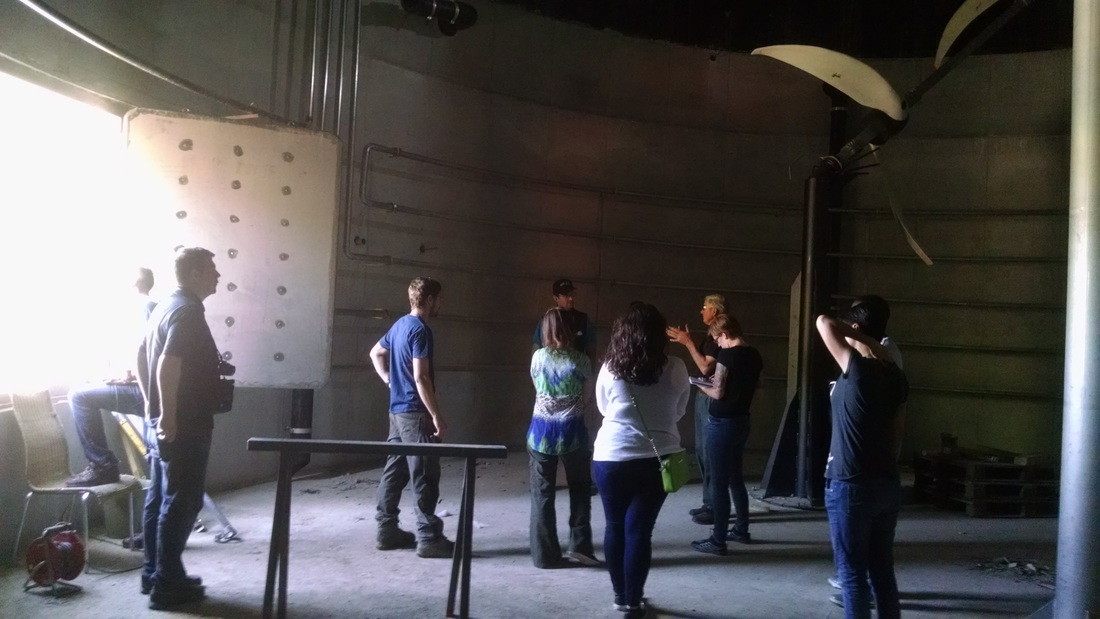
It just so happened that at the time of our visit (I brought students there for a study abroad experience), his previous digester had burnt down due to a generator fire. The upshot of this is that we were able to see inside the digester he was building, which you will see below.
Summary and Final Tasks
Summary
By now you should be able to:
- identify different types of solar technologies;
- explain the basic process by which solar panels generate electricity;
- explain the difference between irradiance and irradiation;
- calculate energy use/generation given power and time;
- evaluate the impact of tilt and orientation on solar PV output;
- calculate the output of a solar array;
- explain how anaerobic digestion converts organic material to biogas; and
- identify some of the benefits of anaerobic digestion.
Reminder - Complete all of the Lesson 6 tasks!
You have reached the end of Lesson 6! Double-check the to-do list on the Lesson 6 Overview page [17] to make sure you have completed all of the activities listed there before you begin Lesson 7.