Lesson 7: Wind and Microhydro
Overview
In this lesson, we'll go over some of the basics of wind and microhydroelectric energy, including how to do some basic output calculations.
Learning Outcomes
By the end of this lesson, you should be able to:
- analyze wind energy maps;
- identify components of wind turbines;
- describe how solar energy is converted to wind and hydropower;
- calculate the output of a wind turbine;
- identify components of microhydro systems; and
- calculate the output of a microhydro system.
Lesson Roadmap
| To Read | Lesson 7 Online Content | You're here! |
|---|---|---|
| To Do |
|
|
Questions?
If you have any general course questions, please post them to our HAVE A QUESTION discussion forum located under the Discussions tab in Canvas. I will check that discussion forum regularly to respond as appropriate. While you are there, feel free to post your own responses and comments if you are able to help out a classmate. If you have a question but would like to remain anonymous to the other students, email me through Canvas.
If you have something related to the material that you'd like to share, feel free to post to the Coffee Shop forum, also under the Discussions tab in Canvas.
Wind Energy
As you may recall, the wind is caused by differential solar heating across the surface of the earth (as well as the shape of the earth), which causes large- and small-scale high and low-pressure systems to form. Air moves from areas of higher pressure to areas of lower pressure, which is what causes wind to occur. (If you are interested, this National Geographic site [1] explains some of the finer points of this process, including a lot of pictures.)
Wind, then, is just air that is moving. Simply put, this air has kinetic energy because wind has mass and is moving. (Anything in motion with mass has kinetic energy.) Because of the First Law of Thermodynamics, the energy in the wind must come from somewhere else. This "somewhere else," is solar energy. This energy (and power) can be quantified. See later in this lesson for an explanation of how to calculate this.
Wind Resources in the U.S.
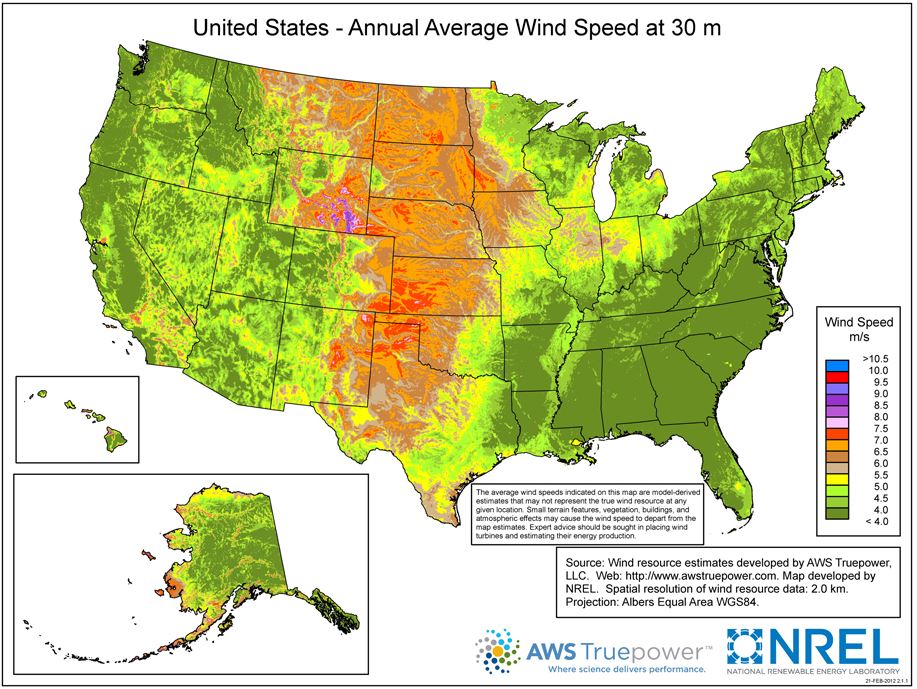
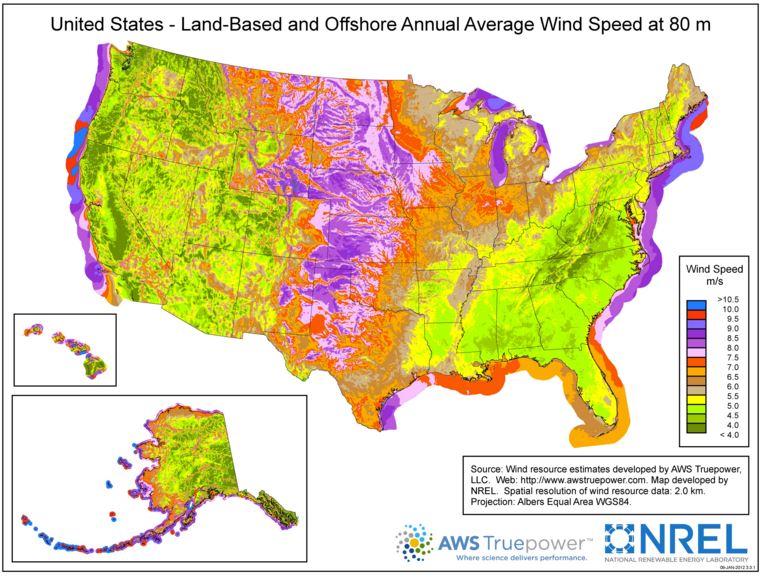
Average wind speeds vary widely by geographical location. Take a few minutes to inspect the wind speed charts from the National Renewable Energy Laboratory below. Note the location of the greatest and smallest wind speeds, and think about the physical characteristics of those areas (e.g., flat, mountainous, on-shore, off-shore, etc.). Click here for a larger version of the 30 m wind speed image [2] and click here for the 80 m image. [3] Note that the average wind speed is higher at 80 m at the same location. Wind speed generally increases with height due to the decreasing influence of friction from the earth's surface and things on it. Modern turbines are generally tall enough to take advantage of 80 m wind speeds.
In addition to variability being a barrier to wind deployment, the location of wind resources is as well. In general - and certainly, in the U.S. - the best onshore wind resources are not located near major population centers. Approximately 50% [4] of the U.S. population lives within 50 miles of the coast, but as you can see in the maps below, this is generally not where the greatest onshore wind is located. This is a problem because transporting electricity over power lines results in energy loss (as heat) due to electrical resistance in wires. The longer the electricity has to travel, the more energy is lost. To minimize this loss, large (and very expensive) power lines must be built. As you can imagine, this type of infrastructure is lacking in areas of the country that do not have large populations.
However, it is clear from the second map that significant offshore wind resources are available very near the coast. Unfortunately, offshore wind is still expensive (remember from a previous lesson [5] that the LCOE is the highest of those listed). That, combined with resistance from local inhabitants had kept the offshore wind at bay until 2016 when the first offshore wind farm (albeit a very small one) in the U.S. was opened in Rhode Island [6]. There are over two dozen in the planning stages [7] as we speak. This is likely an area of growth in the near future.
Wind Turbines
To Read and View Now
- Read through the "Types of Wind Turbines" section of How a Wind Turbine Works [9], and click through the animation from U.S. DOE.
Now for some terminology and other considerations:
- Wind turbines convert wind to electricity. This is different than a windmill, which converts wind energy into mechanical energy that is used for another purpose (e.g., pumping water or in the "old days," grinding grain).
- A wind farm is a number of turbines that are installed in the same area, usually by the same company.
- Like solar panels, turbines have a capacity, which refers to the maximum electrical output of the turbine. A 2 MW turbine will output 2 MW of power at its peak. The amount of power is dictated by the velocity of the wind.
- Remember that energy = power x time, so if a turbine is operating at 2 MW for 1 hr, it will output (2 MW x 1 hr = ) 2 MWh of electricity. 2 MW is now considered a moderately large utility-scale turbine.
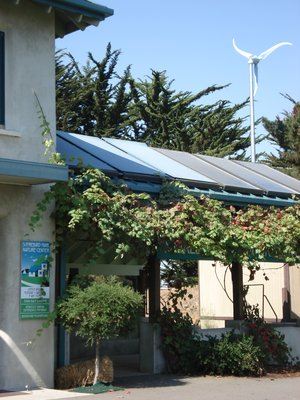
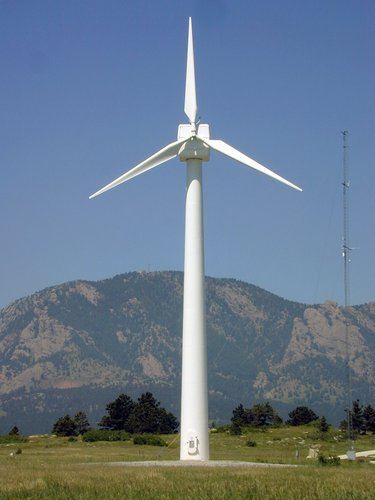
- A residential-scale turbine is much smaller, usually being a few hundred watts to a few kilowatts in size. For an example, see the image of the 2.4 kW residential turbine below. If this turbine is generating 2.4 kW for 10 hr, it would generate (2.4 kW x 10 hr = ) 24 kWh of electricity.
- Similar to solar, energy generation by a turbine is maximized by pointing the turbine so it is perpendicular to the wind. Large turbines have a mechanism that rotates the turbine so it faces the wind. This movement is called yaw.
See below for a diagram of key components of wind turbines:
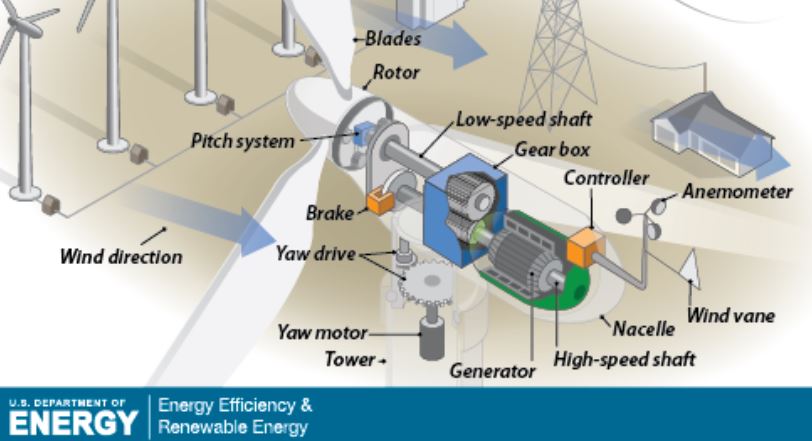
There is a lot to digest here. The components I'd like you to know are as follows. All quoted text is from the U.S. Department of Energy [10]:
- Blades: "Lifts and rotates when wind is blown over them, causing the rotor to spin." The blades convert wind energy into motion energy (the rotating rotor).
- The hub (which is not indicated in the image) is the "nub" in front of the blades. Turbine heights are usually expressed using "hub height," which indicates how far above the ground the center of the hub is.
- The "blades and hub together form the rotor."
- The rotor spins the low-speed shaft, which is then (usually) converted to a higher rotation speed through a gear box.
- The high-speed shaft is attached to the other side of the gear box, which spins the generator. The generator converts this motion energy into electrical energy. Unlike solar panels, wind turbines generate AC electricity.
- The nacelle "sits atop the tower and contains the gear box, low- and high-speed shafts, generator, controller, and brake. Some nacelles are large enough for a helicopter to land on."
- The tower "supports the structure of the turbine." Modern turbines use cylindrical towers made of steel.
- Not pictured, but some modern turbines skip the gear box and use direct drive technology, spinning the generator at the same rpm as the low-speed shaft.
The basic energy conversion process is as follows:
- Solar energy is converted to wind energy.
- Wind energy is converted to motion energy by the blades, which rotates the shaft.
- The rotational velocity of the shaft is increased through the gear box. This does not increase the energy, and in fact, loses some due to frictional heat loss in the gear box.
- The gear box spins another shaft, which spins the generator.
- The generator generates an electrical current.
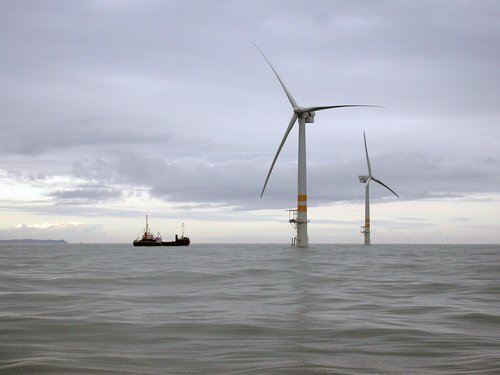
Turbines come in a very wide variety of sizes and capacities. The images below show some of this. (We will see the second turbine in Golden, CO!)
Wind Energy and Power Calculations
The power in the wind is given by the following equation:
Power (W) = 1/2 x ρ x A x v3
- Power = Watts
- ρ (rho, a Greek letter) = density of the air in kg/m3
- A = cross-sectional area of the wind in m2
- v = velocity of the wind in m/s
Thus, the power available to a wind turbine is based on the density of the air (usually about 1.2 kg/m3), the swept area of the turbine blades (picture a big circle being made by the spinning blades), and the velocity of the wind. Of these, clearly, the most variable input is wind speed. However, wind speed is also the most impactful variable because it is cubed, whereas the other inputs are not.
The following are calculations for power available in the wind at three different velocities for the Northwind 100C turbine. This is the newer version of the Northwind 100A on the previous page. The calculations will show what happens when you double, then triple the velocity. Take a moment to think about how much available power will increase if you double and triple the velocity:
- The standard [17] density of air is 1.225 kg/m3
- The turbine has a 24 m diameter, which means the radius is 12 m. Thus, the swept area of the turbine is: (pi)r2 = 3.14159(122) = 452.4 m2
- We'll start with a 6 m/s wind.
- The power in the wind at 6 m/s is: 1/2 x ρ x A x v3 = 0.5 x 1.225 kg/m3 x 452.4 m2 x (6 m/s)3 = 59,851 W = 59.85 kW
- At 12 m/s: 1/2 x ρ x A x v3 = 0.5 x 1.225 kg/m3 x 452.4 m2 x (12 m/s)3 = 478,808 W = 478.8 kW (8 times as large)
- At 18 m/s: 1/2 x ρ x A x v3 = 0.5 x 1.225 kg/m3 x 452.4 m2 x (18 m/s)3 = 1,615,979 W = 1,616 kW = 1.616 MW (27 times as large)
As you can see, when the velocity doubles, the power increased by a factor of 8 and when the velocity triples, it increases by a factor of 27. This is because the velocity is cubed: 23 = 8 and 33 = 27.
Calculating Wind Turbine Output
The output of a wind turbine is dependent upon the velocity of the wind that is hitting it. But as you will see, the power is not proportional to the wind velocity. Every turbine is different. In order to determine the output of a specific turbine at a given wind velocity, you need its power curve. The power curve and corresponding data for the Northwind 100C can be seen below:
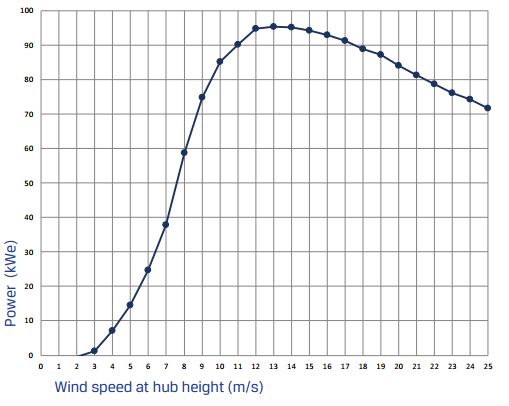
| wind speed (m/s) | 1 | 2 | 3 | 4 | 5 | 6 | 7 | 8 | 9 | 10 | 11 | 12 |
|---|---|---|---|---|---|---|---|---|---|---|---|---|
| power output (kW) | -0.5 | -0.5 | 1.2 | 7.2 | 14.5 | 24.7 | 37.9 | 58.7 | 74.8 | 85.1 | 90.2 | 94.7 |
| wind speed (m/s) | 13 | 14 | 15 | 16 | 17 | 18 | 19 | 20 | 21 | 22 | 23 | 24 | 25 |
|---|---|---|---|---|---|---|---|---|---|---|---|---|---|
| power output (kW) | 95.3 | 95.1 | 94.2 | 92.9 | 91.2 | 88.9 | 87.1 | 84.1 | 81.3 | 78.6 | 75.1 | 74.3 | 71.7 |
As you can see, even though this is a 95 kW turbine, it only provides (approximately) that much power at a very limited number of wind speeds - about 12 m/s through about 15 m/s. Counterintuitively, the power output decreases if the wind speeds up past that point. For safety reasons, the turbine will stop spinning if the wind speed is higher than 25 m/s.
Assuming the turbine is operating properly, the output calculation is pretty straightforward. You just multiply the output at a given velocity by the number of hours the wind is blowing at that velocity. For example, let's assume that the wind hitting a Northwind 100C in a given day has the following velocities. (Note that in reality, the wind would likely change much more frequently than this. I just wanted to make the math relatively easy.):
| velocity (m/s) | number of hours at that velocity |
|---|---|
| 6 | 4 |
| 8 | 8 |
| 12 | 5 |
| 15 | 4 |
| 16 | 3 |
| 16 | 3 |
The total output at 6 m/s would be: 24.7 kW (the output at 6 m/s from the power curve table) x 4 hrs = 98.8 kWh.
Based on the power curve table above, the total output for this day would be:
| velocity (m/s) | number of hours at that velocity | total output (kWh) |
|---|---|---|
| 6 | 4 | 98.8 |
| 8 | 8 | 469.6 |
| 12 | 5 | 473.5 |
| 15 | 4 | 376.8 |
| 16 | 3 | 278.7 |
| 16 | 3 | 278.7 |
| Total | 24 | 1,697.4 |
Capacity Factor
One last consideration to make for wind turbines (or any energy source) is something called capacity factor. Capacity factor indicates how much energy is generated by a source relative to the maximum amount of energy it could provide. This is expressed as a percentage, and is usually determined over the course of a single year. This provides insight into how well-sited the turbine is, but in general indicates how available an energy source is throughout the year. The closer to 100%, the more the energy source is available throughout the year.
The formula is capacity factor = actual output/maximum possible output.
For a wind turbine, the maximum possible output would be the capacity x 8760 hr (there are 8760 hrs in a year). So for the Northwind 100C, the maximum output is: 95 kW x 8760 hr/yr = 832,200 kWh/yr (or 832.2 MWh). If the actual output over the course of a year was 250,000 kWh, the capacity factor would be:
- capacity factor = actual/maximum output = 250,000 kWh/832,200 kWh = 30%
The average capacity factor of the U.S. wind fleet hovers around 32% - 34% [19], but new turbine designs have been tested in the 60%+ range, like this forthcoming 12 MW behemoth [20] by GE. It's not unusual to see 40% and up capacity factors for well-sited wind farms.
Microhydro
Hydropower
Like moving air, moving water has kinetic energy (it has mass and it is moving). But water is much denser than air - this is obvious to anyone who has waded across a deep stream or played in ocean waves. If you recall, air has an average density of 1.225 kg/m3. One cubic meter of water, on the other hand, has a mass of 1,000 kg, or one metric ton (aka one tonne). It may be hard to believe, but a cube of water that is about 3.3 feet on each side weighs over 2,000 pounds!
Where does this kinetic energy come from? Take a second to think about it...Water only flows downhill, so if you see moving water it came from a higher elevation. This kinetic energy is thus converted from gravitational potential energy. How did it get this gravitational potential energy? Well, something had to take the water up to the higher elevation. The only natural way this happens is through evaporation, which is almost always caused by the sun, in a number of different ways: Water that is heated by the sun may evaporate. Wind also evaporates water, but remember that wind gets its energy from the sun. Plants evapotranspirate water, but again, they get their energy from the sun. Even the minor amount exhaled by humans is solar energy since all of our energy comes from the sun. The only major exception is that some evaporative heat is provided by geothermal energy from the earth, e.g., in volcanoes. At any rate, almost all hydropower/energy comes from the sun
How a Hydropower Plant Works
Humans have been using hydropower for thousands of years [21]. According to the U.S. Department of Energy, the Greeks used water to spin wheels to grind grain over 2,000 years ago. Modern humans figured out how to convert hydropower to electricity by using a turbine and generator (see below), which is called hydroelectricity, for obvious reasons. The first known use of hydroelectricity [22] was in 1878 to power a single lamp in Northumberland, England. Larger plants were installed in 1881 in the U.S., and the first commercial-scale plant was built in the U.S. in 1893 in Redlands, California.
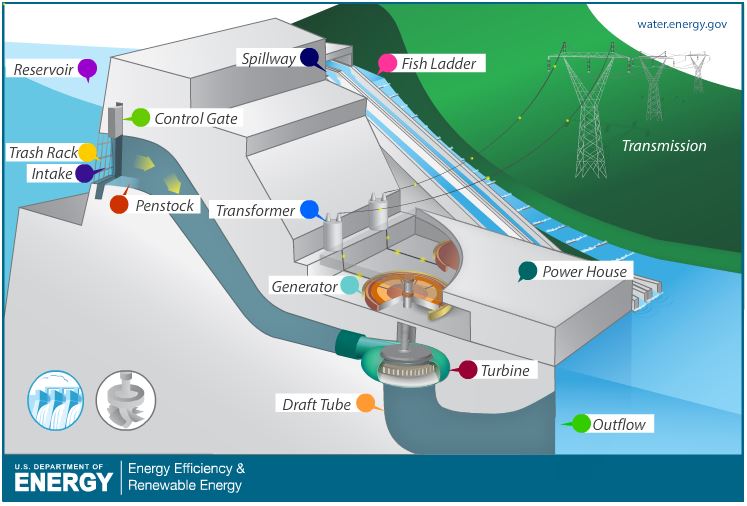
All hydroelectric power plants operate on the same principle. Moving water spins a turbine, which spins an electric generator. See below for an illustration of an impoundment facility, which uses a dam to create a reservoir of water.
 [23]
[23]
Explaining all components in this image goes beyond the scope of this lesson, but feel free to click on the image above or here for a clickable image [24] to learn more about each. The important terms for this lesson are:
- The penstock is a conduit through which the water flows from a higher to a lower elevation.
- The turbine spins due to the force of the water flowing out of the penstock.
- The turbine spins the generator, which generates electricity.
This basic process - flowing water spins a turbine, which spins a generator - is common to all types of hydroelectricity installations. There can be any number of other components, and the size/scale may be different, but this core process is the same.
Microhydroelectricity
Like all other electricity sources, hydroelectric power plants have a rated capacity. Large impoundment facilities can have capacities on the order of GWs (billions of watts). The largest facility in the world - the Three Gorges Dam in China - has a capacity of 18 GW. According to the U.S. Department of Energy, a microhydro system has a capacity of up to 100 kW [25]. Most systems are much smaller. A residential-scale microhydro system is more likely to be a few kWs in size.
 [23]
[23]
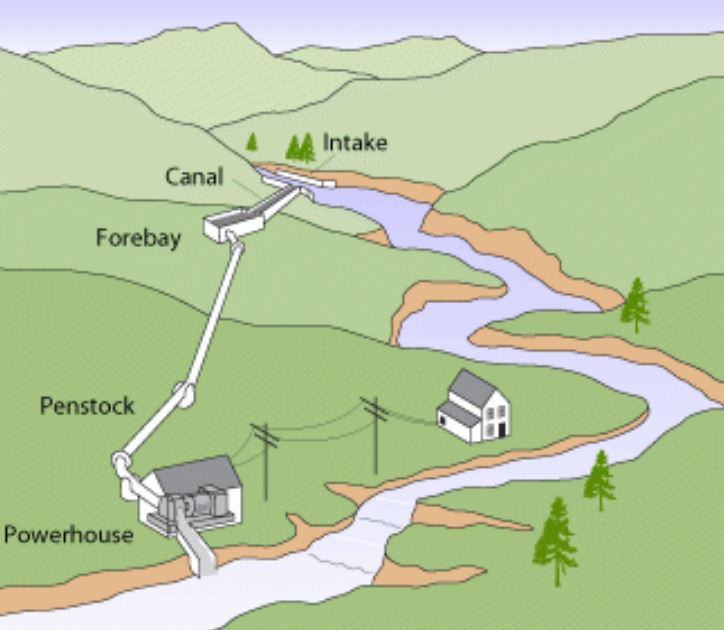
A typical microhydro system is illustrated in the image above. Systems can vary significantly in style and size, but according to the U.S. DOE, the following components are commonly seen in most systems [27]:
- The water is often diverted from a stream. If so, it is usually transported to a forebay, which is akin to a small impoundment facility that creates a small reservoir.
- There is some kind of conveyance that provides the water to the turbine. In the illustration above, this is done by a penstock, which is often made of PVC pipe. This could also be done by a channel.
- The water spins a turbine, which spins a generator, which provides electricity. This is all contained in the powerhouse in the image above. There are a number of different types of turbines, most of which require a jet of water that is sprayed through a nozzle at the end of the penstock. If you are interested, see details in this reading from the U.S. DOE [27].
Energy and Power in Water
As described above, the kinetic energy in flowing water starts out as gravitational potential energy. The gravitational potential energy of a given amount of water at any elevation can be calculated using the following equation:
- Pe = m x g x h
- Pe = potential energy in Joules
- m = the mass of the water in kg
- g = the acceleration due to gravity (m/s2)
- h = the height of the water in m (usually called the "head")
The force of gravity is essentially a constant (it gets a little bit smaller with height). Thus, all else being equal, as height and mass increase, the potential energy increases. Keep in mind that this equation only illustrates the maximum kinetic energy available to a hydropower system. In reality, there are always losses by the time the kinetic energy is converted to electricity.
The power available in water at height is given by a similar equation:
- P = Q x g x h
- P = power in watts
- Q = discharge of water in kg/s (this is also mass per unit time)
- g = acceleration due to gravity (m/s2)
- h = head (m)
Again, this is only the hypothetical maximum - it is impossible to capture all of this power in a turbine. This equation is almost the same as the potential energy equation - you just substitute discharge for mass. Since the discharge is kg/s, or mass divided by time, if you compare the two equations, the power equation is the energy equation divided by seconds. This makes sense if you think about it: the potential energy is given in Joules, and the power equation is given in watts. Recall that 1 J/s = 1 W. Makes sense, right?
Calculating Microhydro Output
It turns out that calculating the approximate power output of a microhydro system is not terribly difficult. According to the U.S. DOE, a typical system has an efficiency of about 53%. This includes losses from the nozzle, the wiring, the generator, and a few other things. The power of a microhydro system with this efficiency is approximately:
- power = net head x flow /10
- power = electric power in W
- net head = the gross head in ft including the head loss in the penstock
- flow = flow of water in gal/min
- 10 = conversion factor (this can range from 8 - 12, with 10 being about average)
To determine the gross head, you measure how many feet above the generator the penstock starts. Note that this is not the same as the length of the penstock. The penstock is sloped, and thus will be longer than the head. The head loss is based on a few factors, including the diameter of the penstock, the pressure inside the penstock, and the number of turns and fittings there are in the penstock. According to Homepower Magazine, 30% is a typical amount of head loss, which means you would calculate the gross head time 0.7 to determine the net head. The flow of a stream through a penstock can vary wildly, from a few gallons per minute to a few hundred (or more). To provide some context a garden hose usually has a flow of about 20 gallons per minute, though this can also vary significantly depending on a number of factors.
Let's say I have a property in which I can create a diversion channel and forebay 100 ft above a power house, and I measure my flow at 50 gpm. Assuming a good system design which includes a head loss of 30%, my output would be:
- power = net head x flow / 10
- power = 100 ft x 0.7 x 50 / 10 = 350 W
- If I could get this to operate all day, I would get (350 W x 24 h/day = ) 8400 Wh or 8.4 kWh/day
Further Reading/Viewing
This lesson only scratches the surface of microhydro systems. There are many designs and factors to consider. Each site is different. For a more detailed explanation, see this website from the U.S. DOE [28], and for a good case study, see this example from Homepower Magazine ( [29]starting on p. 32). There are dozens of videos on YouTube that detail specific systems, many of which are worth checking out if you are interested.
If you are interested in learning more about the power and energy available in water for hydroelectric, see this video presentation I put together [30]for another course.
Site Visits
Starting this week and moving forward — each week, I will provide links to some of the locations/organizations we will visit. This is not required reading. I suggest browsing through them if/when you have time. This may help inspire your final project proposals!
- Solar Energy International [31] (SEI), Paonia
- GRID Alternatives [32], Denver
- Rocky Mountain Institute [33], Boulder
- Blue Terra Waste Solutions [34], Denver and Longmont
Summary and Final Tasks
Summary
By now, you should be able to do the following:
- analyze wind energy maps;
- identify components of wind turbines;
- describe how solar energy is converted to wind and hydropower;
- calculate the output of a wind turbine;
- identify components of microhydro systems; and
- calculate the output of a microhydro system
Reminder - Complete all of the Lesson 7 tasks!
You have reached the end of Lesson 7! Double-check the to-do list on the Lesson 7 Overview page [35] to make sure you have completed all of the activities listed there before you begin Lesson 8.