Solar PV
We will experience some solar PV installations and technology while traveling, so I provide some more details about it below.
- In order to maximize panel output, the panel should be as close to perpendicular to the sun's rays as possible, which allows it to capture the most solar energy possible at a given time. (Here is a really good interactive animation [1] of why a perpendicular panel captures the most sunlight.) Most solar panels are fixed, i.e., they don't move. This means that you need to choose your location carefully. For fixed panels, there are two factors to consider in this regard:
- Azimuth/orientation is the compass direction that the panel faces. Typically, 0º is due north, 90º is east, 180º is south, and 270º is west.
- Tilt is the angle above the horizon to which the panel is tilted.
- Shading is a very important consideration as well. All else being equal, more shading means less output.
- In the Northern Hemisphere, the rule of thumb to maximize the output of a fixed panel is that the panel should be faced due south (180º orientation) and at "latitude tilt." You may recall from a Geography class that latitude is how far north or south a location is from the equator. The equator is 0º, the tropics are at 23.5º, and the North and South Poles are at 90º north and south, respectively.
- For example, State College, PA is at just over 40º north, so the ideal array tilt is about 40º, and the ideal azimuth is 180º (south).
- Anchorage, Alaska is at about 61º north, so the ideal tilt and azimuth are about 61º and 180º (south), respectively.
A few more terms that are important to know:
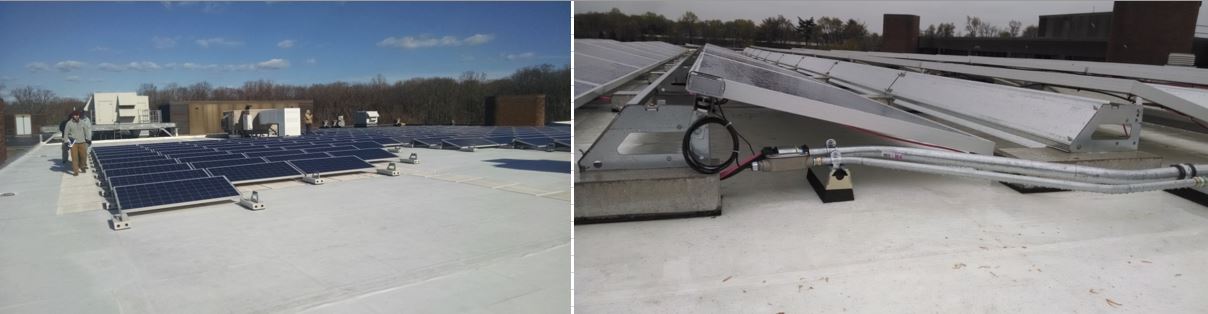
- A solar cell is the smallest current-generating part of an array. They can be any size but are normally around 6 inches by 6 inches. It's difficult to see, but in the image above there are 72 cells in each panel (12 rows, each with 6 cells).
- A solar panel (aka module) is a number of cells wired together in a single panel. They can be any size but are usually about 5 feet by 3.25 feet [2].
- A solar array is a number of panels wired together. The image above shows part of a solar array, which as I noted has 270 total panels.
- Capacity refers to the rated maximum output of a panel or array. Under optimal conditions, a 250 W panel will output about 250 W of electricity. Note that this is only the immediate output. By the time the electricity goes to the building or the grid, some of it is lost due to a variety of factors (usually 10% - 15%).
- The array above has 270 panels, and each panel has a capacity of 305 W. Thus, the capacity of the array is (305 W x 270 = ) 82,350 W, which is 82.35 kW.
- A solar panel outputs DC (direct current) electricity. DC means that the electricity flows in one direction. Household outlets (and the electric grid) use AC (alternating current) electricity, which rapidly alternates direction of flow (60 times per second in the U.S., in case you are interested), so electricity from an array must be converted to AC if it is to be used in a building or distributed to the grid. An inverter is a piece of equipment that converts DC to AC and is a standard part of most solar arrays.
- A grid-tied array is one that is connected to the grid. A standalone or off-grid system is not tied to the grid.
The Impact of Tilt and Orientation
Recall that the rule of thumb is that the optimal tilt is "latitude tilt," and the ideal orientation in the Northern Hemisphere is due south (180º). This begs the question: what happens if the tilt and orientation are not optimal? The answer, as you might guess, is "it depends." This impact can be quantified by something that is called tilt and orientation factor (TOF). The tilt and orientation factor is a decimal that indicates what percent of the maximum solar output you would receive throughout the year at said tilt and orientation. So if you install an array and it has a TOF of 0.85, that means that it will only be able to output about 85% of the energy it would output if it were at the ideal tilt and orientation.
Wilmington, Delaware is at about 40º north. As it turns out, the ideal tilt is closer to 35º (rules of thumb are only rules of thumb, after all!). The tables below show the TOF at different tilts and azimuths. The first table illustrates the TOFs of different tilts, all with an orientation of 180º. The second table shows the TOFs at different azimuths, all at a tilt of 35º (the ideal tilt). (You can investigate the TOF for locations throughout the U.S. by going to the Solmetric website [3].)
| Tilt (º) | Azimuth (º) | TOF |
|---|---|---|
| 0 | 180 | 0.87 |
| 5 | 180 | 0.905 |
| 10 | 180 | 0.935 |
| 15 | 180 | 0.959 |
| 20 | 180 | 0.978 |
| 25 | 180 | 0.991 |
| 30 | 180 | 0.999 |
| 35 | 180 | 1.0 |
| 40 | 180 | 0.996 |
| 45 | 180 | 0.985 |
| 50 | 180 | 0.969 |
| 55 | 180 | 0.947 |
| 60 | 180 | 0.92 |
| 65 | 180 | 0.888 |
| 70 | 180 | 0.851 |
| 75 | 180 | 0.81 |
| 80 | 180 | 0.764 |
| 85 | 180 | 0.715 |
| 90 | 180 | 0.662 |
| Tilt (º) | Azimuth (º) | TOF |
|---|---|---|
| 35 | 90 | 0.797 |
| 35 | 100 | 0.833 |
| 35 | 110 | 0.897 |
| 35 | 120 | 0.898 |
| 35 | 130 | 0.926 |
| 35 | 140 | 0.951 |
| 35 | 150 | 0.972 |
| 35 | 160 | 0.986 |
| 35 | 170 | 0.996 |
| 35 | 180 | 1.0 |
| 35 | 190 | 0.997 |
| 35 | 200 | 0.989 |
| 35 | 210 | 0.976 |
| 35 | 220 | 0.956 |
| 35 | 230 | 0.932 |
| 35 | 240 | 0.905 |
| 35 | 250 | 0.874 |
| 35 | 260 | 0.839 |
| 35 | 270 | 0.803 |
Calculating Solar Output
Okay, now we're ready to calculate the solar output. There are a number of software programs and a formula or two that can do this, but the National Renewable Energy Laboratory (NREL) provides a free one that is well-regarded in the energy industry called PVWatts [4]. In the video below, I demonstrate how to calculate the annual output of the array in the images above, which has the following specs:
- address: 400 Stanton Christiana Rd, Newark, DE
- 82.35 kW capacity
- 13º tilt
- 222º azimuth
Alright so, I'm going to demonstrate how to use the PVWatts Software from NREL. So, here is the home page. You can Google PVWatts and this will come up. And so, first thing you do is you type in the address. So this is based on the array that's detailed on the course website. So my address here is 400 Stanton Christiana Road in Newark. Ok, so you just click enter. And click go. And so, it used to be that it would come up with a map here, but they changed some things about this. So what it does, it just tells you the latitude and longitude of where you are. And so, I just happen to know that this is the right latitude and longitude, so I'm going to click to go to system info here. Ok, and here is where I can enter the specifics of the system. So, you can see the first window here is the DC system size, so this is the capacity. So mine is a 82.35 kW, you notice this is in kW, so be very careful about that. The module type, you have a couple different kinds. This is standard module. The fixed open rack is fixed meaning it's not, it doesn't move so there's no tracking. I mean you could do one to two-axis tracking here. The system losses, this shows you the overall losses from the rated capacity. So, I'm going to click on this loss calculator just to show you some of the variables here.
So this comes up, you can see that here. So right now the estimated system losses are 14%. And you can see that these are the actual, the individual factors in those losses. So soiling meaning you know, dust and stuff that gets on the panel. Shading, so it's assuming there's some shading part of the time. In this case, 3% of the time. You know, is there snow? Is there panel mismatches? Panels have small imperfections so they might have slightly different voltages. So there's wiring losses anytime you run electricity through a wire. There's heat losses. Connections to this is just sort the you know, the connections between the modules and other components. There's some degradation that occurs through panels getting warm, and it's also they just degrade a little bit over time. This name-plate rating there's slight imperfections, you know, the panels are usually guaranteed to be, have this capacity within a certain percentage. And then if they're older, you would actually, panels degrade over time. And the availability just means sometimes the system goes down for repairs or whatever, ok? And so you can actually change this. So like if I said this is in a perfect location without any shading at all I could put zero in here and you notice this drops to 11%. So we'll just go with our standard 14% and then you can click save. Ok? So that's where all the system losses come from. Now you can enter in your total. In this case, I have 13 degrees. Your azimuth, remember, is your also the same as your orientation. This one happens to be 222 degrees.
Ok, so now, you can also add some cost considerations. There's some other parameters you can feel free to mess around with those. In this case, this is actually commercial and I'm just going to, I happen to know our utility rate at our school. It's about 8 cents a kilowatt hour. Ok. Good, good, good.
Now you could also draw the system. Actually, you can't anymore. You used to be able to draw your system on a rooftop using Google Maps, but you can't do that.
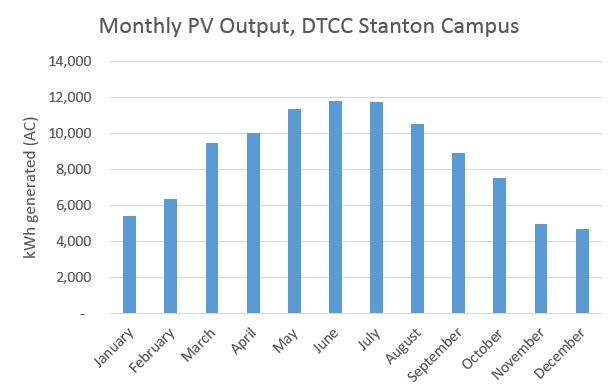
Ok, so now we click to go to the results. And, here you go. So based on the system specs that I put in there, I'm going to generate about 106,000 kWh per year. Keep in mind that, you know, it says 106,365. This, you know, you should take this as a round number. You could have a really good solar year. There's a bunch of extra, you know, energy generated. You could have a bad year the system could go down a lot. There's I don't know a bunch of extra moisture and dust in the air, whatever. So this is just a really good estimate. Ok. Yeah, see it even gives you the range here. Based on this location, 101 to 110 kWh per year. So this actually gives you the month to month break down. Ok. So here's your actual output in AC. Remember panels produce DC, so this is AC output. And this is based on the cost information that I put into the specs on the previous sheet. So it's saying that, you know, I would earn about, or save about 8500 dollars a year with this system. Now what's really cool about this, is you can actually download these results. So, you can download this exact information but in spreadsheet form. And you can even download the hourly results which is really cool. I mean you get this Excel spreadsheet with 8,760 rows in it. It tells you the estimated output under normal typical meteorological conditions throughout an average year. So that's pretty cool. And then you can use, you know, make charts and so forth in Excel. Ok, so that's a basic tutorial on how to use PVWatts.
A Few More Notes
Hopefully, by now you have a relatively good grasp on some of the considerations that go into designing and calculating the output of solar PV. Solar PV really took off in the early- to mid-2000s, led by residential array installations, which generally had capacities of a few kW. The solar industry in the U.S. is not dominated by utility-scale solar, which is much cheaper per W to construct because of economies of scale. Utility-scale arrays can be thousands of watts (multiple MWs) in capacity!
Finally, there are a few ways that people can use and pay for solar PV:
- Systems can be purchased and owned by individuals. This can be done out-of-pocket or using loans. Out-of-pocket purchases usually generate the highest return.
- Power purchase agreements allow people or businesses to pay a third party to build an installation on their own roof. The individual or business then pays the third party for the electricity generated at a contractually agreed-upon rate. This is the model that SolarCity (now Tesla Energy) used to rise to prominence. This is a popular model because it requires no up-front cost (among other reasons).
- Community-owned solar or just community solar is used increasingly in the U.S. and elsewhere. Community solar allows individuals to "buy into" a solar array that is installed somewhere else, or perhaps on a shared roof or field space. This provides access to individuals and businesses that would not otherwise be able to use solar due to factors such as not having a suitable site (e.g., a heavily shaded roof) or living in rented space. (The SEIA provides a good overview of community solar here [5], and NREL provides a more robust explanation here [6].)
- Most utility-scale installations effectively act as power plants, and the electricity is sold to the grid.