Lesson 10: Geography, Water, and Energy in Colorado
Overview
In the final full lesson of this course, you will learn some basics of Colorado geography (and geology), energy, energy policy, water, and water policy.
Learning Outcomes
By the end of this lesson, you should be able to:
- identify and describe major geographic regions and features of Colorado;
- analyze population and precipitation patterns in Colorado;
- describe the basic geology of the Rocky Mountains and the Front Range;
- explain the concept of "first in time, first in right" in terms of Colorado water policy;
- define RPS, REC, SREC, ITC, and PTC as they relate to energy policy;
- explain how renewable portfolio standards incentivize renewable energy.
Lesson Roadmap
| To Read | Lesson 10 Online Content | You're here! |
|---|---|---|
| To Do |
|
|
Questions?
If you have any general course questions, please post them to our HAVE A QUESTION discussion forum located under the Discussions tab in Canvas. I will check that discussion forum regularly to respond as appropriate. While you are there, feel free to post your own responses and comments if you are able to help out a classmate. If you have a question but would like to remain anonymous to the other students, email me through Canvas.
If you have something related to the material that you'd like to share, feel free to post to the Coffee Shop forum, also under the Discussions tab in Canvas.
Colorado Geography
Welcome to Colorado!
Colorado is known as the "Centennial State" and is the 8th largest state [2] in the U.S. by area, at a little over 104,000 square miles. As a point of reference, it is over twice the size of Pennsylvania. However, it has only the 21st highest population [3], at just over 5.6 million people as of 2018. (Pennsylvania is 5th at around 12.8 million people.) The capital is Denver, which is known as the "Mile High City" because most of the city is at or above 1 mile above sea level. While known for its mountains, a significant portion of Colorado is part of the Great Plains and is nearly flat. Even the plains are at a high elevation, and in fact, Colorado has the highest average elevation of any state in the U.S. Colorado has more peaks higher than 14,000 feet (58 of them!) [4] than any state in the country. If you travel to Colorado for any amount of time, you will no doubt overhear discussions about these "fourteeners." It is nearly a universal pastime to climb fourteeners.
As you will read below, Colorado has a very diverse landscape and culture. It is known for the availability of outdoor activities (hiking, skiing, camping, white water rafting, biking, etc.), but also has an interesting mixture of modern and historic culture and practices. Farming and ranching are important to its economy and culture, but so are tourism, higher education, and high tech industries, among many other things. It is a wonderful state to explore!
As you probably recall, we will spend most of our time in Denver and Boulder, but will also drive through the mountains to the Western Slope town of Paonia. We will thus experience a variety of Colorado culture and scenery, from the Eastern Plains to the Front Range, as well as the Western Slope. More details on these regions below.
 [6]
[6]
Regions and Geography
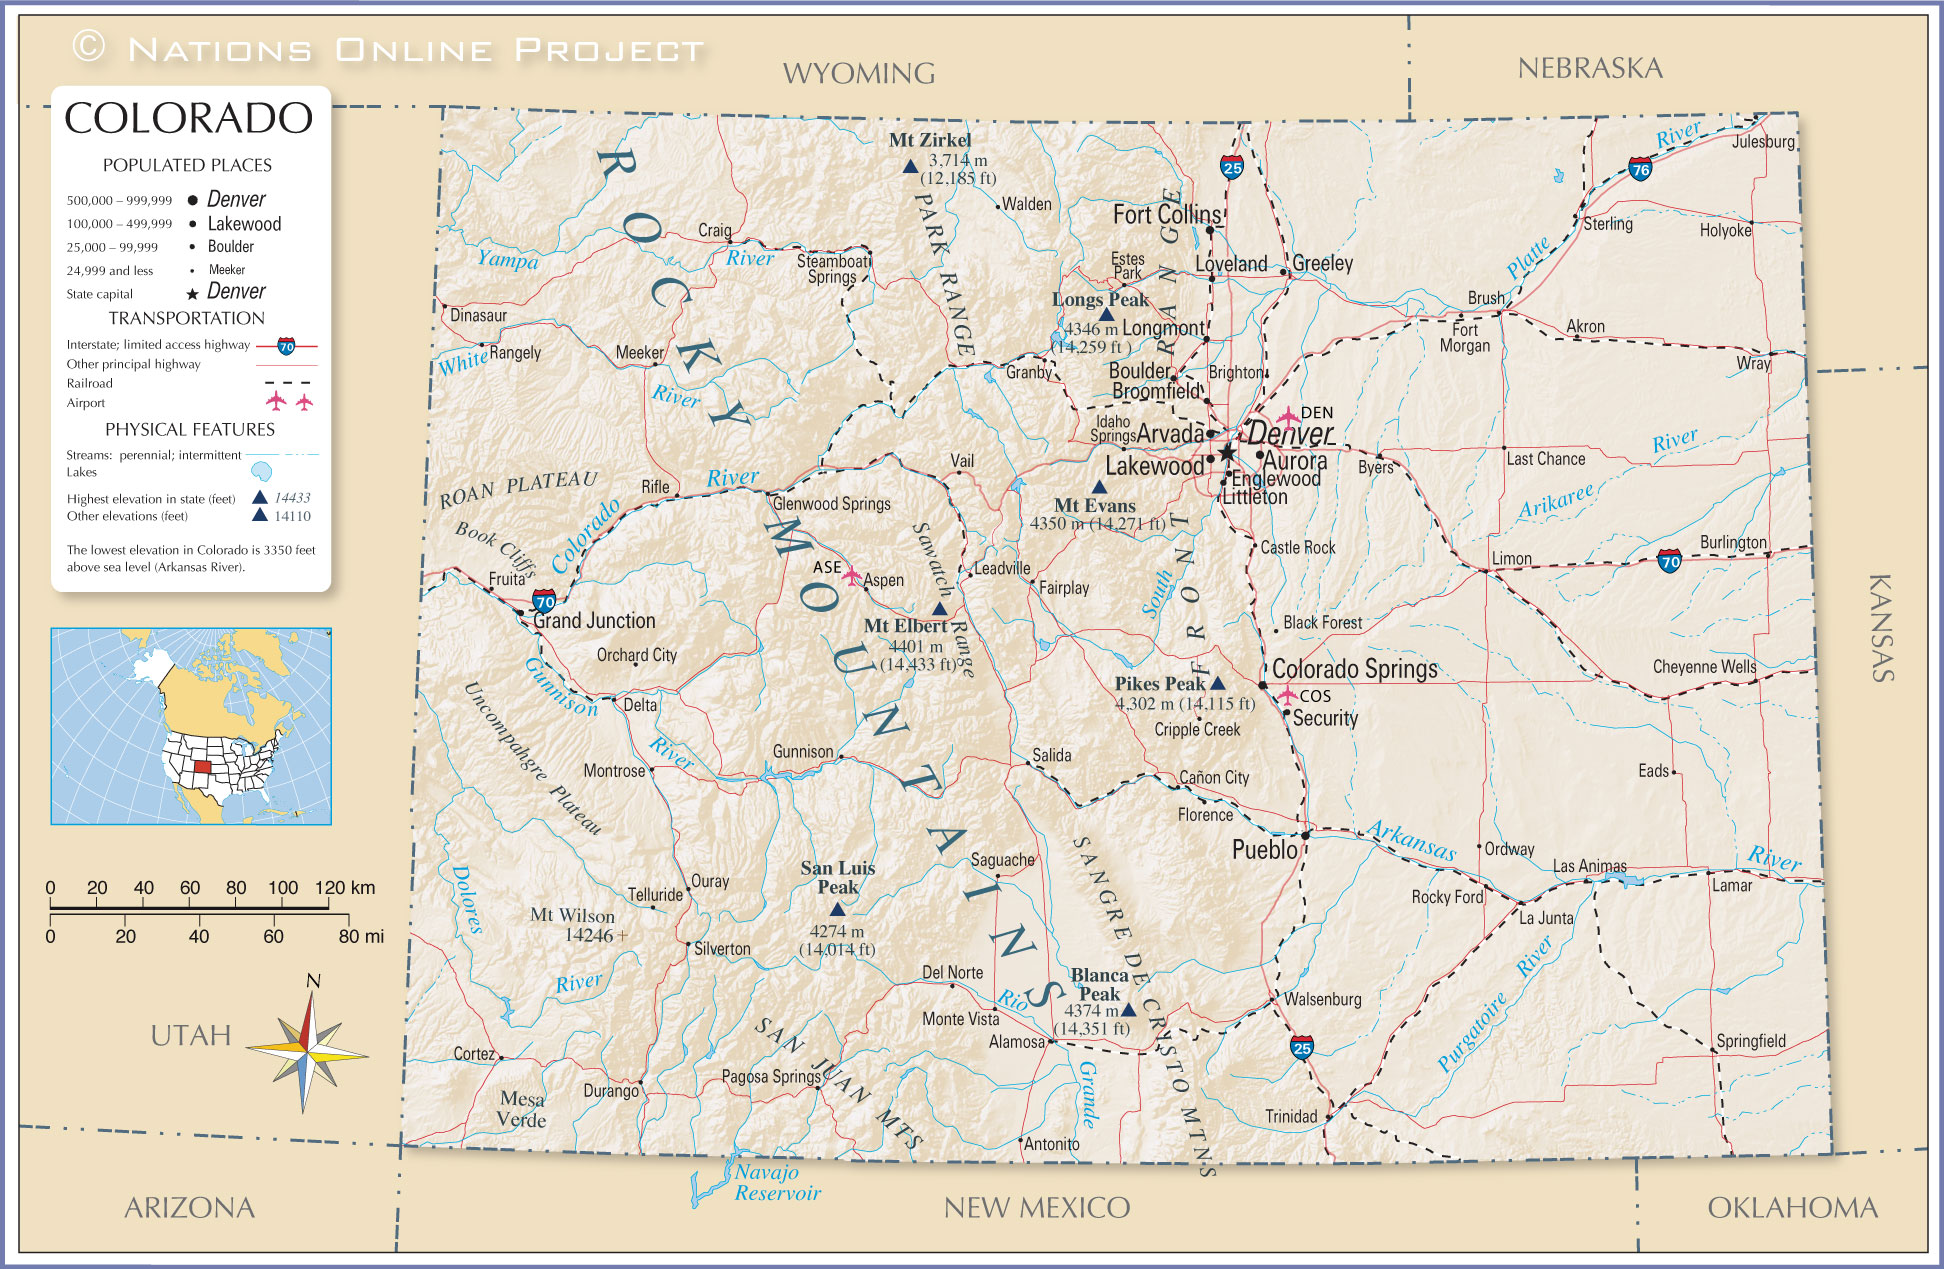
Colorado has many local regions and other geographic features [7], but the major ones that we will experience are as follows:
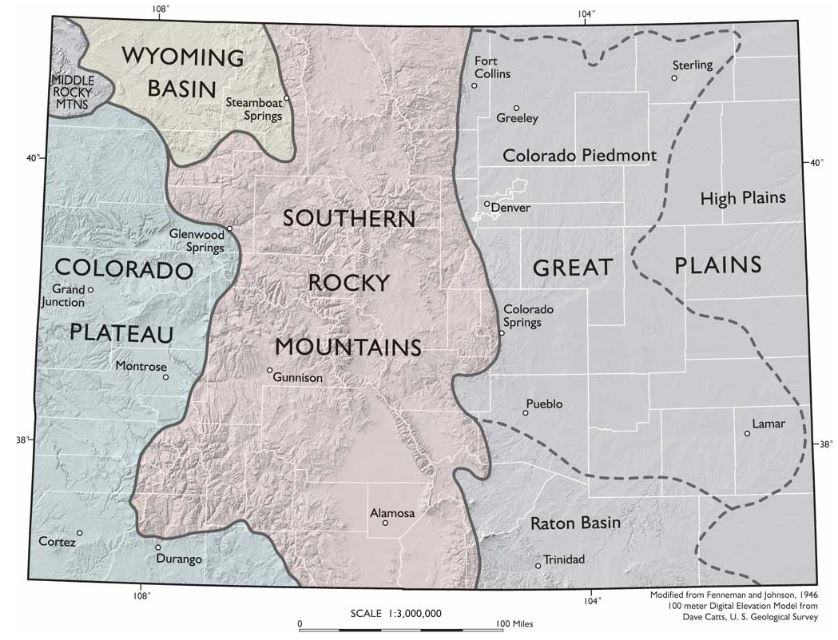
- The Front Range [8], which is where most of the population of the state resides. In figure 10.4 below, the front range is roughly the easternmost portion of the Southern Rocky Mountains but also is generally understood to encompass the westernmost portion of the Great Plains, including parts of the Colorado Piedmont. (The boundaries of the Front Range are not distinct). The Front Range is often thought of as the foothills of the Rockies, and you will see why that is when we travel there. All of the major population centers of Colorado, including Denver, Fort Collins, Boulder, and Colorado Springs are considered part of the Front Range. According to the Colorado Encyclopedia, about 4.5 million of the state's 5.6 million people live in the Front Range. Red Rocks Amphitheater [9], the famous outdoor concert venue and geologic feature lies in the Front Range just outside of Denver. (We'll visit this, too!)
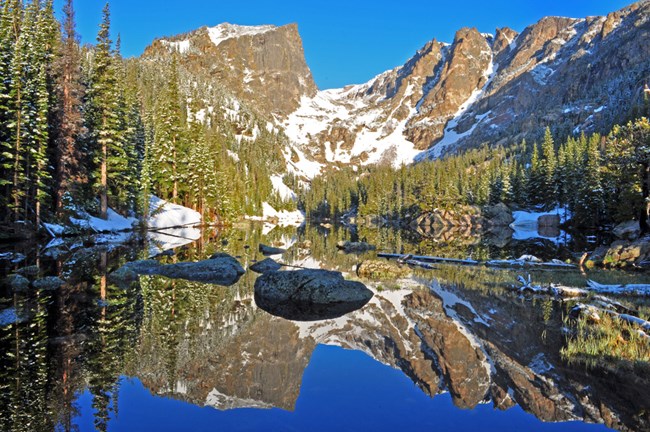
- The Western Slope [10], which is generally understood as the area of the state that is on the other side of the Continental Divide (see below). In Figure 10.4 below, you can visualize the Western Slope if you mentally draw a north-south line through the middle of the Southern Rocky Mountains province - the Western Slope is everything to the west of that line. (Sorry, I could not find an image of this exact province.) The Western slope covers the eastern third of the state, but only has about 10 percent of the residents. Perhaps most importantly, it has about 70 percent of the state's water. The Western Slope is mostly mountainous and contains most of the "classic" Rocky Mountain geography (e.g. the image of Rocky Mountain National Park above). Most of the mountain towns and ski resorts (Vail, Aspen, Keystone, Breckenridge, etc.) lie in the Western Slope. However, most of the westernmost portion is part of the Colorado Plateau and has desert features such as mesas and plateaus. Paonia is a very small town and does not appear on the map below, but it lies almost directly on the boundary between the Southern Rocky Mountains and the Colorado Plateau, just northeast of Montrose.
- The Eastern/Great Plains [11], as you can see in the image below, covers about the eastern third-to-half of the state. This is characterized by mostly flat land covered in prairie grasses and dotted with small towns. Between the towns are generally wide open spaces covered in farms, ranches, and some public lands. We won't really experience this area, but Denver lies at the edge of it, and you can see the Great Plains' physical geography while traveling from the Denver airport to the city.
See the video below the image for a good explanation of how the Rocky Mountains and the Front Range formed. Note the explanation of why Red Rocks and other parts of the Front Range are sedimentary rocks (made from ancient sediments such as sand and silt) that were originally layered on top of the granite "basement" rock, and the Rocky Mountains themselves are made of granite that was pushed up via oceanic subduction. Some of this granite core is over 1 billion years old! (Side note: Geology is awesome!)
NARRATOR: On our journey south along the Rocky Mountains we're entering a very different landscape. From Montana southward the Rockies are made from ancient granite 1.7 billion years old. Granite makes up much of the deepest part of the continental crust. That's why geologists call this rock the basement.
The Canadian Rockies are built from sedimentary rocks piled up on top of the continental foundations. So why does granite suddenly appear here in the American Rockies? But there's an even greater puzzle. Mountains usually form close to plate boundaries, but the southern Rockies sit a long way from the plate margin.
The Front Range in Colorado is a thousand miles from where the Pacific and North American plates actually meet. Geologists have come up with an explanation. They believe that the subducting Pacific ocean plate is responsible. Ocean crust had been pushed deep into the mantle beneath North America for a hundred million years when something unusual happened. Plates started to subduct at a shallower angle. Instead of plummeting steeply, it sliced beneath North America horizontally. This change had dramatic consequences.
DR. KIRK R. JOHNSON: The big oceanic plate in the Pacific didn't go deep down it went in shallow like a spatula under a pizza. So something happened sixty-eight million years ago over in California. That plate drives under North America but instead of diving deeply it comes in shallow and a thousand miles away from the coast up from the ground throughout the Rocky Mountains.
NARRATOR: For millions of years the ocean plate scraped along the underside of North America. It created friction breaking up the basement granite of the North American plate and punching it upward. Structural geologist Karl Karlstrom demonstrates.
PROF. KARL E. KARLSTROM: Because it was at a shallower angle beneath North America it was scraping along the base of North America. When that happens it puts the plate under compression like this because it's being both pushed at the end and scraped along at the bottom. So it squeezes, pushes up the mountains, and it transferred this mountain building from the edge to great distance from the plate margin.
NARRATOR: The shallow angle trajectory of the Pacific Ocean plate explains why these mountains formed so far inland and it also explains the presence of granite. Thrust up through layers of sedimentary rock the broken granite became the Rocky Mountains of the south.
Red Rocks Park, Denver Colorado, a landscape forged by granite uplift. The granite mountains here have been pushed up for miles. On top of the granite lie spectacular red slabs of rock known as flat irons. They're the patchwork remains of sedimentary rock that once blanketed the entire granite basement. Kirk Johnson demonstrates how these granite peaks punched up through the layers of red rock around them.
KIRK JOHNSON: I'm going to use my assistants Veronica and Ian to help me explain how the Rocky Mountains in Colorado formed. Imagine if you will that Veronica and Ian are composed of 1.7 billion-year-old metamorphic rocks, the basement Rock of Colorado.
NARRATOR: Before the mountains grew, layers of sedimentary rock covered the granite.
KIRK JOHNSON: And then in about sixty-eight million years ago the mountain where Ian is starts to break and lift up and move up so you see the uplift forming. What's happening is that layer of sediments being deformed is bent and these are the flatirons at Red Rocks. As the mountain comes up overlying sediment eroded off and deposited into the adjacent basin and eventually Ian's granitic back is exposed as the core of the Rocky Mountains. Veronica remains deeply buried beneath Denver still covered with deep sediments and the sediments eroded off the uplifting Rocky Mountains.
To Read Now
Please read the following sections of this article from Encyclopaedia Britannica [14]:
- Intro
- Land
- Climate
- Settlement patterns
Continental Divide
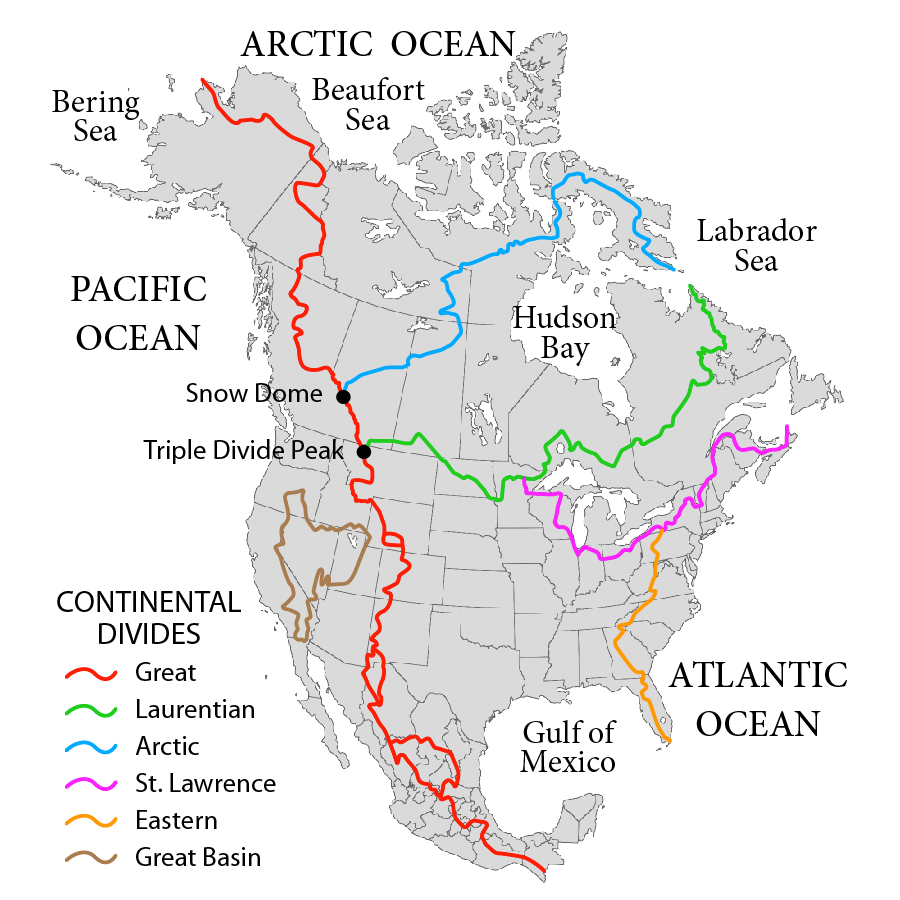
Another well-known feature of the state is the Continental Divide, sometimes referred to as the Great Divide. A continental divide is defined by National Geographic [15] as "a naturally occurring boundary or ridge separating a continent’s river systems. Each river system feeds into a distinct ocean basin, bay, or sea." As you can see in the image below, there are a number of continental divides in North America. Each of these lines is the boundary between two major drainage basins. The rivers and streams in each basin lead to a specific large body of water.
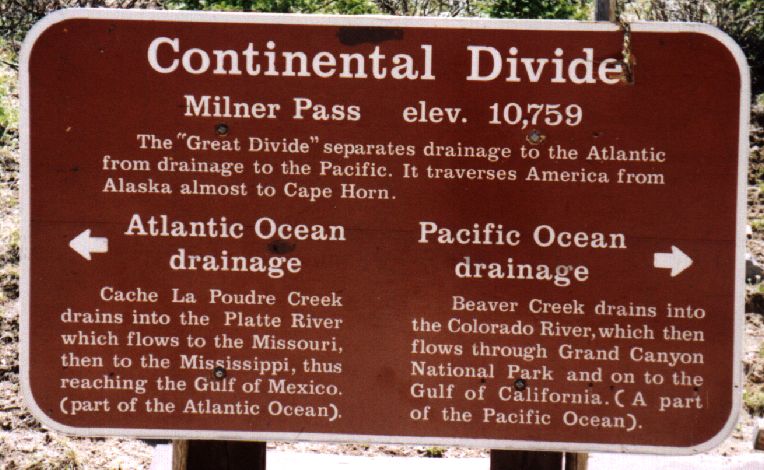
For example, the Eastern Continental Divide runs through Pennsylvania. Flowing water to the east of the divide ends up in the Atlantic Ocean, and west of the divide ends up in the Gulf of Mexico. In Colorado, water to the west of the Continental Divide flows to the Pacific Ocean, and to the east flows to the Gulf of Mexico (and ultimately the Atlantic Ocean). You may see signs while traveling through the mountains of Colorado like the one below that mark portions of the Continental Divide. There is also a trail that roughly follows the divide that is a national park - Continental Divide National Scenic Trail [16].
Water and Policy in Colorado
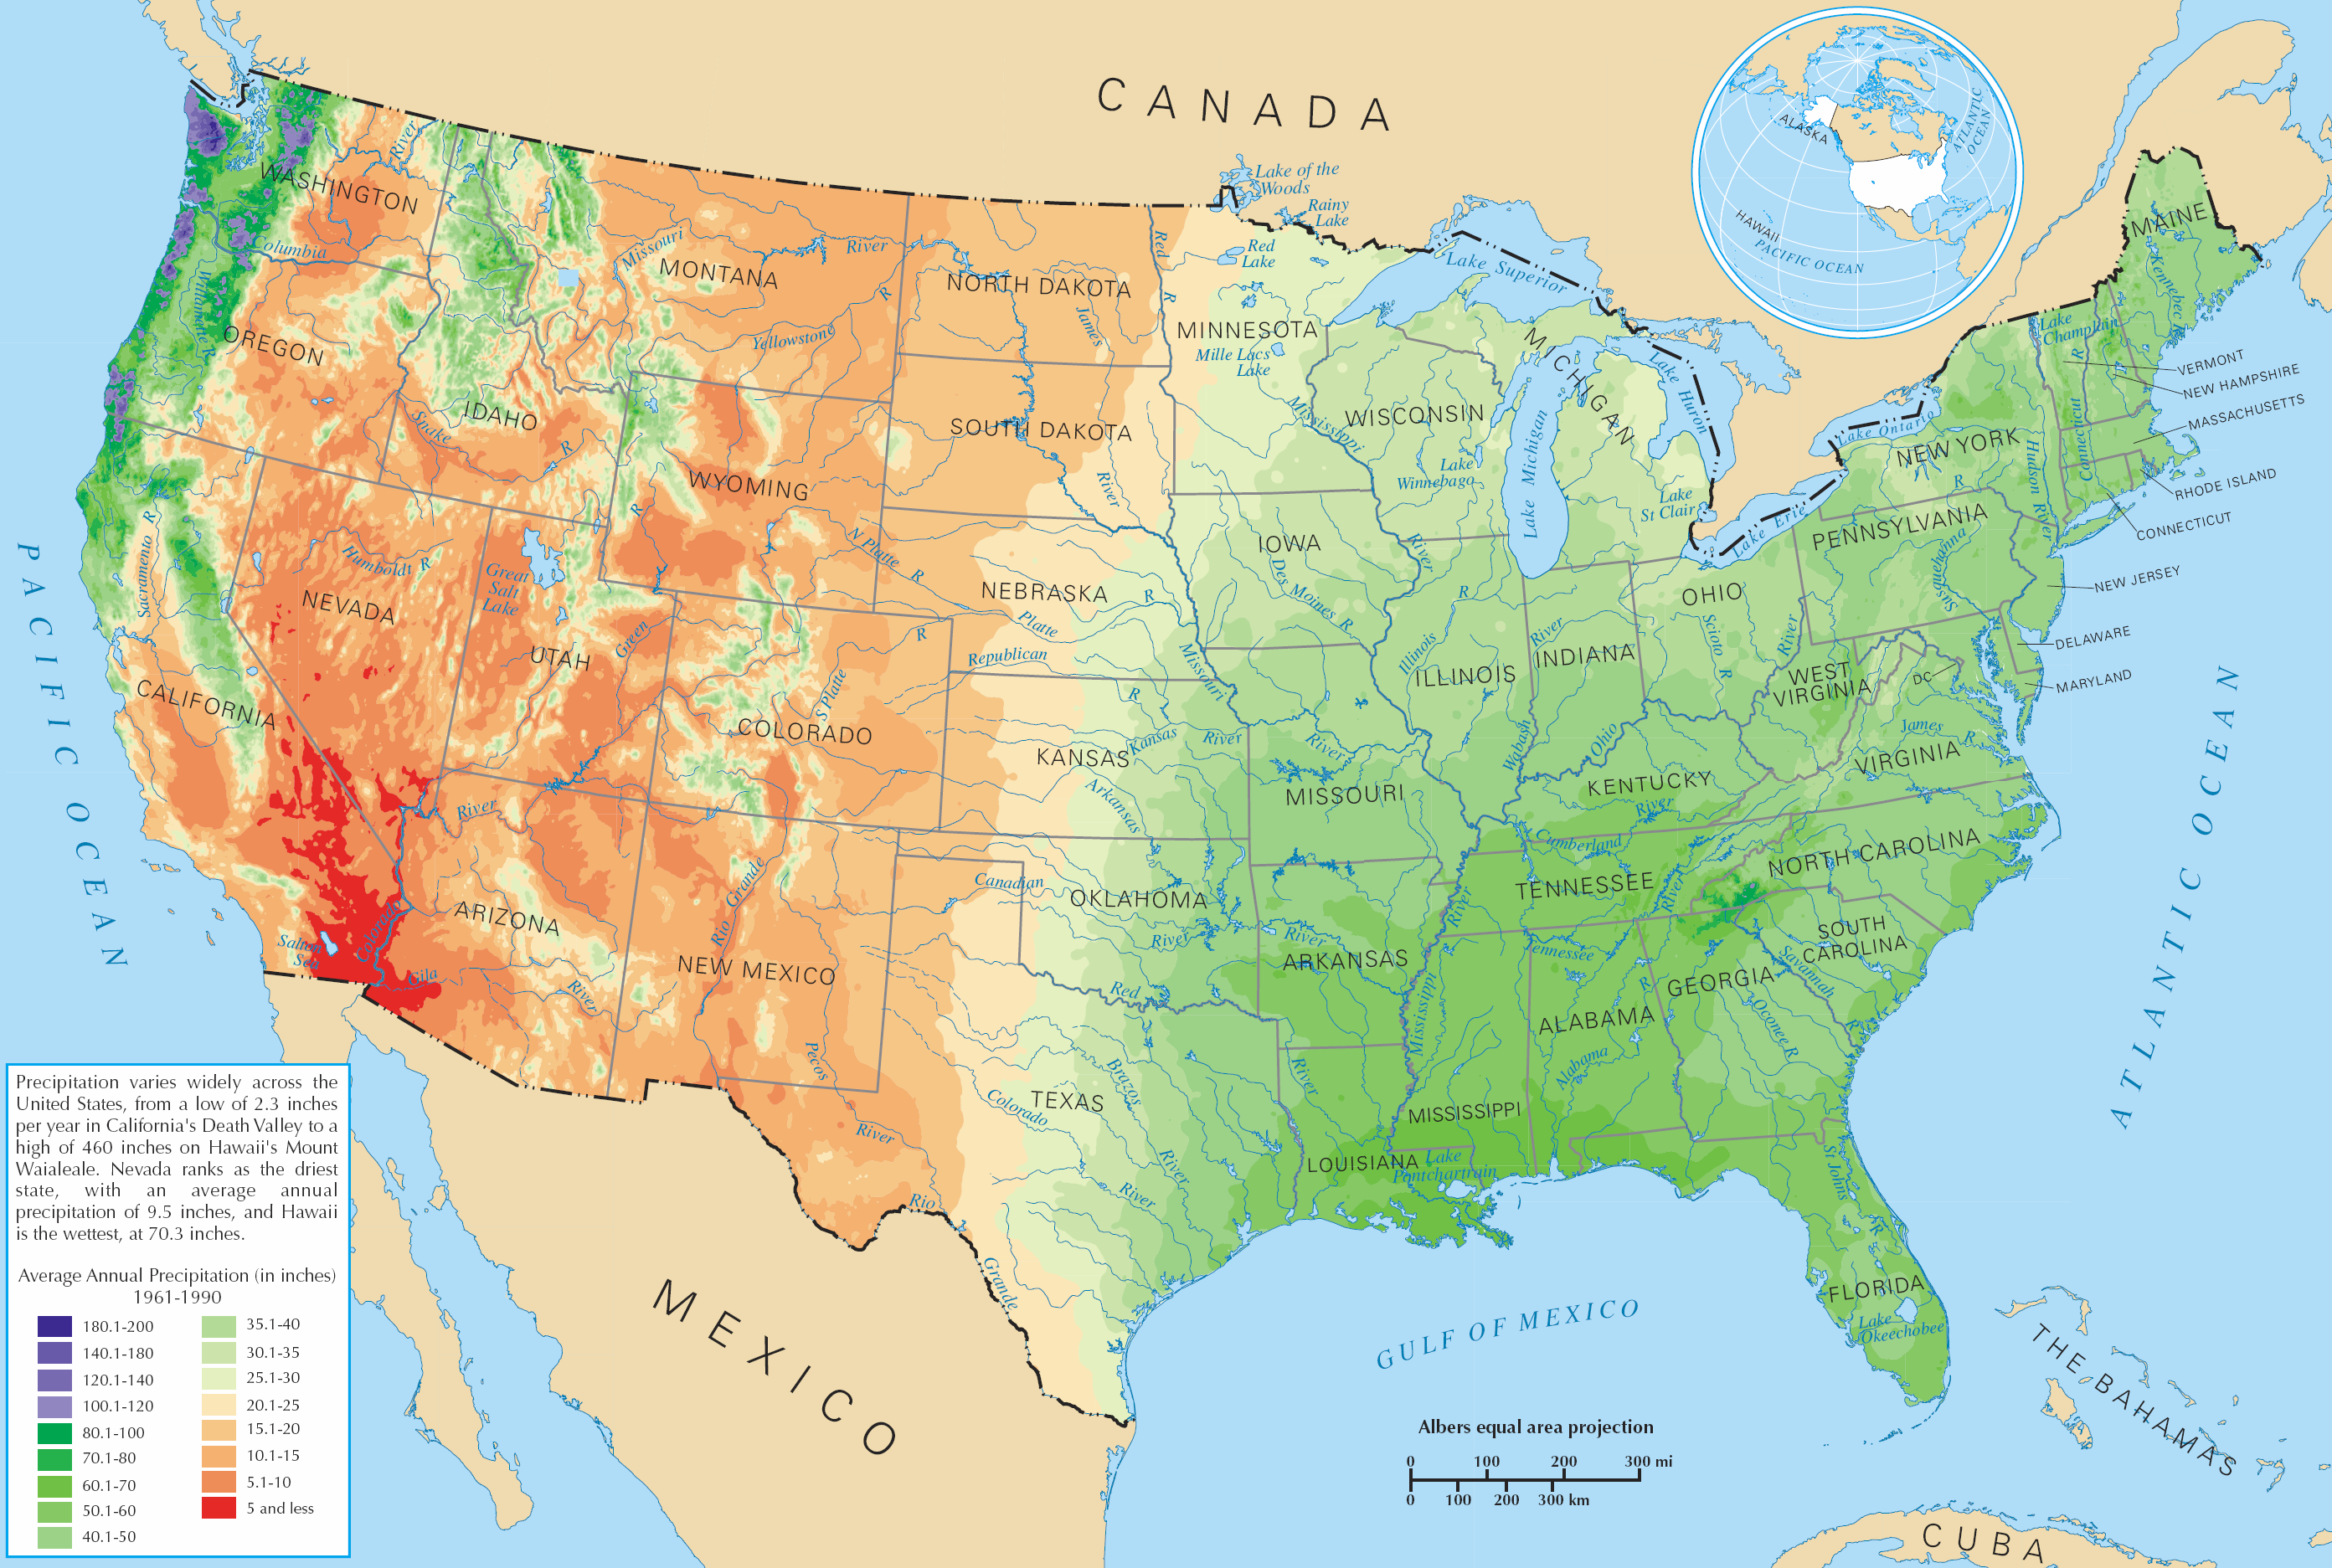
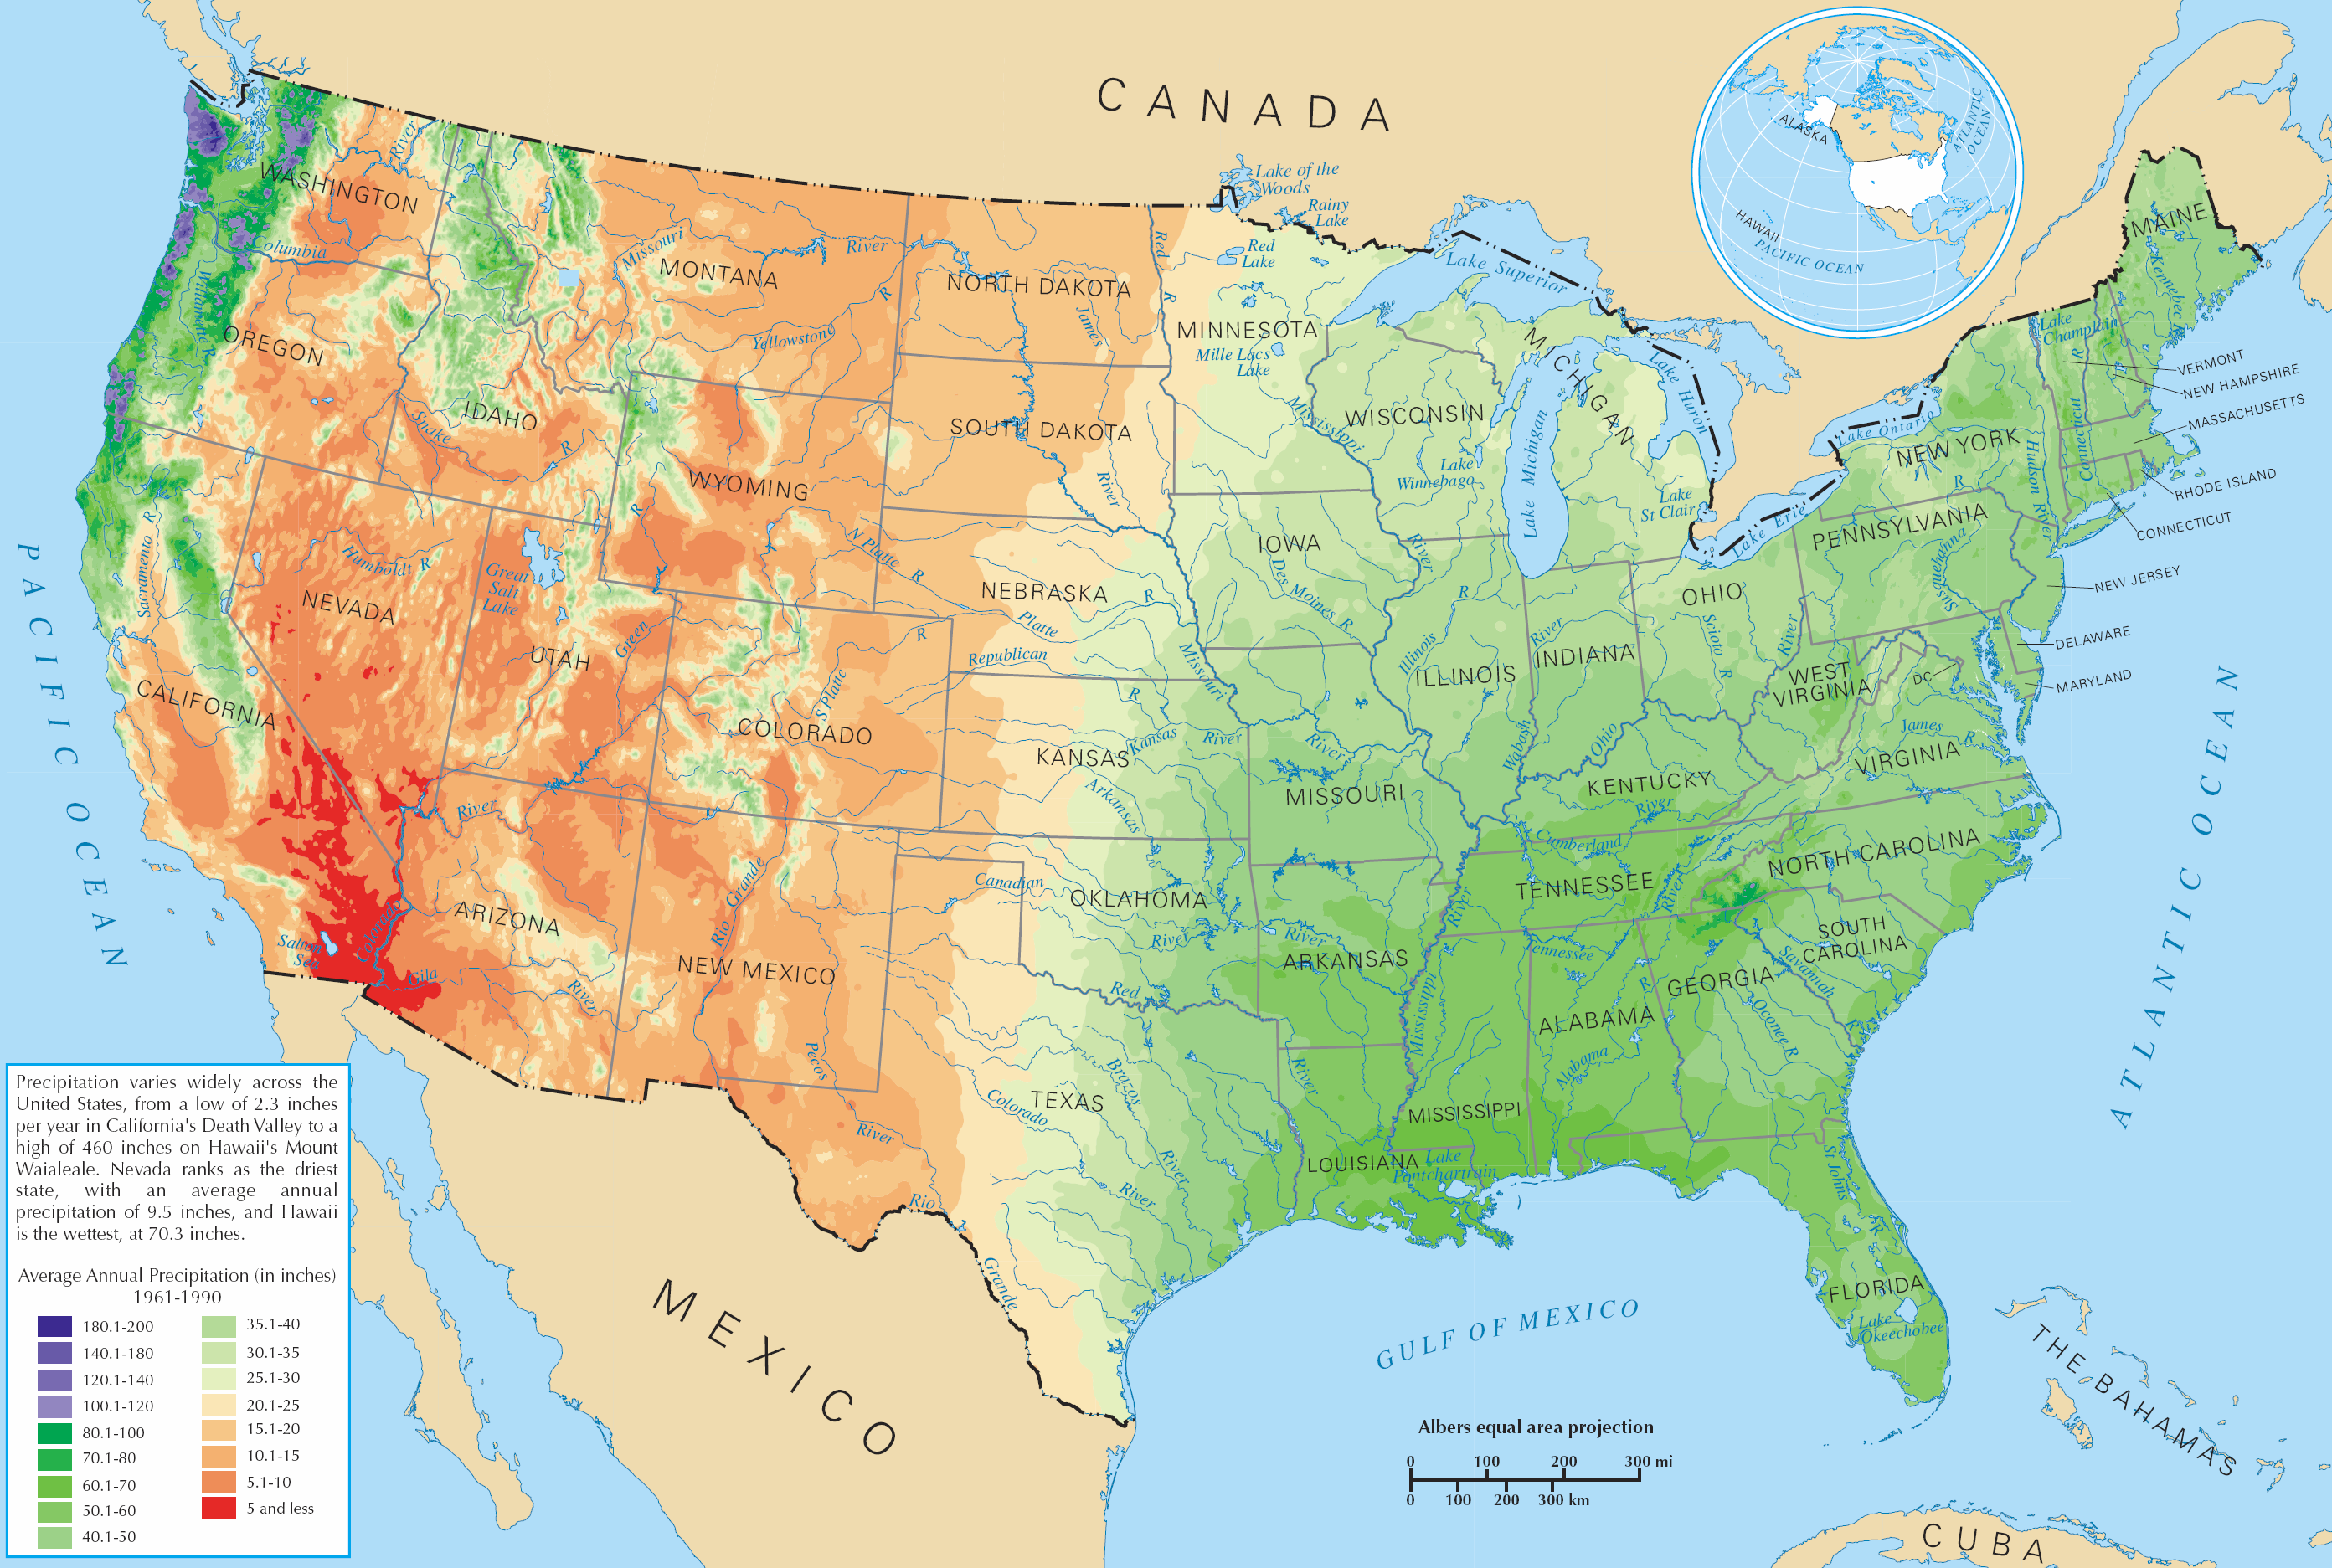
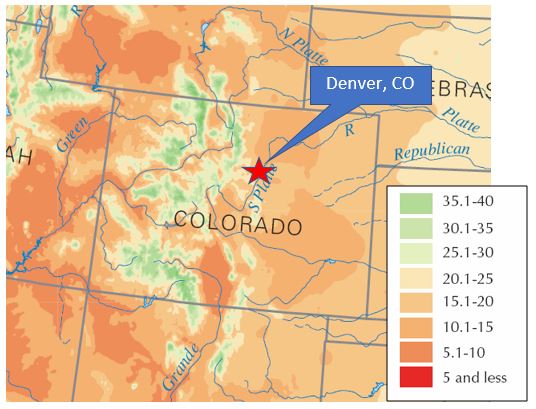
As the saying goes: "Whiskey's for drinking, water is for fighting." This is not far from the truth in Colorado! Water use and water rights are prominent issues in the state. It is an unusual experience for anyone that grew up on or near the East Coast, where the issue of water rights almost never comes up, to move to Colorado and find out that the "average" person is conversant in water rights. Water is such an important issue for Coloradans (and many who live in the western United States) because it is relatively scarce. As you can see in the maps below, most of the state receives under 20 inches of precipitation per year, and in fact, the average rainfall across the state is 15 inches per year, according to Denver Water [21]. This makes most of the state semi-arid, which means that it is climatologically not far away from a desert (arid) environment. As a point of comparison, most of the land east of the Mississippi receives more than 35 inches per year, with State College, PA receiving about 40 inches per year [22].
Further complicating matters is the comparison of the rainfall and population geographies of the state. Recall that the Western Slope of Colorado lies west of the Continental Divide and the Eastern Slope (including the Front Range) to the east. According to "Water Law" (Denver Water) [21], 10 percent of the state's residents live on the Western slope, but it contains 33 percent of the state's land and 70 percent of its water. Because of this, Western Slope water is often used on the Eastern Slope. This, in addition to relative scarcity and Colorado water laws, has contributed to water being a major issue in the state.
To Read Now
Please read the following summary of Denver and Colorado water policy. Read the sections entitled "Water law," "Water rights," "Rain barrels," and "Graywater use."
Energy and Policy in Colorado
Colorado has a very diverse and often contentious energy landscape. For example:
- On the one hand, the oil and gas industry is very important to the state. According to the U.S. EIA, Colorado is the fifth-largest natural gas producing state in the country [26] and the state has about 4% of the country's oil reserves. The EIA also notes that the state's "crude oil production has quadrupled since 2010." About half of its electricity comes from coal.
- On the other hand, the state is home to the National Renewable Energy Laboratory [27] (NREL), which is one of the premier renewable energy research organizations in the U.S. It is one of the U.S. national labs and is the only national lab that focuses on renewable energy. The EIA notes that: "Electricity from renewable sources has more than doubled since 2010 to almost 25% of Colorado's net generation in 2017, led by increased wind power from the state's nearly 2,000 turbines." According to the EIA, 23.7% of the state's electricity generation came from renewables in 2018 [28].
While traveling through Colorado, it is not uncommon to see oil pump jacks, wind turbines/farms, fracking operations, solar arrays, and coal-fired power plants. (We will probably see more than a few of each during our time there.) Solar Energy International [29] has its training headquarters in Paonia on the Western Slope (we will visit them), yet fracking wells dot the local landscape and it is not uncommon to see train cars full of coal while traveling to and from Paonia. This variety can and does cause conflict, with fossil fuel advocates having strong disagreements with renewable energy advocates on personal and political levels.
The image below shows Colorado's 2014 fuel mix (the latest data available). You have seen this type of chart in EM SC 240N. Remember that this is called a "Sankey" chart and indicates energy flows. The numbers are all Trillions of BTUs (TBTUs) of energy, and the lines indicate the energy flows to different sectors. Remember that you read the chart from left to right, and can follow each primary energy source (the sources to the left) to see where they are used.
- For example, of the 351 TBTUs of coal burned in 2014, 342 TBTUs were used in electricity generation (97.4%), 8.4 TBTUs were used in the industrial sector (2.4%), and 0.15 TBTUs were used in the commercial sector (0.043%).
- You can also analyze individual sectors (electricity, residential, commercial, etc.) by using the chart. For example, the industrial sector used 314 TBTUs in 2014, of which 191 TBTUs were from natural gas, so 60.8% (191/314) of industrial energy came from natural gas in 2014.
- You can determine the efficiency of whole sectors by dividing the total energy used in the sector by the "useful" energy (useful energy is referred to as "energy services" on the chart).
 [30]
[30]
Energy Policies
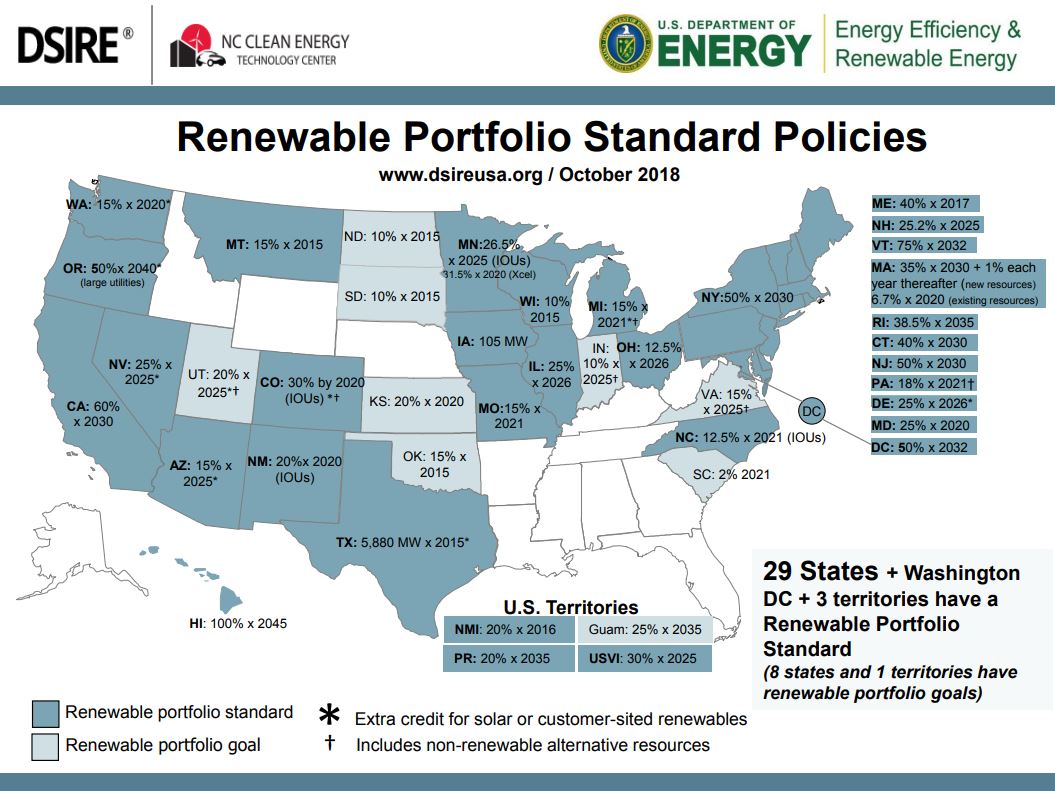
Energy policy can be very intricate and can vary significantly from state-to-state and even within states. If you are interested in finding out which energy policies exist in each state (and nationally), hands-down the best website for details is DSIRE [31], which is out of NC State University but is managed in conjunction with the U.S. Department of Energy. Believe it or not, DSIRE lists 125 energy policies [32] that apply to the state of Colorado! Obviously, we do not have time to go over all of them, but a few of the most prominent ones are below.
Renewable Portfolio Standards (RPS)
Renewable Portfolio Standards (RPSs) are created through legislation and require electricity providers to provide a certain percentage of their electricity from renewable (or alternative) sources. Each state is able to pass its own RPS law (or not), as there is no national RPS in the U.S. Each RPS dictates the percent targets compliance years (see below), and also indicates which energy sources can be used to meet the RPS goal.
Utilities must prove that the required percentage of the electricity they sell is from one of the eligible renewable sources. The three primary ways they do this is a) build and generate their own renewable electricity installations (e.g. a large solar array or wind farm), b) purchase renewable energy from a dedicated supplier (e.g. an independent owner of a large solar array or wind farm), or c) "take credit" for renewable electricity generated by customers on their grid. Utilities rarely build their own generation facilities nowadays (option a), but signing long-term contracts with independent suppliers is becoming very common (option b).
It is very common for utilities to "take credit" for customer-generated electricity, in particular through residential solar arrays. They do this by paying the customer a fee to take credit for the electricity they generate. Each credit is called a "renewable energy credit (or certificate)" (REC), though solar credits are often referred to as SRECs (solar renewable energy credits). REC and SREC prices are set by different mechanisms, but usually, they are sold on the open market. There are too many details to go into here, but here is an example of how this could work: Let's say I have a solar array and I generate 1,000 kWh of electricity in a year (this is 1 MWh of electricity). If the utility agrees to pay $50/SREC, then they would pay me an additional $50 at the end of the year. If I generate 2 MWh, I would get $100, and so on. This is in addition to me not having to pay for the electricity that I generate! In other words, if I generate 1,000 kWh, that is 1,000 fewer kWh that I have to pay the utility for. (This is referred to as net metering.)
RPS benchmarks gradually increase, e.g. 5% in year one, 7.5% in year two, and so on. If a utility does not meet the benchmark in a given year, they are penalized (usually fined).
For example, Colorado passed an RPS in 2004. Details can be found here [33]. Some details relevant to the discussion above are as follows:
- Investor-owned utilities must get 30% of electricity from renewable sources by 2020, with the yearly benchmarks as follows:
- 3% by 2007
- 5% from 2008 - 2010
- 12% from 2011 - 2014
- 20% from 2015 - 2019
- 30% from 2020 moving forward
- Eligible technologies include: "Geothermal Electric, Solar Thermal Electric, Solar Photovoltaics, Wind (All), Biomass, Hydroelectric, Landfill Gas, Wind (Small), Anaerobic Digestion, Fuel Cells using Renewable Fuels Recycled Energy, Coal Mine Methane (if the PUC determines it is a greenhouse gas neutral technology), Pyrolysis of Municipal Solid Waste (if the Commission determines it is a greenhouse gas neutral technology)"
- There are a lot of "multipliers," which provide extra incentives for specific types of renewable energy projects. For example, each kWh generated by a community solar project counts as 1.5 kWh toward the RPS goal.
- There are many, many more details of this single policy! I suggest taking a look at the policy to see how intricate policies like this are (and to see one reason why Energy and Sustainability Policy is a useful major!).
 [34]
[34]
Investment and Production Tax Credits
A tax credit is just that, a credit. When an individual or business investor earns a tax credit it means that the amount of the credit will be subtracted from a future tax bill. In the United States, we have a Federal Residential Renewable Energy Tax Credit [35] which provides a tax credit covering 30% of the cost of installation. This is commonly referred to as the investment tax credit or ITC. If you put a photovoltaic system on your roof at a cost of $30,000, you earn a $9,000 tax credit. The government doesn’t mail you a check for this amount. It means you get to deduct that amount from your next tax payment. To realize this money, you will need to have paid at least $9,000 in taxes, but excess credits can "generally" be carried over to future tax years. Note that even if you were owed a refund, this tax credit can be used to increase your refund, as long as you paid at least $9,000 in federal income tax throughout the year. Eligible energy sources include "solar water heat, solar photovoltaics, geothermal heat pumps, wind (small), [and] fuel cells using renewable fuels." This is only applicable to residential customers. The percent credit will gradually decrease after 2019 and zero out at the end of 2021 (unless an updated law is passed).
Essentially the same ITC (but it is technically the Business Energy Investment Tax Credit [36]) applies to corporate owners in the following sectors "commercial, industrial, investor-owned utility, cooperative utilities, and agricultural." So basically everyone except for residential, and non-profits. The incentive levels are a little different for some of the energy sources, but solar, wind, and fuel cells earn a 30% credit in 2019, which then decreases at the same rate as the residential ITC afterward.
A production tax credit (PTC) [37] provides an incentive for each kWh of renewable electricity generated and is not based on the up-front cost of the technology. This is a federal incentive. For any source installed in 2018, the only technology that is eligible for a PTC is wind, and qualified facilities will receive about 0.8 cents ($0.008) per kWh generated, but this price is guaranteed for 10 years after the turbine begins service, so the savings can add up! For example, a 2 MW turbine with a 40% capacity factor would generate the following revenue:
- 2 MW = 2,000 kW x 8760 hrs/yr x 0.4 = 7,008,000 kWh/yr
- 7,008,000 kWh/yr x $0.008 = $56,064/yr
A 2 MW turbine is actually on the smaller end of new wind turbine sizes, so even a seemingly meager PTC can be a big deal!
Again, these are only a few of the many, many energy policies that apply to the State of Colorado! This will help provide some context for our experience there, and knowing where to access energy policy information will be helpful for your projects.
Summary and Final Tasks
Summary
By now you should be able to do the following:
- identify and describe major geographic regions and features of Colorado;
- analyze population and precipitation patterns in Colorado;
- describe the basic geology of the Rocky Mountains and the Front Range;
- explain the concept of "first in time, first in right" in terms of Colorado water policy;
- define RPS, REC, SREC, ITC, and PTC as they relate to energy policy;
- explain how renewable portfolio standards incentivize renewable energy.
Reminder - Complete all of the Lesson 10 tasks!
You have reached the end of Lesson 10! Double-check the to-do list on the Lesson 10 Overview page [38] to make sure you have completed all of the activities listed there before you begin Lesson 11.