Lee's Guide to Decoding METARS
Around the middle of May in 2006, a blocking pattern set up over Canada and U.S. northern border states (check out the daily composite of 500-mb heights on May 12 below). I point out that, on this date, there were two blocking highs ... one centered over Canada's Northwest Territories and the other simultaneously anchored over Newfoundland in eastern Canada. Why would you call it a "blocking pattern", Grenci? Good question. Note that the flow across Canada and the U.S. northern border states is not very zonal. Indeed, it's highly meridional, meaning that the natural west-to-east progression of mid-latitude weather systems across Canada and the U.S. northern border states has been interrupted ... in this case, by the two blocking highs.
 |
| The daily composite of 500-mb heights on May 12, 2006, showed two blocking highs centered over Canada. Please note the associated cut-off / closed lows on each of their flanks. |
Referring to the daily composite chart of 500-mb heights above, I point out that two cut-off / closed lows formed on either side of each blocking high, which compounded the stagnancy of the blocking pattern (for the record, a cut-off low at 500 mb has at least one closed height contour around it's center while typically residing in an environment characherized by a weak height gradient ... in such an environment, the low is essentially "cut-off" from relatively fast 500-mb winds that tend to steer weather systems from west to east across the middle latitudes). I'll add that cut-off lows sometimes set the stage for protracted rains and flooding (in contrast with the weather underneath the blocking high, which tends to be sunny and dry ... long-lived blocks can create drought conditions).
For the record, a 500-mb closed high or ridge qualifies as a blocking high if it meets the following criteria:
- the basic westerly current must split into two branches (like the split in the flow of water around a rock in a fishing stream),
- each branch must transport appreciable mass,
- the double-current system must extend over several tens of degrees longitude,
- a sharp transition from zonal flow upstream to meridional flow downstream must be observed across the split in the westerly current, and
- the pattern must persist with recognizable continuity for at least five days (some stricter criteria require ten days).
)
Like a blockage in a plumbing pipe (Drano, anyone?), the stagnancy of the blocking pattern over North America on May 12, 2006, paved the way for protracted, recurrent rains across New England (check out the loop of radar reflectivity from 00Z on May 12 to 00Z on May 13). Mind you, recurrent rains fell for nearly a week over parts of New England - here are the multi-sensor rainfalls for the seven-day period (May 11-May 18). In case you're interested, here are the radar estimates from Portland, Maine. Needless to say, flooding was rampant (see image below).
)
)
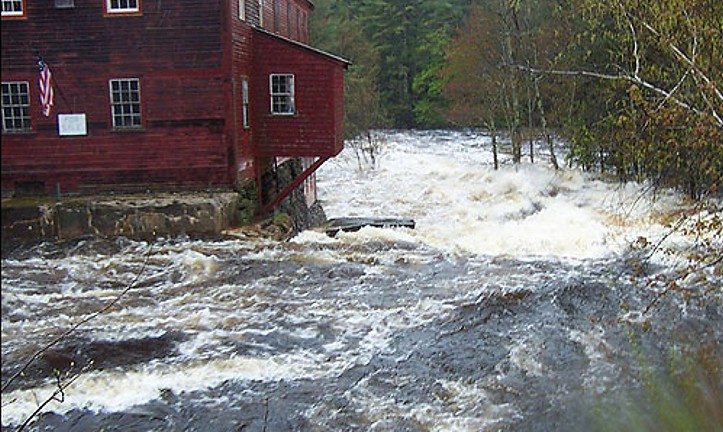 |
| The rampaging Little River in Lebanon, Maine, during the spate of rain over New England around the middle of May, 2006. Courtesy of the Boston Globe. |
Compounding the stagnant blocking pattern was a tropical connection (the visible satellite image at 1445Z on May 12 shows a long plume of moisture from low latitudes that intercepted New England. A sprawling, cut-off low over the Great Lakes region helped to draw moist Atlantic air over the region, while some moisture simply surged inland in concert with a low-level jet stream (just so you have a sense of the overall pattern, here's the daily composite of 850-mb vector winds on May 12; the low-level jet stream produced plenty of moisture convergence). By the way, the cut-off low over the Great Lakes region had one heck of a cold-conveyor belt. Do you see it on the satellite image?
)
)
)
Whew! That's certainly was a long-winded introduction to METARS! Let's get down to brass tacks. As it turned out, observations at Concord, New Hampshire, such as
METAR KCON 131151Z AUTO 09009KT 1 3/4SM +RA BR OVC010 09/07 A3005 RMK AO2 CIG 007V013 SLP177 P0015 60056 70066 T00890072 10094 20089 53018METAR KCON 131751Z AUTO 00000KT 2SM +RA BR OVC013 08/06 A3012 RMK AO2 SLP202 P0017 60115 T00780061 10089 20072 53004
were commonplace over southern and eastern New England during the rainy siege. Before I translate these METARS, I want to take the time to tell you why you should learn to decode them. Back in the good old days when I was an on-air meteorologist, I always wanted to know how my forecasts were faring. By looking at raw METARS, you can glean more information than the standard decoded METARS. From a more philosophical perspective, looking at observations is part of the process of "becoming one with the atmosphere". I urge you to consume as much surface and upper-air observations as you possibly can before you start looking at computer guidance. I also encourage students aspiring to become weather observers (or students who want to master the METAR code) to study Chapter 12 the Federal Meteorological Handbook that serves as the "bible" of encoding METARS (check out the Table of Contents for the entire handbook).
Okay, let's get down and dirty and decode the first METAR. With regard to "METAR", I already suggested that a loose translation to this French acronym is "routine aviation weather observation". But sometimes you'll see "SPECI", which translates to a special (unscheduled) report.
KCON is the four-character ICAO (International Civil Aviation Organization) identifier for Concord, New Hampshire. You can use the station list at the National center for Atmospheric Research to help you decipher any identifier.
131151Z - the observation was taken on the 13th (May, 2006) at 1151Z (you always determine the month and year in the context of real time).
AUTO indicates a fully automated report with no human intervention. If an observer takes or augments observations, this tag does not appear. Sometimes you might see COR, which indicates a corrected observation.
09009KT indicates that the wind blew from 90 degrees (an easterly wind) at 9 knots. Gusts are indicated thusly (the METAR below is an observation from Mount Washington in New Hampshire (see photograph below) at the same time as the first METAR from Concord):
KMWN 131147Z 13043G58KT 1/16SM FZRA PL FZFG VV001 M01/M01 RMK PLB40 VRY LGT GICG 60074 70148 931000 10017 21013
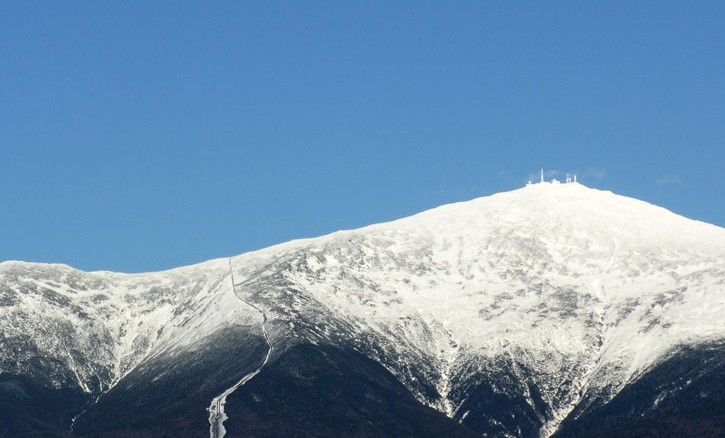 |
| Mount Washington, New Hampshire, in December, 2005. If you look closely, you can see the Mount Washington Observatory (here's a close-up aerial view of the Observatory). |
)
Winds sustained at 43 knots and gusting to 58 knots is just a ho-hum "breeze" compared to the world-record setting 231 miles an hour clocked at the summit on April 12, 1934. Yes, Mount Washington is a windy place indeed.
)
In stark contrast to windy Mount Washington, a METAR entry of 00000KT represents a calm wind. Also, a brief word about variable winds is in order. When the wind is light (a speed of six knots or less) and it varies in direction with time, the data encoded on a METAR might look like VRB004KT (variable direction blowing at four knots). If the wind speed is greater than six knots and the wind direction varies, the data encoded on a METAR might look like "32014KT 290V350". Translation: the wind direction was 320 degrees and the wind speed was 14 knots, but the direction varied from 290 to 350 degrees. Such a varying wind direction might occur in the immediate wake of a cold front. I don't mean to be overly-picky, but variable wind directions are always encoded in the clockwise direction (just for the record).
Okay, back to decoding the Concord METAR. 1 3/4SM translates to a horizontal visibility of one and three-fourths statute miles. Visibilities below one fourth of a mile appear as M1/4SM in METARS from automated stations.
+RA represents heavy rain while BR is the METAR code for mist. You should become familiar with the other codes for precipitation and restrictions to visibility (in other words, present weather).
|
||||||||||||||||||||
| The various codes for reporting present weather on METARS. | ||||||||||||||||||||
OVC010 represents the current sky condition, which, at this time, was overcast at 1000 feet (the three-digit code corresponds to the ceiling (or cloud base) in hundreds of feet). In general, please note that METARS can list data about more than one layer of clouds. Moreover, when the sky is obscured, METARS should include the vertical visibility in hundreds of feet. For example, VV004 corresponds to an obscured sky with a vertical visibility of 400 feet.
A3005 is the altimeter setting - in this case, 30.05 inches of mercury.
09/07 represent the temperature and the dew point reported to the nearest degree Celsius (more precise data sometimes appear near the end of METARS - I will showcase the "T group" in just a moment or two). In this observation, the temperature was 9 degrees Celsius and the dew point was 7 degrees Celsius.
RMK stands for "Remarks". There are a multitude of remarks (see heading 12.7.1 of the Federal Handbook) In this case, A02 indicates that the automated station has a precipitation sensor (A01 means that the automated station does not have a precipitation sensor).
CIG 007V013. When the ceiling (as measured by a ceilometer) is less than 3000 feet and variable, this group typically appears in METARS. In this case, the ceiling was variable between 700 and 1300 feet.
SLP177 indicates the sea-level pressure in millibars (1017.7 mb).
P0015 is the hourly liquid precipitation (in hundredths of an inch). In this case, 0.15 inches of rain fell in the hour ending at 12Z.
60056 represents the three- or six-hour liquid precipitation (in hundredths of an inch). In this case, 0.56 inches of rain fell in the six-hour period ending at 12Z. for the record, six-hour totals appear at 00Z, 06z, 12Z and 18Z. Three-hour totals appear at 03Z, 09Z, 15Z and 21Z. 60000 translates to a trace of liquid precipitation during the three- or six-hour period.
70066 indicates the total 24-hour liquid precipitation ending at 12Z (in hundredths of an inch). In this case, 0.66 inches fell at Concord from 12Z on May 12 to 12Z on May 13.
T00890072 indicates the hourly temperature and dew point to the nearest tenth of a degree Celsius. You will likely want to follow this group as you monitor your forecasts (note the differences between these actual 12Z observations and the 09/07 temperature / dew-point group). The "0" after the "T" indicates that the temperature and dew point are higher than 0 degrees Celsius (a "1" will follow the "T" when the dew point temperature and /or the temperature is / are less than 0 degrees Celsius). In this case, the 12Z temperature at Concord was 8.9 degrees Celsius and the dew point was 7.2 degrees Celsius (convert).
10094 represents the highest temperature, in tenths of a degree Celsius, during the six-hour period ending at 12Z (in this case). If the digit following the "1" is a "0", then the temperature is higher than 0 degrees Celsius (a "1" following the "1" indicates that the temperature is less than 0 degrees Celsius). So the highest temperature at Concord between 06Z and 12Z on May 13, 2006, was 9.4 degrees Celsius. For the record, the "1" group is reported at 00Z, 06Z, 12Z and 18Z.
20089 indicates the lowest temperature during the six-hour period ending at 12Z (in this case). If the digit following the "2" is a "0", then the temperature is higher than 0 degrees Celsius (a "1" following the "2" indicates that the temperature is less than 0 degrees Celsius). So the lowest temperature at Concord between 06Z and 12Z on May 13, 2006, was 8.9 degrees Celsius. Like the "1" group, the "2" group is reported at 00Z, 06Z, 12Z and 18Z.
53018 indicates the pressure tendency (the "5 group"). The digit following the "5", which can vary from 0 to 8, describes the behavior of the pressure over the past three hours (for guidance, consult the table below). The last three digits represent the amount of pressure change in tenths of a millibar. Thus, the pressure at Concord increased 1.8 mb in the three-hour period ending at 12Z on May 13, 2006.
|
||||||||||||||||||||||||||||
| Descriptions of the behavior of pressure over the past three hours and the corresponding METAR code (third column). |
I realize that translating one METAR hardly qualifies as an entire lesson, but at least you now know the general guidelines and where to find information in case you run across a METAR that gives you pause. I encourage you to expand your aptitude for decoding METARS - they hold a lot of information.
I'll finish up this lesson with some new techniques to help you fine-tune your high and low temperature forecasts. Read on.
©1999-2006 The Pennsylvania State University. All rights reserved.