Composite Reflecitivity vs. Base Reflectivity
Why are the estimated rainfall rates derived from base reflectivity different from the rates associated with composite reflectivity? To answer this question, keep in mind that NEXRAD images display base reflectivity and national radar mosaics display composite reflectivity.
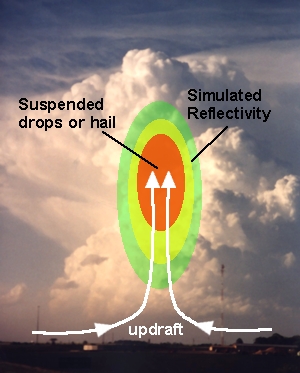 |
| Strong updrafts in severe thunderstorms can briefly suspend a heavy load of raindrops and hailstones high in the cumulonimbus cloud. |
So, the crux of the explanation why there are two different tables for estimating rainfall rate boils down to this distinction: Radar images of base reflectivity display the back-scattered energy at a single elevation scan (NEXRAD images) and composite reflectivity displays the strongest back-scattered energy of all of the elevation scans (national mosaic).
The idea that reflectivity at one scan angle can be higher than at another angle might seem a little fuzzy to you, so I'll elaborate. Consider, for example, the case of a severe thunderstorm. The storm's updraft, which is a fast, rising current of moist air that sustains the thunderstorm, is usually strong enough (25 meters per second or faster) to suspend a large amount of rain (and hail) aloft. Meteorologists call the suspension of precipitation high in a thunderstorm precipitation loading. At this stage of the storm, the reflectivity high in the cumulonimbus cloud is much greater than the reflectivity lower in the cloud. So, a radar image created from composite reflectivity will likely display the higher dBZ level (more intense colors) than a radar image of base reflectivity. Eventually, of course, the rain intensity at lower altitudes (and the surface) will increase as rain and hail fall from the cB (this will occur once the updraft can no longer support the weight of suspended water and ice).
A reasonable question to ask at this point is "How do we know that precipitation loading really occurs high in a severe thunderstorm?". Let's start from scratch. To generate the standard NEXRAD images that you've been looking at in this Lesson, a radar gradually scans 360 degrees around the radar site at a rather small constant angle of elevation (for jargon junkies, this is called a PPI scan). However, meteorologists also have the capability of halting the circular, nearly horizontal sweep by the radar and pointing it directly at a storm. In this position, the radar now scans the thunderstorm from top (large scan angle) to bottom (low scan angle). In effect, this up-and-down scanning by the radar produces a vertical slice through the thunderstorm, showing the precipitation structure of the storm. A sample of this kind of radar image (called an RHI scan) is shown below. Note the core of heavy precipitation suspended high in the storm. Yes, folks, precipitation loading is real.
)
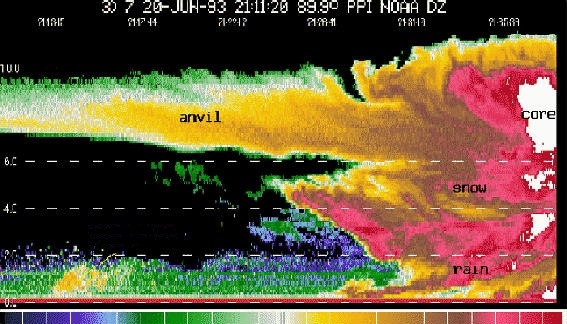 |
| An RHI image (vertical slice) of a thunderstorm. Note that the highest reflectivities are found in the mid- to upper-levels of the storm. Image courtesy of NOAA's Environmental Technology Laboratory. To help you orient yourself, here is a photograph of nearly the same point of view, looking at a similar storm. |
)
So here's the bottom line: Be aware that there are two different conversions from reflectivity to estimated rainfall rates and that the one you use depends on the type of image you're looking at (NEXRAD or national mosaic).