Lessons
This is the course outline.
Lesson 1: Introduction to Petroleum Refining and Crude Oil Composition
Lesson 1 Overview
Lesson 1 Overview
Video: FSC 432 Lesson 1 (2:04)
Hello. In this lesson, we will go over the market drivers for Petroleum Refining Industry, an overview of refinery processes and refinery products, and the chemical constitution of crude oil. Obviously, the principle driver for Petroleum Refining Industry is economics that is now very closely tied to environmental regulations as well. So we need to look into the supply and demand picture, whether it is for the crude oil or the refined products such as fuels, gasoline, diesel, jet fuel, et cetera, and the environmental regulations on the compositions of these fuels, as well as on the operation of the refinery, and the flexibility of the refinery to respond to the demand shifts or supply shifts on either side of this equation.
And we go over finally the chemical constitution of this very complex feedstock, crude oil, and how we can in essence better understand how different each crude oil is, and what our refiners can do to adjust the processes to accommodate these differences in the crude oil circle. A recent development in the United States increased production of shale gas, which also produces some liquid byproducts that are entering the refinery as alternative feedstock. We need to really understand how these feeds could be refined to give us a conventional set of products that we produce in the refinery. So I look forward to seeing you in these lessons and go through the activities.
Overview
Petroleum provides the largest fraction of primary energy supply in the U.S. and in the world [Figure 1.1,eia1]. Resource consumption patterns shown in Figure 1.1 reflect major epochs in human history, such as The Industrial Revolution, ushering in the rapid increase in coal consumption. Petroleum trace, for example, marks the mass production of automobiles with the introduction of Model T by Ford, world wars, supply crises of 1973 and 1979 and the economic recession in 2008. Transportation of people and goods in many parts of the world depends almost completely on petroleum fuels, such as gasoline, jet fuel, diesel fuel, and marine fuel. Apart from the fuels, materials that are necessary for operating the combustion engines of cars, trucks, planes, and trains also come from petroleum. These materials include lubricating oils (motor oils), greases, tires on the wheels of the vehicles, and asphalt to pave the roads for smooth rides in transportation vehicles. All petroleum fuels and many materials are produced by the processing of crude oil in petroleum refineries. Petroleum refineries also supply feedstock to the petrochemicals and chemical industry for producing all consumer goods from rubber and plastics (polymers) to cosmetics and medicine. Only ten percent of petroleum consumption, the portion that is not used for transportation or other energy outlets, is sufficient to manufacture all the materials used in human economy, with the exception of those derived from wood or minerals.
Figure 1.1 is showing the history of energy consumption of the U.S. and the source of the energy. For nearly the first 100 years, the U.S. used only wood as our energy source until about the mid 1800’s. Afterward they started using more of what we think of as our standard energy materials such as coal and petroleum. The 20th century is when sources we now consider alternative started to appear such as hydraulic, nuclear, solar and natural gas.
The petroleum industry consists of two separate operations: Upstream and Downstream Operations. Upstream operations involve exploration of new oil reserves, development of oil fields, constructing the well-head and crude oil production facilities. Downstream operations cover processing of crude oil in petroleum refineries to produce liquid and gaseous fuels and materials for the market. This course addresses petroleum refining to review how a variety of physical processes and chemical reactions in separate refinery units are integrated to process compliant fuels and materials.
Learning Outcomes
By the end of this lesson, you will be able to:
- recognize the significance of petroleum fuels in the U.S. energy supply;
- express the overall objectives of petroleum refining;
- identify the economic and environmental drivers of petroleum refining;
- describe the overall approach to petroleum refining and categorize refinery processes and products;
- portray chemical constitution of petroleum.
What is due for Lesson 1?
This lesson will take us one week to complete. Please refer to the Course Syllabus for specific time frames and due dates. Specific directions for the assignments below can be found on the Assignment page within this lesson.
| Readings | J. H. Gary, G. E. Handwerk, Mark J. Kaiser, Chapter 1, pp. 1-12; Chapter 3, pp. 62-65 |
|---|---|
| Assignments | For your information, review the most recent supply of petroleum fuels from the data given at U.S. Energy Information Administration [3] (eia.gov) and research how petroleum refining addresses the environmental concerns from the combustion of petroleum fuels in internal combustion engines. |
Questions?
If you have any questions, please post them to our Help Discussion (not email), located in Canvas. I will check that discussion forum daily to respond. While you are there, feel free to post your own responses if you, too, are able to help out a classmate.
Market Drivers for the Refining Industry
Market Drivers for the Refining Industry
Markets and demand for refinery products depend on the dynamics of a global economy. It is generally agreed that oil and gas will continue to be the primary energy resource in the U.S. and world economies for decades to come. Because of the projected increase in the production of oil in tight formations, the United States is expected to become an exporter of petroleum products and crude oil after decades of being an importer (Figure 1.2, EIA Annual 2013, eia.gov). Petroleum fuels will continue to dominate the transportation sector, but the following trends should be noted:
- increasing fuel economy of vehicles (offset by increasing number of vehicles and miles driven);
- more strict environmental regulations with demand for cleaner fuels;
- biofuels as additives (e.g., ethanol, biodiesel) or alternative fuels in niche markets (jet fuel from algae);
- demand for high-quality, high-performance fuels
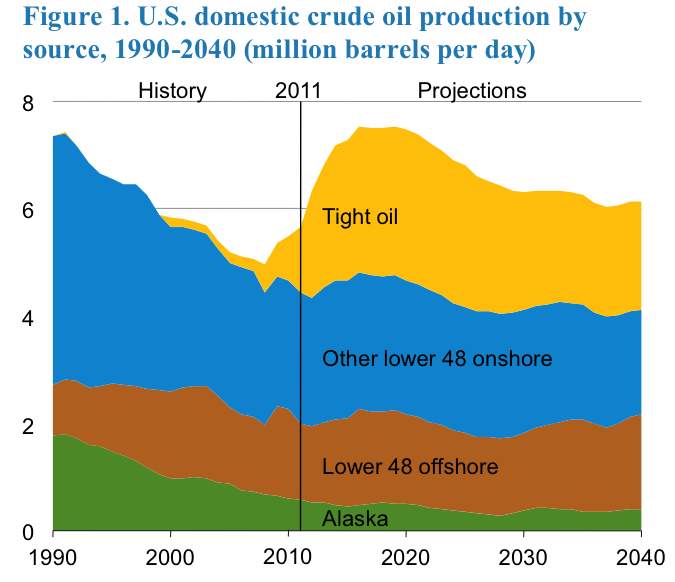
Figure 1.2 is showing both the history of U.S. crude oil production since 1990 as well as the prediction of U.S. crude oil production until the year 2040. Since 1990, we have been seeing a decline in oil production from Alaska, offshore drilling, and lower 48 offshore production until 2010 and then those sources are predicted to level off. After 2010 it is predicted that oil production from tight oil will continue to increase.
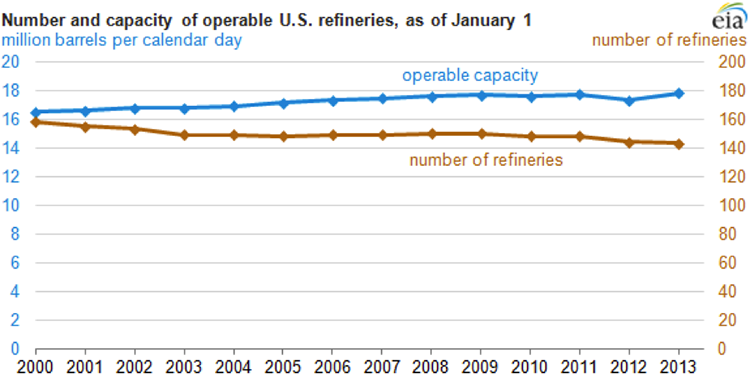
Competitive forces in the global economy lead to joint ventures and mergers and shutting down of inefficient refineries, or shutting down of processing units with low efficiency within refineries. Figure 1.3 shows the changes in the refinery capacity and number of refineries in the U.S. since 2000. The increasing refining capacity, with the decreasing number of refineries, results in the closing down of small inefficient refineries while expanding the large refineries.
Regarding the global competition, the technological advancement addresses the degrading quality of crude oils to produce cleaner and higher quality petroleum fuels. On the supply side, there is the increasing abundance of natural gas liquids (ethane, propane, n-butane, and isobutane) due to increased shale gas production in the U.S. and elsewhere. These liquids enter refineries as new feedstock in addition to crude oil supply.
Refineries need process improvements to advance their capabilities to deal with the changing crude oil base and changing environmental regulations. These improvements in refinery processes would need to create and use, for example:
- new catalysts and new chemistry;
- more sophisticated process modeling and computational methods;
- more effective use of computers in refinery management;
- online monitoring and property measurements;
- new materials to reduce maintenance and extend the useful life of the equipment.
Concerns for efficiency include running a refinery efficiently and producing fuels that will burn efficiently in the combustion engines, as follows:
- Efficiency of refinery processes
- Minimize waste and optimize the yield and properties of the refinery products to obtain maximum value from the crude oil.
- Increase the energy efficiency of each unit in the refinery.
- Fuel economy in internal combustion engines
- Produce high-performance fuels for efficient operation of combustion engines.
An Overview of Refinery Products and Processes
An Overview of Refinery Products and Processes
Considering the market drivers just reviewed along the small profit margins that are often usually associated with petroleum refinery products, refineries should carefully select the crude oil feedstock and configure the refinery processes such that they produce the desirable petroleum products at the lowest cost.
In the U.S. refineries, a principal focus is on the production of gasoline because of high demand. Diesel fuel is the principal refinery product in most other parts of the world. Figure 1.4 shows a typical distribution of products from a barrel of crude oil in a U.S. refinery. Distillation process separates the crude oil into boiling point fractions. The liquefied petroleum gas (LPG) constitutes the lowest boiling point (most volatile) product from a refinery and higher boiling fractions lead to most desirable distillate liquids, such as gasoline, jet fuel, diesel fuel, and fuel oil in the increasing order of boiling points, while asphalt is made from the residual fraction remaining after distillation.
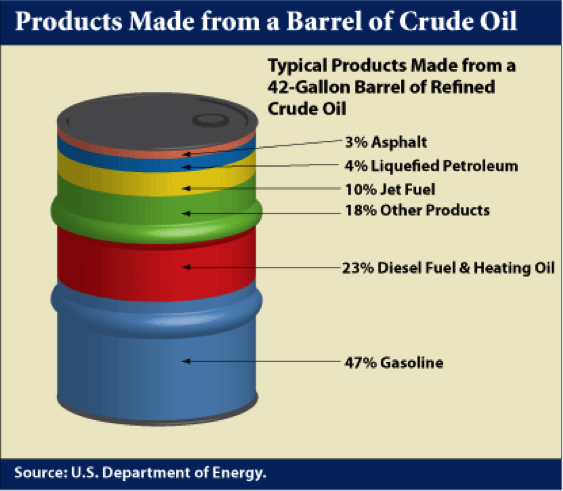
Products Made from a Barrel of Crude Oil
-
47% Gasoline
-
23% Diesel Fuel & Heating Oil
-
18% Other Products
-
10% Jet Fuel
-
4% Liquefied Petroleum
-
3% Asphalt
The following animation shows a refinery flow chart indicating some of the major refinery processes and refinery products. Note that the distillation process (Fractionation Tower) separates crude oil into a number of distillate fractions that are sent as feedstocks to different processes, some of which are interconnected. It is also important to recognize that petroleum refining not only produces transportation fuels and fuels for space heating or industrial furnaces, but also produces materials needed for the operation of the combustion engines and paving the roads for vehicles to travel on.
Video: FSC 432 Refinery Flow Chart (4:12)
Here, we will build a simple refinery flow chart. On the left, you see the crude oil feed to the refinery. On the right hand side, the major refinery products, going from the lightest to the heaviest. Starting with gasoline, jet fuel and kerosene, heating and diesel fuels, industrial fuel oil, waxes, lubricating oils, greases, asphalt, and petroleum coke would be the heaviest product, which will be a solid obtained from a refinery.
The crude oil is fed to the fractionating tower that we call the distillation calm. We separate the crude oil into various boiling fractions. And these fractions are fed to the processes, the downstream, which are vapor recovery unit, also forming alkylation, catalytic cracking, extraction, coking, dewaxing, grease manufacturing, treating and blending, among others and there's additional processing there as well. So, we essentially will connect to crude oil through these processes to the final product.
Now, please note that some of the refinery units are connected. If you look at vapor recovery unit connected to catalytic cracking, that is also connected to coking. And at the top is ultraforming. Now, these processes all produce gasoline and light to hydrocarbons, like LPG, from different bonding fractions of crude oil coming from the distillation columns. That's why they're linked on this diagram.
Let's follow what happens to different distillation fractions coming from the distillation column. First, the vapor product from the top is sent to the vapor recovery unit, and separates into a gasoline and LPG-- that's liquified petroleum gas. You can see the ultraforming we call now, the process of Catalytic Reforming is involved to make a high-octane gasoline.
You can see that additional processing is also needed to remove sulfur out from these products. LPG as well as gasoline. We should note that catalytic cracking can also produce jet fuel. As you can see the arrow from cat cracking touching the jet fuel point. And catalytic cracking also produces feed stocks for the alkylation unit to produce additional high octane gasoline.
As we go down to the distillation column, we are now into the vacuum distillation territory, and the product from vacuum distillation would go through extraction, dewaxing, and various treating and blending to produce lubricating oils as well as waxes and greases.
We are now at the bottom of the vacuum distillation column, the vacuum distillation residue can do various things with this fraction versus coking. It's a very severe thermal cracking process, which leads to petroleum coke as a byproduct. Refineries use coking to produce more jet fuel gasoline and then LPG. Petroleum coke is just a byproduct.
The vacuum distillation residue could be treated in a deasphalting process to produce asphalt. So, again, as a byproduct, the principal product from the deasphalting called the deasphalted oil could be used to making a lighter, hydrocarbons, fuels, and chemicals from this fraction.
And this pretty much completes building off a very simple refinery flow chart.
Figure 1.5 indicates that chemical constitution and physical properties of crude oils are important parameters that guide the refinery configurations. The refining processes can be divided into four groups, as indicated. While the separation processes involve just physical phenomena, the conversion, finishing, and support processes require chemical changes, i.e., breaking chemical bonds to modify the molecular structure of the feedstocks. These changes are necessary to produce the fuels and materials in accordance with industrial/commercial specifications.
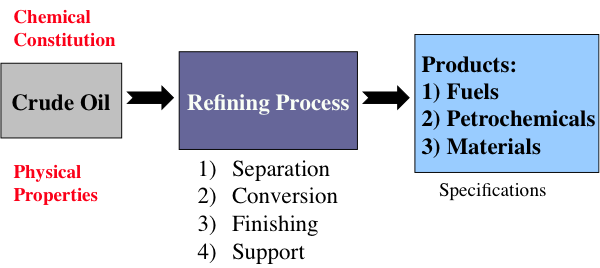
This is a classification of refining processes and the types of refinery products, shown by a flow chart. The flow chart starts with crude oil. Above crude oil chemical constitution is written and below physical properties are written. Crude oil leads to the refining process including separation, conversion, finishing and support. From there it goes to products including fuels, petrochemicals and materials. Underneath this is written specifications.
Figure 1.6 (progressive image, 25 seconds) shows a more detailed refinery block diagram to show how different processes are integrated for producing the desired fuels and materials.
Separation processes, such as distillation, dewaxing, and deasphalting make use of the differences in the physical properties of crude oil components to separate groups of hydrocarbon compounds or inorganic impurities, whereas conversion processes cause chemical changes in the hydrocarbon composition of crude oils. For example, Fluid Catalytic Cracking process breaks chemical bonds in long-chain alkanes to produce shorter chain alkanes to produce gasoline from higher boiling gas oil fractions. Finishing processes involve hydrotreating to remove heteroatoms (S, N, and metals) and product blending to produce fuels and materials with desired specifications and in compliance with environmental and government regulations. Finally, supporting processes provide the recovery of the removed heteroatoms or heteroatom compounds, production of the hydrogen necessary for conversion and hydrotreating processes, and effluent water treatment systems.
Knowledge Check
Why is diesel fuel preferred over gasoline in many countries in the world?
ANSWER: Diesel fuel powers the engines in buses, locomotives, and ships used for public transport. Passenger vehicles fueled by gasoline are the most widely used means of transportation in the U.S.
Chemical Constitution of Crude Oil
Chemical Constitution of Crude Oil
Crude oil contains organic compounds, heteroatom compounds (S,N,O), hydrocarbons (C, H), metals and organic (Ni, V, Fe) and inorganic (Na+, Ca++, Cl-) compounds as listed in Figure 1.7. Compounds that contain only elements of carbon and hydrogen are called hydrocarbons and constitute the largest group of organic compounds found in petroleum. There might be as many as several thousand different hydrocarbon compounds in crude oil. Hydrocarbon compounds have a general formula of CxHy, where x and y are integer numbers.
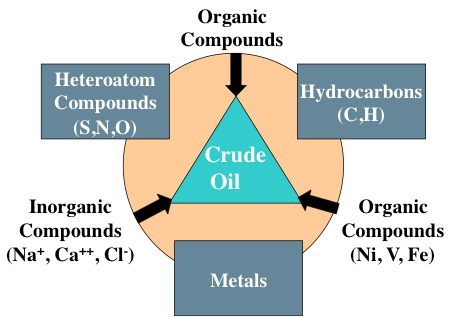
Triangle labeled Crude Oil. On each corner is:
Inorganic Compounds (Na+, Ca2+, Cl-)
Organic Compounds (Ni, V, Fe)
Organic Compounds
On each side they are labeled:
Between organic and inorganic compounds: Heteroatom compounds (S,N,O)
Between organic and Organic (Ni, V, Fe) compounds: Hydrocarbons (C,H)
Between Organic (Ni, V, Fe) and inorganic compounds: Metals
Hydrocarbons are generally divided into four groups: (1) paraffins, (2) olefins, (3) naphthenes, and (4) aromatics (Figure 1.8). Among these groups, paraffins, olefins, and naphthenes are sometimes called aliphatic compounds, as different from aromatic compounds. The lightest hydrocarbon found as a dissolved gas is methane (CH4), the main component of natural gas. Olefins are not usually found in crude oils, but produced in a number of refining processes.
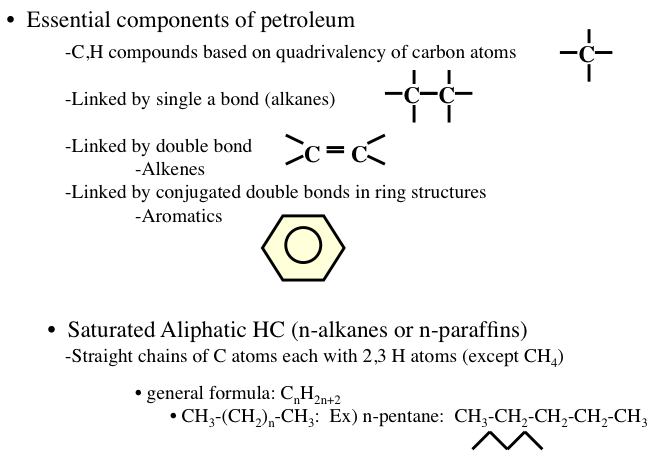
Image reads:
Essential components of petroleum
-CH compounds based on quadrivalency of carbon atoms
-linked by a single bond (alkanes)
-liked by a double bond (alkenes)
-linked by conjugated double bonds in a ring structure (aromatics)
Saturated Aliphatic HC (n-alkanes or n-paraffins)
-straight chains of C atoms each with 2, 3 H atoms (except CH4)
-general formula: CnH2n+2
-CH3-(CH2)n-(CH3): Ex) n-pentane: CH3-CH2-CH2-CH2-CH3
Aromatic Hydrocarbons
Aromatic Hydrocarbons
Aromatic hydrocarbons are an important series of hydrocarbons found in almost every petroleum mixture from any part of the world. Aromatics are cyclic but unsaturated hydrocarbons with alternating double bonds (Figure 1.12). The simplest aromatic hydrocarbon is benzene (C6H6). The name “aromatic” refers to the fact that such hydrocarbons are commonly fragrant compounds. Although benzene has three carbon-carbon double bonds, it has a unique arrangement of electrons with resonance structures of the double bonds (aromaticity) that allow benzene to be relatively stable. However, benzene is known to be a cancer-inducing compound. For this reason, the amount of benzene allowed in petroleum products such as gasoline or fuel oil is limited by government regulations in many countries. Under standard conditions, benzene, toluene, and xylene are in liquid form whereas higher aromatics such as naphthalene occur as solids in isolation, but dissolve to form a liquid solution with simple aromatics.
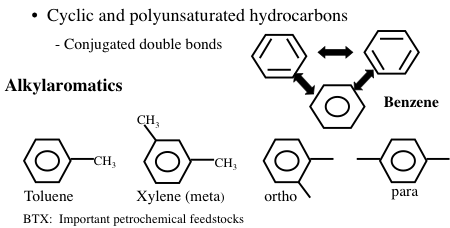
Image Shows Cyclic and polyunsaturated hydrocarbons with conjugated double bonds. Specifically:
Benzene: six carbon ring with no side chains
Alkylaromatics:
-Toluene: benzene with a methyl group on carbon 1
-Xylene (meta): benzene with a methyl group on carbons 1 & 3
-Ortho: benzene with a methyl group on carbon 1&2
-Para: benzene with a methyl group on carbon 1&4
Knowledge Check
What constitutes the white crystals of moth balls?
ANSWER: Napthalene! Naphthalene is an effective moth killer because it sublimes (forms a vapor from a solid without going through a liquid state) at room temperature.
Polyaromatic and Hydroaromatic Compounds
Polyaromatic and Hydroaromatic Compounds
Some of the common aromatics found in crude oil and petroleum products are benzene derivatives with attached methyl, ethyl, propyl, or higher alkyl groups. This series of aromatics is called alkylbenzenes, and compounds in this homologous group of hydrocarbons have the general formula of CnH2n-6 (where n ≥ 6). Generally, an aromatic series with only one benzene ring is also called mono- aromatics or mononuclear aromatics. However, heavy petroleum fractions and residues contain unsaturated multirings with many benzene and naphthene rings attached to each other. Such aromatics that exist as solids in isolation are also called polyaromatic hydrocarbons (PAHs) or polynuclear aromatics (PNAs) (Figure 1.13). Heavy crude oils usually contain more aromatics than light crudes. It is common to have compounds with naphthenic and aromatic rings side by side (hydroaromatics, or naphthenoaromatics, Figure 1.13) especially in heavy fractions.
Figure 1.13 shows examples of PAHs, such as anthracene, phenathrene, and pyrene. The configuration of rings in PAHs strongly influences the physical and chemical properties of these compounds. For example, three-ring aromatics anthracene and phenanthrene have significantly different properties. In petroleum, PAHs exist mostly as alkyl substituted ring systems such that the substitutent alkyl groups (e.g., methyl, ethyl) replace (substitute for) the hydrogen atoms on the rings.

Image Reads:
Polyaromatic Hydrocarbons (PAH) or Polynuclear Aromatics (PNA)
Aromatic hydrocarbons containing more than one ring:
-Ex) Naphthalene, Anthracene, Phenanthrene, Pyrene
-Associated with environmental and health problems – toxic compounds
-deactivate catalysts via coking reactions
Hydroaromatics of naphtenoaromatics
-partially saturated PAH; e.g. tetralin (tetrahydronapthalene) – strong H donors
Normally, high-molecular-weight polyaromatics contain several heteroatoms such as sulfur, nitrogen, or oxygen, but these compounds are still called aromatic compounds because their electronic configurations maintain the aromatic character.
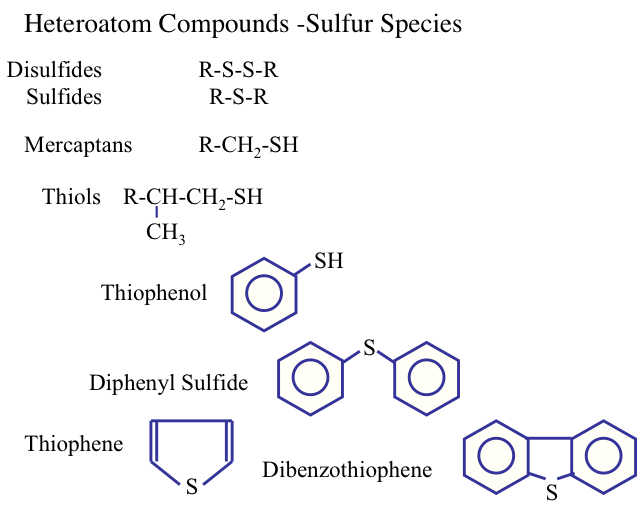
Sulfur is the most important heteroatom found in crude oil and refinery products petroleum, and it can be found in cyclic (e.g., thiophenes) and noncyclic compounds such as mercaptans (R-S-H) and sulfides (R-S- R′), where R and R′ are alkyl groups. Sulfur in natural gas is usually found in the form of hydrogen sulfide (H2S). Figure 1.14 shows the types of sulfur compounds in crude oils. The amount of sulfur in a crude oil may vary from 0.05 to 6 % by weight. The presence of sulfur in finished petroleum products is not desirable. For example, the presence of sulfur in gasoline can promote corrosion of engine parts and produce sulfur oxides upon combustion, contributing to air pollution.
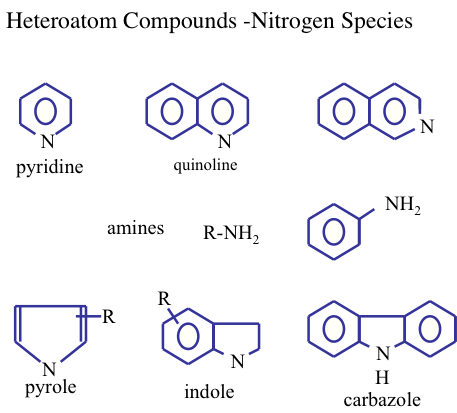
Normally, the concentration of the other heteroatom compounds (nitrogen, oxygen, and metals) in crude oils is usually lower than that of the sulfur compounds. Figure 1.15 shows the nitrogen compounds that may be found in crude oils.
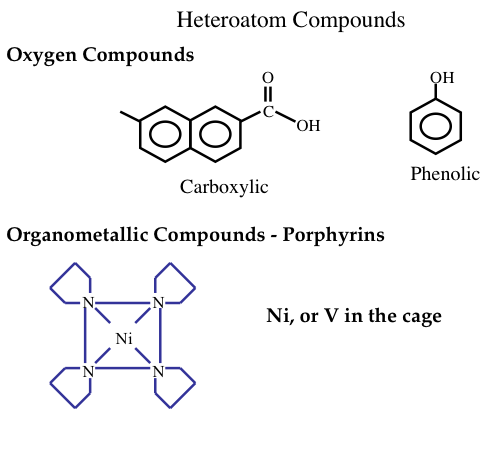
Generally, in heavier crude oils the proportions of carbon, sulfur, nitrogen, and oxygen compounds are higher at the expense of hydrogen content. Heavier crude oils also contain organometallic compounds of common nickel and vanadium (Figure 1.16). These compounds are highly corrosive and toxic and should be removed in the refinery. Nickel, vanadium, and copper can also severely affect the activities of catalysts and result in lower quality products. Organometallic compounds tend to concentrate in heavy, or residual fractions of crude oils.
Knowledge Check
What is the principal type of air pollution caused by the emission of sulfur oxides into the atmosphere?
ANSWER: Acid rain, caused by the formation of sulfuric acid through reactions of the sulfur oxides in the atmosphere.
Paraffins
Paraffins
Paraffins are also called alkanes and have the general formula of CnH2n+2, where n is the number of carbon atoms in a given molecule. Paraffins are divided into two groups of normal and isoparaffins. Normal paraffins or normal alkanes are simply written as n-paraffins or n-alkanes, and they are open, straight-chain saturated hydrocarbons. The second group of paraffins is called isoparaffins, which are branched-type hydrocarbons, and they begin with isobutane (also called methylpropane), which has the same closed formula as n-butane (C4H10). Compounds of different structures with the same closed formula are called isomers (Figure 1.9). For example, the open formula for n-butane, n-C4, can be shown as CH3-CH2-CH2-CH3, based on the quadrivalency of the carbon atom, and for simplicity, only the carbon-carbon bonds are drawn and most C-H bonds are omitted, as shown in Figure 1.7 and 1.8 on the previous page. Paraffins are the largest series of hydrocarbons found in petroleum and beginning with the simplest compound, methane.
Under standard conditions of temperature and pressure (STP), the first four members of the alkane series (methane, ethane, propane, and butane) are in gaseous form, and compounds starting from C5H12 (pentane) to n-heptadecane (C17H36) are liquids (constituting large fractions of hydrocarbons found in liquid fuels (e.g., gasoline, jet fuel, and diesel fuel), whereas n-octadecane (C18H38) or heavier compounds exist in isolation as wax-like solids at STP. These heavier paraffins are soluble in lighter paraffins or other hydrocarbons and can be found in diesel fuel and fuel oils. Paraffins from C1 to C40 usually appear in crude oil (heavier alkanes in liquid solution, not as solid particles) and represent up to 20% of crude by volume.
Figure 1.10 shows the statistically possible number of isomers of paraffins that increase exponentially with carbon number, starting with just one isomer for butane, reaching approximately 60,000 for C18 paraffins. Note that the branching in hydrocarbons causes significant changes in physical properties (e.g., boiling point and density, Figure 1.11) and chemical behavior (e.g., octane number, Figure 1.10) of paraffins with the same carbon number. Note in Figure 1.10 that the removal of an H atom from alkanes generates free radicals (reactive species containing unpaired electrons) that are called alkyl species (e.g., methyl formed from methane and ethyl formed from ethane by removing a hydrogen atom) also a radical with an unpaired electron. Also note the nomenclature using alkyl groups to specifically name isoalkanes (e.g., 2,2,4-trimethylpentane to designate a specific iso-octane).
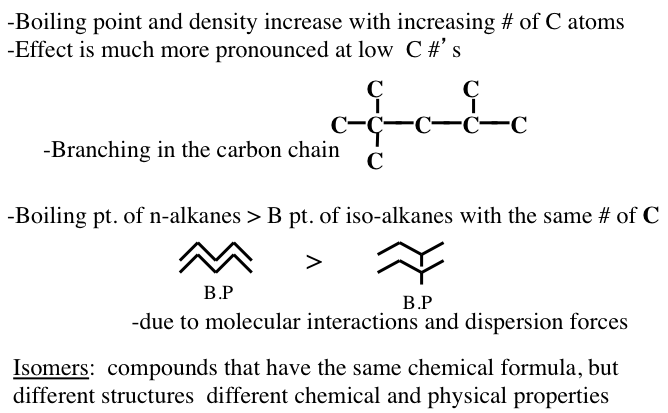
Image Reads:
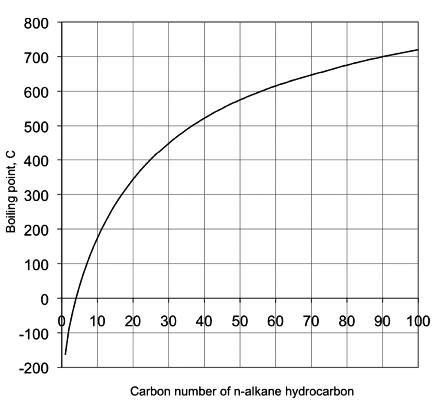
Boiling point and density increase with increasing # of carbon atoms
Effect is much more pronounced at low carbon #’s
Boiling point of n-alkanes is greater than the boiling point of iso-alkanes with the same # of carbons
-Due to molecular interactions and dispersion forces
Isomers: compounds that have the same chemical formula but different structures and different chemical and physical properties
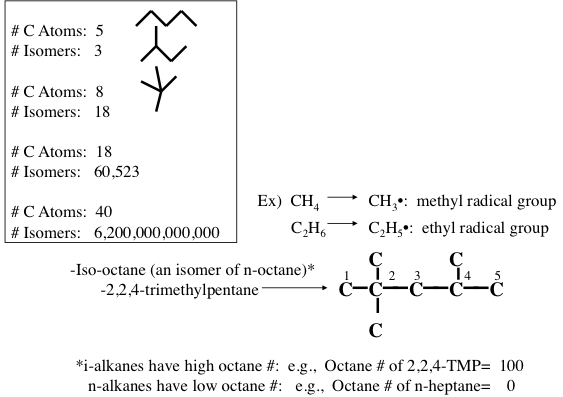
Image Reads
| # of Carbons | # of Isomers |
|---|---|
| 5 | 3 |
| 8 | 18 |
| 18 | 60,523 |
| 40 | 6.2x10¹² |
Iso-octane (an isomer of n-octane): 2,2,4-trimethylpentane
-i-alkanes have high octane #’s: e.g. Octane # of 2,2,4-TMP = 100
-n alkanes have low octane #’s: e.g. Octane # of n-heptane = 0
Naphthenes or cycloalkanes are rings or cyclic saturated hydrocarbons with a general formula of CnH2n5H10), cyclohexane (C6H12), and their derivatives such as n-alkylcyclopentanes are normally found in crude oils.
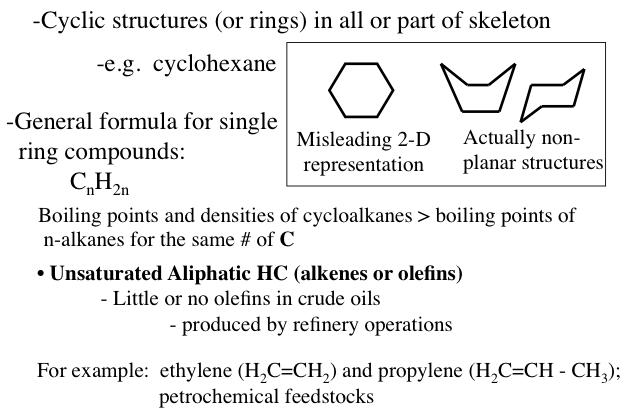
Image Reads:
Cyclic structures (or rings) in all or part of the skeleton.
-e.g cyclohexane
The general formula for single ring compounds: CnH2n
-Boiling points and densities of cycloalkanes are greater than the boiling points on n-alkanes with the same # of carbons
-For example: ethylene (H2C=CH2) and propylene (H2C=CH-CH3); petrochemical feedstocks
Unsaturated Aliphatic HC (alkenes or olefins)
-little or no olefins in crude oils (produced by refinery operations)
A hexagon is a misleading 2-D representation of cyclohexane the actual structure looks more like a boat or a chair
Assignments
Assignment Reminder
Each week, you will be required to do assignments. The assignment for this week is:
For your information (no submission), review the most recent supply of petroleum fuels from the data given at U.S. Energy Information Administration [4] and research how petroleum refining addresses the environmental concerns from the combustion of petroleum fuels in internal combustion engines.
Self-Check Questions
Self-Check Questions
Take a few minutes to answer the five questions below. Use the arrow to go to the next question. When you are ready, click Check to see the solution.
Summary and Final Tasks
Summary
Petroleum, the most important crude oil, consists of a mixture of hydrocarbon compounds including paraffinic, naphthenic, and aromatic hydrocarbons with small amounts of impurities including sulfur, nitrogen, oxygen, and metals. The first process in petroleum refining operations is the separation of crude oil into its major constituents, using distillation to separate the crude oil constituents into common boiling-point fractions. Other separation processes include deasphalting to remove the heaviest fraction of crude oil, asphalt, and dewaxing to remove long-chain n-paraffins called wax.
To meet the demands for high-octane gasoline, jet fuel, and diesel fuel, heavier components of crude oils are converted to gasolines and other distillate fuels. Among the conversion processes are cracking, coking, and visbreaking that are used to break large petroleum molecules into smaller ones. Polymerization and alkylation processes are used to combine molecules smaller than those in gasoline into larger ones to make more gasoline in the refinery. Isomerization and reforming processes are applied to rearrange and reform the structure of hydrocarbons to produce higher-value gasoline components of a similar molecular size.
Finishing processes in a refinery processes stabilize and upgrade petroleum products by hydrogenation and remove undesirable elements, such as sulfur and nitrogen, by hydrotreating processes. Blending of many product streams, to come up with commercial refinery products with the required specifications, also belong to the category of finishing processes.
Lesson Objectives
You should now be able to:
- recognize the significance of petroleum fuels in the U.S. energy supply;
- express the overall objectives of petroleum refining;
- identify the economic and environmental drivers of petroleum refining;
- describe the overall approach to petroleum refining and categorize refinery processes and products;
- portray chemical constitution of petroleum.
Reminder - Complete all of the Lesson 1 tasks!
You have reached the end of Lesson 1! Double-check the to-do list below to make sure you have completed all of the activities listed there before you begin Lesson 2. Please refer to the Course Syllabus for specific time frames and due dates. Specific directions for the assignment below can be found within this lesson.
| Readings | J. H. Gary, G. E. Handwerk, Mark J. Kaiser, Chapter 1, pp. 1-12; Chapter 3, pp. 62-65 |
|---|---|
| Assignments | For your information, review the most recent supply of petroleum fuels from the data given at The U.S. Energy Information Administration website [3] (eia.gov) and research how petroleum refining addresses the environmental concerns from combustion of petroleum fuels in internal combustion engines. |
Questions?
If you have any questions, please post them to our Help Discussion (not email), located in Canvas. I will check that discussion forum daily to respond. While you are there, feel free to post your own responses if you, too, are able to help out a classmate.
Lesson 2: Properties and Classification of Crude Oil
Lesson 2 Overview
Lesson 2 Overview
Video: FSC 432 Lesson 2 (2:27)
In lesson two, we will talk about the properties and classifications of crude oil. Because of the extreme complexity of crude oil, it is impossible to get the molecular analysis, or the molecular composition. Because of this reason, people, even in the very early days of refinery, they developed some techniques to use easily measurable physical properties, such as density or viscosity, to make inferences about the molecular composition of crude oils.
This information is very important for refiners to adjust operating conditions in many units that are all integrated in the whole refinery. So to get these properties is really critical. And that can be easily measured in the laboratory.
What is important and fascinating to see that some classification parameters or characterization factors use these easily measurable properties to make inferences on the chemical constitution, chemical composition, of the oil. From physical properties to chemical composition.
You know that crude oil contains, essentially, hydrocarbons that are paraffinic or naphthenic and aromatic. So, using these characterization factors could classify the crude oils into these three subcategories. But beyond that, if you do have information on the hydrocarbon composition, you could use a more sophisticated classification system to divide crude oils into six classes.
Again, these are very important in terms of informing the refiners what to expect from this crude oil, how they can adjust the operating parameters so that they can produce the products that they would like and the properties of these products, the quality of the products-- to make these adjustments, to reach these refinery goals and objectives, in general. So see you in class after this.
Overview
Physical properties and composition of crude oil provide critical information for the optimum operation of a petroleum refinery. This information does not only help predict the physical behavior of crude oil in refinery units, but also gives insight into its chemical composition. Therefore, the physical properties can be related to chemical properties of crude oil and its fractions and the characteristics of the resulting refinery products. The most important properties of crude include density, viscosity, boiling point distribution, pour point, and the concentration of various contaminants.
Learning Outcomes
By the end of this lesson, you should be able to:
- define the significant properties of crude oil, including density, viscosity, average boiling point, sulfur, and salt content;
- understand the significance of crude oil properties in terms of refinery objectives, and describe crude oil assay;
- define and interpret the classification factors (Watson, UOP, VGC, and BMCI) as they relate to the hydrocarbon composition of crude oils;
- calculate average boiling points for crude oils using different averaging techniques and differentiate Watson and UOP characterization factors;
- analyze the elemental composition of crude oils and outline ternary classification of crude oils with respect to hydrocarbon composition, i.e., aromatics, paraffins, and naphthenes;
- assess the use of ternary classification of crude oils to estimate the refinery product yields.
What is due for Lesson 2?
This lesson will take us one week to complete. Please refer to the Course Syllabus for specific time frames and due dates. Specific directions for the assignments below can be found on the Assignments page within the Lesson.
| Readings | J. H. Gary, G. E. Handwerk, Mark J. Kaiser, Chapter 3, pp. 57-61, 65-70 and the course material from this site |
|---|---|
| Assignments | Exercise 1 - Submit to the Exercise 1 Assignment in the Lesson 2 Module.
|
Questions?
If you have any questions, please post them to our Help Discussion (not email), located in Canvas. I will check that discussion forum daily to respond. While you are there, feel free to post your own responses if you, too, are able to help out a classmate.
API Gravity
API Gravity
Density is defined as mass per unit volume of a fluid. The density of crude oil and liquid hydrocarbons is usually reported in terms of specific gravity (SG) or relative density, defined as the density of the liquid material at 60°F (15.6°C) divided by the density of liquid water at 60°F. At a reference temperature of 15.6°C, the density of liquid water is 0.999 g/cm3 (999 kg/m3), which is equivalent to 8.337 lb/gal (U.S.). Therefore, for a hydrocarbon or a petroleum fraction, the SG is defined as:
In the early years of the petroleum industry, the American Petroleum Institute (API) adopted the API gravity (°API) as a measure of the crude oil density. The API gravity is calculated from the following equation:
The API scale for gravity was adapted from the Baumé scale, developed in the late 18th century to be used in hydrometers for measuring even small differences in the specific gravity of liquids, using water as a reference material in these devices. A liquid with SG of 1 (i.e., water) has an API gravity of 10. One can note from Eq. 1 that liquid hydrocarbons with lower SGs have higher API gravities. The API of crude oils varies typically between 10 and 50, with most crude oils falling in the range of 20-45. Using API gravity, the conventional crude oils can be generally considered as light (°API>30), medium (30>°API>22), and heavy (°API<22).
Note that the relationship between °API and specific gravity is not linear. Therefore, the °API gravity of crude blends cannot be calculated by linear averaging of the component °APIs. Specific gravities of the components can be averaged, though, to determine the specific gravity of the resulting blend. In practice, averaging °APIs is usually accepted because the error involved in averaging is small.
Among the hydrocarbons, aromatic hydrocarbons have higher SG (lower °API) than paraffinic hydrocarbons with the same number of carbon atoms. For example, benzene has an SG of 0.883 (°API of 28.7), whereas n-hexane has an SG of 0.665 (°API of 81.3). Therefore, the heavy (high-density) crude oils tend to have high concentrations of aromatic hydrocarbons, whereas the light (low-density) crude oils have high concentrations of paraffinic hydrocarbons.
Viscosity
Viscosity
Viscosity, commonly depicted by the symbol μ, is a physical property of a fluid that describes its tendency/resistance to flow. A high-viscosity fluid has a low tendency to flow, whereas low-viscosity fluids flow easily. Newton’s Law of Viscosity provides a physical definition of viscosity. Power requirement to transport (e.g., to pump) a fluid depends strongly on the fluid’s viscosity. Interestingly, the viscosity of liquid decreases with increasing temperature, while viscosity of gases increases with increasing temperature. Among petroleum products, viscosity constitutes a critically important characteristic of lubricating engine oils. Viscosity of liquids is usually measured in terms of kinematic viscosity, which is defined as the ratio of absolute (dynamic) viscosity to absolute density (ν = μ/ρ). Kinematic viscosity is expressed in units of centistokes (cSt), Saybolt Universal seconds (SUS), and Saybolt Furol seconds (SFS). Values of kinematic viscosity for pure liquid hydrocarbons are usually measured and reported at two reference temperatures, 38°C (100°F) and 99°C (210°F) in cSt. However, different reference temperatures, such as 40°C (104 °F), 50 °C (122 °F), and 60 °C(140 °F), are also used to report kinematic viscosities of petroleum fractions. The viscosity of crude oils can be measured using a standard method (ASTM D2983).
Knowledge Check
What are ASTM, ISO, IP?
ANSWER:
There are several international organizations that are known as standard organizations, and they recommend standard measuring techniques for petroleum products. These organizations include [2 in mnl]
-ASTM - American Society for Testing and Materials (http://www.astm.org(link is external) [6] ASTM includes several committees depending on the materials; D committee is responsible for petroleum products and for this reason its test methods for petroleum materials are designated by the prefix D.
- ISO - International Organization for Standardization (http://www.iso.org [7])
- Energy Institute (formerly IP) (http://uk.ihs.com/collections/ [8])
- API - American Petroleum Institute) (http://www.api.org [9])
- AFNOR - Association Francaise de Normalisation (http://www.afnor.org [10])
Pour Point
Pour Point
The pour point of a crude oil, or a petroleum fraction, is the lowest temperature at which the oil will pour or flow when it is cooled, without stirring, under standard cooling conditions. Pour point represents the lowest temperature at which oil is capable of flowing under gravity. It is one of the important low-temperature characteristics of high-boiling fractions. When the temperature is less than the pour point of a petroleum product, it cannot be stored or transferred through a pipeline. Standard test procedures for measuring pour points of crude oil or petroleum fractions are described in the ASTM D97 (ISO 3016 or IP 15) and ASTM D5985 methods. The pour point of crude oils relates to their paraffin content: the higher the paraffin content, the higher the pour point.
Knowledge Check
What are Waxes?
ANSWER: Waxes are microcrystalline solids at ambient temperatures that consist, typically, of normal alkanes with carbon number between 20 and 40. Therefore, knowledge of the pour point and freezing point of crude oils is also important.
Concentration of Various Contaminants
Concentration of Various Contaminants
In addition to hydrocarbons, crude oil contains hetroatom (S, N, metals) species that need to be removed if their concentrations are higher than the specified thresholds. Other impurities in crude oil include salt and sediment and water. The acidity of crude oil is also important, particularly for concerns of corrosion in pipes or other process units. Carbon residue of a crude oil indicates the tendency to generate coke on heter tubes or rector surfaces. All of these contaminants and properties of crude oils are measured using standard methods, as described in this section.
Sulfur and Nitrogen Content
Sulfur and Nitrogen Content
Sulfur Content
Sulfur content of crude oils is the second most important property of crude oils, next to API gravity. Sulfur content is expressed as weight percent of sulfur in oil and typically varies in the range from 0.1 to 5.0%wt. The standard methods that are used to measure the sulfur content are ASTM D129, D1552, and D2622, depending on the sulfur level. Crude oils with more than 0.5%wt sulfur need to be treated extensively during petroleum refining. Using the sulfur content, crude oils can be classified as sweet (<0.5%wt S) and sour (>0.5% %wt S). The distillation process segregates sulfur species in higher concentrations into the higher-boiling fractions and distillation residua. Removing sulfur from petroleum products is one of the most important processes in a refinery to produce fuels compliant with environmental regulations.
Nitrogen Content
Nitrogen content of crude oils is also expressed as weight percent of oil. Basic nitrogen compounds are particularly undesirable in crude oil fractions, as they deactivate the acidic sites on catalysts used in conversion processes. Some nitrogen compounds are also corrosive. Crude oils with nitrogen contents greater than 0.25%wt need treatment in refineries for nitrogen removal.
Metals Content and Total Acid Number
Metals Content and Total Acid Number
Metals Content
Most common metals that are found in crude oil are included in organometallic compounds like nickel, vanadium iron and copper, ranging in concentration from a few ppm up to 1000 ppm by weight, depending on the source of crude oil. Similar to sulfur species, the metallic compounds tend to concentrate in the higher-boiling fraction of crude oil. Higher metal contents also require treatment during petroleum refining because of the corrosion activity of some metals and their tendency to accumulate on catalyst surfaces, thus deactivating the catalysts in a number of refinery processes. Metal content can be measured using a standard EPA Method 3040.
Total Acid Number
Acidity of crude oil is measured by titration with potassium hydroxide (KOH), using the standard method ASTM D664. The measured acidity is expressed as the Total Acid Number (TAN) that is equivalent to milligrams of KOH required to neutralize 1 gram of oil. This number is particularly important to control corrosion in the distillation columns through selection of corrosion-resistant alloys for surfaces that come into contact with oil.
Carbon Residue, Basic Sediment and Water, and Salt Content
Carbon Residue, Basic Sediment and Water, and Salt Content
Carbon Residue
Carbon residue (as % wt of crude oil, or crude oil fraction) is determined as the weight of solid residue remaining after heating crude oil to coking temperatures (700-800°C). Two standard tests with slightly different procedures are used to measure carbon residue: ASTM D524 Ramsbottom Carbon Residue (RCR) and ASTM D189 Conradson Carbon Residue (CCR). Carbon residue relates to asphalt (or asphaltenes) content of oil and indicates the tendency of fouling in heater tubes and catalyst deactivation. The higher the carbon residue, the higher is the coking (fouling) propensity of crude oil.
Basic Sediment and Water (BS&W)
The standard method ASTM D4007 is used to measure the amount of suspended inorganic solid particles and water (BS&W) in crude oils. These contaminants are mixed with the oil during production, and high concentration of BS&W causes operational problems in a refinery.
Salt Content
Salt content of crude oils can be measured using the standard method ASTM D3230 and reported as lb NaCl/1000 bbl. Desalting (removing the salt) is necessary when NaCl content is greater than 10 lbs/1000 bbl. Such high salt contents lead to corrosion in distillation towers and other equipment.
Distillation and Boiling Points
Distillation and Boiling Points
The boiling point of a pure compound in the liquid state is defined as the temperature at which the vapor pressure of the compound equals the atmospheric pressure or 1 atm. The boiling point of pure hydrocarbons depends on carbon number, molecular size, and the type of hydrocarbons (aliphatic, naphthenic, or aromatic) as discussed in Lesson 1. Figure 2.1 shows the boiling points of n-alkanes as a function of carbon number.
Complex mixtures such as crude oil, or petroleum products with thousands of different compounds, boil over a temperature range as opposed to having a single point for a pure compound. The boiling range covers a temperature interval from the initial boiling point (IBP), defined as the temperature at which the first drop of distillation product is obtained, to a final boiling point, or endpoint (EP) when the highest-boiling compounds evaporate. The boiling range for crude oil may exceed 1000 °F.
The ASTM D86 and D1160 standards describe a simple distillation method for measuring the boiling point distribution of crude oil and petroleum products. Using ASTM, D86 boiling points are measured at 10, 30, 50, 70, and 90 vol% distilled. The points are also frequently reported at 0%, 5%, and 95% distilled. ASTM D1160 is carried out at reduced pressure to distill the high-boiling components of crude oil. As an alternative method, distillation data can be obtained by gas chromatography (GC), in which boiling points are reported versus the weight percent of the sample vaporized. This test method described in ASTM D2887 is called simulated distillation (SimDis).
Average Boiling Points
Average Boiling Points
Average boiling points are useful in predicting physical properties and for characterization of complex hydrocarbon mixtures. The key here is to represent a mixture of compounds with a range of boiling points by a single characteristic boiling point. Since this is a formidable task, there are five different “average boiling points” that are used in different correlations. They are:
1, 2, and 3 can be defined for a mixture of n components as:
where ABP is is expressed as VABP, MABP, or WABP and xi is the corresponding volume, mole, or weight fraction of component i, and Tbi is the normal boiling point of component i. Cubic average boiling point (CABP) and Mean Average Boling Points (MeABP) can be calculated as follows.
For petroleum streams, volume, weight, or mole fractions of the components are not usually known. In this case, VABP is calculated from standard distillation (ASTM D86 Method) data, and empirical relationships (charts, or equations) are used to calculate the other average boiling points.
Here is the procedure:
Equation 1 (Ts are ASTM D86 temperatures for 10, 30, 50, 70, and 90% volume distilled, respectively):
Along with VABP, the slope of the ASTM D86, SL, is used for converting VABP to other average boiling points.
Equation 2:
The following empirical equations can, then, be used to obtain the temperature difference (ΔT) between VABP and other average boiling points (ABP) [2] :
Equation 3:
Equation 4:
Equation 5:
Equation 6:
and
Equation 7:
The temperature unit used for VABP, SL, and ΔT in these correlations is Kelvin.
The following script can be used to calculate VABP, MeABP by entering the distillation temperatures in the table.
You may also use the charts in Figure 4.1a and Figure 4.1b (p. 39) of your textbook [3] to obtain MeABP and MABP, respectively, from VABP. Note that the slope of the distillation curve used in those charts refers to True Boiling Point (TBP) distillation (not to ASTM distillation), and it is calculated as (T70% -T10%)/60.
[3] Petroleum Refining, by J. H. Gary, G. E. Handwerk, M. J. Kaiser, 5th Edition, CRC Press NY, 2007, Chapter 4, p.39.
Crude Assay
Crude Assay
Crude oil assay consists of a compilation of data on properties and composition of crude oils. The assay provides critical information on the suitability of crude oil for a particular refinery and estimating the desired product yields and quality. It also indicates how extensively a given crude oil should be treated in a refinery to produce fuels that are in compliance with environmental regulations. A typical crude assay should include the following major specifications:
- API Gravity
- Total Sulfur (% wt)
- Pour Point (°C)
- Viscosity @ 20°C (cSt)
- Viscosity @ 40°C (cSt)
- Nickel (ppm)
- Vanadium (ppm)
- Total Nitrogen (ppm)
- Total Acid Number (mgKOH/g)
- Distillation Data
- Characterization factor KUOP, KW
Characterization Factors
Characterization Factors
Since the early days of the petroleum industry, some physical properties of crude oil were used to define characterization factors for classification of crude oil with respect to hydrocarbon types [4] as shown in Equation 8.
where: Tb = volume, or mean average normal boiling point in R (degree Rankine) and SG = specific gravity at 15.6°C (60°F). To calculate KUOP or KW, volume average boiling point (VABP) or mean average boiling point is used, respectively. Depending on the value of the Watson characterization factor, crude oils are classified as paraffinic (Kw = 11-12.9), naphthenic (Kw =10-11), or aromatic (Kw <10).

UOP or Watson Characterization Factor
SG: Specific Gravity at 15ºC (60ºF)
Tb: average boiling point (ºR)
KUOP, or Watson = (Tb)1/3/SG15ºC(60ºF)
KUOP uses Volume Average Boiling Point (VAPB)
TVABP = (T10% + T30% + T50% + T70% + T90%)/5
Tv% = ASTM Distillation T at 10%, 30%, 50%, 70% and 90% distilled Volume
KWatson uses Mean Average Boiling Point (MeAPB)
Another parameter defined in the early years of petroleum characterization is the viscosity gravity constant (VGC). This parameter depends on viscosity expressed in Saybolt Universal Seconds (SUS) and specific gravity. According to a standard method (ASTM D2501), VGC can be calculated at a reference temperature of 100°F as follows in Equation 9:
where V(100°F) is the viscosity in SUS and SG is the specific gravity at 15.6°C (60°F). VGC varies between 0.74 to 0.75 for paraffinic, 0.89 and 0,94 for naphthenic, and 0.95 and 1.13 for aromatic hydrocarbons.
The U.S. Bureau of Mines Correlation Index (BMCI) or (CI) is useful for characterization of crude oil fractions. CI is defined in terms of Mean Average Boiling Point (Tb) and specific gravity (SG) at 60°F as shown in Equation 10:
According to this CI scale, all n-paraffins have a CI value of 0, while cyclohexane (the simplest naphthene), has a CI value of 50, and benzene has a CI value of 100. Using the CI values, crude oils can be classified as follows:
| paraffinic | CI<29.8 |
|---|---|
| naphthenic | CI<57.0 |
| aromatic | CI>75.0 |
[4] K. M. Watson, E. F. Nelson , George B. Murphy, “Characterization of Petroleum Fractions,” Ind. Eng. Chem., 1935, 27 (12), pp 1460–1464
Elemental Analysis and Ternary Classification of Crude Oils
Elemental Analysis and Ternary Classification of Crude Oils
Despite a wide variety of crude oil found in different parts of the earth, the elemental composition of most crude oils changes in narrow ranges, as shown in Table 2.2.
| Element | % Wt |
|---|---|
| C | 84-86% |
| H | 11-14% |
| S | 0-6% |
| N | 0-1% |
| O | 0-2% |
With such narrow ranges of change in elemental contents, elemental composition does not have much utility for classification of crude oil. Instead, variations in hydrocarbon composition (paraffins, naphthenes, and aromatics) are used to classify crude oils, using a ternary diagram, shown in Figure 2.2. Each apex of the triangle represents 100 percent weight of the corresponding compounds, and 0% of this particular type of hydrocarbons on the side of the triangle across from the apex. For example, the side at the bottom of the triangle (across from the apex of 100% aromatics) represents binary mixtures of paraffins and naphthenes.
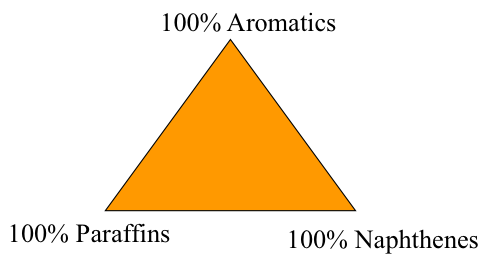
If you need to refresh your memory on reading ternary diagrams, you may check "Reading a Ternary Diagram [11]", or consult other sources. The list below shows the six classes of crude oil that are defined using a ternary diagram. These classes are shown as areas on the ternary diagram for paraffins, below. It is generally accepted that Class 1 (rich in paraffins) represents the most desirable type of crude oil because refining these crudes would readily lead to high yields of light and middle distillates that constitute the fuels such as gasoline, diesel fuel, and jet fuel which are in high demand. Extensive refining would be required to produce high yields of distillate fuels from aromatic crudes (e.g., Class 4-6). Class 1 crudes tend to have high °API and low sulfur contents and tend to be more expensive than the other types of crude oils.
Ternary Classification of Crude Oils
- Paraffinic Crudes
paraffins + naphthenes > 50%
paraffins > naphthenes
paraffins > 40% - Naphthenic Crudes
paraffins +naphthenes > 50%
naphthenes > paraffins
naphthenes > 40% - Paraffinic-Naphthenic Crudes
Aromatics < 50%
paraffins < 40%
naphthenes < 40% - Aromatic-Naphthenic Crudes
Aromatics > 50%
naphthenes > 25%
paraffins < 10% - Aromatic-Intermediate Crudes
Aromatic > 50%
paraffins > 10% - Aromatic-Asphaltic Crudes
Naphthenes < 25%
paraffins < 10%
Video: Lesson 2 Paraffins (2:47)
Ternary diagrams could be very useful tools for classifying crude oils. Here you see a ternary diagram, a triangle in essence. On the corners of the triangles, we can see pure hydrocarbons. At the top, where you see 100% aromatics, that is just one point at the top represents pure aromatic compounds.
On the left-hand side at the bottom, 100% paraffins point on the corner, and on the right, 100% naphthenes. The lines that connect these points represent binary mixtures. For example, if you connect aromatics corner with the paraffins on that line, you will only have aromatics and paraffins.
As an example, let us define the region in this ternary diagram for the group 1 or classification 1 crude oils that are paraffin liquid oils. You see the horizontal line with an arrow pointing downward. So below that line, the contents of paraffins and naphthenes is greater than 50%. Above that line, obviously, aromatics are greater than 50%.
Now, establish the second boundary line for the group 1 crude oils. That is paraffinic crude oils. You see the vertical line right in the middle of the triangle separating the triangle into two areas. To the left of that vertical line, we will have paraffins contents greater than naphthenes everywhere to the left of this point.
So with these two boundary lines then, one horizontal, one vertical, we have established a region where the contents of paraffins and naphthenes are greater than 50%, and paraffin contents are greater than naphthenes.
To establish the region for the type 1 crude oils, we need the third boundary line. So you see here the line that is designating paraffin contents greater than 40%. So to the left of that line in the triangle, the paraffin contents is greater than 40%. So all these three lines then designate the group 1 or type 1 crude oil or region in the ternary diagram that is the paraffinic crude oils region.
Video: Lesson 2 Aromatics (2:34)
Let us continue with demonstration of using ternary diagrams for crude classification. This time, we will place the type 4 aromatic-naphthenic crudes on the ternary diagram. You'll see the boundaries for this type of crude. That is, aromatics greater than 50%, naphthenes greater than 25%, paraffins less than 10% in type 4 crude oils.
See the horizontal line right in the middle of the triangle, which designates the first boundary? That's aromatics greater than 50%. So above that line, in the orange region in the triangle, the aromatic content is greater than 50%. That is the first boundary.
The second boundary line defines an area where naphthenes are greater than 25%. You see the line on the triangle to the right of that line? [? Everywhere ?] is naphthenes greater than 25%. With these two boundary lines now, aromatics greater than 50% and naphthenes greater than 25%, we are confined to that little triangle, the orange triangle in the ternary diagram.
Now we need to place the third boundary line. The third boundary line for this type is paraffins less than 10%. You see the gray shaded region, which is essentially type 4 aromatic-naphthenic crudes region, as we have established.
We can now identify the region for group 5 crude oils. That is aromatic-intermediate crudes. That is bound by two lines.
So you can see the purple region, purple triangle, bounded by paraffins greater than 10% and aromatics greater than 50%. This is number 5 type aromatic-intermediate crudes. With these boundary lines, we can now identify the region for type 6 aromatic-asphaltic crudes. So you can see the orange region which is bound by naphthenes less than 25% and paraffins less than 10%.
Self-Check Questions
Self-Check Questions
Take a few minutes to answer the questions below. When you are ready, Click Check to see the solutions.
Assignments
Assignment Reminder
Each week, you will have a number of assignments. This week's assignments are listed below. All assignments are submitted in Canvas. For due dates, please check your syllabus.
- Quiz 1 is due next Monday. Quiz 1 will cover material in both Lessons 1 and 2.
- Exercise 1 is due this week. Read the instructions carefully on what is acceptable.
Quiz 1
Quiz 1 is located in the Quizzes folder in Canvas. Quiz 1 will cover material in Lessons 1 and 2.
Exercise 1
Exercise 1 Instructions
Exercise 1 is provided in Canvas module Lesson 2 as a downloadable file. Submit your answers as a file in PDF format the Exercise 1 assignment in the Lesson 2 Module. For all the exerciase in this course, please make sure that you clearly indicate all the steps that you use to solve the problems and submit your own work.
Please note:
Scans of handwritten pages are not acceptable.
Summary and Final Tasks
Lesson 2 Summary
Selected properties of crude oil provide information on its quality and the conditions for optimum operation of a petroleum refinery for processing the crude oil to produce the desired fuels. Readily measurable physical properties of crude oil (such as density, boiling point, and viscosity) not only help predict the physical behavior of crude oil during refining but also give insight into the chemical composition of the oil. Therefore, physical properties can be used in developing characterization factors that relate to the chemical behavior of crude oil and the characteristics of the resulting refinery products. In addition to using characterization factors, crude oils are classified using ternary diagrams reflecting the hydrocarbon composition in terms of paraffins, naphthenes, and aromatics.
Learning Outcomes
By the end of this lesson, you should be able to:
- define the significant properties of crude oil, including density, viscosity, average boiling point, sulfur, and salt content;
- understand the significance of crude oil properties in terms of refinery objectives, and describe crude oil assay;
- define and interpret the classification factors (Watson, UOP, VGC, and BMCI) as they relate to the hydrocarbon composition of crude oils;
- calculate average boiling points for crude oils using different averaging techniques, and differentiate Watson and UOP characterization factors;
- analyze the elemental composition of crude oils and outline ternary classification of crude oils with respect to hydrocarbon composition, i.e., aromatics, paraffins, and naphthenes;
- assess the use of ternary classification of crude oils to estimate the refinery product yields.
Reminder - Complete all of the Lesson 2 tasks!
You have reached the end of Lesson 2! Double-check the to-do list below to make sure you have completed all of the activities listed there before you begin Lesson 3. Please refer to the Course Syllabus for specific time frames and due dates. Specific directions for the assignment below can be found within this lesson.
| Readings | J. H. Gary, G. E. Handwerk, Mark J. Kaiser, Chapter 3, pp. 57-61, 65-70 and the course material from this site |
|---|---|
| Assignments | Exercise 1 - Submit to the Exercise 1 Assignment in the Lesson 2 Module.
|
Questions?
If you have any questions, please post them to our Help Discussion Forum (not email), located in Canvas. I will check that discussion forum daily to respond. While you are there, feel free to post your own responses if you, too, are able to help out a classmate.
Lesson 3: Overall Refinery Flow
Lesson 3 Overview
Overview
Video: FSC 432 Lesson 3 (2:16)
In lesson three, we will take a quick walk through a refinery, and go through some different kinds of processes. There are four types of processes at a petroleum refinery. They are separation processes, which are essentially physical processes. No chemical change takes place in these processes, just physical separation.
The second category is conversion processes, where there's a lot of chemistry that's involved. We are breaking and making new chemical bonds, so that we could produce the fuels in quantities that we want, in the yields that we want.
The third kind of process is the finishing process, which is really to make sure that any product leaving the refinery is compliant with performance specifications as well as environmental regulations.
And the fourth kind of process is supporting process, and these are essential processes to make sure that whole refinery functions, and all these processes actually do perform their function, in essence, or their objectives.
Now, as we go through this refinery, we will see that there are certain areas of focus. Most recently, the refineries have focused on upgrading heavy oil. When we say heavy, we really refer to the density-- high-density crude oil.
High-density crude oil typically has a high aromatic hydrocarbon content, and these crudes are difficult to process, more expensive to process. So we will talk about some basic strategies-- how one could upgrade these heavy, highly aromatic crude oils into the desirable products, which tend to be lighter. That means lower density, such as gasoline, diesel, and jet fuel.
Overview
Selected properties of crude oil provide information on its quality and the conditions for the optimum operation of a petroleum refinery for processing the crude oil to produce the desired fuels. Readily measurable physical properties of crude oil (such as density, boiling point, and viscosity) not only help in predicting the physical behavior of crude oil during refinery but also give insight into the chemical composition of the oil. Therefore, physical properties can be used in developing characterization factors that relate to the chemical behavior of crude oil and the characteristics of the resulting refinery products. In addition to using characterization factors, crude oils are classified using ternary diagrams reflecting the hydrocarbon composition in terms of paraffins, naphthenes, and aromatics.
As introduced in Lesson 1, petroleum refining integrates four types of processes: separation, conversion, finishing, and supporting processes. This lesson involves a quick walk through a simple refinery in the U.S. to see what happens to a barrel of crude oil, and to provide more detail on how different processes are sequenced for optimum operation. The simple animation below shows a simplified diagram of processing network to maximize gasoline yield and produce the other distillate fuels (jet fuel, diesel fuel, and fuel oil) in high yield.
The first sequence of processes in a refinery makes use of physical separation to wash the salt out and to fractionate the desalted crude into different boiling ranges in a distillation column. Following the distillation, these fractions are subjected to further separation processes, such as those in Light Ends Unit (LEU) dewaxing and deasphalting units; to finishing processes, such as hydrotreatment; and to conversion processes, such as catalytic cracking, hydrocracking, visbreaking, and delayed coking. As shown in the animation below, the final products from these processes include Liquefied Petroleum Gas (LPG), lubricating oil base stock, asphalt, jet fuel and diesel fuel, gasoline, fuel oil, and petroleum coke. Some fractions from LEU are sent to finishing processes (blending and hydrotreatment) and further to a conversion process (reforming) to produce additional gasoline. Light products from catalytic cracking are subjected to further conversion in the alkylation process to produce more gasoline. Finally, supporting processes, hydrogen production and sulfur recovery, help remove the major heteroatom contaminant, sulfur, from the petroleum fuels through hydrotreatment [1].
This refinery scheme is typical in U.S. refineries where the premium product is gasoline, as one could tell from the number of processes that lead to gasoline as the major product. The gasoline streams from different processes are blended in sophisticated linear and non-linear programming schemes to produce the three grades of gasoline sold in the U.S., regular, intermediate, and premium grades defined in reference to octane number. Elsewhere in the world, there is more emphasis on producing diesel fuel rather than gasoline, since the transportation systems are not as heavily dependent on gasoline-powered passenger vehicles. Diesel fuel is preferred for mass transport options (e.g., buses and trains), as diesel engines (with compression-ignition) can deliver more power than spark-ignition gasoline engines.
In the following sections, each major process group in a refinery network will be introduced in sequence. We will discuss how they fit in the “industrial ecology” of petroleum refining for the overall economic goal of maximizing profit in the prevailing markets for crude oil and the refined petroleum products. The video below presents a flow diagram integrating the four types of processes in a petroleum refinery.
Video: FSC 432 Simple Refinery Flow (4:36)
PRESENTER: Here we will go over a very simple refinery flow. This is a much simpler scheme than we have included in lesson one for different types of refinery processes, separation, finishing, convergence, and support. Here what we would like to do is to connect crude oil feed to these major refinery products starting with LPG, the lightest, gasoline, jet fuel, fuel oil, asphalt, and coke.
One point to make, look at the number of arrows that go to gasoline, which really shows the significance of this product as the major product in US refineries, the gasoline. Quite a few different processes produce gasoline. Of course jet fuel and diesel also are important refinery products.
So let's look at the processes that we can use to connect crude oil to these major products. Here again crude oil goes through desalting and distillation. And through the light ends unit separations we produce the first product, LPG, or liquefied petroleum gas. That is essentially propane and butane.
The light straight-run naphtha coming from the light ends unit go through blending to the gasoline pool. And from the atmospheric distillation unit, kerosene and light gas oil go through hydrotreatment treatment to produce jet fuel and diesel. So you can see here that using just separation and finishing processes we could produce LPG straight from gasoline, which would be low octane number, and jet fuel and diesel without any convergent process.
We bring in two additional separation processes, dewaxing and deasphalting. You would remember dewaxing would produce the lubricating oil base stock and the wax byproduct. And deasphalting, treating the vacuum distillation resid would separate out asphalt and produce deasphalted oil for further conversion.
So we have pretty much exhausted our separation process. You can see there are still quite a few arrows pointing nowhere. So we need to go to our conversion processes to connect to our final products.
Here are our conversion processes in color purple. Starting from the left, hydrocracking treats the heavy vacuum gas oil to make additional jet fuel and diesel. Visbreaking takes the VDR from the vacuum distillation process and produces fuel oil.
Moving to the right, catalytic cracking takes the feed from the distillation unit-- could be a light gas oil or a heavy gas oil-- to produce gasoline. This is the major gasoline production path. And the byproducts from cat cracking goes through alkylation to make additional gasoline, high octane number gasoline.
And the heavy naphtha, straight heavy naphtha coming from the light ends unit through hydrotreatment goes through reforming to make another high octane gasoline stream. And finally the VDR from the vacuum distillation could go through coking to make additional gasoline, as well as the byproduct coke.
Finally, we will use the two major supporting processes, hydrogen production and sulfur recovery, to connect all the arrows. You know that hydrogen is used to remove sulfur in the crude oil fractions as hydrogen sulfide. And hydrogen sulfide is converted to elemental sulfur in the sulfur recovery unit. And elemental sulfur is sold as a refinery product. So that completes our simple refinery flow.
Learning Outcomes
By the end of this lesson, you should be able to:
- illustrate the refinery processes with examples for each category of processes;
- distinguish and evaluate the functions of different refinery processes to control refinery product yield and composition;
- evaluate the principles behind the major refinery processes and examine the products from each process from Distillation to Hydrocracking;
- formulate strategies for upgrading heavy oil.
What is due for Lesson 3?
This lesson will take us one week to complete. Please refer to the Course Syllabus for specific time frames and due dates. Specific directions for the assignments below can be found on the Assignments page within this lesson.
| Readings: | J. H. Gary, G. E. Handwerk, & Mark J. Kaiser, Chapter 1, pp. 32-36; Chapter 2, pp. 41-55 and the course material from this site |
|---|---|
| Assignments: | Exercise 2: Using ternary classification to characterize crude oil blends |
Questions?
If you have any questions, please post them to our Help Discussion (not email), located in Canvas. I will check that discussion forum daily to respond. While you are there, feel free to post your own responses if you, too, are able to help out a classmate.
Desalting and Distillation
Desalting and Distillation
Although distillation is usually known as the first process in petroleum refineries, in many cases, desalting should take place before distillation (Figure 3.1). Salt dissolved in water (brine) enters the crude stream as a contaminant during the production or transportation of oil to refineries. If salt is not removed from crude oil, serious damage can result, especially in the heater tubes, due to corrosion caused by the presence of Cl. Salt in crude oil also causes reduction in heat transfer rates in heat exchangers and furnaces.
The three stages of desalting are:
- adding dilution water to crude;
- mixing dilution water with crude by a mixer;
- dehydration of crude in a settling tank to separate crude and sediment and water (S&W).
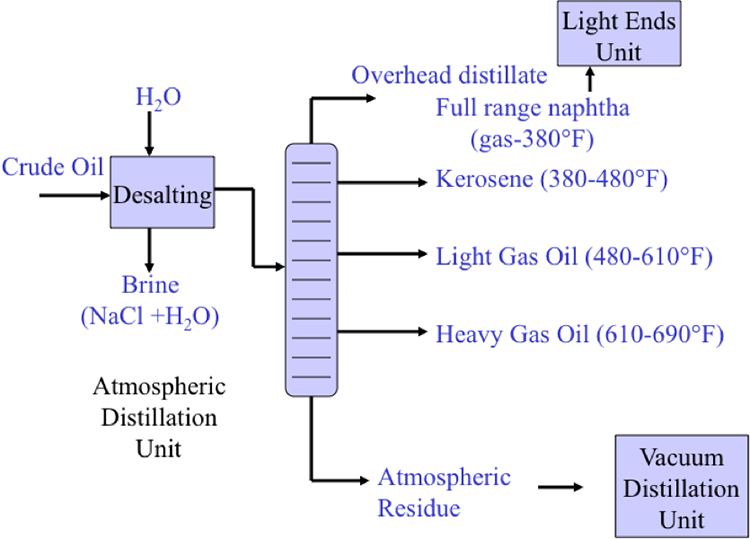
Desalting and fractional distillation of crude oil schematic:
Crude oil enters an atmospheric distillation unit and starts at desalting. Crude oil and water are added and a brine of NaCl + H20 comes out. The resulting oil is separated into overhead distillate & full-range naphtha (gas-380ºF) [this goes to a light ends unit], Kerosene (380-480ºF), Light Gas oil (480*-610ºF), Heavy Gas Oil (610-690ºF), & Atmospheric Residue.
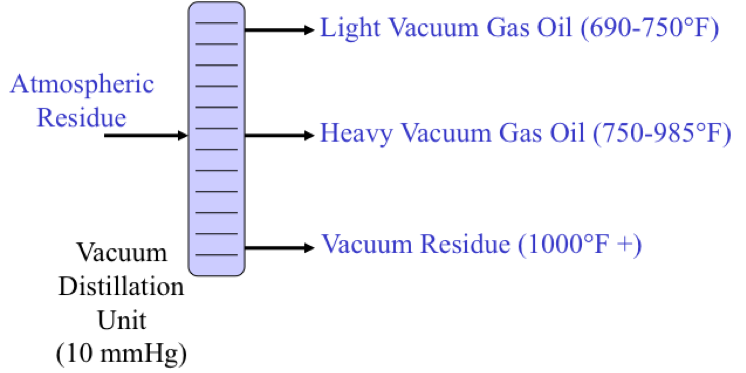
Atmospheric Residue goes to a vacuum distillation unit (10mmHg) which separates the residue into light vacuum gas oil (690-750ºF), Heavy Vacuum Gas Oil (750-985ºF), Vacuum Reside (1000ºF +)
Desalting can be performed in a single-stage or two-stage units. The amount of water wash and the temperature of the mixing process depends mainly on the crude API gravity [2].
Distillation separates hydrocarbon compounds into distillate fractions based on their boiling points or volatility. More volatile compounds (with low boiling points) tend to vaporize more readily than heavy compounds, and this forms the basis of separation through distillation. In a distillation column, light components are removed from the top of the column, and the heavier part of the mixture appears in the bottom. For a crude that is a mixture of thousands of hydrocarbons, some very light compounds such as ethane and propane only appear in the top product, while extremely heavy and non-volatile compounds such as asphalts only appear in the bottom. Figure 2 shows a simple diagram of atmospheric and vacuum distillation units and the fractional separation of the crude oil into different boiling fractions with the indicated boiling ranges. The lightest compounds found in crude oil come out from the top of the distillation column (referred to as overhead distillate, or full-range naphtha) and are sent to the Light Ends Unit (LEU) for further separation into LPG and naphtha, as discussed later. The side streams separated in the atmospheric distillation column give fractions that include the “straight-run” products called kerosene, and light and heavy gas oils. The residue from the atmospheric distillation column generates two side streams, light and heavy vacuum gas oils, and vacuum residue from the bottom. All of these distillation products are subjected to subsequent processing to produce light and middle distillate fuels and non-fuel products, as described in the following sections, starting with LEU.
Light Ends Unit
Light Ends Unit
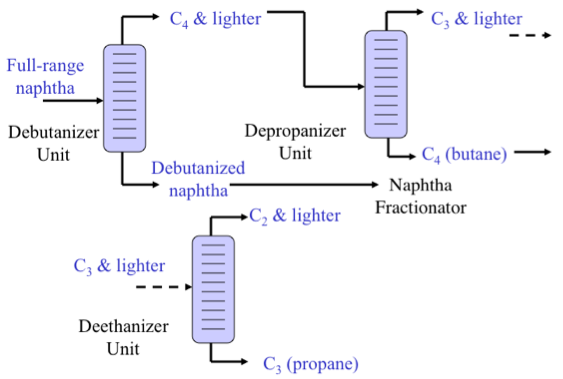
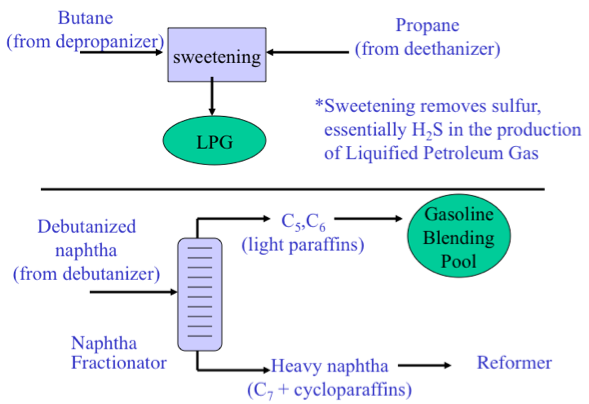
As shown in Figure 3.2, the Light Ends Unit consists of a sequence of distillation processes to separate the overhead distillate product from the atmospheric distillation column into five streams consisting of methane and ethane (C2 and lighter), to propane (C3), butane (C4), light naphtha, and heavy naphtha. The fraction C2 and lighter is used as fuel gas in the refinery to provide heat or generate steam. Propane and butane are sold as liquefied petroleum gas (LPG) after removing H2S. Light naphtha fraction that consists of C5 and C6 paraffins (pentane and hexane) is sent to the gasoline blending pool as straight-run gasoline, while the heavy naphtha fraction (rich in cycloalkanes, or naphthenes) is sent to a catalytic reforming process to produce gasoline with a high octane number.
Catalytic Reformer
Catalytic Reformer
Catalytic reforming converts low-octane straight run naphtha fractions (particularly heavy naphtha that is rich in naphthenes) into a high-octane, low-sulfur reformate, which is a major blending product for gasoline (Figure 3.3). The most valuable byproduct from catalytic reforming is hydrogen, which is needed in refineries with increasing demand for hydrotreating and hydrocracking processes. Most reforming catalysts contain platinum supported on alumina, and some may contain additional metals such as rhenium and tin in bi-, or tri-metallic catalyst formulations. Early reforming processes were called platforming in reference to reforming with a platinum catalyst. In most cases for catalytic reforming, the naphtha feedstock needs to be hydrotreated before reforming, to protect the platinum catalyst from poisoning by sulfur or nitrogen species. The principal reactions in catalytic reforming include dehydrogenation of naphthenes to aromatics (with significant quantity of hydrogen as byproduct) and cracking/isomerization of n-paraffins into i-paraffins. The principal product from catalytic reforming is called reformate, consisting of C4 to C10 hydrocarbons. Reformate has a high octane number because of high concentration of aromatic compounds (benzene, toluene, and xylene) produced from naphthenes. With the more stringent requirements on benzene and total aromatics limit in US and Europe (less than 1% benzene, 15% total aromatics), the amount of reformate that can be used in gasoline blending has been limited, but the function of catalytic reforming as the only internal source of hydrogen continues to be important for refineries.
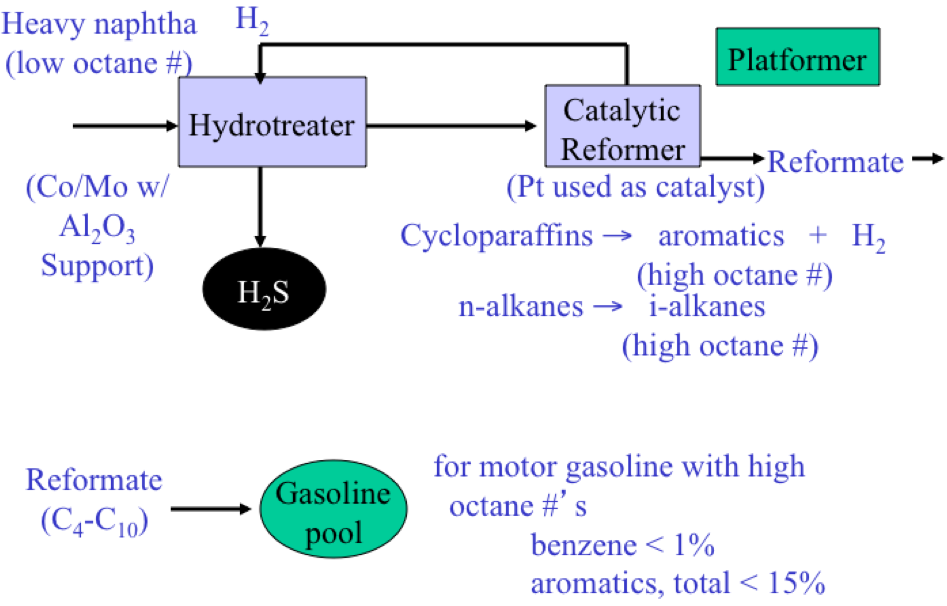
Catalytic reforming schematic.
Heavy naphtha (low octane #) along with Co/Mo with Al2O3 support enter the hydrotreater. From there it goes to the catalytic reformer where Pt is used as a catalyst to turn cycloparaffins into aromatics + H2 (high octane #) and n-alkanes into i-alkanes (high octane #). H₂ goes back into the hydrotreater and is removed as H2S. Products from the catalytic reformer are called reformate and are added to the gasoline pool.
Also noted on the diagram is that for motor gasoline with high octane #’s benzene accounts for less than 1% while aromatics, total are <15%
Catalytic Hydrotreatment
Catalytic Hydrotreatment
As seen with the catalytic reforming in the previous section, catalytic hydrotreatment can be used as a pretreatment step to protect catalysts from crude oil contaminants such as heteroatom (S, N, O) compounds, as well as metals (mainly Ni, V). Hydrotreatment is also used as a major finishing process in a petroleum refinery. Shifting to the side stream products from the distillation column, kerosene and light gas oil fractions can be hydrotreated to remove the heteroatoms to produce the final products of jet fuel, and diesel fuel, as shown in Figure 3.4. Particularly strict sulfur limits are imposed on diesel fuels so that the particulate emissions from diesel engines can be reduced. In the U.S., the government regulations [3] require that highway and non-road locomotive and marine (NRLM) use diesel fuel that meets a maximum specification of 15 parts per million (ppm) sulfur by 2014, with a full compliance for highway use and non-road diesel fuel since December 2010. Note in Figure 5 that typical catalysts used for hydrotreating are Co and Mo compounds supported on alumina (Al2O3). Jet fuel consists of C10 to C15 hydrocarbons, and diesel fuel consists of C15 to C20 hydrocarbons. Analogous to octane number for gasoline, a performance parameter for diesel fuel is cetane number (n-C16H34, n-hexadecane) that measures, in contrast to octane number, the tendency (not resistance) of diesel fuel to ignite upon compression with air. As a side note, light gas oil fraction is not typically used in the U.S. for producing diesel fuel, but sent to catalytic cracking to make gasoline.
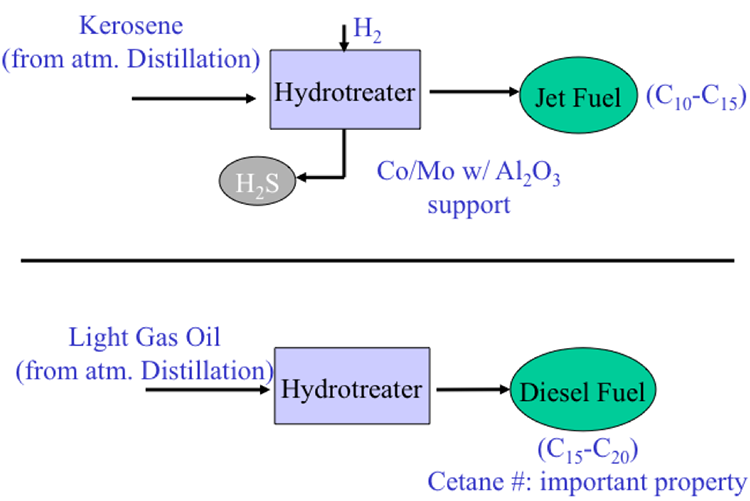
Conversion of Heavy Gas Oil
Conversion of Heavy Gas Oil
Moving down to the side streams of the distillation column, heavy gas oil constitutes the next fraction in line. Some generic conversion processes for the heavy distillates, such as heavy gas oil (consisting of C20 to C25 hydrocarbons), are shown in Figure 3.5. These processes, aimed at reducing the molecular size or the boiling point of gas oil compounds, involve thermal cracking or catalytic cracking. A mild thermal cracking process, called visbreaking, is applied to reduce the viscosity of the feedstock, and it is more frequently applied to residual fractions, such as vacuum distillation residue. A more severe thermal cracking of heavy gas oil can be used to produce LPG and ethylene and light and middle distillates from heavy gas oil. A highly aromatic byproduct from thermal cracking is called ethylene tar. Ethylene is an important petrochemical feedstock, while ethylene tar can be used as feedstock to produce carbon blacks. Catalytic cracking is more frequently used for conversion of heavy gas oil to gasoline.
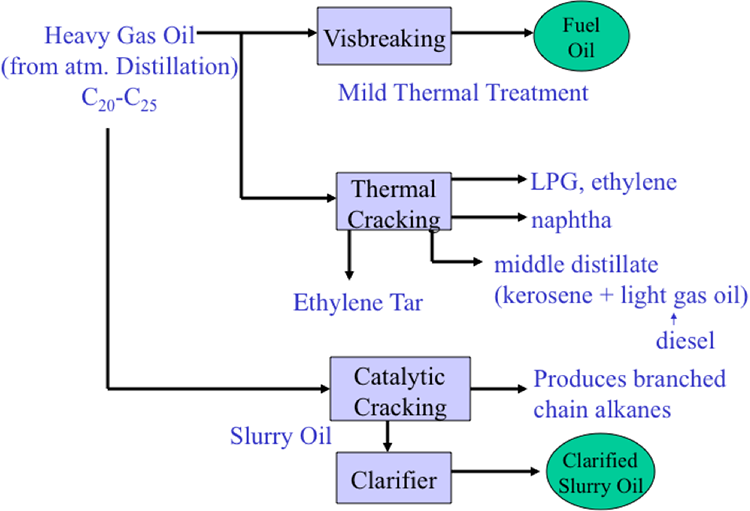
Products and processes of heavy Gas Oil Conversion
Start: Heavy Gas Oil (from atm Distillation) > 20 – 25 Carbons goes to
- Visbreaking (mild thermal treatment)
- Fuel oil
- Thermal Cracking
- LPG, ethylene
- Naphtha
- Middle distillate (kerosene +light gas oil)
- Ethylene Tar
- Catalytic Cracking
- Produces branched chain alkanes
- Slurry Oil
- clarified
- Clarified slurry oil
- clarified
A particular process of catalytic cracking, Fluid Catalytic Cracking, is almost exclusively used worldwide in heavy gas oil and light vacuum gas oil conversion. This process produces high octane gasoline primarily, with important byproducts, including LPG, light olefins and i-alkanes, light cycle oil (LCO), heavy cycle oil (HCO), and clarified slurry oil (also called decant oil), as shown in Figure 3.6. LCO is used in the U.S. to produce diesel oil by hydrocracking, and decant oil can be used as fuel oil, feedstock for carbon black manufacturing, and to produce a special type of petroleum coke called needle coke. Needle coke has a microstructure that makes it a good precursor to graphite electrodes that are used in electric-arc furnaces to recycle scrap iron and steel. The manufacturing of graphite electrodes, using a byproduct from FCC used to produce gasoline, is considered a principal interface between petroleum refining and the iron and steel industry.
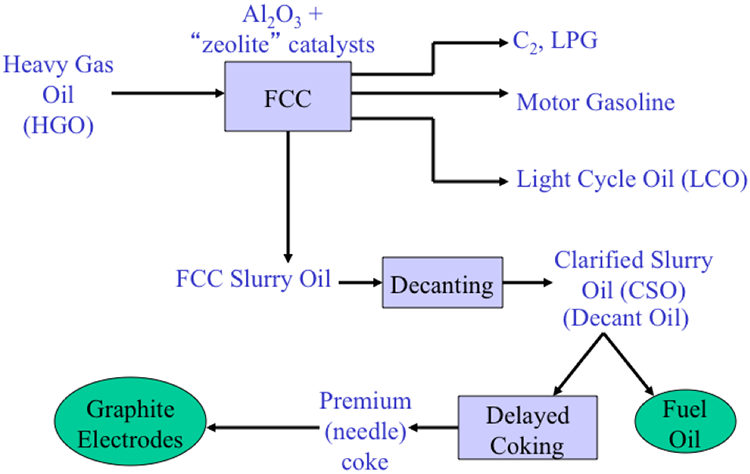
Products and Processes of FCC
Start: Heavy Gas Oil (HGO) goes to
- FCC with Al3O3 + Zeolite catalysis
- C2, LPG
- Motor Gasoline
- Light Cycle Oil (LCO)
- FCC Slurry Oil
- Decanting
- Clarified Slurry Oil (CSO/Decant Oil)
- Fuel Oil
- Delayed Coking
- Premium (needle) coke
- Graphite electrodes
- Premium (needle) coke
- Clarified Slurry Oil (CSO/Decant Oil)
- Decanting
Conversion and Processing of Vacuum Gas Oils
Conversion and Processing of Vacuum Gas Oils
Moving to the vacuum distillation column, the vacuum distillates, light vacuum gas oil (LVGO) and heavy vacuum gas oil (HVGO) can be processed by some advanced FCC processes. However, hydrocracking is more frequently used to convert LVGO and HVGO into light and middle distillates, using particular catalysts and hydrogen. Similar to LCO, the LVGO and HVGO fractions from vacuum distillation tend to be highly aromatic. Catalytic hydrocracking combines hydrogenation and cracking to handle feedstocks that are heavier than those that can be processed by FCC, because of excessive coke deposition on the catalyst in the absence of hydrogen. Middle distillates (e.g., kerosene and diesel fuel) are the principal products of hydrocracking. In addition to light and middle distillates, hydrocracking also produces light distillates and LPG, as shown in Figure 3.7.
HVGO can also be used as a feedstock to produce lubricating oil base stock, through a sequence of solvent extraction processes to remove aromatic hydrocarbons by furfural extraction, and to remove long-chain paraffins by dewaxing (Figure 3.8).
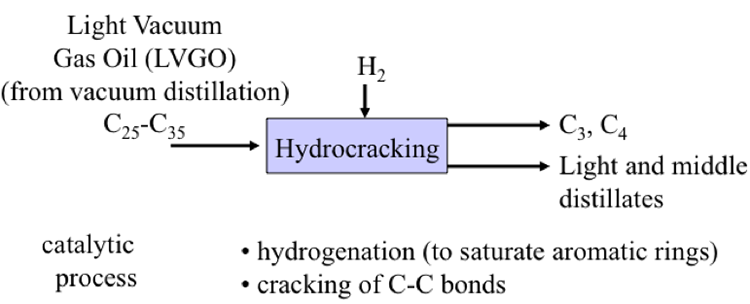
Schematic of Hydrocracking Light Vacuum Gas Oil (25-35 Carbon Chains).
The carbon molecules undergo hydrocracking in the presence of hydrogen gas. The products come out as C3 and C4 molecules, along with light and medium distillates. The schematic also notes that the catalytic process includes hydrogenation (to saturate aromatic rings) and the cracking of C-C bonds.

Schematic of Hydrocracking Heavy Vacuum Gas Oil (25-35 Carbon Chains).
The Heavy vacuum gas oil goes into solvent extraction with furfural which extracts the heavy aromatics. Then the products go into dewaxing which separates out long-chain b-paraffins (wax). That yields lube oil base stock, which becomes lubrication oils.
Processing and Conversion of Vacuum Distillation Residue
Processing and Conversion of Vacuum Distillation Residue
The heaviest and the most contaminated component of crude oil is the vacuum distillation residue (VDR), also referred to as the bottom-of-the-barrel. There are multiple processing paths to upgrade VDR into usable products. One process is called deasphalting, which removes the heaviest fraction of VDR as asphalt that is used mainly to pave roadways. The lighter fraction obtained in the deasphalting process, deasphalted oil (DAO), can be used as fuel oil after hydrotreatment (Figure 3.9).
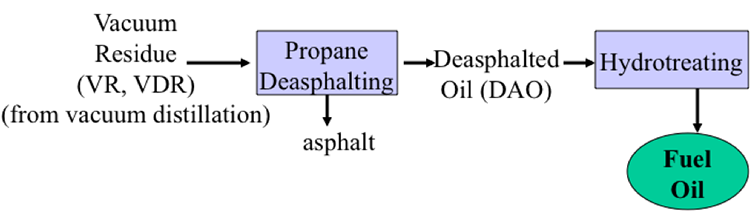
Thermal processes, such as visbreaking and coking, also provide options for upgrading VDR, which is normally a solid at ambient temperature. As shown in Figure 3.10, the visbreaking operation involves mild thermal cracking, with the primary purpose of producing a relatively low grade fuel oil (with a much lower pour point than VDR) and byproducts such as middle and light (naphtha) distillates and LPG. The yield of these byproducts would normally not exceed 10%wt of VDR. As a general rule in refinery conversion processes, producing a lighter product with a higher H/C ratio (e.g., fuel oil, middle distillates, LPG) from a feedstock (e.g., VDR) would require the simultaneous formation of a heavier product (e.g., coke) with a lower H/C ratio than the feedstock. Clearly, this compensation is dictated by the hydrogen balance, or hydrogen distribution among the products. With no external hydrogen entering the conversion unit (as it would in hydrogenation, or hydrocracking reactions), making a product(s) with a higher H/C ratio than that of the feed would require making other product(s) with a lower H/C ratio than that in the feedstock. In the case of visbreaking, what enables the production of lighter (or lower viscosity) fuel oil and other products from VDR is the formation of small quantities of coke with an extremely low H/C ratio. Hence, the term disproportination describes this unequal distribution of C or H in the conversion products, or losing (rejecting) C in the coke that accumulates on reactor tubes and is periodically burned out to clean the reactor tubes.
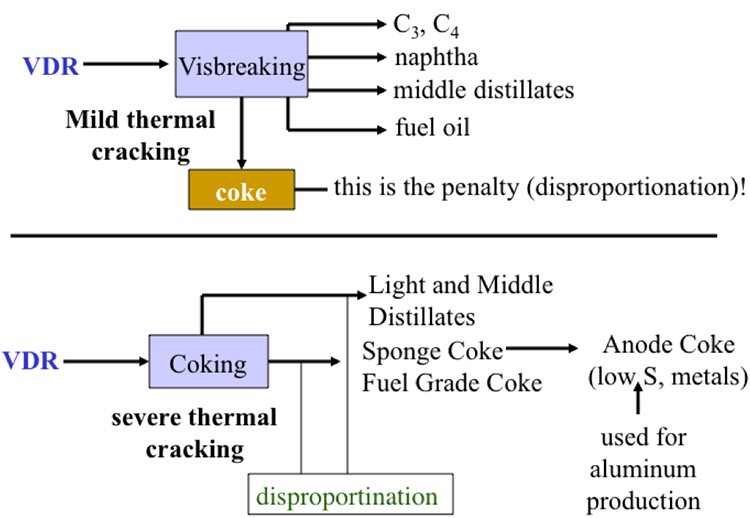
Visbreaking of VDR with mild thermal cracking yields C3 and C4 carbons, naphtha, middle distillates and fuel oil. As a penalty, it also produced coke (disproportionation!).
Coking of VDR with severe thermal cracking which yields light and middle distillates, and sponge coke & fuel grade coke which becomes anode coke, (low sulfur metals) which are used for aluminum production. This process also has some disproportionation.
As different from visbreaking, coking involves severe thermal cracking with intentional production of coke with a low H/C, so that lighter fuels can be obtained from VDR (by disproportionation), as can also be seen in Figure 3.10. The product coke obtained from VDR with relatively low heteroatom concepts, termed sponge coke, can be used in manufacturing carbon anodes that are used in electrolysis of alumina (Al2O3) to produce aluminum metal. This is another important interface between petroleum refining and metals industries, similar to the coke produced from decant oil used for making needle coke for manufacturing graphite electrodes to operate electric-arc furnaces, as mentioned before.
Paths for Upgrading Heavy Oil
Paths for Upgrading Heavy Oil
It should be clear from this quick tour of a refinery, that the most valuable products from a refinery include light distillates (gasoline) and middle distillates (jet fuel and diesel). These products are mostly paraffinic and contain relatively short paraffin chains, or small molecules, or, in other words, high H/C ratios. In this context, one could summarize the overall goal of petroleum refining as managing the H/C ratio of the products for the optimum distribution of hydrogen into products to maximize profits. Controlling the H/C ratio of the products would require either lowering the C content of the products (i.e., carbon rejection), or increasing the H content (i.e., hydrogen addition). The animation below depicts these two major paths for upgrading heavy oil (or crude oil) with some examples for each path. The processes, coking, solvent extraction (e.g., deasphalting), visbreaking, and catalytic cracking reject carbon in the coke (carbonaceous) product so that lighter products (with high H/C) ratios can be obtained in these processes. Carbon in the coke, or in the heavier product, is considered to have been rejected (and potentially lost) since the carbonaceous byproducts have much lower value in comparison to those of the lighter products. In contrast, hydrogen addition, as in the processes of hydrogenation and hydrocracking, enables the conversion of all the carbon present in heavy oil (or crude oil) to high value products without rejecting, or sacrificing, any. One might ask, then, why would any refinery carry out any carbon rejection process instead of hydrogen addition? A short answer to this question involves basic refinery economics; the hydrogen addition processes cost much more than carbon rejection processes, because producing hydrogen and the catalysts used in hydrogen addition processes are very expensive.
Video: FSC 432 Upgrading Heavy Oil (3:48)
PRESENTER: Upgrading heavy oil has become a major task in refineries. Heavy oils contain higher-density compounds that tend to be more aromatic in nature while the desirable products from refinery are light distillates, like gasoline, or middle distillates, like kerosene or diesel. Now, light distillates and middle distillates have higher hydrogen to carbon ratios because they tend to be paraffinic compared to the aromatic heavy oil. So upgrading heavy oil really means managing the hydrogen to carbon ratio.
There are two major pathways to manage or change the hydrogen to carbon ratio. The first pathway is called "carbon rejection." By rejecting carbon from the heavy oil, say through coking-- making a carbon-rich byproduct, coke. The remainder from that product becomes lighter or has a high hydrogen to carbon ratio.
Our solvent extraction, as in de-asphalting-- rejecting asphalt-- makes the de-asphalted oil lighter. Similarly, in visbreaking and catalytic cracking processes, carbon is rejected in the reactor tubes or on catalyst surfaces so that the remaining product is much lighter-- or a higher hydrogen to carbon ratio, which is essentially the upgrading process.
So through carbon rejection, we produce lighter products with high hydrogen to carbon ratio, as in light distillates or middle distillates. And carbonaceous-- or carbon-rich-- byproducts with low hydrogen to carbon ratio. One disadvantage of carbon rejection is actually losing carbon as a waste or a low-value product.
The second upgrading pathway requires hydrogen-- external hydrogen. It's a hydrogen addition process, as in hydrocracking or hydrogenation.
So you need to bring in hydrogen from an external resource to be able to add hydrogen to your heavy oil for upgrading purposes. Hydrogen addition would also lead to lighter products with higher hydrogen to carbon ratio, as we have seen with carbon rejection. But in this case, there is no rejection of carbon or losing part of your feedstock as a low-value or a waste product. So they have higher yields of the desirable lighter products. That's the advantage of hydrogen addition.
The disadvantage is that hydrogen is expensive to produce, and the catalysts used in hydrocracking and hydrogenation processes are also expensive. So higher yields of lighter products, but more costly process.
So in a refinery, both of these pathways-- carbon rejection and hydrogen addition-- are used to produce to get the products that are in demand for the market in the optimum fashion. That means the cheapest way, in essence.
Self-Check Questions
Self-Check Questions
Please take a few minutes to answer the following questions. When you are happy with your responses, click Check below.
Assignments
Assignment Reminder
Each week, you will have a number of assignments. This week's assignments are listed below with instructions on what to do. For due dates, please check your Syllabus.
Exercise 2
Exercise 2 Instructions
Exercise 2 is provided as a downloadable file in Canvas module Lesson 3. Please submit answers as a pdf to the Exercise 2 assignment in the Lesson 3 Module.
Please Note:
Scans of handwritten pages are not acceptable.
- A refinery has access to two different crude oil stocks A and B with the following compositions:
Table 3.1 Naphthenes % Aromatics % Crude A 30 65 Crude B 10 35 - What type of crude oils are A and B according to the ternary classification based on composition? 20 pts
- What type of crude would be obtained if A and B are blended in a proportion of A/B =3/2? 20 pts
- The refiners would like to maintain a weight ratio of 1/1, Crude A/Crude C in a ternary blend of the oils A, B, and C. What would be the minimum concentration of Crude B (% wt) in a ternary blend that could be classified as naphthenic oil? 60 pts
Table 3.2 aromatics naphthenes paraffins Crude A 70%wt 10%wt 20%wt Crude B 25%wt 60%wt 15%wt Crude C 15%wt 25%wt 60%wt
Instructions for Submitting Response:
Once you have a solution to the exercises, you will submit your answers as a PDF by uploading your file to be graded. The MS Word, or Excel files should be saved as a PDF before submitting the exercise. Please Note: Scans of handwritten pages are not acceptable.
Please follow the instructions below.
- Find the Exercise 2 assignment in the Lesson 3 Module.
- Make sure that your name is in the document title before uploading it to the correct assignment (i.e., Lesson3_Exercise2_Tom Smith).
Summary and Final Tasks
Petroleum refining may be considered as the most sophisticated scheme of integrated physical and chemical processes to meet the market demand for a number of fuels and materials in the economy. In addition to satisfying the performance specifications required by combustion engines, the composition of the produced fuels, such as gasoline, jet fuel, and diesel fuel, should be in compliance with environmental regulations. Considering that crude oil is a natural material that displays a wide range of variability in hydrocarbon composition and the distribution of heteroatom species, it is vital to practice an optimum sequence of the four types of processes that make up petroleum refining: separation, conversion, finishing, and support. These processes are integrated as an example of industrial ecology, such that every drop of crude oil ends up as a marketable product, including the contaminants such as sulfur. The U.S. refineries are configured to maximize the yield of gasoline (a light distillate) as the major product, along with jet fuel and diesel fuel (middle distillates). A number of processes produce different gasoline streams that are blended in sophisticated linear and non-linear programming schemes to produce the three grades of gasoline sold in the U.S. for profit. A quick walk through the network of refinery processes reveals the two general strategies that are in place to create the most value in the operation: carbon rejection and hydrogen addition. The balance between these two strategies hangs in the refinery economics and the markets for crude oil and refined petroleum products.
Learning Objectives
You should now be able to:
- illustrate the refinery processes with examples for each category of processes;
- distinguish and evaluate the functions of different refinery processes to control refinery product yield and composition;
- evaluate the principles behind the major refinery processes and examine the products from each process, from Distillation to Hydrocracking;
- formulate strategies for upgrading heavy oil.
Reminder - Complete all of the Lesson 3 tasks!
You have reached the end of Lesson 3! Double-check the to-do list below to make sure you have completed all of the activities listed there before you begin Lesson 4. Please refer to the Course Syllabus for specific time frames and due dates. Specific directions for the assignment below can be found within this lesson.
| Readings: | J. H. Gary, G. E. Handwerk, Mark J. Kaiser, Chapter 1, pp. 32-36; Chapter 2, pp. 41-55 and the course material from this site |
|---|---|
| Assignments: | Submit Exercise 2 as a PDF, or Excel file to the Exercise 2 assignment in the Lesson 3 Module. |
Questions?
If you have any questions, please post them to our Help Discussion (not email), located in Canvas. I will check that discussion forum daily to respond. While you are there, feel free to post your own responses if you, too, are able to help out a classmate.
Lesson 4: Separation Processes 1
Lesson 4 Overview
Overview
Video: FSC 432 Lesson 4 (2:23)
Hello. In Lesson 4, we will start talking about separation processes. This is the first part of the separation processes. Remember, we have talked about having four different types of processes in petroleum refinement. Separation is, of course, the first process.
Now the separation is very critical. The distillation process, which separates the crude oil with respect to the boiling point of the constituent compounds, is really the gateway to the refinery. There, we separate the crude oils into different fractions that are processed in downstream units until they end up as the desirable product that leave the refinery.
Now, in laboratories, we could have different distillation methods to characterize the crude oils. So we can inform the industrial or commercial distillation process. There are three different distillation methods. And we will go through them in this lesson, to see how different they are, and what specific applications would each of these different distillation methods-- laboratory methods-- have in terms of applying to the refinery processes.
Now, in this lesson, we will also define distillation terms. What do we mean by cut points? What do we mean by yield, and so forth. So that we can have a more educated discussion on the distillation process.
We will also introduce the vacuum distillation. And talk about why one would need vacuum for distillation of the residue from the atmospheric crude tower.
Distillation is perhaps the energy guzzler of the refinery. It consumes the largest fraction of energy in a given refinery. That's why the efficiency of distillation is very important for the overall efficiency of a refinery.
Overview
As introduced in Lesson 3, distillation is a key separation process that fractionates crude oil into a number of streams with specific boiling point ranges, or distillation cuts. Removing salt from crude oil usually precedes the distillation process to protect the downstream units from corrosion caused by Cl¯. Desalting process could also remove metals (e.g., Fe, Ni, V) and other inorganic solids and sediments that may deactivate catalysts used in conversion and finishing units. Depending on the specific gravity and the amount of salt present in a crude oil, refineries conduct from one up to three stages of desalting [1]. Heavy and crudes may require three stages of desalting, using processes such as gravity settling, electrostatic coalescence, and packed column separation [2]. Figure 4.1 shows a simple desalting process that uses gravity settling to separate brine (NaCl +H2O) from crude oil after diluting the crude with water and adding de-emulsifiers (chemical additives) to facilitate phase separation.
Learning Outcomes
By the end of this lesson, you should be able to:
- compare and evaluate different distillation methods;
- define boiling point ranges (TBP) of distillation fractions of crude oil;
- identify and exemplify distillation terminology, including cut points and product yields in distillation ranges;
- illustrate the crude fractionation in Atmospheric Distillation and calculate the extent of separation between the distillation fractions;
- illustrate Vacuum Distillation and assess the application of Watson Characterization Factor to select the temperature in Vacuum Distillation Tower.
What is due for Lesson 4?
This lesson will take us one week to complete. Please refer to the Course Syllabus for specific time frames and due dates. Specific directions for the assignment below can be found on the Assignments page within this lesson.
| Reading | J. H. Gary, G. E. Handwerk, Mark J. Kaiser, Chapter 4 (Crude Distillation) |
|---|---|
| Assignments | Exercise 3: Appraisal of the degree of separation between distillation fractions Quiz 2: Will cover the material in Lessons 3-4. |
Questions?
If you have any questions, please post them to our Help Discussion (not email), located in Canvas. I will check that discussion forum daily to respond. While you are there, feel free to post your own responses if you, too, are able to help out a classmate.
Atmospheric and Vacuum Distillation Units
Atmospheric and Vacuum Distillation Units
Distillation of crude oil is carried out in two units, first in an Atmospheric Distillation Unit (also known as Crude Distillation Unit, CDU), with further processing of the residue from atmospheric distillation in the Vacuum Distillation Unit (VDU), as illustrated in Figure 4.2. For sake of simplicity, Figure 4.2 does not include the network of heat exchangers and pump around loops to pre-heat the desalted crude before it is fed into the fired furnace. In the furnace, the crude is heated to the desired temperatures (700-750° F) such that all the distillate fraction and roughly 10-20% of the bottom product are evaporated, depending on the volatility of crude oil. The two-phase mixture is then introduced into the CDU flash zone for separation of vapor and liquid streams, where the vapor fraction rises toward the top of the column and the liquid fraction is subjected to stripping with steam to recover the low-boiling distillate components dissolved in heavier liquid before sending the bottom product (i.e., atmospheric distillation residue) to the vacuum distillation unit.
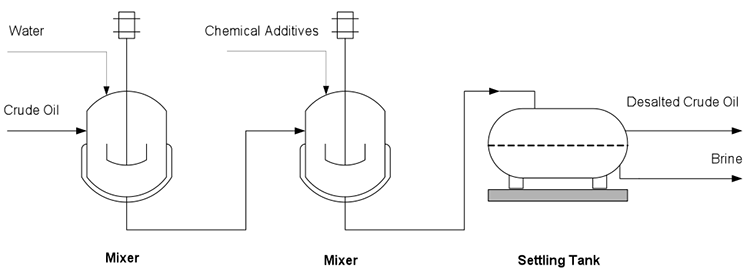
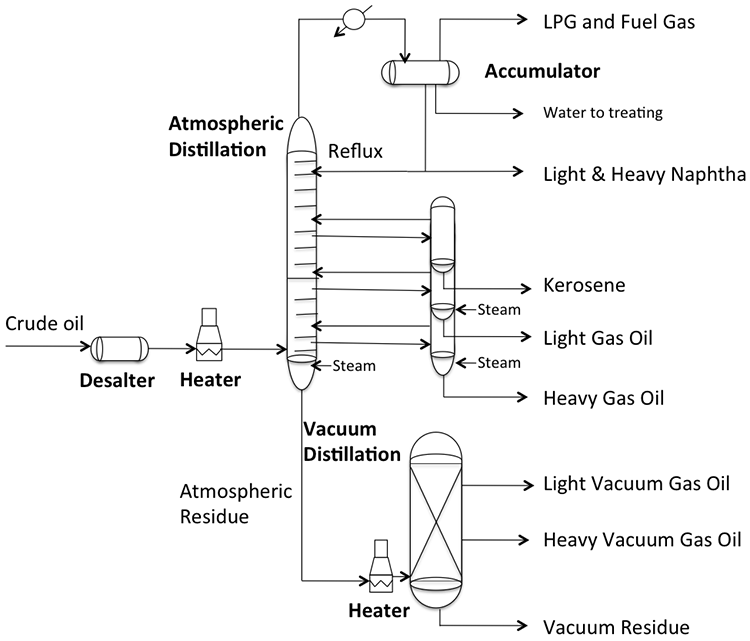
Schematic of an overall flow for fractional distillation.
Crude oil enters a desalter and then a heater. It then undergoes an atmospheric distillation where it refluxes. From that Heavy Gas Oil, Light Gas Oil, Kerosene, Light. & Heavy Naphtha and LPG and Fuel gas are separated out. The atmospheric residue goes to a separate heater and then into a vacuum distillation right where light vacuum gas oil and heavy vacuum gas oil are separated out along with vacuum residue.
A temperature gradient is established in the column by removing heat from the overhead vapor. The column condenses the naphtha fraction and sends a portion of the liquid naphtha, as reflux, to the column to achieve a good separation of the distillate products drawn from the side of the distillation column, such as kerosene, LGO, and HGO, as seen in the diagram. Steam strippers on the side of the column also provide reflux to the main column to help with clean separation of the distillate products. Additional reflux is provided to the main column by pump around loops associated with heat exchangers (see Figure 4.3, below, and Figure 4.8 in the textbook) for preheating the crude. Counter-current flow of vapor and liquid streams through the contact stages (e.g., trays) in the main column, enabling good separation of the distillate fractions. The temperature at the bottom of CDU is limited to 700-750° F to prevent cracking – breaking of the chemical bonds between carbon atoms in the aliphatic hydrocarbons constituting the crude oil. Cracking would cause coking (accumulation of carbonaceous solids) on the metal surfaces in the column and interferes with fractionation in distillation. Vacuum distillation is necessary to fractionate the heavy distillates because further increase in temperature would cause thermal cracking of the feed components. In HYSYS Project 1 assignment, you will learn how to introduce crude assay data to a distillation simulator and calculate the yields of naphtha, kerosene, diesel, atmospheric gas oil, and residue for different crudes.
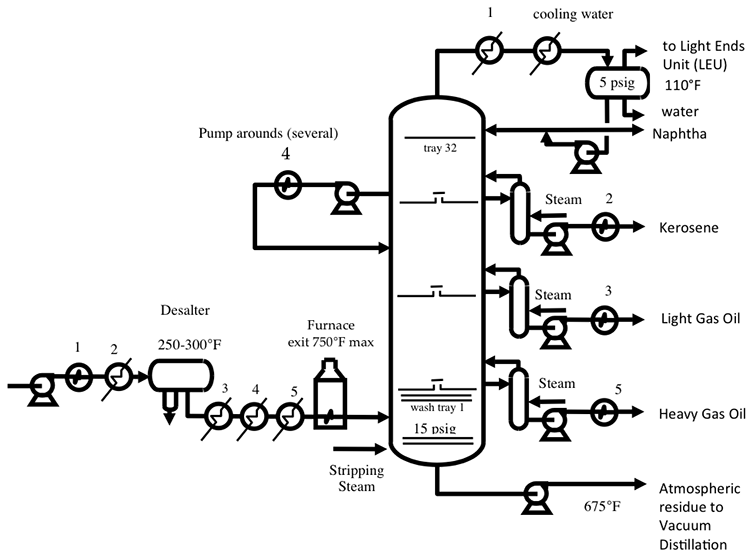
As shown in Figure 4.4, below (and in Figure 4.10 in the textbook), the atmospheric residue is reheated in a fired furnace to 730-850° F before introduction into the vacuum distillation unit (VDU). The furnace outlet temperature is selected depending on the thermal reactivity (or coking propensity of crude oil, as will be discussed further) and the desired level of separation in the column. Steam ejectors, or, more recently, vacuum pumps, are used to create a vacuum for evaporation of the light vacuum gas oil and heavy vacuum gas oil fractions. The temperature and pressure in VDU also depend on whether steam is introduced, or the separation is carried out without the steam addition in “dry” towers, varying between 10 to 30 mmHg at the bottom of the tower. Lower pressures and higher temperatures are used in dry towers. To minimize the pressure difference between the bottom and top of the column, some special packing materials are used (see, for example, Figure 4.5) instead of trays for providing contact between liquid and vapor streams to improve fractionation.
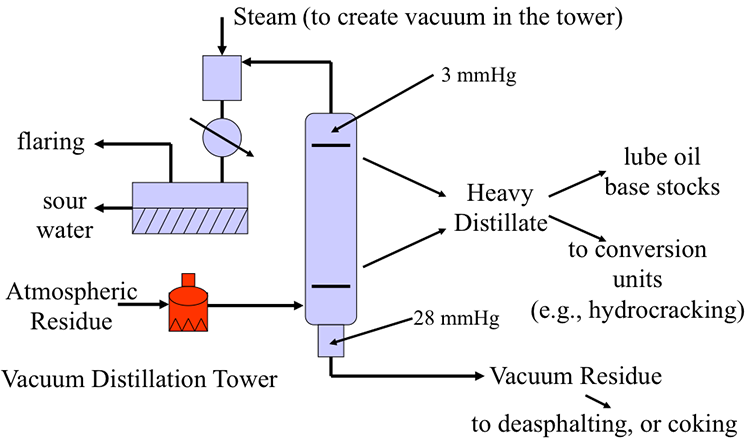
Schematic of a vacuum distillation unit.
Atmospheric residue enters a heater and then a vacuum distillation tower. This tower has a pressure of 3 mmHg at the top and 28mgHG at the bottom. Steam is used to create the vacuuming the tower and flaring and sour water are products of steam production. The vacuum distillation tower yields heavy distillate, which can become lube oil base stocks or be sent to conversion units (hydrocracking). Additionally, there is some vacuum residue which goes to desasphalting or coking
The heavy distillates (light vacuum gas oil and heavy vacuum gas oil) separated in VDU are further processed in downstream separation and conversion units to produce lubricating oil base stocks, or as feedstock for hydrocracking to produce light and middle distillates. The residue from vacuum distillation (VDR) can be upgraded into marketable products and fuels using processes such as visbreaking, deasphalting, and coking, as will be discussed in later sections.
Selecting the Right Temperature
Selecting the Right Temperature
Selecting the right temperature in the vacuum distillation column is critical to control the risk of coking in the column. The Watson Characterization Factor (Kw) [13] may be used to estimate the upper temperature limit for vacuum distillation to avoid coking. Figure 4.6 shows an empirical correlation between Kw and the temperatures above which significant thermal decomposition could take place. This region is labeled as the decomposition zone in Figure 4.6. Because of the complex variability in crude oil composition as it relates to coking propensity, one could draw a band of temperatures below which coking risk is negligible, and the area within the band represents uncertainty in terms of the probability of coking. To be on the safe side, the temperature in the column should be lower than the lower temperature line of the band. Figure 4.6 also shows that crudes with high Kw (paraffinic) should be heated to lower temperatures in the column than crudes with lower Kw (less paraffinic). Hydrocarbon composition is closely related to thermal reactivity, since paraffins could be more readily cracked than naphthenes, whereas aromatic compounds are the most stable hydrocarbons. To sum up, vacuum distillation temperatures should be selected with particular care for paraffinic crudes because of the relative ease of cracking of paraffins that leads to the formation of coke on surfaces.
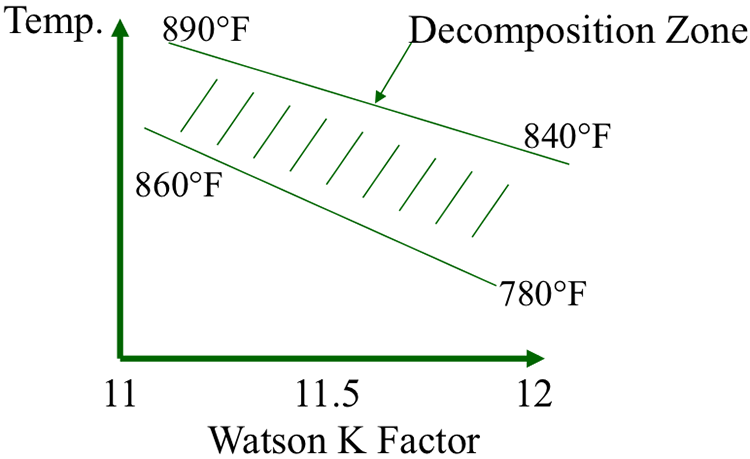
Severe cases of coking can plug the flow paths in the distillation column and require shutting down the unit. Shutting down a distillation unit would be catastrophic, as it would require shutting down the whole refinery that must run around the clock except for the scheduled maintenance period.
Knowledge Check
Check your knowledge!
Question 1: Why would shutting down a refinery be a catastrophic event?
ANSWER: Because of the very large crude throughput in refineries reaching, for example, as high as 560,640 bbl/d (89,135 m3/d) for the Baytown Refinery in Texas. It would be impossible to have large enough additional storage capacity in a refinery to hold the atmospheric distillation residue, if the VDU is shut down.
Distillation Methods
Distillation Methods
Three different distillation methods are commonly used to generate laboratory data on crude oil:
- True Boiling Point Distillation (TBP)
- ASTM Distillation (ASTM)
- Equilibrium Flash Vaporization (EFV)
The degree of separation between the distillation fractions obtained in these methods decreases significantly as one moves down the list from TBP through ASTM to EFV. Each method and the associated distillation data have different applications in the refinery practice.
True Boiling Point Distillation (TBP)
True Boiling Point Distillation (TBP)
This method, described in Figure 4.7a and b, uses a batch distillation operation that incorporates more than 100 theoretical plates and a high reflux ratio (R/P) of 100, as described in Figure 4.7a. This is an idealized method to achieve the best possible separation in distillation, made possible by a large number of theoretical plates (stages) for liquid vapor contact in the column and an extremely high reflux ratio. As an example, consider distillation of a binary mixture of compounds A (70% by volume) and B (30% by volume), with boiling points Ta and Tb, respectively. Figure 4.7b illustrates the distillation curve that would be obtained if this mixture were distilled using the TBP method, with perfect separation of A and B as pure compounds. Because of the TBP distillation conditions, first the lower boiling component A is distilled off without any contamination with B, and following the complete vaporization of A, B is distilled off as a pure compound. Note that because a large number of plates and a high reflux ratio in the column, temperature remains constant during evaporation of A until all of this compound is boiled off, as would be seen in the distillation of a pure compound.
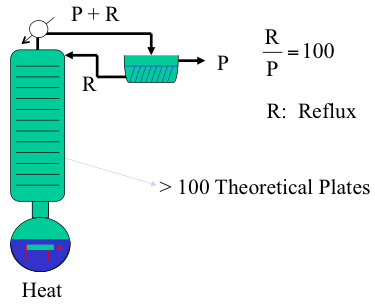
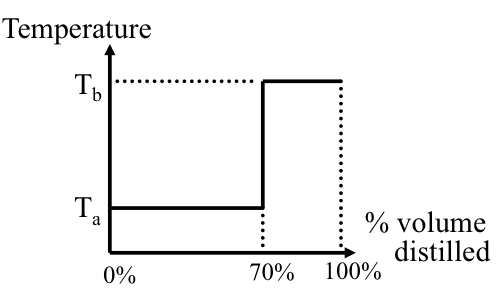
ASTM Distillation (ASTM)
ASTM Distillation (ASTM)
ASTM distillation also uses a batch operation, but in contrast to TBP, it operates without the presence of a contact plate and a reflux ratio (R/P, or RR) of zero, as shown in Figure 4.8a. There may be a slight unintentional reflux because of the condensation of the vapor on the tube that connects the flask to the condenser.
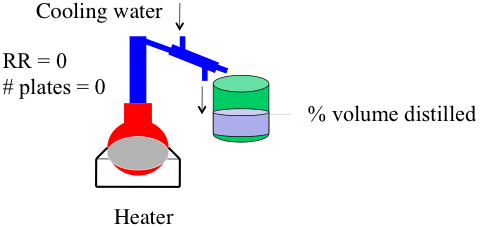
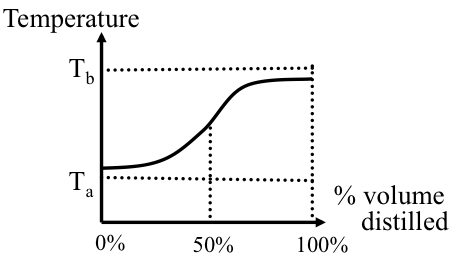
Equilibrium Flash Vaporization (EFV)
Equilibrium Flash Vaporization (EFV)
Equilibrium flash vaporization involves heating a flowing feed and the separation of the liquid and vapor in a flash drum. A distillation curve may be obtained by conducting this distillation at varying heater outlet temperatures. Figure 4.9 shows the diagram of an EFV set up and compares the distillation curves from the three methods, TBP, ASTM, and EFV. From the comparison of the curves and the relationship between IBP and EP obtained in each case, one concludes that EFV gives the lowest degree of separation between A and B, even lower than that given by the ASTM distillation.
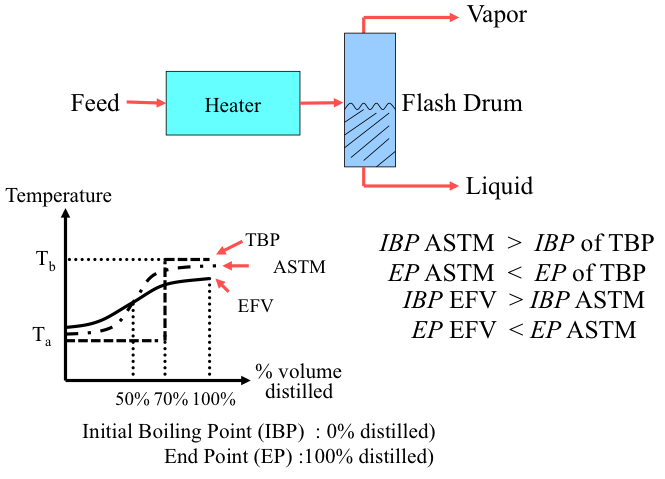
TBP, ASTM, and EFV Compared
TBP, ASTM, and EFV Compared
The TBP, ASTM, and EFV distillation methods achieve different levels of separation for a given sample, as related to the different techniques used in these analyses. Figure 4.10 shows TBP, ASTM, and EFV curves for a middle distillate fraction crude oil, showing significant differences in IBP and EP of the three curves [6]. Note that three curves converge near 50% volume distilled. TBP distillation achieves a higher degree of separation than ASTM and ASTM achieves better separation than EFV, as can be seen in the curves in Figure 4.10. Empirical correlations have been developed to convert one set of distillation data to another [7].
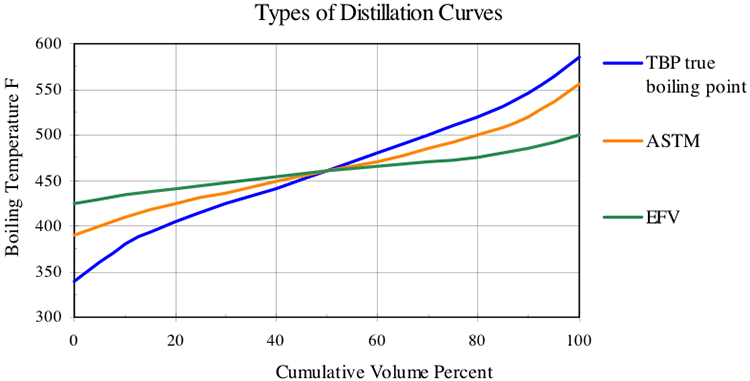
Each distillation method discussed in this section has an application in petroleum refining. TBP distillation is used to characterize crude oils and constitute a significant component of crude essay. ASTM methods are usually used for refinery products and property calculations and correlations for distillate fractions. EFV provides useful data for flashing operations in the refinery.
There are no standard methods for TBP distillation, but ASTM D-2892 method is used to approximate the TBP distillation. This method is also referred to as 15-5 distillation, because of 15 theoretical plates and a reflux ratio of 5 used in the distillation. A simulated distillation method described in ASTM D2887 may also be used to obtain TBP data for crude oils.
ASTM D86 (atmospheric distillation) and ASTM D1160 (vacuum distillation) are used for low-boiling, and high-boiling fractions, respectively.
[6] Refining Overview - Petroleum, Products and Processes, AIChE, 2000.
[7] Riazi, M.R., “Characterization and Properties of Petroleum Fractions,” MNL5, ASTM International, West Conshohocken, PA, 2005.
Distillation Terminology
Distillation Terminology
It is important to use the correct terms to clearly represent the fractionation of crude oil by distillation. The distillation temperatures, or cut points, are used to delineate the distiilate fractions and define commercial fuels and solvents.
Cut Points
Cut Points
Using a crude TBP curve, cut points are defined as the temperatures that represent the limits of a distillate fraction, as illustrated in Figure 4.11. For example, for kerosene, fraction Ta represents the lower cut point, and Tb represents the upper cut point in Figure 4.11.
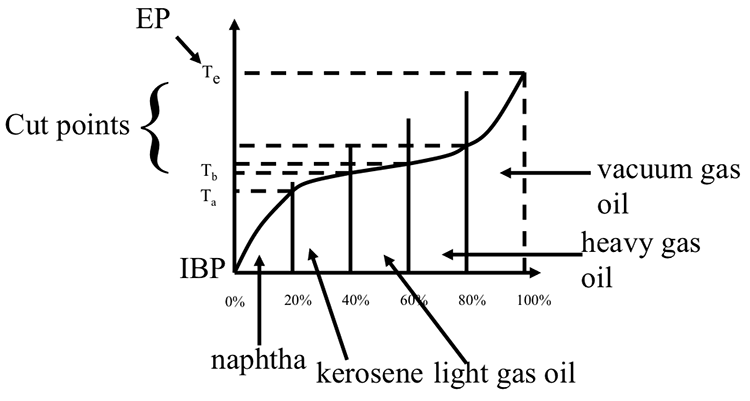
Boiling ranges between the cut points represent distillate products, such as naphtha, kerosene, light gas oil, etc. The difference between the cumulative volume percent at upper and lower cut points is reported as the yield (in volume %) for the particular distillate fraction. For example, for the crude represented in Figure 4.11, the kerosene yield can be calculated as 40%(at Tb) -20% (Ta) = 20% by volume. Table 4.1 shows the TBP cut points for crude oil distillate fractions.
| Distillate Product | Boiling Range |
|---|---|
| Butanes and Lighter | |
| Light SR Naphtha | 90 - 190o F (32-88o C) |
| Heavy Naphtha | 190 - 380o F (88 - 193o C) |
| Kerosene | 380 - 520o F (193 - 271o C) |
| Light Gas Oil | 520 - 610o F (271 - 321o C) |
| Heavy Gas Oil | 610 - 800o F (321 - 425o C) |
| Light Vacuum Gas Oil | 800 - 950o F (425 - 510o C) |
| Heavy Vacuum Gas Oil | 950 - 1050o F (510 - 564o C) |
| Vacuum Residue | > 1050o F (>565o C) |
Separation in Fractional Distillation
Separation in Fractional Distillation
The quality of separation in fractional distillation can be calculated using the designated cut points (at 5%vol and 95%vol) for the two adjacent fractions, termed as light and heavy. As shown below, the difference in temperature (ΔT) between 5% vol temperature of the heavy fraction and 95%vol temperature of the light fraction is used to define the quality of separation. A positive value of ΔT(termed ASTM gap) indicates good separation, while a negative value of ΔT (termed ASTM overlap) points to a bad separation.
ASTM distillation temperatures and separation in a distillation process
Fractionation
What defines a good separation?
The relationship between the ASTM distillation temperatures at 95% vol and 5% vol of two adjacent fractions, light and heavy, respectively.
ASTM 5% volT (heavy fraction) - 95% volT (light fraction) = ∆T
(e.g., LGO) (e.g., kerosene)
if ∆T >0, called ASTM gap (good separation)
if ∆T<0, called ASTM overlap (bad separation)
Assignments
Assignment Reminder
Each week, you will be required to do a number of assignments. This week, in addition to the reading assignments listed on the overview page, you are also required to complete the exercise questions and take a quiz which will cover the material in Lessons 3 and 4.
Exercise 3
Instructions for Exercise 3
Submit your answers by creating and uploading your pdf to the Exercise 3 Assignment in the Lesson 4 Module. Please Note: Scans of handwritten pages are not acceptable unless showing something on the graphs provided.
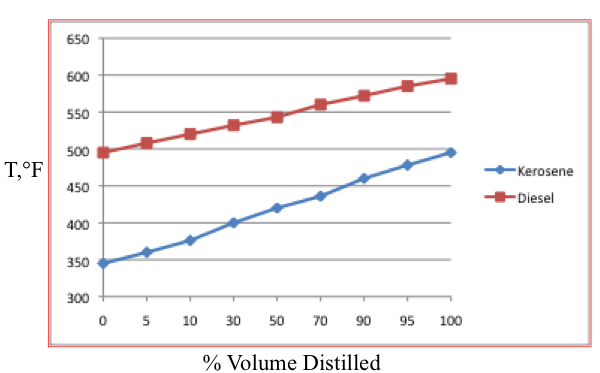
- Two crude oils A (Naphthenes: 20%, Aromatics: 10%) and B (Paraffins: 14% , Aromatics: 40%) are blended in A/B = 2/5 to make C. What is the paraffin content of C? 20 pts
- Consider the ASTM distillation curves given in Figure 4.12 for kerosene and diesel cuts obtained from distillation. Determine whether the separation in the column was good or bad. 40 pts
- Figure 4.13 shows an empirical plot that correlates an F factor which is defined as the product of the number of plates between the two adjacent side draws and the reflux ratio. The solid lines in the plot represents cases where no stripping steam is used in the side column, dashed lines represent the maximum amount of stripping steam used in the separation. The numbers shown at the bottom of the solid and dashed lines are given as the difference in °F of the TBP 50% distillation points between the light and heavy products.
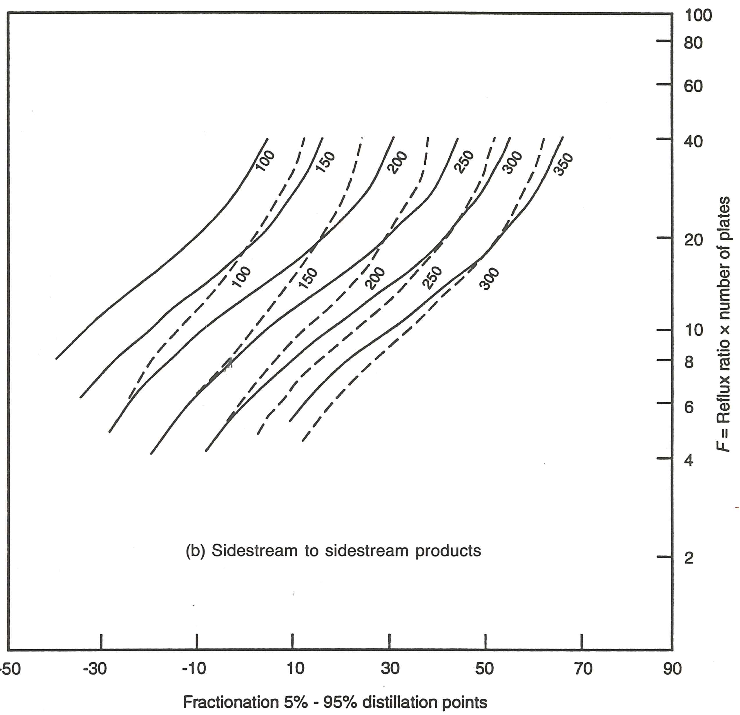
Using the correlations in Figure 4.13, calculate how many plates will be needed between kerosene and light gas oil (LGO) draw-off trays to obtain a 10°F ASTM gap between kerosene products. The TPB 50% temperatures are 300° F and 550° F for kerosene and diesel products, respectively. The reflux ratio is given as 0.5. Consider a) no steam for stripping, b) maximum steam for stripping. Comment on the results. 40 pts
Instructions for Submitting your Answers:
Once you have a solution to the exercises, you will submit your answers as a PDF to be graded. Please follow the instructions below.
- Find the Exercise 3 assignment in the Lesson 4 Module by either clicking Next until you find it, or by clicking Assignments and scrolling down until you find it.
- Make sure that your name is in the document title before uploading it to the correct assignment (i.e. Lesson4_Exercise3_Tom Smith).
Quiz 2
All quizzes are located in the Quizzes folder in Canvas. Quiz 2 will cover the topics in Lessons 3 and 4.
Self-Check Questions
Take a few minutes to answer the questions below to check your knowledge before taking the quiz or submitting your exercises.
Summary and Final Tasks
Summary
Distillation, a key separation process in petroleum refining, is considered as a gateway to all refinery processes. Fractionation of crude oil by distillation into a number of streams generates feedstocks for all the subsequent separation, conversion, and finishing processes that lead to the refinery
products. Prior to distillation, crude oil is subjected to desalting to remove in particular the Cl¯ion to prevent corrosion in downstream processes. Both atmospheric and vacuum distillation processes are used to separate the desired fractions from crude oil which has a boiling range of over a 1000° F. Three different distillation methods used in the laboratory include True Boiling Point distillation, used for characterization of crude oils, ASTM distillation for product characterization, and Equilibrium Flash Vaporization for conducting efficient flash operations in the refinery. The performance of an atmospheric distillation column can be monitored through using the ASTM distillation data obtained for the distillate products. The three parameters that control the performance of a distillation column in terms of the quality of separation achieved in the process are a number of plates, reflux ratio, and the amount of steam used in the operations. Empirical correlation relates these three factors to control the quality of separation in an operating distillation column or help design a new distillation column.
Learning Outcomes
You should now be able to:
- compare and evaluate different distillation methods;
- define boiling point ranges (TBP) of distillation fractions of crude oil;
- identify and exemplify distillation terminology, including cut points and product yields in distillation ranges;
- illustrate the crude fractionation in Atmospheric Distillation and calculate the extent of separation between the distillation fractions;
- analyze the vapor-liquid equilibrium and evaluate the application of Fenske Equation to distillation in Light Ends Unit;
- illustrate Vacuum Distillation and assess the application of Watson Characterization Factor to select the temperature in Vacuum Distillation Tower.
Reminder - Complete all of the Lesson 4 tasks!
You have reached the end of Lesson 4! Double-check the to-do list below to make sure you have completed all of the activities listed there before you begin Lesson 5. Please refer to the Course Syllabus for specific time frames and due dates. Specific directions for the assignments below can be found within this lesson.
| Reading | J. H. Gary and G. E. Handwerk, Chapter 4 (Crude Distillation) |
|---|---|
| Assignments | Exercise 3: Submit your answers to the Exercise 3 assignment in the Lesson 4 Module. Quiz 2: Will cover the material in Lessons 3 and 4. |
Questions?
If you have any questions, please post them to our Help Discussion (not email), located in Canvas. I will check that discussion forum daily to respond. While you are there, feel free to post your own responses if you, too, are able to help out a classmate.
Lesson 5: Separation Processes 2
Lesson 5 Overview
Overview
Video: FSC 432 Lesson 5 (3:29)
Hello. In lesson five, we will pick up the second part of the separation processes. Remember in lesson four, we've talked about distillation as perhaps the most significant separation process.
In this lesson, we will start with the light ends unit. You know that the light ends unit process the lightest fraction of crude oil. We call it the overhead from the distillation column. It ends up as LPG. That is propylene and butane, and the naphtha fractions that are very important for producing gasoline.
Now, since this is the lightest fraction of crude oil, it's simpler in its molecular makeup, so we can begin actually to see individual compounds. So we can use analytical data, like vapor liquid equilibrium, and we could use analytics expressions, equations like Fenske equations to make calculations about the separation of these components, like propane from butane and so forth.
Now, distillation is, of course, one and the most important separation process, but there are other processes that would use other physical properties like the solvent power of compounds, of chemicals. Now, one such technique is called solvent extraction. We could use solvent extraction to fraction the residue that comes from distillation rather than this atmospheric or vacuum distillation residue. It is more common to have the vacuum distillation residue that goes into the solvent fractionation processes.
One important solvent technique is deasphalting, which is done to remove asphalt, the stuff that you put on the road for pavement, and the function, the principal objective of deasphalting is not to make asphalt, really. It is a byproduct, but it to remove asphalt, so what remains after removing the asphalt from the residue could be used for producing more fuels and other more relevant products in downstream processing in a petroleum refinery.
Here you'll see a sample of asphalt that is produced by the deasphalting process by rejecting it from the crude oil using the anti-solvent behavior for anti-solvent phenomenon in the deasphalting process. You can see this is pure asphalt. You need to mix that with aggregates to pave the roads so the bottom of the barrel is solid form here.
Another solvent extraction process is called dewaxing. That removes wax. This is the candle wax, the paraffin wax that we know. Again, the purpose here is not to make candle wax but to remove wax from this heavy fraction of crude oil so that what is left over is a good base stock to make lubricating oils or engine oils.
Overview
This section will continue to discuss the separation processes that are carried out on the distillate products obtained from the atmospheric and vacuum distillation units, and the residue from the vacuum distillation unit, as introduced in Section 4. Light Ends Unit (LEU) fractionates the lightest fraction of crude oil obtained as overhead distillate from the atmospheric column in a series of distillation towers to produce LPG as a refinery product and straight-run light, and heavy naphtha for further processing in finishing and conversion units to produce gasoline streams for the blending pool (Section 3). Vacuum distillation residue (VDR) can be fractionated using solvent extraction (deasphalting) to produce an insoluble (asphalt) and a soluble fraction, deasphalted oil (DAO). DAO can be further processed by freezing point separation in a suitable solvent to separate wax. The remaining dewaxed oil is used as base stock for producing lubricating oil. Heavy vacuum gas oil (HVGO) can also be used as a feedstock for dewaxing.
Learning Outcomes
By the end of this lesson, you should be able to:
- analyze the vapor-liquid equilibrium and evaluate the application of Fenske Equation to distillation in Light Ends Unit;
- describe the principles of solvent fractionation as a separation technique;
- place the Deasphalting Process in the refinery and interpret the significance of this process for refining;
- interpret the gradient solubility model that explains the solution of asphaltenes in resin and oil fractions and analyze the structure of asphaltenes;
- analyze the process parameters for deasphalting and assess the anti-solvent effect;
- evaluate the unit operations of deasphalting and assemble the process flow diagram;
- explain the purpose of dewaxing and examine the physical and chemical dewaxing processes.
What is due for Lesson 5?
This lesson will take us one week to complete. Please refer to the Course Syllabus for specific time frames and due dates. Specific directions for the assignments below can be found on the Assignments page within this lesson.
| Readings | J. H. Gary and G. E. Handwerk, Mark J. Kaiser, Chapter 15 (Lubricating Oil Feedstocks) |
|---|---|
| Assignments | Exam 1 will cover the material in Lessons 1-5. Exam 1 is found in the Exam 1 Module. Exercise 4:
|
Questions?
If you have any questions, please post them to our Help Discussion Forum (not email), located in Canvas. I will check that discussion forum daily to respond. While you are there, feel free to post your own responses if you, too, are able to help out a classmate.
Fractionation in Light Ends Unit (LEU)
Fractionation in Light Ends Unit (LEU)
Because of the low molecular weight and high volatility of the constituents in the overhead distillate, the feedstock to LEU can be analyzed on a molecular basis, using, for example, a gas chromatograph. The hydrocarbon range in overhead distillate (over a boiling point of gas to 380°F mid-boiling point) covers carbon numbers C1 through C10. Because of the relatively simple composition of this feed, the quality of separation in LEU units can be defined in terms of the concentrations of selected hydrocarbon compounds such as propane, butane, and i- butane. Remember that one needs to use the distillation data to define the quality of separation (in terms of ASTM gap, or ASTM overlap) between the adjacent cuts obtained from the side of atmospheric distillation column (Lesson 4).
Figure 5.1 shows the separation scheme in light end towers, where the feed is separated into the distillate (low-boiling point) and bottom (high-boiling point) fractions. Considering a depropanizer unit, the distillate will consist mainly of propane and lighter compounds, whereas the bottoms will contain butane and heavier hydrocarbons. To determine the degree of separation in the light end towers, the first step is to select the key components, which may be real compounds (such as butane, or i-butane), or a pseudo component which is defined by the mid-boiling point of the boiling range (i.e., temperature at which 50%vol of the selected component is evaporated). Two key components (light key and heavy key) must be selected using the two selection rules, as shown in Figure 5.1.
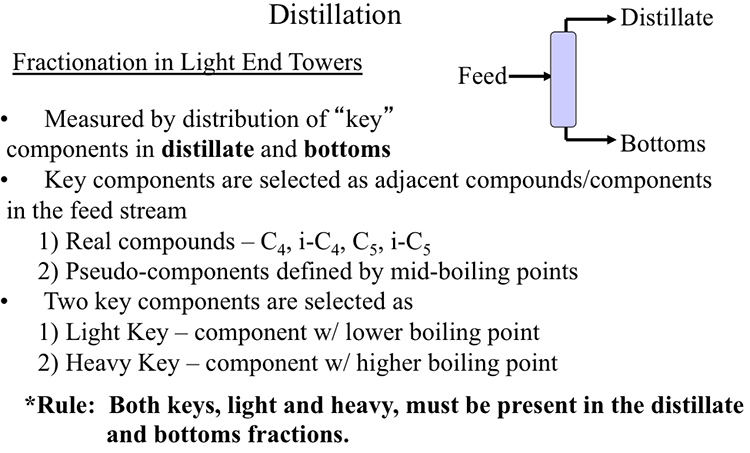
Fractionation in Light End Towers
- Measured by the distribution of “key” components in distillate and bottoms.
-Key components are selected as adjacent compounds/components in the feed stream
1) real compounds – C4, i-C4, C5, i-C5
2) Pseudo-components defined by mid-boiling points
-Two key components are selected as
1) Light Key – component with a lower boiling point
2) Heavy Key – component with a higher boiling point
The key component selection rules are:
- Light key and heavy key should be adjacent compounds (in terms of boiling points) in the feed stream.
- Both light key and heavy key must be present in the distillate and bottom fractions.
Once the key components are selected, their concentrations in the distillate and bottom fractions and their respective vapor liquid equilibrium coefficients (K values) can be used in the Fenske Equation to calculate the number of theoretical plates (including a reboiler) needed in the distillation column under the ideal condition of total reflux (100% reflux). Figure 5.2 shows the Fenske Equation and defines all the terms used in the equation. The ideal conditions assumed for using the Fenske Equation include 100% plate efficiency (for perfect separation in a plate) and total reflux in the column where no product is drawn as distillate. Total reflux means the whole overhead product is refluxed back to the column. Obviously, to get data on an actual (not an ideal) case of distillation, one needs to make two corrections to obtain the actual number of plates from the number of theoretical plates used in, or calculated by the Fenske Equation: 1) by assuming an actual plate efficiency to correct for 100% plate efficiency), 2) by assuming a correction factor to correct from total reflux (or infinite reflux ratio to the operational (actual) reflux conditions).
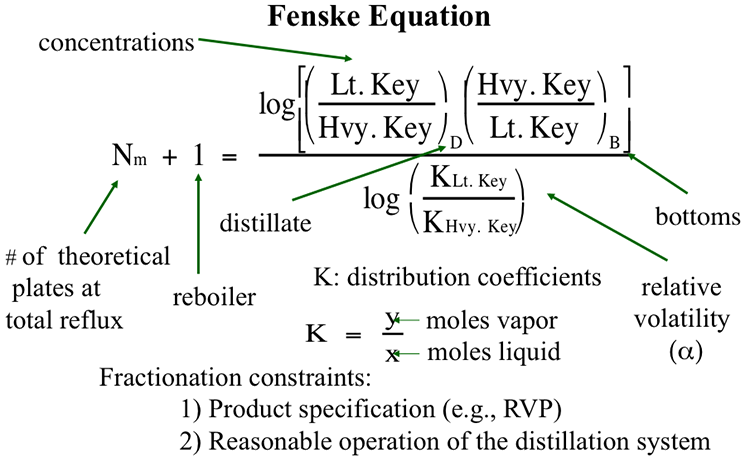
It is common to use an actual plate efficiency of 75% (for plate efficiency correction), and a correction factor of 1.5 (for reflux ratio correction) for the operation under a finite (actual) reflux ratio from the total reflux condition. Therefore, these corrections could be made as follows:
# [actual plates (at 75% efficiency) at total reflux] = [theoretical # plates (at 100% efficiency)]/0.75
# [actual plates (at normal reflux)] = 1.5 x [actual plates (at 75% efficiency) at total reflux]
In other words, making both corrections from #theoretical plates used in Fenske equation to #actual plates after both corrections (for plate efficiency and reflux conditions) would give:
# actual plates = ([#theoretical plates used in Fenske Equation]/0.75) x 1.5
Exercise
Exercise
Using the problem definition given in Figure 5.3, calculate n-C4 flow rate in the distillate product, if the debutanizer column has 18 (actual) plates.
Constraint:
The concentration of i- C5 should be <1 mole% of total C4’s and lighter compounds in the distillate product.
Given:
Column efficiency =75%, Reflux correction factor =1.5
Mean tower conditions: 210°F and 110 psig
Select appropriate light and heavy keys, and use the K values for the corresponding key compounds using the chart given in Figure 5.4 at the mean tower conditions.
Instructions for Submitting Your Answers:
Once you have calculated your answer, post it in the Exercises Dropbox inside the Lesson 5 folder in Canvas.
If possible, submit a Microsoft Word, or Excel document, showing all the steps in your calculations, indicate the K values you read from the nomograms, and assumptions, if any. You may submit scanned images or clear handwritten pages as a pdf that is less than 2 MB in size.
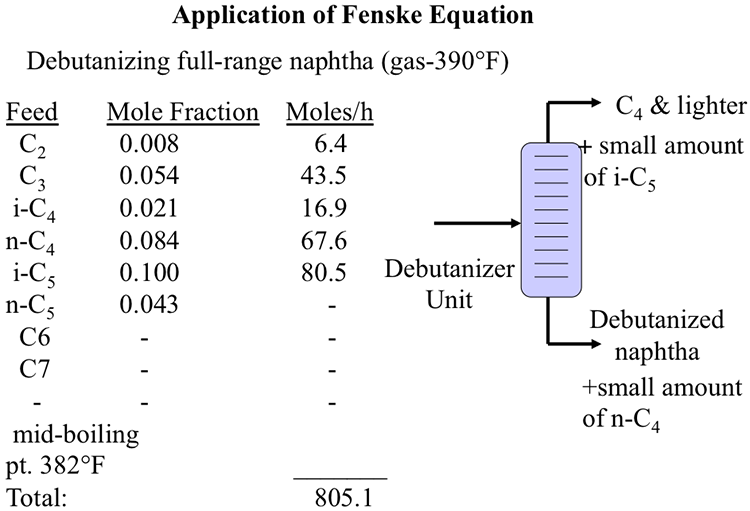
Application of Fenske Equation
Image shows a debutanizer unit which splits full-range naphtha (gas – 390*) into C4 & lighter (with small amounts of i-C5) and debutanized naphtha (and a small amount of n-C4)
It also notes that the mid-boiling point is 382*F and that the total is 805.1
| Feed | Mole Fraction | Moles/h |
|---|---|---|
| C2 | 0.008 | 6.4 |
| C3 | 0.054 | 43.5 |
| i-C4 | 0.021 | 16.9 |
| C4 | 0.084 | 67.6 |
| i-C5 | 0.1 | 80.5 |
| C5 | 0.043 | - |
| C6 | - | - |
| C7 | - | - |
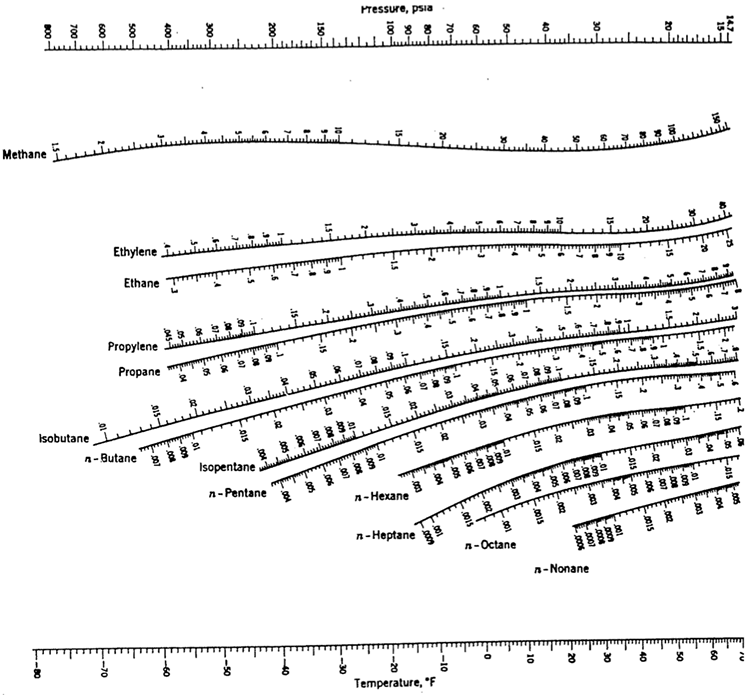
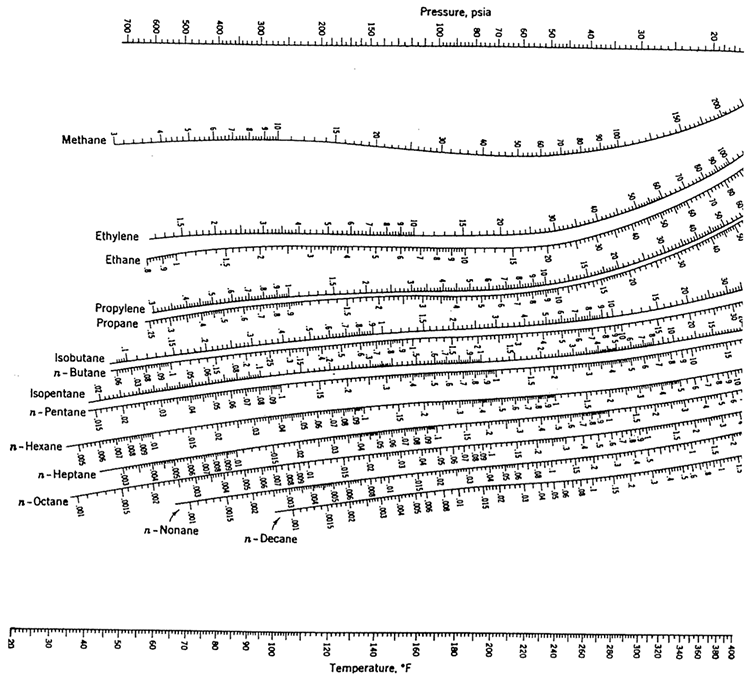
Deasphalting
Deasphalting
While distillation achieves separation/fractionation of the feed components with respect to differences in their boiling point, deasphalting (as a solvent extraction process) fractionates the feedstock, atmospheric, or more often vacuum distillation residue (VDR), with respect to solubility/insolubility of molecular components in a given solvent. Figure 5.5 shows a solvent fractionation scheme used in laboratories to separate VDR into fractions that are defined based on the solubility behavior. VDR, which could be a solid at ambient temperature, is completely dissolved in aromatic solvents such as benzene and toluene. The highest molecular weight components of VDR classified as “asphaltene” can be separated by precipitation (as solid material) when a light paraffin solvent is mixed with VDR solubilized in an aromatic solvent (e.g., toluene). The paraffin solvent used (e.g., n-heptane) defines the identity of the separated asphaltenes (e.g., toluene soluble and n-heptane insolubles). The portion of VDR that is soluble in the paraffin solvent is called maltenes, but also labeled with respect to the solvent used in the separation, i.e., n-heptane maltenes. As can be seen in Figure 5.5, the n-heptane solubles can further be separated using n-pentane (a lighter and a weaker solvent) into insoluble (hard resin) and soluble (n-pentane solubles) fractions. The n-pentane solubles can also be separated using a lighter solvent yet (propane) to soft resin and oil products. In refinery practice, only one stage of separation is used, using the lightest solvent (e.g., propane) to produce asphalt and deasphalted oil (DAO) fractions, as discussed later in this section.
Asphaltenes consist of high-molecular weight compounds with strong aromatic character and contain the highest concentrations of heteroatom (S, N, and metal) species. Because of the low H/C ratio of asphaltenes and resins, the deasphalting process can be considered as a “carbon rejection” process, yielding a high H/C ratio product (i.e., oil) after removing the asphaltenes and resins, as, typically, lower value byproducts.
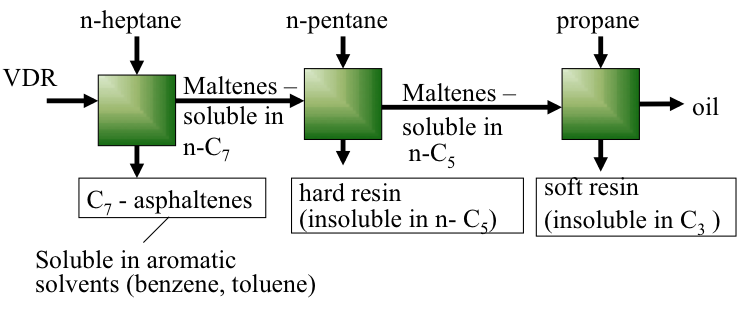
Gradient Solubility Model
Gradient Solubility Model
Because of the large disparity in structure and properties of asphaltenes and oil fractions in VDR, it is surprising that VDR appears as a solution (one-phase material) rather than a suspension of discrete asphaltene particles in VDR. A commonly accepted hypothesis to explain the single phase observed with VDR is known as the gradient solubility model, illustrated in Figure 5.6. The model claims that asphaltene molecules (depicted as dark spheres in Figure 5.6a) can be dissolved in resins (light spheres) and the resulting solution can be dissolved in oil (wiggly lines), thus producing a single phase solution. Some model molecular structures proposed for asphaltenes are shown in Figures 5.6b and 5.6c. There is a more widespread acceptance of the smaller molecular structures shown in 6c, as better representatives of asphaltenes molecules among the asphaltene researchers.
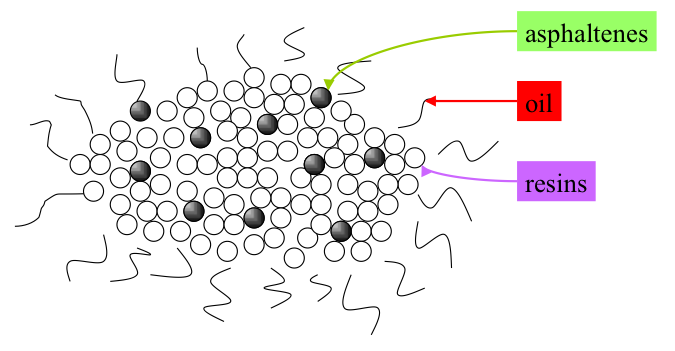

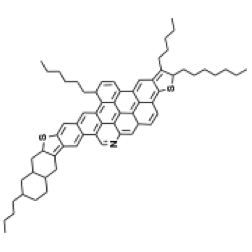
The gradient solubility model offers an explanation of how asphaltenes can be forced out of the solution in VDR by solvent extraction. Briefly, the solubility of a compound in a given solvent depends on the strength of the solvent that is measured by Hildebrand Solubility Parameters (HSP) for non-polar solvents. The two definitions of HSP are given in Figure 5.7, indicating the dependence of the parameter values on surface tension and molar volume of the solvent (1st Hildebrand parameter), or on the energy of vaporization (heat necessary to evaporate the solvent under constant volume conditions) and molar volume (2nd Hildebrand Parameter), respectively. These parameters correlate well with one another, and each can be used without any preference to express the dissolving power of a solvent. A discussion of the Solution Theory is beyond the scope of this course, but it would suffice to consider that solubility parameter increases with the increasing density (decreasing molar volume) and increasing surface tension, or increasing latent heat of vaporization. This explains why aromatic solvents have higher solvent power than aliphatic hydrocarbons, and why the solvent power of paraffins decreases with the decreasing carbon number.
It is now possible to explain that using a large volume of a paraffin solvent, added to dissolved VDR in a laboratory experiment, effectively disrupts the gradient solubility of asphaltenes, and as a result, asphaltenes precipitate as solid particles and can be filtered out for recovery. In refinery deasphalting process, however, e.g., in propane deasphalting [1], lower quantities of solvent (or lower solvent to resid (S/R) ratio) is used to separate asphalt (asphaltenes + resins) and deasphalted oil (DAO).
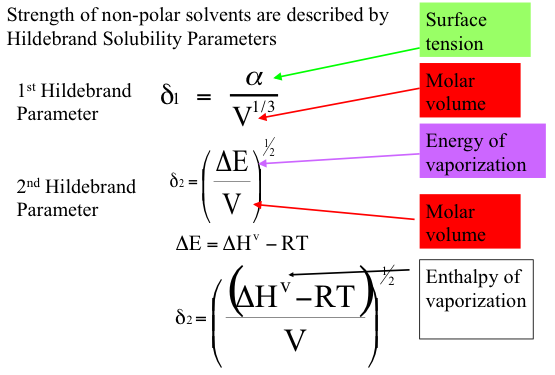
Strength of non-polar solvents are described by Hildebrand Solubility Parameters.
1st Hildebrand Parameter:
$$\delta _ { 1 } = \frac { \alpha } { V ^ { 1 / 3 } }$$
2nd Hildebrand Parameter:
$$\delta _ { 2 } = ( \frac { \Delta E } { V } ) ^ { 1 / 2 }$$
$$\Delta E = \Delta H ^ { v } – RT$$
$$\delta _ { 2 } = ( \frac { ( \Delta H ^ { v } - R T ) } { V } ) ^ { 1 / 2 }$$
Key: α = Surface Tension, V = Molar Volume; ΔE = Energy of Vaporization;ΔH=Enthalpy of Vaporization
[1] Petroleum Refining, by J. H. Gary, G. E. Handwerk, M. J. Kaiser, 5th Edition, CRC Press NY, 2007, Chapter 15, pp.311-312.
Deasphalting Process
Deasphalting Process
Figure 5.8 places the deasphalting process in a refinery flow scheme as an intermediate process between vacuum distillation and dewaxing processes, for producing the refinery output streams as asphalt deasphalted oil (DAO), which can be directed to another separation process, dewaxing, to produce lubricating oil base stock and wax, or can be sent to conversion units such as hydrocracking to produce light and middle distillate fuels. It is important to note that the deasphalting process is an upgrading process to transform VDR into marketable products, and/or convert it to distillate fuels that command high demands.
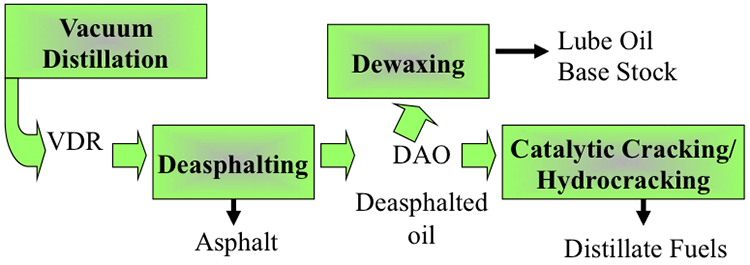
The two objectives of the deasphalting process are:
- Produce asphalt - as final product.
- Remove asphaltenes to prevent coke, or metal buildup on catalyst in further processing of DAO.
Depending on the properties of the VDR and prevailing markets, the emphasis could be placed on one of these objectives. Remember that aromatic asphaltic crudes are more expensive to convert into distillate fuels. Such crudes could be processed readily into making high yields of asphalt and serve the asphalt market. With lighter crudes, the principal focus could be on removing the asphaltenes from VDR so that DAO produced can be used in conversion processes with a lower extent of problems caused by asphaltenes such as coke buildup, or metals buildup on catalysts in, for example, hydrotreating or hydrocracking reactions.
Simplified Flow Diagram of a Deasphalting Process
Simplified Flow Diagram of a Deasphalting Process
Figure 5.9 shows a simplified flow diagram of a propane deasphalting process. See a more detailed flow diagram in your textbook, along with a description of the operating conditions in the commercial process. As the first step in deasphalting, residue (feedstock) is mixed with four to eight times the volume of liquid propane. Heavier residua require a higher solvent to residue (S/R ) ratio for effective separation of asphalt. Following the precipitation of asphalt, DAO, and asphalt are separated, and each stream is purified and flashed to recover and recycle the propane solvent, as shown in Figure 5.9.
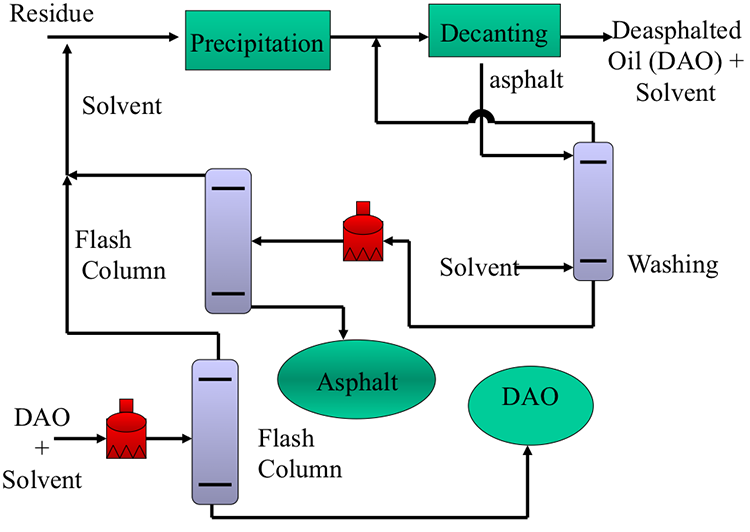
The four-unit operations of deasphalting illustrated in the process flow diagram are:
- Flocculation (& precipitation) of asphaltenes
- Asphalt decanting - separation
- Asphalt washing - to remove entrained oil
- Solvent recovery and recycle
[1] Petroleum Refining, by J. H. Gary, G. E. Handwerk, M. J. Kaiser, 5th Edition, CRC Press NY, 2007, Chapter 15, pp.311-312.
Asphaltene Yield
Asphaltene Yield
Independent variables in the deasphalting process include the solvent used, pressure, temperature, S/R, and contact time. These variables can be controlled to obtain the optimum conditions for the desired separation in deasphalting. One of the important dependent variables in the process is the asphaltene yield. Figure 5.10 shows, in qualitative plots, how asphaltene yield varies as a function of the process parameters.
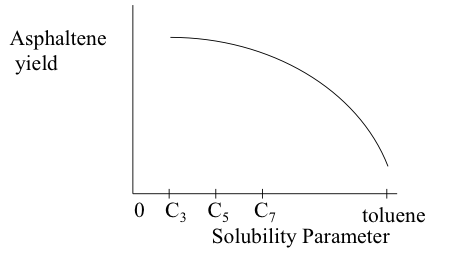
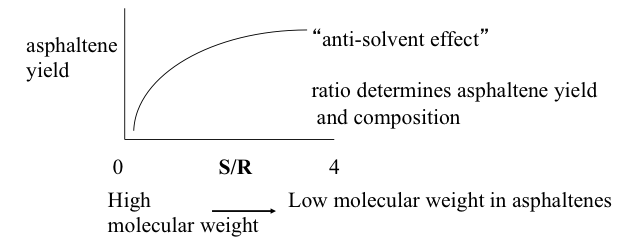
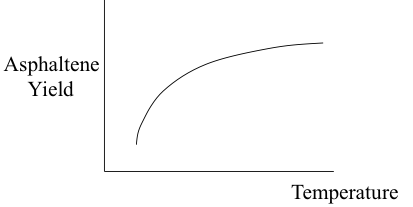
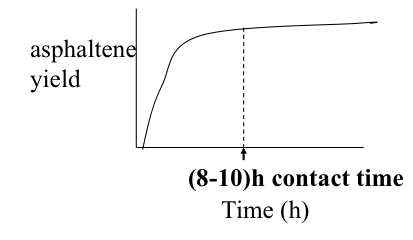
Solubility Parameter of the Solvent
Solubility Parameter of the Solvent
Solubility parameter of the solvent is a key a variable that affects asphaltene yield. Asphaltene is completely soluble in toluene, which has a high solubility parameter. Therefore, the asphaltene yield with toluene will be zero (Figure 5.10a). Propane (C3,) which has the lowest solubility parameter among the solvents given in the plot, will give the highest asphaltene yield.
Figure 5.10b shows that asphaltene yield increases with the increasing solvent/residue ratio used in the process. This is an unusual behavior for solvent extraction because, typically, the yield of an insoluble fraction would decrease with the increasing quantity of solvent used in the extraction behavior. The unusual behavior seen in Fig. 5.10b is termed as the “anti-solvent effect.” This relates to the gradient theory of asphaltene solubility in crude oil (or in VDR) such that larger quantities of paraffin solvent used in the process more effectively disrupt the gradient solubility by removing more oils from VDR, forcing the asphalt fraction (asphaltene+resin) to separate out. One should point out here that the molecular composition of the asphaltenes would vary significantly along with the yield of asphaltenes in the plot shown in Figure 5.10b. As the yield of asphaltenes increases with the increasing S/R, lower molecular weight asphaltenes would be progressively included in the separated asphaltenes. In other words, for a given process, low yields of asphaltenes (obtained at low S/R) would contain the highest molecular weight and highly aromatic compounds, whereas asphaltenes obtained at high yield with high SR ratio would include a broader range of molecular weight and aromaticity in the separated asphaltenes.
The consideration of variable asphaltene composition would also apply to the asphaltenes separated with different paraffin solvents, as shown in Figure 5.4b. In this case, lower yields of asphaltenes obtained with C7 (n-heptane) will be associated with heavier and more aromatic asphaltenes than those obtained with propane (C3). These observations relate to the absence of a precise molecular definition to express the complex of asphaltenes, but the need to use an operational definition on the basis of solubility/insolubility in a given solvent. It should, therefore, be remembered that the composition of the asphaltenes, or asphalt produced in a refinery would not only depend on the properties and composition of the parent crude oil, but also on the solvent, as well as the S/R ratio used in the process among other factors, such as temperature and pressure as they affect the solubility parameters of the solvent. Figure 5.10c shows the dependence of asphaltene yield on temperature, as explained by the decreasing solubility parameter of the solvent used in this case with the increasing temperature. A sufficient amount of contact time with paraffin is necessary for good asphaltene separation. The 8-10 h contact time refers to batch experiments in the laboratory. In flow systems of commercial deasphalting, the contact time necessary for the desired separation of asphalt is much shorter.
Dewaxing
Dewaxing
Another important separation process in petroleum refining is removal of wax. The process of dewaxing is introduced and discussed in the next subsection.
Figure 5.11 locates the dewaxing process in the refinery landscape. The feedstocks to dewaxing include DAO from deasphalting, and HVGO from vacuum distillation as shown in Figure 5.11 along with some compositional characteristics of the feedstock and the dewaxing product. Note that wax (long-chain paraffins) obtained in dewaxing is a marketable by-product. Lubricating oil base stock is the principal product of interest. The main purpose of dewaxing is to remove hydrocarbons that solidify readily (i.e., wax) for making lubricating oil base stock with low pour points (-9 to 14°F).
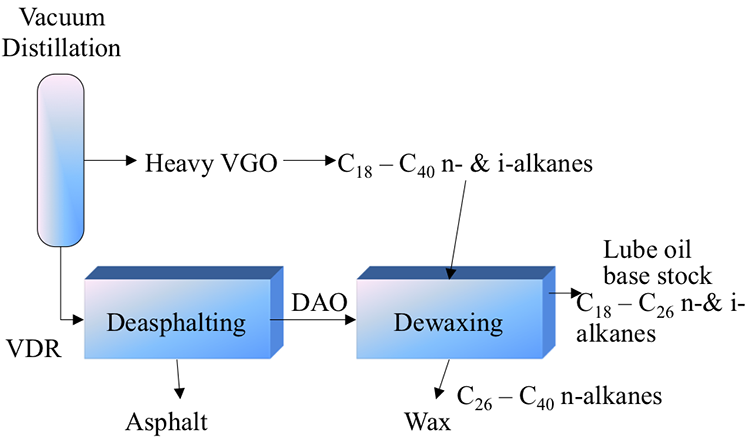
In addition to low pour points, other important properties of lube oil base stocks include:
- Volatility – should be low to keep oil in the liquid phase during engine operation. Vapors are not good lubricants.
- Viscosity– important to control because of lubrication and heat transfer considerations. Moderate viscosities are desired. Low viscosity may not provide the required lubrication and lead to high friction between metal parts. High viscosity causes loss of energy.
- Viscosity Index (change in viscosity with temperature) – small change in viscosity is desired over a wide temperature oil, i.e., high viscosity index (HVI). HVI ensures that the lube oil functions well at both cold start and at high temperatures generated by the engines.
- Thermal Stability – High thermal stability (or small degree of thermal degradation at high temperatures) is necessary to minimize viscosity loss and coke deposition on metal surfaces.
All of these properties depend on the molecular composition of the hydrocarbons constituting the lubricating oil base stocks. Commercial engine oils and other commercial lube oils are formulated with chemical additives that would enhance the performance of the base stocks.
Two commercial methods of dewaxing are:
- Solvent dewaxing - physical process; separation of wax by freezing and solvent transport.
- Catalytic dewaxing - chemical process; removal of wax by selective reaction of long chain n-alkanes (wax).
Solvent Dewaxing
Solvent Dewaxing
Figure 5.12 shows a general scheme of solvent dewaxing that uses stage-wise refrigeration of the feedstock after it is mixed with the solvent. The lowest temperature used in the refrigeration cascade depends on the desired pour point of the lube oil's base stock product. Upon refrigeration, wax compounds solidify to form crystals. Wax crystals are carried in the solvent to a rotary filter, where wax is separated on a filter cloth covering the rotating drum. The layer of wax (filter cake) on the drum is scraped from the filter by a blade and carried away in a solvent stream to a steam-stripping unit to recover and recycle the solvent separated from the wax product. The wax product, called slack wax, can be used to make paraffin wax for candles, microwax used in the cosmetics industry, and petrolatum for petroleum jelly. The dewaxed oil from the filtration unit is also steam stripped to recover the solvent to produce the lube oil base stock.
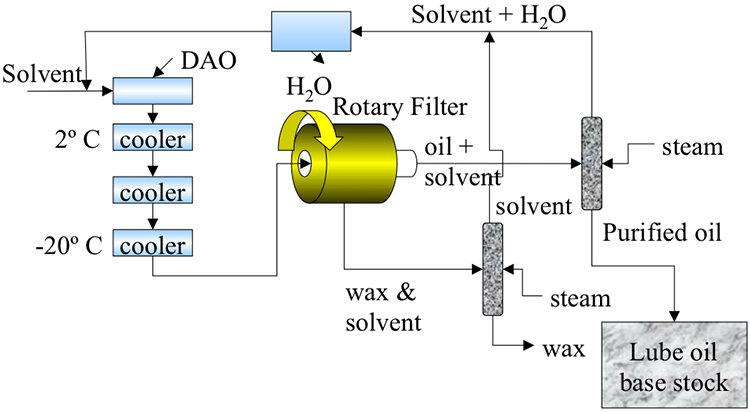
The two principal solvents used in solvent dewaxing units are methyl ethyl ketone (MEK) and propane. Although the majority of dewaxing units in the U.S. refineries use MEK), some advantages of using propane as a solvent compared to MEK include the following [2]:
- Propane is used both as a diluent and as a refrigerant
- Lower capital investment
- Refrigeration energy savings
- Higher filtration rates
- Rejection of asphaltenes and resins in the feed
- Higher VI than ketone dewaxing
[2] Petroleum Refining, by J. H. Gary, G. E. Handwerk, M. J. Kaiser, 5th Edition, CRC Press NY, 2007, Chapter 15, pp.318-321.
Catalytic Dewaxing
Catalytic Dewaxing
Although included under the separation processes, catalytic dewaxing is actually a low-severity conversion process involving a selective catalytic cracking of n-paraffins. Because of removing wax (long chain n-paraffins) by chemical reaction, the process is called dewaxing. The selective cracking of n-alkanes takes place in the pores of molecular sieve catalysts (zeolites) with pore openings in the order of 0.6nm, which keep i-paraffins out because of their larger size due to branching in the hydrocarbon skeleton, as shown in Figure 5.13. This selective cracking increases the ratio of i-paraffins to n-paraffins in the product and lowers its pour point. Hydrogen is introduced along with the feed to prevent coking on the catalyst surfaces (Figure 5.14). The cracking of n-paraffins produces distillate fuels such as gasoline as a by-product from catalytic dewaxing.
The advantages of catalytic dewaxing include [3]:
- production of lube base stock with lower pour point and in higher yield compared to the product obtained from solvent dewaxing. Low yield from solvent dewaxing results from the difficulty of separating the oil from the wax;
- lower capital investment;
- good product stability;
- flexibility to produce both lube oil base stock and light distillates.
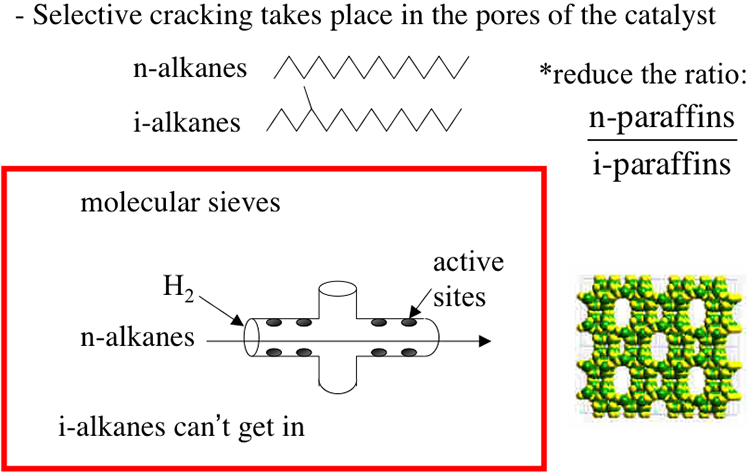
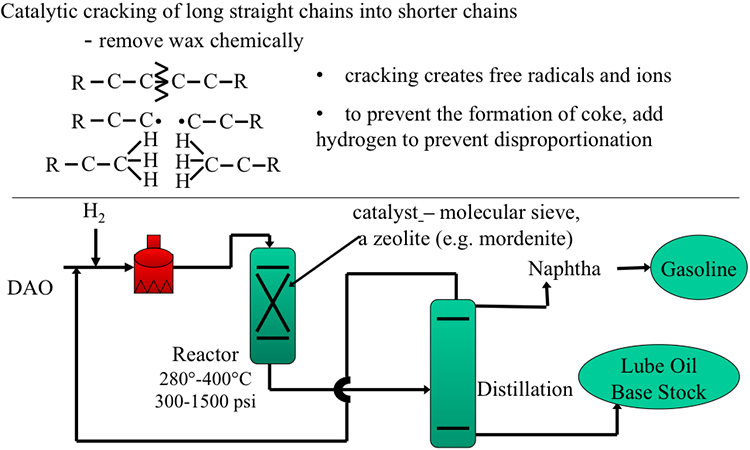
Image Reads:
Catalytic cracking of long straight chains into shorter chains
-Remove wax chemically
-cracking creates free radicals
-to prevent the formation of coke, add hydrogen to prevent disproportionation
The image also includes a simplified diagram:
DAO enters a heater with hydrogen gas present, then it goes into a reactor, 280°-400°C, at 300-1500 psi. In the reactor, there is a catalyst – a molecular sieve, a zeolite (e.g. mordenite). From there it goes to distillation which separates naphtha (becomes gasoline) and lube oil base stock.
[3] Petroleum Refining, by J. H. Gary, G. E. Handwerk, M. J. Kaiser, 5th Edition, CRC Press NY, 2007, Chapter 15, pp.321-322.
Self-Check Questions
Please take a few minutes to answer the questions before attempting this week's assessments. Click Check when you are happy with your answers.
Assignments
Assignment Reminder
Each week, you will be required to do a number of assignments. This week, in addition to the reading assignments listed on the overview page, Exercise 4 is due as well as Exam 1 which will cover everything in Lesson 1-5.
Exam 1
Exam 1 will cover the material in Lessons 1-5. Check the Syllabus and Course Calendar for Exam 1 schedule and venue.
Exercise 4
Exercise 4 Instructions
Work on the questions using MS Word, Excel, or PowerPoint and save your work as a PDF to submit to the assignment which accepts only PDF documents. Submit both parts of this exercise as one PDF document.
Part 1:
Using the problem definition given in Figure 5.3 below, calculate the n-C4 flow rate in the distillate product, if the debutanizer column has 18 (actual) plates.
Constraint:
The concentration of i- C5 should be <1 mole% of total C4’s and lighter compounds in the distillate product.
Given:
Column efficiency =75%, Reflux correction factor =1.5
Mean tower conditions : 210°F and 110 psig
Select appropriate light and heavy keys, and use the K values for the corresponding key compounds using the chart given in Figure 5.4 at the mean tower conditions.
Application of Fenske Equation
Image shows a debutanizer unit which splits full-range naphtha (gas – 390*) into C4 & lighter (with small amounts of i-C5) and debutanized naphtha (and a small amount of n-C4)
It also notes that the mid-boiling point is 382*F and that the total is 805.1
| Feed | Mole Fraction | Moles/h |
|---|---|---|
| C2 | 0.008 | 6.4 |
| C3 | 0.054 | 43.5 |
| i-C4 | 0.021 | 16.9 |
| C4 | 0.084 | 67.6 |
| i-C5 | 0.1 | 80.5 |
| C5 | 0.043 | - |
| C6 | - | - |
| C7 | - | - |
Part 2:
A refinery in Northwest Pennsylvania produces asphalt as an important product that brings revenue, particularly during the summer months. In late fall this refinery switches operations to produce more fuel oil from VDR for the coming winter months, producing still some asphalt, but in lower quantity. Explain which of the following switches will take place in the refinery in about a month, and why? 40 pts
a) Switch the deasphalting solvent from propane to pentane.
b) Switch the deasphalting solvent from pentane to propane.
Would the summer, or winter asphalt product be “heavier”? Explain why.
Instructions for Submitting Your Answers
Submit your answers as a PDF in the Exercise 4 assignment inside the Lesson 5 Module, showing all the steps in your calculations, indicate the K values you read from the nomograms, and state your assumptions, if any.
Important Note: You may submit scanned images or clear handwritten pages as a PDF that is less than 2 MB in size for this exercise. The scanned pages should relate to using the graphs for solving the problem. The rest should be type-written for ease of reading when grading.
Once you have a solution to the exercises, you will submit your answers as a PDF by uploading your file to be graded.
Please follow the instructions below.
- Find the Exercise 4 assignment in the Lesson 5 Module by either clicking Next until you find it or by clicking Assignments and scrolling down until you find it.
- Make sure that your name is in the document title before uploading it to the correct assignment (i.e. Lesson5_Exercise4_Tom Smith).
Summary and Final Tasks
Summary
Separation of the lowest-boiling fraction of the crude oil is carried out in Light Ends Unit using distillation columns that may yield almost pure products, such as propane and butane. Because of the simple molecular composition of the light ends, it is possible to use the data on vapor liquid equilibrium coefficients of pure compounds. On the heaviest end of the crude oil, Vacuum Distillation Residue can be processed using solvent extraction to separate asphalt from the residue to produce deasphalted oil for further treatment either by dewaxing to produce lubricating oil base stock, or by conversion reactions to produce distillate fuels from the deasphalted oil.
Learning Outcomes
You should now be able to:
- analyze the vapor-liquid equilibrium and evaluate the application of Fenske Equation to distillation in Light Ends Unit;
- describe the principles of solvent fractionation as a separation technique;
- place the Deasphalting Process in the refinery and interpret the significance of this process for refining;
- interpret the gradient solubility model that explains the solution of asphaltenes in resin and oil fractions and analyze the structure of asphaltenes;
- analyze the process parameters for deasphalting and assess the anti-solvent effect;
- evaluate the unit operations of deasphalting and assemble the process flow diagram;
- explain the purpose of dewaxing and examine the physical and chemical dewaxing processes.
Reminder - Complete all of the Lesson 5 tasks!
You have reached the end of Lesson 5! Double-check the to-do list below to make sure you have completed all of the activities listed there before you begin Lesson 6. Please refer to the Course Syllabus for specific time frames and due dates. Specific directions for the assignments below can be found within this lesson.
| Readings | J. H. Gary and G. E. Handwerk, Chapter 15 (Lubricating Oil Feedstocks) |
|---|---|
| Assignments | Exam 1: Will cover the material in Lessons 1-5. Exam 1 is found in the Exam 1 Module. Exercise 4:
|
Questions?
If you have any questions, please post them to our Help Discussion (not email), located in Canvas. I will check that discussion forum daily to respond. While you are there, feel free to post your own responses if you, too, are able to help out a classmate.
Lesson 6: Thermal Conversion Processes
Lesson 6 Overview
Video: FSC 432 Lesson 6 (3:47)
Now, having done all the physical separation processes on the crude oil, such as distillation or deasphalting, dewaxing, we have pretty much squeezed out what we could from the crude oil. But the yield of these products, particularly the light distillates like gasoline or kerosene, does not really meet the demand. The larger demand for distillate fuels, particularly gasoline, started with the introduction of the mass-produced automobile Model T. That's in the 1920s, in essence.
So we need to now change the composition of the crude oil. Separating it into desirable fractions does not cut it anymore. We need to use chemistry. So what does, really, chemistry mean? We need to break bonds and make new bonds.
The first chemical process introduced right around that time, thermal cracking process, meant to convert these heavier hydrocarbons, longer chains of paraffins, to the light distillates or the gasoline boiling range. By breaking these bonds by brutal heat, heating these temperatures until they cracked, pretty much, until the compounds crack or break the chemical bonds. So the thermal cracking process delivers the gasoline that was needed for the automobiles that were introduced at the time.
Currently, thermal cracking is not a significant process in a refinery in the US because the gasoline produced from thermal cracking would not really work in the current automobiles that require higher octane number fuel. And that is the reason why, pretty quickly, right around the Second World War, the catalytic cracking processes were introduced, making higher octane gasoline.
Now, there's a chemical difference between thermal cracking and catalytic cracking that is beyond just using catalysts in cat cracking processes. That is the chemistry of reactive species. Now, thermal cracking proceeds through neutral reactive species that we call free radicals. The chain reaction of free radicals govern the thermal cracking process, whereas, as we'll see in the next lesson, ions, charged species, carbocations govern the catalytic cracking process.
Another use for thermal cracking was to really convert the bottom of the barrel, the vacuum distillation residue, into usable products such as fuel oils. And in this breaking process, where we break some bonds to reduce the viscosity of VDR, so we can have a fuel that would flow, that's really a residual fuel oil, or heat the vacuum distillation residue to such temperatures that we pretty much destroy the molecular makeup to make a byproduct, coke, reject carbon through this byproduct to make lighter compounds, lighter distillates, like gasoline, diesel, or kerosene from this very heavy end. So this is essentially a thermal upgrading process.
Overview
Thermal cracking is the first commercial conversion process developed in the early 1900s principally to produce more motor gasoline from crude oils and produce high-octane gasoline for aircraft use, initiating an attempt to change the composition of crude oil in petroleum refinery. The purpose of thermal cracking is to make light middle distillates from heavier ends by pyrolysis, or thermolysis. With the advent of catalytic cracking in the 1930s and 1940s and its capability to produce higher yields of gasoline with higher octane number, thermal cracking of gas oils has ceased to be an important process for gasoline production in modern refineries. In countries where the principal petroleum fuel with a high demand is diesel fuel, thermal cracking is still important in fuel refineries. A principal application of thermal cracking of distillate fractions in current refineries is limited to naphtha cracking for the purpose of producing ethylene (C2H4) for the petrochemical industry. However, thermal cracking of residual fractions, particularly VDR, is still practiced in association with visbreaking and coking processes in the refineries. The chemistry of thermal cracking and thermal cracking processes is discussed in this section.
Learning Outcomes
By the end of this lesson, you should be able to:
- summarize the chemistry of thermal cracking and free radical chain reactions;
- apply thermal cracking of gas oil to produce lighter distillates and examine how thermal reactivity affects process configuration;
- appraise thermal cracking for upgrading of residual fractions (visbreaking and coking) and interpret thermal severity to compare visbreaking processes;
- analyze and compare different coking processes: Delayed Coking, Fluid Coking and Flexicoking.
What is due for Lesson 6?
This lesson will take us one week to complete. Please refer to the Course Syllabus for specific time frames and due dates. Specific directions for the assignments below can be found on the Assignments page within this lesson.
| Readings | J. H. Gary, G. E. Handwerk, Mark J. Kaiser, Chapter 5 |
|---|---|
| Assignments | Exercise 5: A coil visbreaker operates at 500°C for 1 min. How long will it take to achieve the same thermal severity at 450°C in a soaker visbreaking process? An apparent Arrhenius activation energy for thermal cracking is given as 50 kcal/mol. |
Questions?
If you have any questions, please post them to our Help Discussion (not email), located in Canvas. I will check that discussion forum daily to respond. While you are there, feel free to post your own responses if you, too, are able to help out a classmate.
Chemistry of Thermal Cracking
Chemistry of Thermal Cracking
Thermal cracking produces shorter straight chain alkanes from longer straight chains found in gas oils or other crude oil fractions. Free radicals (reactive species with unpaired electrons, but no electronic charge) are the active species that govern thermal cracking reactions. Because of the free radical chemistry, thermal cracking of gas oil would produce gasoline with relatively low octane numbers, as will be discussed later in this section.
Figure 6.1 lists the three steps of free radical chain reactions as initiation, propagation, and termination. In the figure, R-H represents a paraffin chain which can be expanded such as (H3-(CH2)n – H) where n represents the number of carbon atoms in the alkane. In other words, R represents a radical with an unpaired electron that becomes an alkane (R-H) when combined with a hydrogen atom. A Hydrogen atom with one proton and one electron is the simplest radical.
The free radical chain reaction starts with breaking the weakest C-C bond in the reactant alkane (R-H) to form two free radicals R1 and R2, each with one unpaired electron resulting from the homolysis of the C-C bond (initiation). Once formed by the initiation step, each free radical can go through two different propagation reactions:
- Hydrogen abstraction
- Beta (β) scission
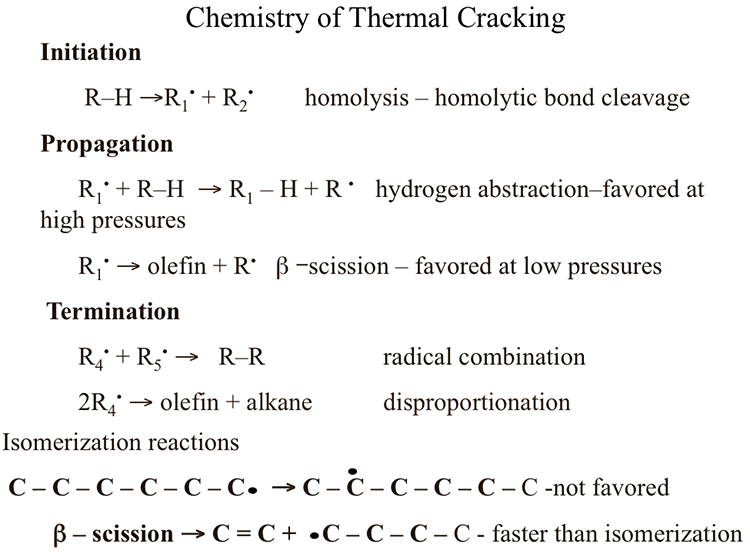
Initiation
R-H → R1• +R2•. Homolysis -homolytic bond cleavage
Propagation
R1• + R-H → R1-H + R•. Hydrogen abstraction – favored at high pressures
R1• → olefin + R•. β Scission – Favored at low pressures
Termination
R4• + R5• → R-R. Radical combinations
2R4• → olefin + alkane. Disproportionation
Isomerization reactions
C – C – C – C – C – C• → C – C• – C – C – C – C. Not favored
C = C + •C – C – C – C. β Scission, faster than isomerization
In a hydrogen abstraction reaction, for example, the radical R1 removes (abstracts) a hydrogen atom from an alkane (R-H) to produce a shorter chain alkane product (R1-H) and a new radical R (hydrogen abstraction), thus propagating the free radical chain. Alternatively, the radical R1, (or R2) can go through a β scission reaction to produce an olefin (ethylene) as a product, and a radical R to propagate the chain. The β scission refers to the breaking of the covalent bond in the β position relative to the position of the unpaired electron, as shown below:

Note that the initiation step produces two free radicals, the propagation step produces a reaction product and one radical to continue the chain. The last step in the chain reaction, the termination step, removes two radicals to produce one or two stable compounds depending on the termination reaction, as seen in Figure 6.1. The principal end result of the free radical chain reactions in thermal cracking is to produce from long chain alkanes shorter-chain alkanes, light olefins, and some aromatic compounds. One important feature of free radical reactions is that isomerization reactions, e.g., shifting of the unpaired electron site from an edge atom of a molecule to the interior atoms (as shown in Figure 6.1), are not favored reactions. In other words, isomerization reactions take place at a slower rate than other propagation reactions, e.g., β scission reaction. The critical importance of this observation is that the thermal cracking reactions produce shorter straight-chain alkanes and olefins without any significant formation of branched-chain (or iso-alkanes). This is the reason why catalytic cracking processes have virtually replaced thermal cracking processes to produce high octane number gasoline, as will be discussed in the next section on catalytic cracking.
Knowledge Check
Please take a few minutes to answer the question below. Click "Check My Answer" to see some feedback.
Check your understanding!
Question: Why is hydrogen abstraction reaction favored over β scission at high pressures?
ANSWER: Hydrogen abstraction is a bimolecular reaction that is favored at high pressures over a monomolecular reaction (β scission).
Thermal Reactivity Considerations in Processing
Thermal Reactivity Considerations in Processing
Management of thermal reactivity is important in thermal cracking processes for optimum conversion of the feeds with a wide boiling range. Figure 6.2 shows an example of a thermal cracking process to convert a heavy gas oil fraction primarily to light gas oil (LGO). Typically, lighter products (gasoline and gas) and the heavier product (fuel oil) are considered by-products in this process. A heavy gas oil feedstock with a wide boiling range is fed to a fractionator to separate the feed into a light oil and a heavy oil fraction, depending on the desired cut points. Light oil (which would have a relatively low thermal reactivity) is heated in a separate furnace to higher temperatures so that the cracking takes place in a vapor phase. Heavy oil fraction (with a high thermal reactivity) is heated to a lower temperature for cracking in the liquid phase. The heated feed streams are combined in a soak drum to provide sufficient time for the completion of the cracking reactions. After the soaker, the products are sent to a flash separator to separate the heavy end as a side product (fuel oil) and the lighter products are sent to the fractionator for separation into LGO, gasoline and the gaseous products. Separating the feed into two fractions will avoid heating the reactive longer alkane chains to high temperatures to keep coke formation and gas production under control to maximize the LGO yield. In naphtha cracking for ethylene production, all reactions are carried out in vapor phase at low pressures to promote β scission reactions for high ethylene yields. Coking of reactor tubes creates a major maintenance problem in naphtha cracking for ethylene production.
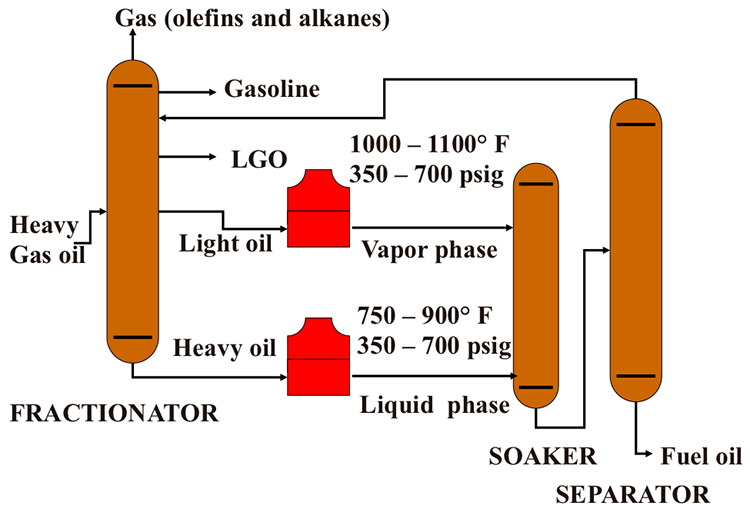
Visbreaking
Visbreaking
Visbreaking is a mild thermal cracking process applied to reduce the viscosity of VDR to produce fuel oil and some light products to increase the distillate yield in a refinery [1]. Depending on the feedstock properties and thermal severity in the reactor, the process will typically achieve 10–25% of conversion of the heavy ends to gas, gasoline, and distillates while producing fuel oil with the desired specifications. Carbon rejection in small quantities on the reactor surfaces during thermal cracking helps reduce the viscosity of the fuel oil product (Figure 6.3). The process decreases the demand for a cutter stock used as diluent (e.g., kerosene) that might otherwise be used to reduce the viscosity of the heavy ends to meet the fuel oil specifications. Adding a diluent may still be needed, depending on the sulfur content of the product and the fuel oil specifications. Although the principal objective of visbreaking is to reduce viscosity, some refineries may use this mild cracking process to convert fuel oil into lighter distillates.
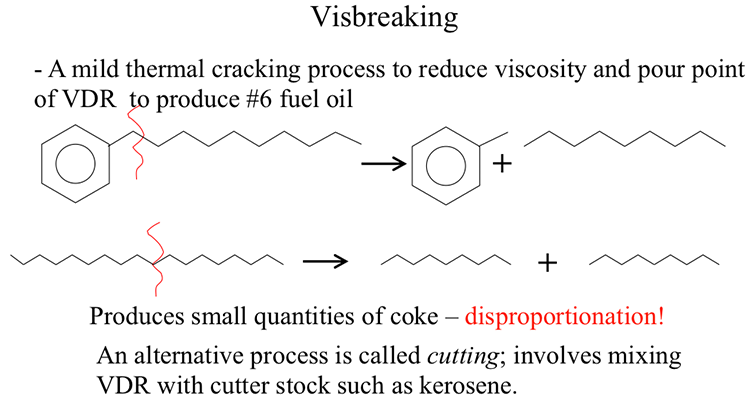
As in all chemical reactions, conversion in visbreaking depends primarily on temperature and time. As a measure of “thermal severity” under reactions conditions, one can use a thermal severity index (TSI) as a function of temperature and time that is shown in Figure 6.4. The exponential dependence of TSI on temperature relates to the general exponential term that constitutes the chemical reaction rate constants. The chemical conversion in visbreaking reactions can be expressed as the reduction in concentration (cA) of long-chain alkane (or high-molecular weight compounds) in the feedstocks. One can see from Figure 6.4 that the conversion in the visbreaking reaction can be expressed by the integral in Figure 6.4, assuming an apparent first-order kinetics for the reaction. It can also be seen, in Figure 6.4, that the conversion that can be related to the extent of visbreaking depends on (kt); and the TSI to establish the interchangeability of T and t for a given conversion relates to (e(-Ea/RT)t), where Ea is the apparent activation energy of the reaction, R is the universal gas constant, T is the temperature, and t is time. In using the TSI for comparing thermal severity of different T and t combinations as major operating variables of visbreaking, care should be taken to use the right units for R and T. As a general convention, an apparent activation of energy of 50 kcal/mol is assumed for thermal cracking reactions involving the homolysis of C-C bonds to produce free radicals.
Higher visbreaking severity would produce a higher reduction in viscosity. Thermal severity is limited by the reactivity of the feedstock and the storage stability of the residual fuel in accordance with the desired conversion level and desired reduction in viscosity. Asphaltene content and concarbon of the feedstocks are important factors to consider when selecting an appropriate thermal severity for the process to prevent excessive coking in the visbreaking reactor.
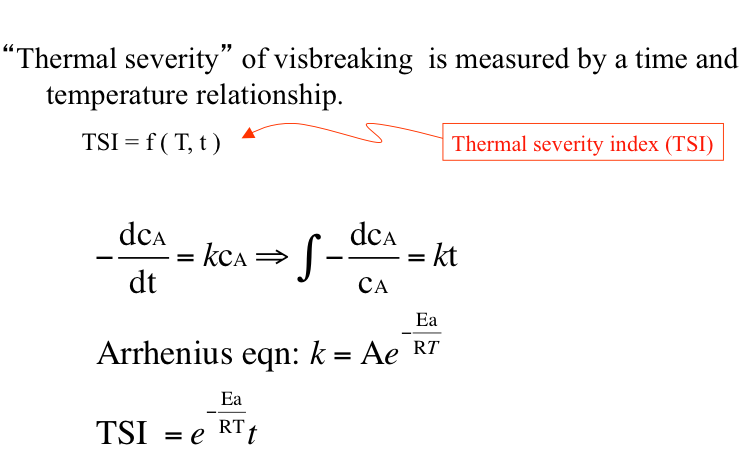
“Thermal severity” of visbreaking is measured by a time and temperature relationship
TSI = Thermal severity index, TSI = f (T, t)
$$ - \frac { d c _ { A } } { dt } = k c _ { A } \Rightarrow \int - \frac { d c _ { A } } { c _ { A } } = k t$$
Arrhenius equation: $$k = A e ^ { - \frac { Ea } { RT } }$$
$$TSI = e ^ { - \frac { Ea } { RT } } t$$
[1] Petroleum Refining, by J. H. Gary, G. E. Handwerk, M. J. Kaiser, 5th Edition, CRC Press NY, 2007, Chapter 5, pp.111-116.
Visbreaking Processes
Visbreaking Processes
There are two types of visbreaking processes: coil or soaker visbreaking. Figure 6.5a shows a schematic diagram of the coil visbreaking process. For visbreaking, the feedstock is introduced into the coil heated in the furnace, where the thermal cracking reactions take place. At the furnace outlet, the reaction products are immediately quenched using a portion of the gas oil product from the fractionator to stop the thermal cracking reactions. The quenched products are sent to the fractionator for separation into gas, gasoline, light gas oil, and visbroken residue streams. A steam stripper can be used with the fractionator for better separation of the visbreaking products. In the soaker visbreaking process, a soak drum is placed after the furnace, Figure 6.5b. Most of the thermal cracking reactions, in this case, take place in the soaker drum.
Depending on the process objectives and feedstock characteristics, reaction temperatures range from 450°C to 485°C and pressures ranging from 3 to 10 bar. Higher temperatures and lower residence times are used in the coil visbreaking process.
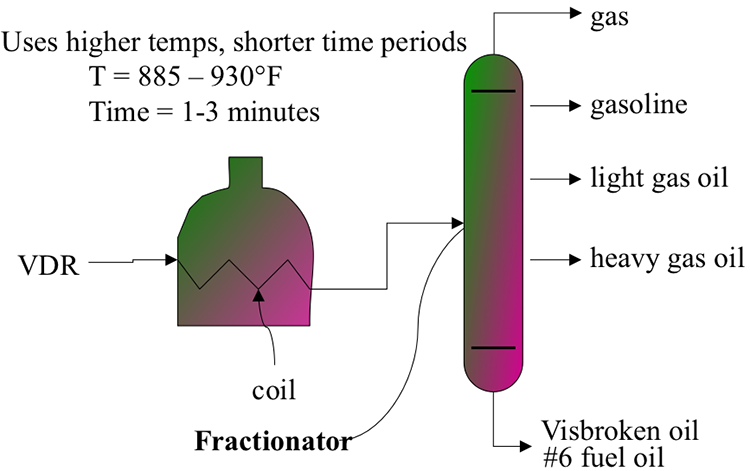
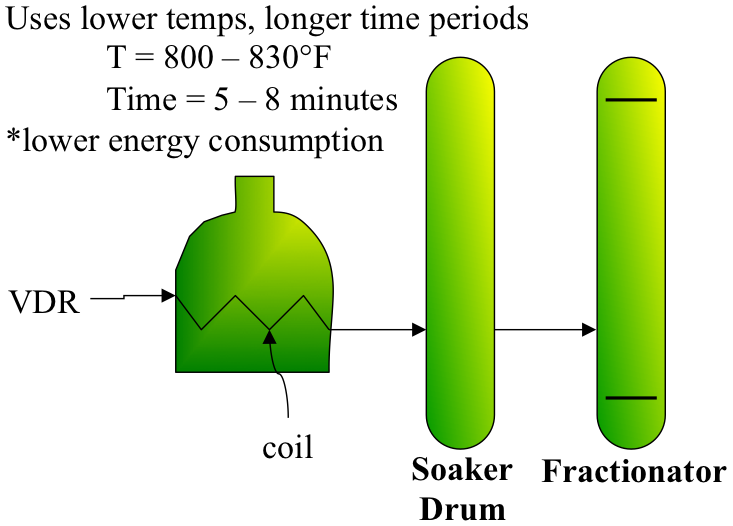
Residence times can vary from 1 min (associated with high temperatures in coil visbreaking) to 10 min (for lower temperatures used in soaker visbreaking).
Similar to deasphalting and distillation, the environmental impact of visbreaking is associated with burning fuel in the furnace to provide energy for thermal cracking, and, to a lesser extent, burning off the coke deposited in the coil or soaker drum leading to emissions of CO2, oxides of nitrogen (NOx), and oxides of sulfur (SOx) in the flue gases.
Exercise 7
Exercise 7
A coil visbreaker operates at 500°C for 1 min. How long will it take to achieve the same thermal severity at 450°C in a soaker visbreaking process? An apparent Arrhenius activation energy for thermal cracking is given as 50 kcal/mol.
Coking
Coking
Despite the development of catalytic cracking processes, coking processes have survived as a popular refining process all over the world to refine the heavy end of crudes or heavy oils through carbon rejection as coke. Coking is the most severe thermal process used in the refinery to treat the very bottom-of-the-barrel of crude oil, i.e., vacuum residue.
Because of the high severity of thermal cracking during coking, the residue feed is completely converted to gas, light and medium distillates, and coke with no production of residual oil. Three different coking processes are used in the refineries: delayed coking, fluid coking, and flexi-coking (a variation of fluid coking). The common objective of the three coking processes is to maximize the yield of distillate products in a refinery by rejecting large quantities of carbon in the residue as solid coke, known as petroleum coke. Complete rejection of metals with the coke product provides an attractive alternative for upgrading the extra-heavy crude and bitumen, and that is particularly useful for initial processing of tar (or oil) sands for liberating the hydrocarbons from the sand that is left behind with the coke. Finding markets for the coke product as fuel or as filler for manufacturing anodes for the electrolysis of alumina (possible only with petroleum coke from delayed coking) makes the economics of coking more attractive by creating value for the rejected carbon. Sulfur and metal contents of the petroleum coke, as determined by the sulfur and metal contents of the residue feed, are two important factors that affect the commercial value of petroleum coke. Of the two coking processes, delayed coking is the preferred approach in many refineries that process heavy crudes.
Delayed Coking
Delayed Coking
Figure 6.6 shows a flow scheme in a delayed coking progress and a photograph of a delayed coking unit. The derricks above the drums that contain the drill stems are used to drill out the coke from the coke drums at the end of the coking cycle.
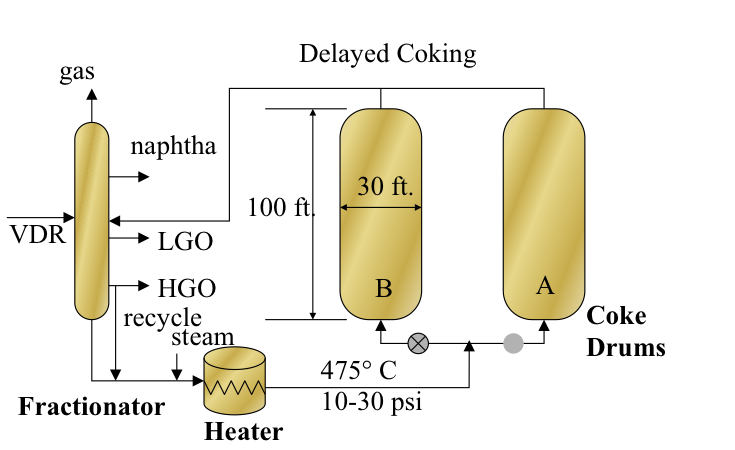
As shown in Figure 6.6, the residue feed is introduced to the fractionator after being heated in the heat exchangers with the coker gas oil products. The bottoms from the fractionator, including the heavy ends of the vacuum residue feed with heavy coker gas oil recycle, are mixed with steam and sent to the tubular heater in the furnace to be heated to approximately 475°C at a pressure of 10-30 psi. Steam is added to prevent coking in the heater, and the heated feed is introduced from the bottom of one of the coke drums. The coking takes place in the insulated coke drum as the drum fills up for a period of 16–18 h. While drum A is being filled up, drum B is decoked by using hydraulic cutters and the drilling stem, and the coke is removed from the bottom of the drum. As the coking in drum A is completed, drum B should be decoked, sealed, heated, and prepared for switching the feed. The coking cycle is controlled such that the vacuum residue is continuously fed to the unit (because the vacuum column works around the clock) and the fluid products are recovered continuously, while coke is removed intermittently in a semi-continuous process scheme. Therefore, there are at least two coke drums in every delayed coking unit, and some units have more than two drums. All of the heat necessary for coking is provided in the heater, whereas coking takes place in the coke drum; hence, the process is called “delayed coking.”
The hot product vapors and steam from the top of the drum are quenched by the incoming feed in the fractionator to prevent coking in the fractionator and to strip the lighter components of the vacuum residue feed. The fractionator separates the coking products into gasses, coker naphtha, coker light gas oil, and coker heavy gas oil. A side-steam stripper is used with the fractionator to ensure a good separation between the coker naphtha and light gas oil streams [2].
The delayed coking operating variables include heater outlet temperature, pressure, recycle ratio, and cycle time. These variables are selected based on feed properties such as the characterization factor, asphaltene content, and Conradson Carbon Residue (CCR) to ensure that coking in tubular heaters is minimized, and liquid product yield is maximized. The recycle ratio, which is typically 3–5%, is used to control the endpoint of the coker heavy gas oil. The coke yield can vary from 20% to 30% depending on the feed properties and coking conditions. In the textbook, you may find some proposed equations to predict coke and other product yields on the basis of the CCR of the vacuum residue and estimates of the distribution of sulfur in the feed among the coking products, suggesting that up to 30 wt% of the sulfur in the feed ends up in the coke, 30 wt% in the gas product, and 20 wt% in the coker heavy gas oil.
[2] Petroleum Refining, by J. H. Gary, G. E. Handwerk, M. J. Kaiser, 5th Edition, CRC Press NY, 2007, Chapter 5, pp.97-111.
Two Kinds of Coke
Two Kinds of Coke
There are two kinds of coke produced by delayed coking of VDR: high-density shot coke, and porous sponge coke. Figure 6.7 shows the appearances of shot coke, consisting of aggregates of ~5 mm diameter spherical particles (resembling buckshots) and sponge coke (with a porous structure resembling a sponge). The formation of shot coke is usually troublesome because of difficulties in removing the coke from the drums and problems with grinding, although shot coke has some niche applications, such as in titanium dioxide (TiO2) production. Sponge coke is used as solid fuel, and manufacturing anodes for aluminum production, if its sulfur and metal concentrations are sufficiently low.
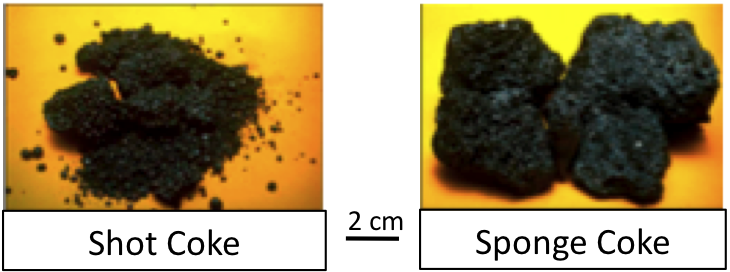
Among the delayed coking products, needle coke is a specialty coke produced mostly from coking of a highly aromatic FCC decant oil. The major properties of the needle coke include a low coefficient of thermal expansion, a low puffing (sudden volume expansion) tendency during graphitization because of lower nitrogen and sulfur contents, and high mechanical strength. The anode coke has limits on metal contaminants, requiring less than 500 ppm of Ni and V in the coke. The price of fuel coke depends on its carbon purity (S, N, and metal contaminants); however, the fuel coke is traded at a price comparable to that of coal.
Fluid and Flexi-Coking
Fluid and Flexi-Coking
Fluid coking and flexi-coking are fluid-bed processes developed from the basic principles of FCC, with close integration of endothermic (cracking, coking, or gasification) and exothermic (coke burning) reactions. In fluid coking and flexi-coking processes, part of the coke product is burned to provide the heat necessary for coking reactions to convert vacuum residua into gasses, distillate liquids, and coke. Flexi-coking, as a variation of fluid coking, provides the options of partial or complete gasification of the coke product to produce a fuel gas with some or no coke in the product slate. Different from the bulk liquid-phase coking in delayed coking, coking takes place on the surface of circulating coke particles of coke heated by burning the surface layers of accumulated coke in a separate burner. Figure 6.8 shows a schematic flow diagram of the fluid coking process. The preheated vacuum residue is sprayed onto the hot coke particles heated in the burner by partial combustion of coke produced in the previous cycle. Using fluid beds in the reactor and burner provides efficient heat transfer and fast coking on a collectively large surface area of the small coke particles circulating between the reactor and burner. The products of coking are sent to a fractionator (similar to that used in delayed coking after recovery of fine coke particles). Steam is also added at the bottom of the reactor (not shown in the figure) in a scrubber to strip heavy liquids sticking to the surface of coke particles before they are sent to the burner. This steam also provides fluidization of coke particles in the reactor. The reactor and the burner operate at temperatures of 510–570°C and 595–675°C, respectively.
Higher temperatures and short residence times in the reactor lead to higher liquid and lower coke yields compared with those of delayed coking. Coke is deposited layer by layer on the fluidized coke particles in the reactor. Air is injected into the burner to burn 15–30 % of the coke produced in the reactor, part of the particles are returned to the reactor, and the remainder is drawn out as the fluid coke product. Fluid coking can process heavier VDR and gives a higher distillate yield (and lower coke yield) than delayed coking.
Figure 6.9 shows a schematic diagram of flexi-coking. A gasifier is added for conversion of some or all coke produced in the coker in reaction with air and steam to produce a synthesis gas. The hot coke particles from the combustor are circulated back to the coking reactor to provide the heat necessary for coking. The distillate products from the coker are sent to the fractionator, as is done in the fluid coking process. On the gasifier outlet, after removing the fine particles from the gas by cyclones, the gas is cooled in a direct-contact cooler to condense the sour water and recover the flexi-gas. The product gas can be used as fuel gas in the refinery. Depending on the demand, the flexi-coking process can produce both fluid coke and fuel gas, or gasify all the coke to produce only fuel gas.
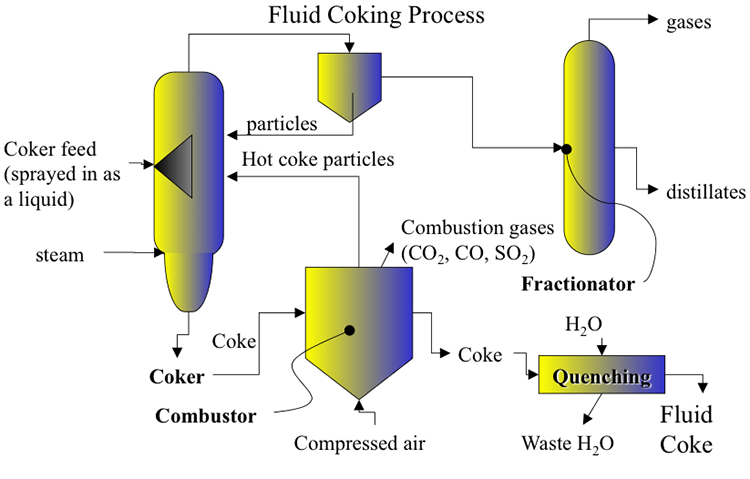
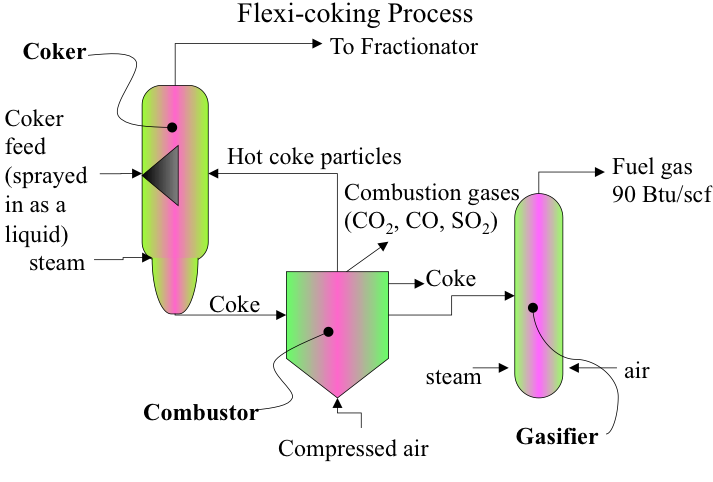
Self-Check Questions
Self-Check Questions
Please take a few minutes to answer the questions below before attempting to complete the assignments for this lesson. Click Check when you want to check your answers.
Assignments
Assignment Reminder
Each week, you will be required to do a number of assignments. This week, in addition to the reading assignments listed on the overview page, you are required to complete Exercise 5.
Exercise 5
Exercise 5 Instructions
A coil visbreaker operates at 475°C for 1 min. How long will it take to achieve the same thermal severity at 440°C in a soaker visbreaking process? An apparent Arrhenius activation energy for thermal cracking is given as 45 kcal/mol. Show each step of calculations in your answer.
Instructions for Submitting Response:
Once you have a solution to the exercises, you will submit your answers as a PDF by uploading your file to be graded. The MS Word, or Excel files should be saved as a PDF before submitting the exercise. Please Note: Scans of handwritten pages are not acceptable.
Please follow the instructions below.
- Find the Exercise 5 assignment in the Lesson 6 Module by either clicking Next until you find it or by clicking Assignments and scrolling down until you find it.
- Make sure that your name is in the document title before uploading it to the correct assignment (i.e. Lesson5_Exercise6_Tom Smith).
Summary and Final Tasks
Summary
Physical separation of crude oil was not sufficient to meet the demand for motor fuels that had increased significantly with the increasing number of automobiles. Thermal cracking was therefore introduced as the first conversion process to produce more distillate fuels from petroleum refining. Thermal cracking, starting typically with breaking the C-C bonds in alkanes, proceeds with free radical chain reactions. One of the common outcomes of thermal cracking is to make light or medium distillates from the heavier fractions of the crude oil. Visbreaking, a mild (low-severity) thermal cracking process, reduces the viscosity of the VDR by rejecting a small quantity of coke as deposits on reactor surfaces. The principal product of visbreaking from VDR is a heavy fuel oil. On the other end of the thermal conversion spectrum, coking, the most severe thermal cracking process, converts VDR to light distillates and gaseous products by rejecting carbon in large quantities in the form of petroleum coke. If the sulfur and metal contents of VDR are sufficiently low, the petroleum coke can be a valuable by-product that is used for producing anode coke for electrolysis of alumina to produce metallic aluminum.
Learning Outcomes
You should now be able to:
- summarize the chemistry of thermal cracking and free radical chain reactions;
- apply thermal cracking of gas oil to produce lighter distillates and examine how thermal reactivity affects process configuration;
- appraise thermal cracking for upgrading of residual fractions (visbreaking and coking) and interpret thermal severity to compare visbreaking processes;
- analyze and compare different coking processes: Delayed Coking, Fluid Coking and Flexicoking.
Reminder - Complete all of the Lesson 6 tasks!
You have reached the end of Lesson 6! Double-check the to-do list on the Lesson 6 Overview page to make sure you have completed all of the activities listed there before you begin Lesson 7.
| Readings | J. H. Gary, G. E. Handwerk, Mark J. Kaiser, Chapter 5 |
|---|---|
| Assignments | Exercise 5: A coil visbreaker operates at 500°C for 1 min. How long will it take to achieve the same thermal severity at 450°C in a soaker visbreaking process? An apparent Arrhenius activation energy for thermal cracking is given as 50 kcal/mol. |
Questions?
If you have any questions, please post them to our Help Discussion (not email), located in Canvas. I will check that discussion forum daily to respond. While you are there, feel free to post your own responses if you, too, are able to help out a classmate.
Lesson 7: Catalytic Conversion Processes Part 1
Lesson 7 Overview
Overview
Video: FSC 432 Lesson 7 (5:00)
Now this a painting in our EMS museum collections from the MS Museum collections. This is a very early refinery, I would think. You can see the oil wells here, and they're refined. The oil is refined right at the site, which is essentially distillation. You can see this must be the distillation tower. You can see the furnace here with the chimney to heat the crude to the required temperatures. And then collect the fractions.
At the time, it was kerosene, obviously, for lighting. And then, later on, maybe light gasoline. See the storage tank, maybe for the gasses and so forth. So in the last lesson, we've talked about thermal cracking processes to make more of the lighter stuff, essentially. Like distillates, or gasoline from the crude oil, by breaking chemical bonds. And we mentioned that pretty soon, the thermal cracking processes could not meet the demand for quality.
And what has changed in the meantime, when we have now close to the Second World War era, where the motors-- now engines-- have higher compression ratios, and they would require higher octane number gasoline. That means they would need gasoline that would not ignite spontaneously with pressure. And it is pressurized with air. That's essentially what the octane number measures, it's anti-knocking property.
So most catalytic processes, catalytic conversion processes, were developed right before and during the Second World War, mainly for making higher quality, higher performance fuels and in higher yields, in higher quantities. So introducing the catalyst to crack, to crude oil, into gasoline boiling range is not done just to increase the rate of cracking, or has anything to do with kinetics, really. That's what catalysts typically do.
In this case, introduction of the catalyst changes the whole chemistry of cracking. Now we've talked about having neutral, reactive species free of radicals and thermal cracking processes. In catalytic cracking, the reactive species are ions. Or cations, actually, cargo cations that are produced on catalyst surfaces. So we need an acid catalyst-- typically aluminum, silica or zeolites-- in order to create these cationic species.
Why do we need that? Because carbo cations go through isomerization reactions very fast. That means we will have now an opportunity to make branched alkanes or isoparaffins because of this isomerization of the ions as opposed to non-isomerization of the free radicals. Isomerization in free radicals is very, very slow. So it doesn't happen.
So pretty much all gasoline production in the US is done through catalytic means. Fluid catalytic cracking is really the most popular processes. It is the heart of a refinery in the United States, FCC process that generates high octane gasoline. It's a very flexible process. It could use a range of feed stocks in the gas oil, boiling range all the way up to light vacuum gas oil.
For heavier materials, something like heavy vacuum gas oil or vacuum distillation residue, we need to introduce hydrogen so that we could convert these heavy fractions without rejecting larger quantities, or very large quantities, of carbon. Then we get into a hydro cracking processes.
So in this lesson we will go over the historical development of catalytic cracking processes, ending up of course with FCC-- which is universally used and accepted now-- and talk about the hydra cracking processes, some of the conditions that are necessary for treating those very heavy ends of crude oil into upgraded products without rejected carbon, so in higher yields.
Overview
Catalytic conversion processes became important in petroleum refining after the Second World War. Catalytic cracking has been developed to produce high yields of gasoline with high octane # from high-boiling stocks using catalysts. As different from thermal cracking, catalytic cracking.
- uses a catalyst;
- takes place at lower temperature and lower pressure;
- is more selective and flexible.
One particular catalytic cracking process, Fluid Catalytic Cracking (FCC), has captured universal acceptance in the refining industry because of its feed flexibility, ability to modify product yields through minor changes in the process operating conditions. FCC is used to produce high-octane gasoline mainly from straight-run atmospheric gas oil and light vacuum gas oil (LVGO) [1]. This process involves breaking up long chains of n-alkanes into shorter chains of branched alkanes (isoalkanes), cycloalkanes (naphthenes), and aromatics by using acidic catalysts. In addition to high-octane gasoline, catalytic cracking produces LPG, cycle oils, and olefin-rich light hydrocarbons (C3, C4). The olefins are used as petrochemical feedstocks, or as reactants in alkylation and polymerization reactions, to produce higher molecular weight branched alkanes and olefins to contribute to the high-octane gasoline pool.
Hydrocracking processes have been introduced for upgrading heavier crude oil fractions such as heavy vacuum gas oil (HVGO) and vacuum distillation residue VDR. The heaviest fractions of crude oil, HVGO and VDR, may not be easily processed by FCC because of potential problems with excessive coking on the catalysts. For upgrading these high-boiling and aromatic-rich feedstocks, hydrogen is introduced in the hydrocracking process, along with bi-functional catalysts systems, to keep coking under control while upgrading the heavy fractions to light and middle distillates.
Learning Outcomes
By the end of this lesson, you should be able to:
- distinguish the chemistry of catalytic cracking from chemistry of thermal cracking and illustrate the formation of carbocations and IUPAC terminology for classification of carbocations;
- categorize the formation of different carbocations on active sites of cracking catalysts and assess the classification of acid sites (Lewis vs Bronsted) on catalyst surfaces;
- compare, with examples, how the product yields and composition obtained from catalytic differ from those from thermal cracking;
- analyze the thermodynamics of carbocation formation and evaluate how ionic chain reactions produce hydrocarbons with high octane numbers;
- appraise the historical evolution of catalytic cracking processes and formulate the driving forces that have shaped this evolution in reactor design and catalyst development;
- locate the hydrocracking process and hydroprocessing in the refinery flow diagram, illustrate hydrocracking processes and evaluate different process objectives.
What is due for Lesson 7?
This lesson will take us less than one week to complete. Please refer to the Course Syllabus for specific time frames and due dates. Specific directions for the assignments below can be found on the Assignments page within this lesson.
| Readings | J. H. Gary, G. E. Handwerk, Mark J. Kaiser, Chapters 7 (Catalytic Hydrocracking) and Chapter 8 (Hydroprocessing and Resid Processing) |
|---|---|
| Assignments | Exercise 6 Quiz 3. Will cover material in Lessons 6 and 7. Check the Syllabus, or Course Calendar for Quiz 3 schedule. |
Questions?
If you have any questions, please post them to our Help Discussion (not email), located in Canvas. I will check that discussion forum daily to respond. While you are there, feel free to post your own responses if you, too, are able to help out a classmate.
Chemistry of Catalytic Cracking
Chemistry of Catalytic Cracking
As opposed to thermal cracking governed by free radicals, catalytic cracking proceeds through the formation of ionic species on catalyst surfaces, and produces shorter, but branched-chain (not straight-chain) alkanes by cracking the long straight-chain alkanes. The formation of branched-chain alkanes, or iso-alkanes, leads to the production of gasoline with high octane numbers. This is the fundamental reason why catalytic cracking has replaced thermal cracking as the central process in a refinery geared to maximize gasoline production. A high octane number of gasoline is needed for current spark-ignition engines to run at high compression ratios without knocking. High compression ratios in spark-ignition engines translate to high power and high efficiency.
Figure 7.1 introduces the two types of ionic species, carbocations, that are active in catalytic cracking reactions as carbenium, and carbonium ions, using the IUPAC terminology. Carbocations are the positively charged ions made from hydrocarbons. Figure 7.1 shows that removing a hydride ion (H-, a hydrogen atom with an additional electron) from an alkane (e.g., methane) produces carbenium ions (path 1a). Also, adding a proton (H+, a hydrogen atom without the electron) to an olefin (e.g., ethylene) can produce carbenium ions, as shown in path 1b.
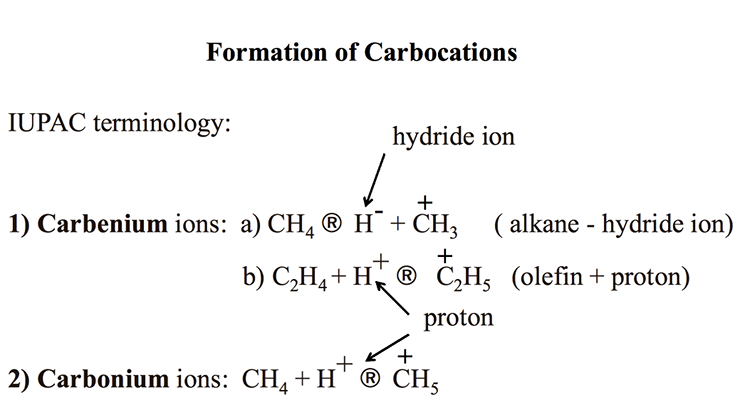
Formation of Carbocations
IUPAC terminology
-Carbenium ions: CH4 (arrow) H- + CH3+ (alkane – hydride ion)
-C2H4 + H+ (arrow) C2H5+. (olefin + proton)
-Carbonium Ions: CH4 + H+ (arrow) CH4
KEY: H- (hydride ion), H+ (proton)
Analogous to the terminology used for free radicals, C+H3 is called methyl carbenium ion, and C2+H5 is called an ethyl carbenium ion. Carbonium ions are produced by adding a proton to an alkane, say methane, as shown in Figure 7.1. The resulting ion C+H5 is called methanium. Note that there is some confusion in the literature about naming the carbocations. Carbenium ions used to be called carbonium ions in some sources, including your textbook [2]. All references to carbonium ions in Section 6.3 Cracking Reactions in the textbook should be corrected as carbenium ions.
Bronsted and Lewis Acid Sites
Carbocations are formed from hydrocarbons on two different acid sites: Bronsted acid sites and Lewis acid sites. You should remember that Bronsted acid sites donate protons, while Lewis acid sites accept electrons to form carbocations from hydrocarbons. Figure 7.2 illustrates how an olefin (e.g., ethylene, C=C) produces an ethyl carbenium ion (C+2H5) by reacting with a proton donated from Bronsted acid site. Alternatively, also seen in Figure 7.2, a Lewis acid site accepts an electron (or a hydride ion, H-) from an alkane (e.g., ethane, C-C) to produce the same ethyl carbenium ion (C+2H5). These two reactions that take place on the acid sites of catalysts, along with the formation of carbonium ions by protonation of hydrocarbons on Bronsted sites, function as the initiation steps in the ionic chain reactions that lead to the products obtained from catalytic cracking.
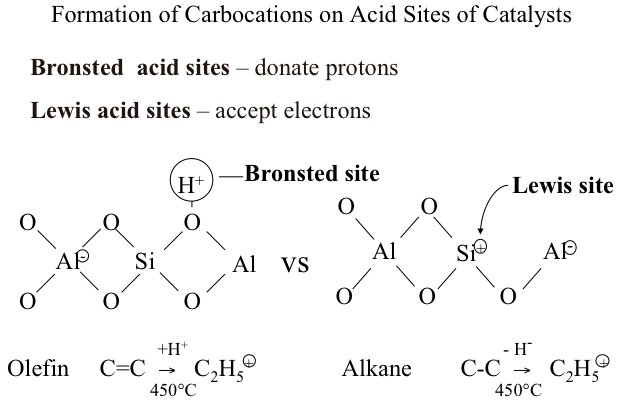
Distribution of Products
Distribution of Products
Figure 7.3 compares the distribution of products from thermal cracking (free radical chain reactions) and catalytic cracking (ionic chain reactions). Short chain paraffins constitute the principal products in both cases, with one important difference – an abundance of iso-alkanes (branched-chain alkanes) in catalytic cracking products. One can also note in Figure 7.3 that catalytic cracking products contain higher concentration of aromatic compounds. High octane number of gasoline produced by catalytic cracking can be attributed to high concentrations of i-alkanes and relatively more abundant aromatics present in the crackate (catalytic cracking product). Having no olefins larger than butylene (C4) from catalytic cracking processes, also distinguishes catalytic cracking products from thermal cracking products obtained from gas oil.
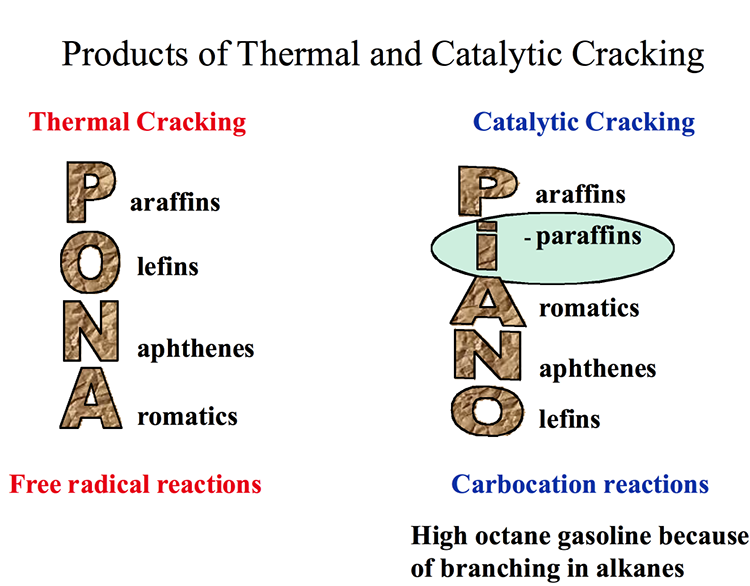
Products of Thermal and Catalytic Cracking
Thermal Cracking – Free radical reactions
P araffins
O lefins
N aphthenes
A romatics
Catalytic Cracking – Carbocation reaction
High octane gasoline because of branching in alkanes
P araffins
I -paraffins
A romatics
N aphthenes
O lefins
Comparison of Products by Type of Hydrocarbon
Comparison of Products by Type of Hydrocarbon
Table 7.1 compares the products of thermal cracking and catalytic cracking of different type of hydrocarbons. Notably, high yields of C1 and C2 gaseous products (methane, ethane, and ethylene) from thermal cracking are contrasted with high yields of C3- C6, with small quantities of methane and essentially no olefins heavier than butylene, from catalytic cracking. Significant for the octane number of the gasoline fraction from the catalytic cracking of aliphatic hydrocarbons are the abundance of i-alkanes and significant concentration of aromatic compounds (BTX) that increase the octane number.
| Hydrocarbons | Thermal Cracking | Catalytic Cracking |
|---|---|---|
| n-alkanes (e.g., C16) |
C2is major product C1in large quantities C4-C15olefins in moderate abundance |
C3-C6are major light prods C1in small quantities No olefins > C4 |
| Aliphatic |
Little aromatization at 500ºC No branched – chain alkanes present |
Significant aromatization Abundance of branched – chain alkanes |
| n-0lefins |
Slow double bond isomerization Little skeletal isomerization |
Rapid isomerization C=C–C–C→ C–C=C–C Rapid skeletal isomerization |
| Alkylaromatics | ß – scission | |
| Naphthenes | Crack more slowly than n-paraffins | Crack at comparable rates with n-paraffins |
As discussed in Lesson 6, the slow isomerization of free radicals (moving the unpaired electron from an edge atom to the interior atoms) results in the production of shorter straight-chain alkanes and straight-chain olefins in thermal cracking, thus leading to low octane numbers of the gasoline product. In contrast to free radicals, the isomerization of carbocations is very fast because of the thermodynamic driving force, shown in Table 7.2. One can see in Table 7.2 that the isomerization of a primary propyl carbenium ion to a secondary propyl carbenium ion releases (19.1- 1.5) = 17.6 kcal/mol. This is a very large thermodynamic driving force for the isomerization of a primary ion to a secondary ion, and further to a tertiary ion, with even a larger driving force. Isomerization of the secondary propyl ion to the tertiary propyl ion, releases 1.5 kcal/mol of energy. It is, therefore, clear that the initiation and propagation of carbocations in catalytic cracking chain reactions on the catalyst surfaces will be dominated by the formation of secondary and tertiary carbocations. The reactions of these carbocations lead to the formation of branched-chain alkanes and olefins with high octane numbers.
| Carbenium Ions | ΔHf(relative) (kcal/mol) |
|---|---|
|
C1+ primary |
19.1 |
|
C2+ secondary |
1.5 |
|
C3+ tertiary |
0 |
Another important feature of carbocation formation is the differences in the enthalpy of formation which favors the formation of carbocations > C3 versus C1 and C2 ions (Table 7.3), because C1 and C2 ions are primary ions. This explains the low yields of C1 and C2 species obtained from catalytic cracking.
| Carbenium Ions | ΔHf(relative) (kcal/mol) |
|---|---|
| CH3⊕ | 258 |
| C2H5⊕ | 225 |
| n-C3H7⊕ | 218 |
| i-C3H7⊕ | 198 |
| n-C4H9⊕primary | 211 |
| t-C4H9⊕ tertiary | 174 |
Ionic Chain Reactions
Ionic Chain Reactions
Figure 7.4 illustrates the ionic chain reactions that govern catalytic cracking of hydrocarbons. The initiation step includes the formation of a carbonium ion by proton donation from a Bronsted acid site and/or the formation of a carbenium ion through hydride ion abstraction by a Lewis acid site. In a propagation step, the carbonium ion goes through cracking to produce an alkane product and a carbenium ion, while the carbenium ion produced on the Lewis acid site goes through a β-scission to produce an olefin product and another carbenium ion. In additional propagation reactions, carbenium ions (secondary, or tertiary) react with alkanes to produce i-alkane products and other carbenium ions, which can go through isomerization reactions generating more stable ions. Finally, in termination steps, carbenium ions donate a proton to restore a Bronsted acid site and produce an olefin as final product, or they abstract a hydride ion to restore a Lewis acid site producing an i-alkane product, and the ionic chain reaction continues. Other reactions during catalytic cracking include dehydrocyclization and dehydrogenation reactions to produce aromatic compounds. One should note that thermal cracking reactions also take place during catalytic cracking because of the sufficiently high temperatures used in the process. Some claim that initial thermal cracking of alkanes to produce olefins should also be considered as an initiation step in ionic chain reactions [2].
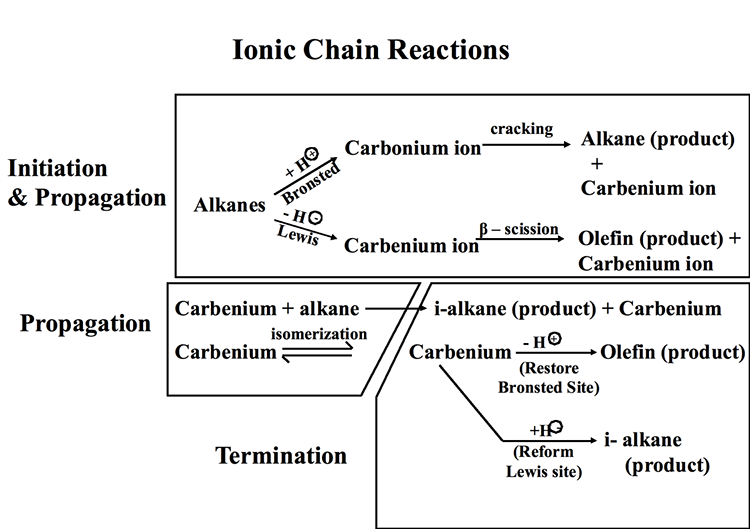
Catalytic Cracking Processes
Catalytic Cracking Processes
Increasing demand for gasoline, along with the need to produce high-octane gasoline for increasingly more powerful spark ignition engines, led to the development and maturation of catalytic cracking processes just before and during World War II. Following the development of a fixed-bed (Houdry process, 1936) and a moving-bed (Thermafor Catalytic Cracking, 1941) catalytic cracking process, fluid-bed catalytic cracking (FCC, 1942) became the most widely used process worldwide because of the improved thermal efficiency of the process and the high product selectivity achieved, particularly after the introduction of crystalline zeolites as catalysts in the 1960s.
The list below shows a timeline for the development of the catalytic cracking processes. The evolution of catalytic cracking processes is an exemplary showcase in chemical engineering for discussing the advancement of reactor configuration, driven by energy conservation and process kinetics. The evolution of these processes is discussed in the following subsections.
Historical Time-Line for Catalytic Cracking Processes
-
McAfee (1915)
-
Batch reactor catalytic cracking to produce light distillates
-
Catalyst: A1Cl3 – A Lewis acid, electron acceptor
-
Alkane – electron(abstracted by A1Cl3)→ a carbocation(+)→ ionic chain reactions to crack long chains
-
-
Houdry (1936) - a commercial process
-
Continuous feedstock flow with multiple fixed-bed reactors
-
Cracking/catalyst regeneration cycles
-
Catalyst: clays, natural alumina/silica particles
-
-
Thermafor Catalytic Cracking (TCC) (1942)
-
Continues feedstock flow with moving-bed catalysts
-
Catalyst: synthetic alumina/silica particles
-
Higher thermal efficiency by process integration
-
-
Fluid Catalytic Cracking (FCC) (1942)
-
Continuous feedstock flow with fluidized-bed catalysts
-
Catalyst: synthetic alumina/silica+zeolites (1965)
-
Houdry Catalytic Cracking
Houdry Catalytic Cracking
The first catalytic cracking process was developed as a batch process (McAfee, 1915) shortly after the development of a thermal cracking process. The process used Lewis acid catalysts (e.g., AlCl3) for cracking. These catalysts were expensive and corrosive. In addition to these impediments, use of a batch reactor in the McAfee process did not allow large-scale commercialization of this process. The first full-scale commercial process, the Houdry Catalytic Cracking, used much less expensive catalysts, such as clays, and natural alumina and silica particles. Figure 7.5 shows the configuration of the Houdry Catalytic Cracking process. For cracking, gas oil feed was heated to 800°F and fed to a fixed-bed reactor packed with the catalyst particles. Cracking products are sent to a fractionator to be separated into gas, gasoline, light cycle oil (LCO) and heavy cycle oil (HCO) products.
Video: Houdry Catalytic Cracking (5:03)
INSTRUCTOR: As I mentioned before, the evolution of catalytic cracking processes is really a good example of process engineering or reactor design to maximize the thermal efficiency of a process. The first cat cracking process was a batch process introduced in 1915, the McAfee process, from a Lewis acid. Aluminum chloride was used in the batch reactor system. But for commercial operation, you would need a floor reactor system. So Houdry cat cracking was the first commercial continuous process introduced in 1936.
The process used the natural aluminum silica solids particles as catalysts. And in the process, we're going to look at a configuration that has three reactors in parallel. These are fixed bed reactors essentially filled with the alumina silica pellets, packed with the alumina silica palettes as catalysts. So the gas oil feed is heated in a furnace, in a fired furnace to 800 degrees Fahrenheit, and the feed is fed from the bottom of this packed bed to go through cracking on catalyst surfaces, and the products are fed to a fractionater. In the fractionater, the products are separated into gas and gasoline and LCO, light cycle oil, as the major products from cat cracking.
As the cracking goes on, the catalysts are deactivated by coke buildup. And this happens pretty fast, within 10 minutes of the introduction of the feed into the reactor. Now, since this is an endothermic reaction, you would also imagine or could visualize that the temperature will go down as the feed moves from the bottom to the top of the reactor. So cracking isn't really very homogeneous because of this decreasing temperature.
Now, once the catalysts are deactivated within 10 minutes, all coked up, you bring in steam to strip the liquids, somewhat heavier liquids that are sticking onto the catalyst surfaces to remove them into the fractionater. And some of this will end up as heavy oil. Once this operation is finished, within about five minutes, then you bring in hot air to burn off the coke to reactivate the catalyst.
But to continue this cracking process in the meantime, while you are stripping the heavier products and reactivating the customers by burning the coke, you need to switch the feed to another reactor. So that is the second in the series. So you have a continuous feed and continuous production through the system using the swing reactor configuration, as we refer to.
The same thing happens in the second reactor. The catalyst is deactivated within 10 minutes, so you bring in the steam to strip the heavier products. And while you're doing that, obviously, and then later on, burning off the coke, you should switch the feed to another reactor. That would be the third reactor in these areas. And the products are all sent to a fractionater.
So by the time the third reactor is coked up, you can now switch the feed back to the first reactor. You will have enough time to steam strip and coke or decoke the first reactor, having these additional two reactors in the series. So that's essentially the cycle in the Houdry cat cracking reaction to enable a continuous flow system while the reactors are taken out of service for decoking operations.
You see the problem here. The endothermic reaction of cracking is decoupled, really, from the exothermic reaction of burning of the coke. So for that reason, the thermal efficiency of Houdry cat cracking is not very high, and it certainly needs to be improved.
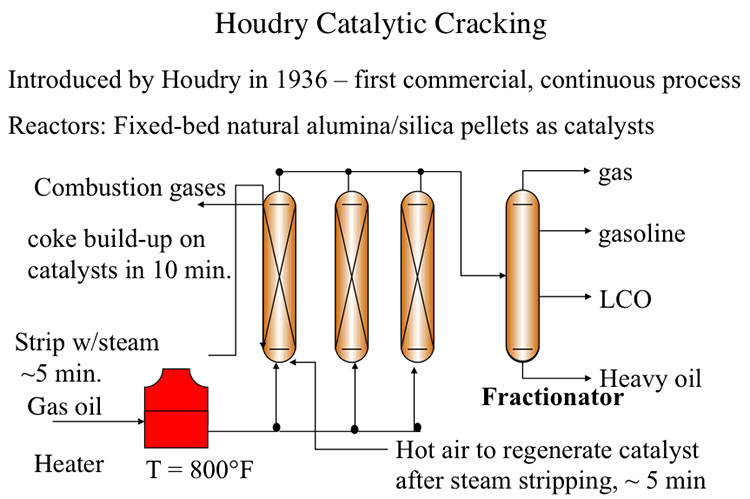
A series of swing reactors were needed to switch the feed flow from one reactor to another after approximately 10 minutes of operation. The switch to a swing reactor was necessary because of rapid coking on catalysts which, being natural materials, had a wide range of activity. Rapid coking on silica/alumina particles deactivated these catalysts and led to plugging of the reactors. After the flow was switched to another reactor, the isolated reactor was stripped with steam for five minutes to remove the liquid products adsorbed on catalyst particles. After stripping with steam, the deactivated catalysts were regenerated by burning off the coke on catalysts with hot air introduced to the reactor. Catalyst regeneration also takes approximately 5 minutes before the reactor with regenerated catalyst is ready to accept the feed again. By this time, the second reactor would be ready for the 10-minute cycle of steam stripping and catalyst regeneration. Having a third reactor in the plant would help deal with any delays/problems in reactor preparation. Considering that catalytic cracking is an endothermic process, the heat generated from burning the coke off the catalyst could be used partially to heat the catalyst particles for the endothermic reaction. A large portion of the heat in the flue gases from coke combustion was not available for the process. Therefore, the thermal efficiency of the Houdry Process was low.
Thermafor Catalytic Cracking (TCC)
Thermafor Catalytic Cracking (TCC)
Thermafor (also referred to as “thermofor” in some sources) Cracking Process was introduced for better integration of thermochemistry (endothermic cracking and exothermic catalyst regeneration) by introducing a moving-bed configuration, rather than a fixed-bed, as shown in Figure 7.6. Catalysts used in this process were synthetic alumina/silica beads that have more homogeneous and consistent properties (e.g., activity) than the natural minerals. Catalysts particles and the feed are introduced from the top of the reactor, and the catalyst particles move downward with gravity as the cracking reactions take place on the catalyst surfaces. Steam is injected from the bottom of the reactor to carry the cracking products to the fractionator for recovery. As the particles move down the reactor, they are deactivated by coke build-up on active sites. The deactivated catalysts removed from the bottom of the reactor are sent to a regenerator unit where the coke on catalysts surfaces are burned off and the heated catalysts particles are recycled to the top of the reactors by bucket elevators. Hot catalyst particles provide most of the heat necessary for the cracking reactions in the reactor. Although the thermal efficiency of TCC is higher than that of the Houdry process, there was still a significant amount of heat loss during the transport of heated catalyst particles by bucket elevators.
Video: Thermafor (3:53)
Thermafor catalytic cracking process provided significant improvement over the Houdry cat cracking in terms of the thermal efficiency. Now, this improvement came with the change in the reactor configuration from a fixed bed in Houdry to a moving bed of catalyst now. So the catalysts are not fixed, but they are moving by gravity so that the reaction can be now conducted in just one reactor instead of having multiple reactors and switching between those reactors.
There was an improvement in the catalyst as well. Instead of using natural silica-alumina, now there are synthetic alumina-silica beads with more controlled activity, more homogeneous activity of the sites that the cracking goes on, which, of course, makes the control of the reactions better compared to the Houdry cat cracking.
So the integration of the reactor and the catalyst regenerators, as you will see, has increased the thermal efficiency very significantly over the fixed bed, the Houdry cat cracking.
Now, you can see that the feed is introduced along with the catalyst from the top of the reactors. So the particles move down with gravity at controlled flow rates along with the feed. So as the cracking goes on, on the catalyst surfaces, there is the activation. There's still coking going on, on the catalyst particles. So by the time they reach the bottom of the reactor flowing with gravity, the catalyst reactivity has been reduced to a significant extent. The catalysts are now ready to be reactivated or regenerated.
Steam, as you can see, is introduced from the bottom of the reactor to strip off all the volatile products during cracking, and the products are sent to a fractionator for separating into gas, gasoline, LCO, heavy oil, and so forth.
So the used catalysts, then, leaving the reactor is sent to a furnace where hot air is introduced to burn off the coke on the surface of the catalyst to regenerate the active sites. And the regenerated catalysts, the hot particles now, are put on bucket elevators to be sent up to the top of the reactor to close the catalyst cycles.
So the thermal integration here is such that the heat that is generated by burning the coke heats the catalyst particles. And these are hot enough to actually have the cracking take place on the surface. You can see that there is no external heater in this reactor scheme in Thermafor Cat Cracking.
But there is still more heat losses, especially in this bucket elevator system, transporting the hot catalyst particles to the top of the reactor. Thermal efficiency, although much improved over the Houdry fixed bed process, there is still a lot of room for improvement in thermal efficiency through the integration of endothermic and exothermic reactions.
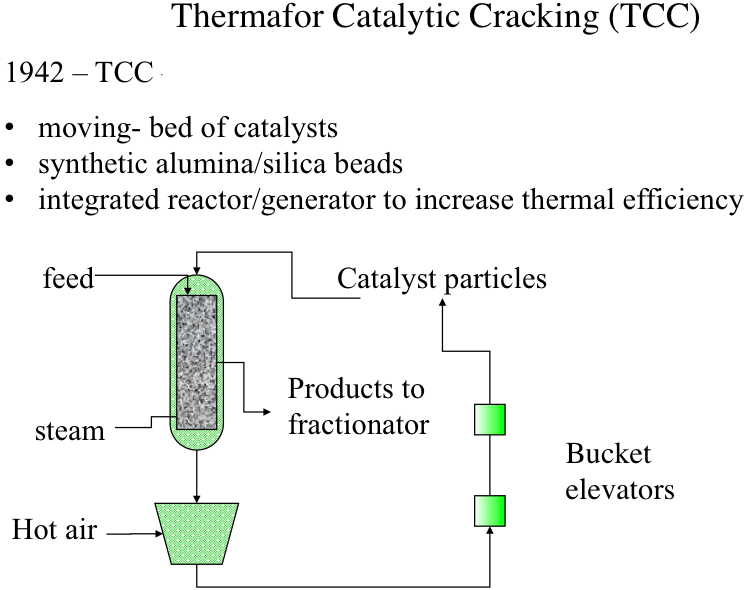
Fluid Catalytic Cracking (FCC)
Fluid Catalytic Cracking (FCC)
Fluid Catalytic Process, also introduced in 1942, offered an excellent integration of the cracking reactor and the catalyst regenerator that provides the highest thermal efficiency, as shown in Figure 7.7. In FCC, a fluidized-bed (or fluid-bed) of catalyst particles is brought into contact with the gas oil feed along with injected steam at the entrance (called the riser) of the reactor. The hot catalyst particles coming from the regenerator unit evaporate the feed gas oil upon contact in the riser, and the cracking starts as the gas oil vapors and the catalyst particles move upward in the reactor. The temperature of the catalyst particles drops as the evaporation of gas oil and endothermic cracking reactions proceed during the upward movement. Cracking reactions also deposit a significant amount of coke on the catalysts, leading to the deactivation of the catalyst. After removing the adsorbed hydrocarbons by steam stripping, the coked catalyst is sent to the regeneration unit to burn off the coke with air. Heat released from burning the coke deposit increases the temperature of the catalyst particles that are returned to the riser to complete the cycle. Burning off the rejected carbon (coke) in the regenerator provides the energy necessary for cracking without much loss, thus increasing the thermal efficiency of the process. The cracking products are sent to the fractionator for recovery after they are separated from the catalyst particles in the upper section of the reactor [3].
In the reactor, the cracking reactions initiate on the active sites of the catalysts with the formation of carbocations and the subsequent ionic chain reactions produce branched alkanes and aromatic compounds to constitute the crackate (cracked gasoline with high octane number), light olefins, cycle oils, and slurry oil that are sent to the fractionator. A carbon-rich byproduct of catalytic cracking, termed “coke,” deposits on catalyst surfaces and blocks the active sites. FCC is considered a carbon rejection process because the coke deposited on the catalyst surface and eventually burned off for heat is rich in carbon and thus enables the production of large quantities of a light distillate (crackate) in the process without the addition of hydrogen.
Two different configurations of the commercial FCC processes exist depending on the positions of the reactor and the regenerator: they can be side by side or stacked, where the reactor is mounted on top of the regenerator. Major licensor companies that offer FCC processes with different configurations include Kellogg Brown & Root, CB&I Lummus, ExxonMobil Research and Engineering, Shell Global Solutions International, Stone & Webster Engineering Corporation, Institut Francais du Petrole (IFP), and UOP. Figure 7.8 shows examples of Exxon and UOP designs [1,4]. The UOP design of high-efficiency two-stage regenerator units offer advantages of uniform coke burn, higher conversion of CO to CO2 and lower NOx emissions among others. Another modification to FCC plants could be the installation of a catalyst cooler, which may provide better control of the catalyst/oil ratio; the ability to optimize the FCC operating conditions, increase conversions, and process heavier residual feedstocks; and better catalyst activity and catalyst maintenance [3].
In the first video below, the animation of an explosion in an FCC unit in 2015 (7:12 minute long) provides a good review of the FCC process, and points out the potential hazards of working with hydrocarbons exposed to high temperatures in refinery units:
2015 Explosion at ExxonMobil Refinery (7:12)
SPEAKER: The Torrance refinery is a 750-acre facility located just outside of Los Angeles, California. At the time of the explosion, the refinery was owned by ExxonMobil. An important part of the refining process takes place in the facility's fluid catalytic cracker or FCC unit. In the FCC unit, heavy hydrocarbons from crude oil are broken or cracked into smaller hydrocarbons, which can then be processed into gasoline and other fuel products.
The heavy hydrocarbons are first fed into a reactor where they mix with a catalyst. The heavy liquid hydrocarbons are converted into lighter hydrocarbon vapors as they travel up the reactor. At the top of the reactor, the lighter hydrocarbon vapors are separated from the catalyst. The hydrocarbon vapors then flow to the main distillation column.
The catalyst falls down the side of the reactor, where it moves through a slide valve to a piece of equipment called the regenerator. During the reaction, a layer of carbon called coke forms on the catalyst that must be removed. Inside the regenerator, air is added, and the coke on the catalyst is burned off. The catalyst is then fed back to the reactor through a slide valve, and the cycle is repeated.
When the coke is burned off the catalyst, this creates products of combustion called flue gas. The flue gas flows out the regenerator and enters a system comprised of multiple pieces of equipment which remove any remaining catalyst particles present. The regenerator and flue gas system comprise the air side of the FCC unit.
The last piece of equipment in the flue gas system is called the electrostatic precipitator or ESP. The ESP removes small catalyst particles using static electricity. While the ESP is energized, it creates sparks, which are sources of ignition.
It is critical that the flammable hydrocarbons in the reactor do not flow into the air side of the FCC unit as this could create an explosive atmosphere. To avoid this hazard, the two slide valves connecting the reactor and regenerator are used to maintain a catalyst barrier between the pieces of equipment.
The sequence of events that eventually lead to the explosion at the refinery began on Monday, February 16, 2015, when a piece of equipment in the air side of the FCC unit called the expander vibrated forcefully enough that the refinery's control system automatically transitioned the FCC unit to a standby mode known as safe park.
During safe park mode, the flow of hydrocarbons into the reactor is turned off. The flow of air into the regenerator is also stopped. The two slide valves connecting the reactor and regenerator are closed to ensure a catalyst barrier is maintained. Steam is then forced into the reactor to prevent hydrocarbons in the main distillation column from flowing back inside.
The ESP remains energized during safe park. One slide valve however had eroded over six years of operation. And even though it closed, it could not maintain a catalyst barrier in the reactor. Within seven minutes of the unit going into safe park, all of the catalyst in the reactor fell through the slide valve into the regenerator.
A direct pathway was created for hydrocarbons to flow between the reactor and the regenerator. But the pressure of the steam flowing into the reactor as part of safe park mode was high enough to prevent hydrocarbons in the main column from flowing back inside.
With the unit in safe park mode, operators attempted to restart the expander several times but were unable to do so. Refinery personnel met to identify a strategy to repair the expander and bring the FCC unit back on line. Operations personnel predicted the expander could not restart because catalyst had likely accumulated inside.
On Tuesday, February 17, a meeting took place involving a group of refinery personnel. The group discussed a similar expander outage that occurred in 2012 for which the refinery had developed what is called a variance.
A variance is a management-approved deviation from procedure. The group decided to use the 2012 variance, which allowed a departure from the typical requirements for isolating the expander. Part of that process involved installing a blind in one of the expander's outlet flanges.
On the morning of Wednesday, February 18, Exxon Mobil maintenance attempted to install that blind but were unable to do so because steam was escaping through the open flange. Steam from the reactor had traveled through the leaking slide valve into the air side of the FCC unit.
Using the variance as a guide, the flow of steam into the reactor was decreased in an attempt to reduce the amount escaping from the expander. But the variance did not evaluate whether this flow rate was sufficient to prevent hydrocarbons from flowing into the reactor from the main distillation column.
And unknown to the operators, light hydrocarbons from a separate unit had flowed through a leaking heat exchanger into the main column, increasing pressure inside. With the flow of steam reduced and less pressure in the reactor, nothing could prevent the hydrocarbons from flowing back from the main distillation column. The hydrocarbons flowed into the reactor, where they escaped through the leaking slide valve into the air side of the FCC unit.
At 8:07 AM, a maintenance supervisor working in the FCC unit received an alarm on his personal hydrogen sulfide monitor warning him that hydrocarbons were leaking nearby. By 8:40 AM, multiple workers around the expander received the same alarm, and the FCC was evacuated.
In an attempt to mitigate the problem, a supervisor ordered the flow of steam to the reactor to be increased, but it was too late. A flammable hydrocarbon mixture was flowing through the air side of the FCC unit and moving toward the ESP with its multiple ignition sources. There the flammable hydrocarbon mixture violently exploded.
Video: Fluid Catalytic Cracking (5:08)
Fluid catalytic cracking, or FCC, is the last step in the evolution of cat cracking processes-- also introduced in 1942, just like TCC or Thermafor Cat Cracking, during the Second World War in an effort to make high-octane number gasoline. Remember that high-octane number relates to high power as you can have higher compression ratios in the combustion engines.
FCC really shows an excellent integration of the cracking reactor, an endothermic reactor, with the catalyst regenerator and exothermic reactor for very high thermal efficiency. FCC is now used universally in oil refineries throughout the world-- has replaced all the previous cat cracking processes.
Now, in FCC, in the feed, that is gas oil preheated to about 300 degrees Fahrenheit-- is introduced into the reactor with steam. The riser part of the reactor where the hot catalyst particles-- as you see, the green line coming from the catalyst regenerator-- are full of dyes. The particles are full of dyes because they're smaller particles. They are full of dyes and flowing gases and vapors. So they have a huge surface area to meet the incoming feed at temperatures that are close to 1,000 degrees Fahrenheit.
So cracking reactions on these very fine particles that are full of dyes and flowing with the reactants takes place in a very short space of time, something that could be measured with seconds. And the products are sent to a fractionator after going through a series of cyclones, obviously, to separate the small fluid dyes, the particles of the catalyst.
In the fractionators, the products, as usual, are separated into gas, gasoline, light cycle oil, heavy cycle oil, and, finally, the heaviest fractions, decant oil.
Remember that LCO is used in the US for making diesel fuel through hydrocracking and hydrogenation. And decant oil could be used as fuel oil or as feedstock for making carbon black or white coking to make needle coke for graphites, electrodes.
Coming back to the reactors, the cat cracking reactor, the coked catalyst now, the end of the riser where this cracking reaction takes place, are sent through the regenerator. It's not fully coked on the surface, lost its activity. Through the red line, it's sent to the regenerator where air is introduced to burn off the coke.
The temperatures in the regenerator could reach to 1,300 to 1,400 degrees Fahrenheit. You should remember that the catalysts now are much improved, as well. It may include zeolites that would take high temperatures and very controlled reactivities through pore size distribution and so forth.
So the combustion products or flue gases from this catalyst regenerator could be sent to a CO boiler because the gas may contain significant amount of carbon monoxide, which could be burned to CO2 to provide additional heat or to generate additional heat.
So the catalysts that are now regenerated are sent to the reactor to close the catalyst cycle through that green line, as you see, to meet the incoming feed. So our catalyst cycle is pretty much complete at this point.
But note this excellent integration, thermal integration, of the catalyst regeneration, the exothermic process, with the cracking reactions where the catalysts that are heated in the regenerator are sent in a very effective manner to the reactor without much heat loss. So that is the ultimate, if you will, thermal efficiency of a process. And that's why FCC is now the universally accepted catalytic cracking process.
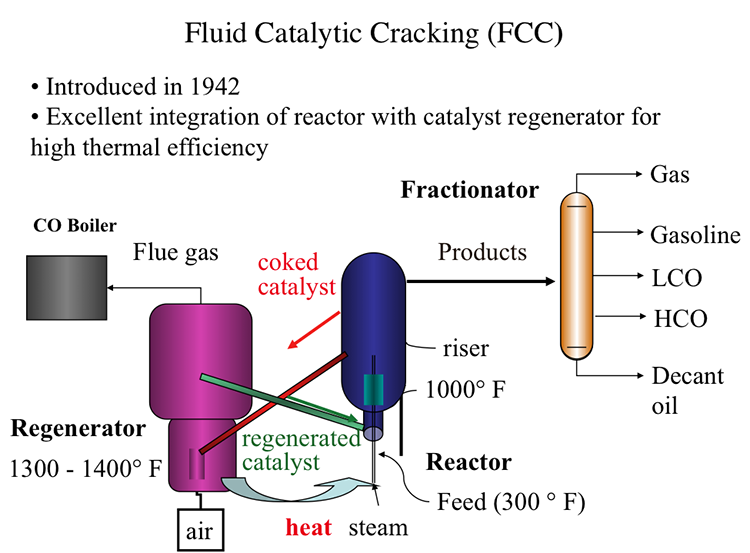
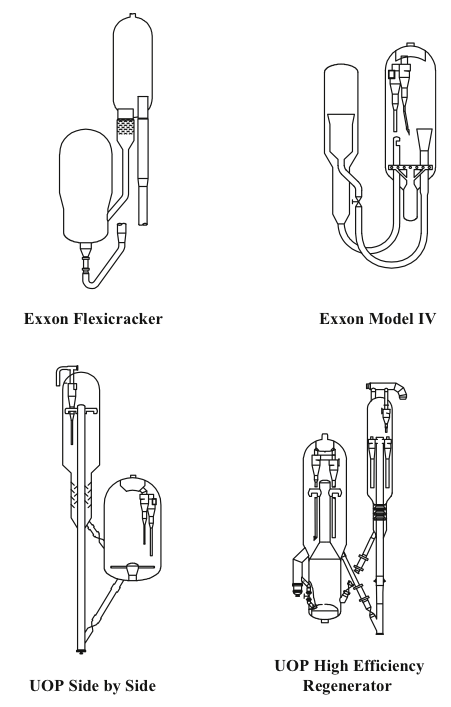
Zeolite Catalysts
Zeolite Catalysts
One of the significant developments in FCC practice was the introduction of zeolite catalysts in 1965. Catalysts and additives play a major role in the selectivity and flexibility of FCC processes. FCC catalyst consists of a fine powder with an average particle size of 60–75 μm and a size distribution ranging from 20 to 120 μm. Four major components make up the catalysts: zeolite, active matrix, filler, and binder. Each of these constituents has a unique role to play, but zeolite is the key component that is more active and selective for high-octane number gasoline production [4]. Table 7.4 compares the octane numbers of some refinery products and FCC gasoline.
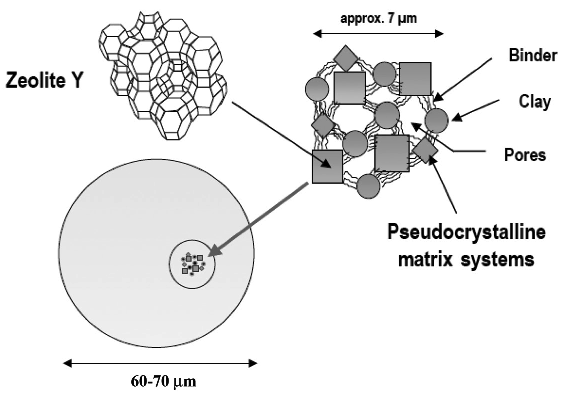
| Product |
RON (600 rpm) |
MON (900 rpm) |
|---|---|---|
| Regular - Premium Gasoline | 90-100 | 80-90 |
| Straight Run Gasoline | 60-68 | 60-68 |
| FCC Gasoline (light) | 93 | 82 |
| FCC Gasoline (heavy) | 95 | 85 |
Exercise 8
Exercise 8
Solve a problem on the material balance for the regenerator in Fluid Catalytic Cracking Process.
Material Balance for FCC Regenerator Problem
Burning the coke deposited on the catalyst particles generates all the heat necessary for catalytic cracking. Therefore, the coke burning rate is a critical parameter to control the rate of cracking. The composition of dry flue gas from the regenerator of an FCC unit is given in vol% as follows:
N2: 81.6
CO2:15.7
CO: 1.5
O2: 1.2
The dry air flow rate to the regenerator is given as 593 SCMM (standard cubic meters per minute). Considering that a significant portion of coke is carbon, calculate the carbon burning rate in the regenerator in kg/min. Remember: 1 kgmole at STP = 22.4 m3)
Catalytic Hydrocracking
Catalytic Hydrocracking
Catalytic hydrocracking is one of the latest additions to petroleum refining processes, with the first modern commercial unit started up by Chevron in 1958. The interest in hydrocracking has been attributed to the increasing demand for light and middle distillates, the availability of byproduct hydrogen in large quantities from catalytic reforming, and the environmental regulations limiting sulfur and aromatic hydrocarbons in motor fuels [5]. The advantages of hydrocracking include its ability to handle a wide range of feedstocks that may be difficult to process by catalytic cracking and its flexibility in selectivity between light and middle distillates. The principal objective of hydrocracking is to decrease the molecular weight and boiling point of heavy oils to produce saturated hydrocarbons (diesel and jet fuel) from highly aromatic feedstocks (e.g., LCO from FCC) and distillation residua.
The hydrocracking process has two dimensions: Hydrogenation of aromatic rings and cracking of aliphatic compounds, as shown in Figure 7.10, using naphthalene as an example for an aromatic ring system. One should note that the aromatic rings cannot be cracked before they are saturated with hydrogen. With hydrocracking, it is possible to convert an aromatic compound to a paraffinic compound without any loss of carbon, as shown in Figure 7.10. As a hydrogen-addition process, hydrocracking provides high yields of valuable distillates without producing low-grade byproducts (e.g., heavy oils, gas, or coke) as experienced in carbon rejection processes such as coking.
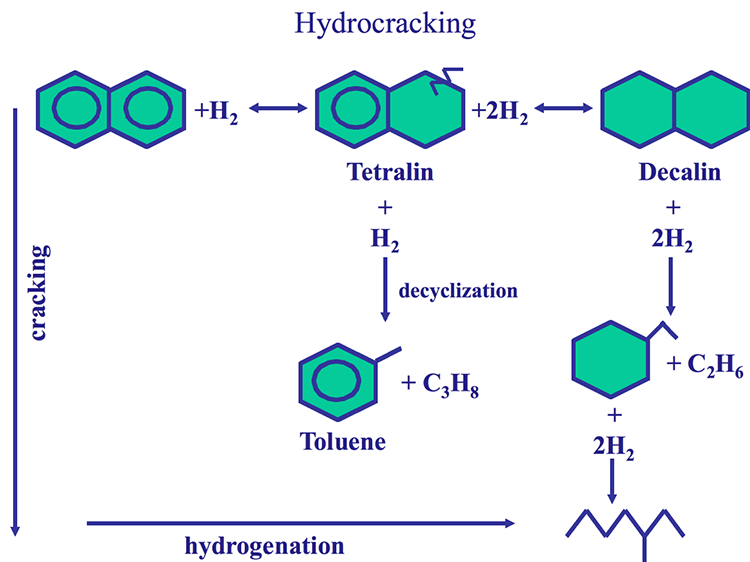
Reaction Systems
Reaction Systems
The two different reaction systems in hydrocracking, hydrogenation and cracking, are supported by bifunctional catalyst formulations, as illustrated in Figure 7.11. Hydrogenation reactions are promoted by the metal component of the catalysts (e.g., Ni, Co, Mo), and the cracking takes place on catalyst support consisting of silica/alumina. Highly active noble metals (e.g., Pt, and Pd) can be used for hydrogenation of hydrocarbons with extremely low sulfur contents as the noble metals are susceptible to sulfur poisoning.
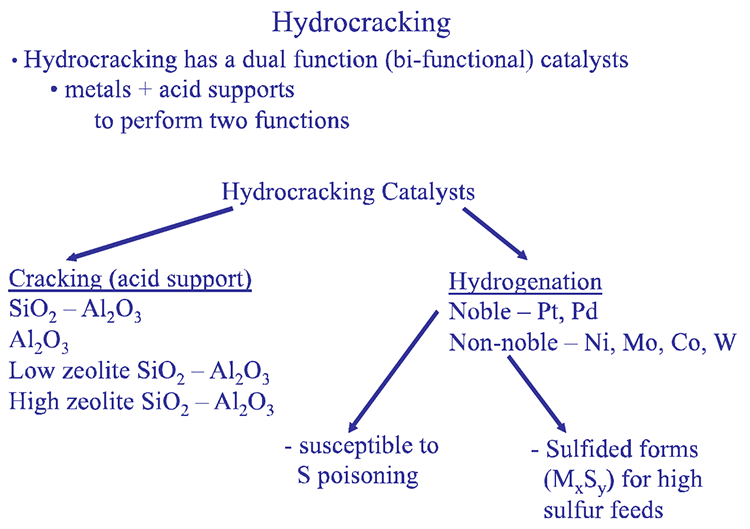
Hydrocracking
-Hydrocracking has a dual function (bifunctional) catalyst
-Metals + acid supports to perform two functions
-Hydrocracking Catalysts
-Cracking (acid Support
-SiO2 – Al2O3
-Al2O3
-Low zeolite SiO2 – Al2O3
-High zeolite SiO2 – Al2O3
-Hydrogenation
-Noble – Pt, Pd
-Susceptible to S poisoning
-Non-noble – Ni, Mo, Co, W
-Sulfided forms (MxSy) for high sulfur feeds
Hydrocracking processes most commonly include two reaction stages: Hydrotreating to remove heteroatom (S, N, O) species and Hydrocracking to increase the H/C ratio of the hydrocarbons in the feeds by hydrogenation and to decrease their molecular weight by cracking. In most cases, the hydrotreating reactor (HT) packed with cobalt-molybdenum catalysts precedes the hydrocracking (HC) reactor typically packed with nickel-tungsten catalysts (for hydrogenation) supported on alumina/silica (for cracking). Figure 7.12 shows different configurations of hydrocracking processes, depending on the heteroatom content of the feeds. For feeds with very low heteroatom contents, hydrocracking without hydrotreating may be applied, but this is very rare. Other process configurations include single stage with dual catalysts, two-stage dual and triple catalysts, as shown in Figure 7.11. The hydrocracking reactions are performed at 300–400°C and 8–15 MPa of hydrogen pressure.
Uses of Hydrocracking
Uses of Hydrocracking
In a refinery, hydrocracking complements catalytic cracking by taking on the more aromatic feedstocks that resist cracking, including the byproducts of FCC, such as light cycle oil (LCO). Hydrocracking can also be used to upgrade residual fractions using different reactor configurations and catalysts depending on the complexity of the upgrading tasks, as shown in Figure 7.12. As shown in Figure 7.13, for hydrocracking a relatively light feedstock (e.g., atmospheric residue), a fixed-bed configuration and relatively large-size catalyst particles can be used. In extreme cases with very heavy vacuum residue, an expanded bed configuration is used, in which very fine catalyst particles are entrained in the feed at high hydrogen pressures (high hydrogen/oil ratio). These extreme reaction conditions are necessary to prevent extensive coking on catalysts that could shut down the process. For intermediate cases, an ebullated (fluidized) bed configuration can be used, as shown in Figure 7.13.
In the United States, hydrocracking of LCO (from FCC) provides a large proportion of the diesel fuel production because straight-run LGO is a preferred stock for FCC to produce gasoline as the principal product. The major licensors of hydrocracking processes include Chevron, UOP, ExxonMobil Research and Engineering, BP, Shell, and BASF-IFP.
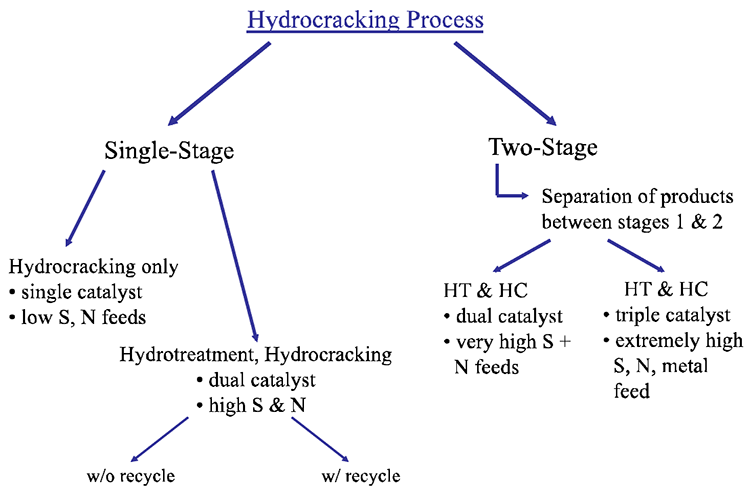
Hydrocracking Process
-Single Stage
-Hydrocracking only
-single catalyst
-low S, N feeds
-Hydrotreatment, Hydrocracking
-dual catalyst
-high S&N
-can be done with or without recycling
-Two-Stage (separation of the products between stages 1 & 2)
-HT & HC
-dual catalyst
-very high S + N feeds
-HT & HC
-triple catalyst
-extremely high S, N, metal feed
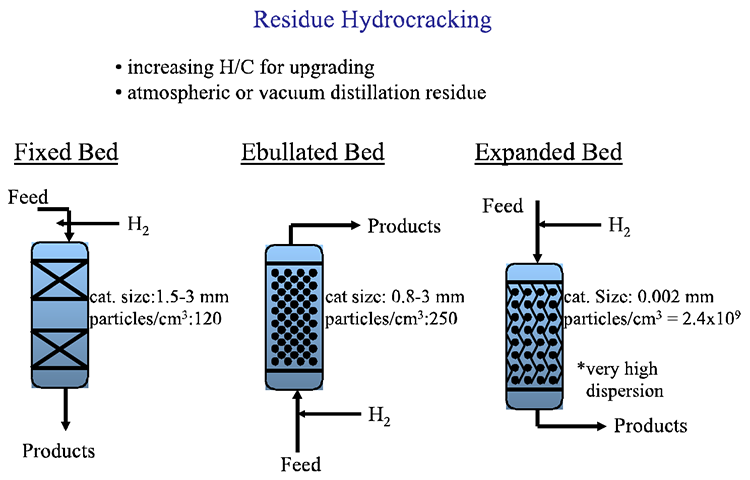
Residue Hydrocracking
-increasing H/C for upgrading
-atmospheric or vacuum distillation reside
| Bed Type | Cat. Size | Particles/cm3 |
|---|---|---|
| Fixed | 1.5 - 3mm | 120 |
| Ebullated | 0.8 - 3mm | 250 |
| Expanded | 0.002mm | 2.4x10⁹ |
Hydrocracking vs. Catalytic Cracking
| Catalytic Cracking - FCC | Hydrocracking |
|---|---|
|
-carbon rejection -endothermic -acid catalyst -more gas -more coke |
-hydrogen addition -exothermic -metal catalyst on acid support -less gas -less coke -costly process ($$$) |
- Hydrocracking involves C-C bond cleavage to produce lighter HC's
- More liquid yield with HYDRCRC
- More hydrogenated products
- Cracking is less severe
- Secondary cracking reactions are minimized by stabilization of active species by hydrogen
- Hydrocracking is more flexible w.r.t. the feedstock
- Refractory feedstocks (i.e. aromatics) can be processed
- C-C bond breaking after saturation with hydrogen
Above, we compare catalytic cracking (FCC - a carbon rejection process) with hydrocracking (HYDRCRC) with respect to the major attributes of both projects. Clearly, in a flexible refinery with a wide range of crude oil feedstocks, both processes are needed for the optimum conversion of the crude oil into desirable refinery products.
Self-Check Questions
Self-Check Questions
Please take a few minutes to answer the questions below. When you are satisfied with your responses, click Check My Answers to see how well you understood this lesson. These questions will help you study for the next quiz.
Assignments
Assignment Reminders
Exercise 6: Solve a problem on the material balance for the regenerator in Fluid Catalytic Cracking Process.
Quiz 3. Will cover material in Lessons 6 and 7. Check the Syllabus, or Course Calendar for Quiz 3 schedule.
Exercise 6
Exercise 6 Instructions
Solve a problem on the material balance for the regenerator in Fluid Catalytic Cracking Process.
Material Balance for FCC Regenerator
Problem
Burning the coke deposited on the catalyst particles generates all the heat necessary for catalytic cracking. Therefore, the coke burning rate is a critical parameter to control the rate of cracking. The composition of dry flue gas (excluding water) from the regenerator of an FCC unit is given in vol% as follows:
| Gas | Volume % |
|---|---|
| N2 | 81.6 |
| CO2 | 15.7 |
| CO | 1.5 |
| O2 | 1.2 |
The dry air (excluding moisture in the air) flow rate to the regenerator is given as 593 SCMM (standard cubic meters per minute). Considering that a significant portion of coke is carbon, calculate the carbon burning rate in the regenerator in kg/min. Remember: 1 kgmole at STP = 22.4 m3)
Hints:
In previous offering of this course, I have noted a serious weakness in the students' understanding of how to carry out simple mass balances. Here a few reminders and hints to solve this problem:
- Gas compositions are always reported as volume % (equivalent to mole %), not in mass, or weight%.
- Inert compounds (such as N2)go through reactors unchanged. These are referred to as "tie compounds." In this problem, knowing the air flow rate, you can calculate # moles of air, and thus # moles of nitrogen entering the reactor to calculate # moles of the flue gas, knowing the N2 % in the flue gas.
- After calculating the # moles of flue gas components and knowing their molecular weight, you can calculate the corresponding mass (weight) of the elements making up the flue gas molecules, e.g carbon in kg/min.
- If you still have questions on how you can use basic mass balances to solve this problem, please post them in the discussion forum.
Instructions for Submitting Response:
Once you have a solution to the exercises, you will submit your answers as a PDF by uploading your file to be graded. The MS Word, or Excel files should be saved as a PDF before submitting the exercise. Please Note: Scans of handwritten pages are not acceptable.
Please follow the instructions below.
- Find the Exercise 6 assignment in the Lesson 7 Module by either clicking Next until you find it, or by clicking Assignments and scrolling down until you find it.
- Make sure that your name is in the document title before uploading it to the correct assignment (i.e. Lesson7_Exercise6_Tom Smith).
Summary and Final Tasks
Summary
Catalytic processes constitute the core of the petroleum refineries to accomplish a number of conversion and finishing tasks. Catalytic cracking has been developed to produce high yields of gasoline with high octane # from high-boiling stocks using catalysts. Compared to thermal cracking, catalytic cracking takes place at lower temperatures and pressures and proceeds through carbocationic active species produced on acidic sites on catalyst surfaces. Fluid Catalytic Cracking (FCC) has become a universal refining process because of its high efficiency and feed flexibility. This process involves breaking up long chains of n-alkanes into shorter chains of branched alkanes (isoalkanes), cycloalkanes (naphthenes), and aromatics in high yields. Although the main product from FCC is high-octane number gasoline, it also produces LPG, cycle oils, and olefin-rich light hydrocarbons (C3, C4). The olefins are used as petrochemical feedstocks, or as reactants in alkylation and polymerization reactions, to produce higher molecular weight branched alkanes and olefins to contribute to the high-octane gasoline pool. Hydrocracking processes have been introduced for upgrading heavier crude oil fractions such as heavy vacuum gas oil (HVGO) and vacuum distillation residue VDR. The heaviest fractions of crude oil, HVGO and VDR, may not be easily processed by FCC because of potential problems with excessive coking on the catalysts. For upgrading these high-boiling and aromatic-rich feedstocks, hydrogen is introduced in the hydrocracking process, along with bifunctional catalysts systems, to keep coking under control while upgrading the heavy fractions to light and middle distillates.
Learning Outcomes
You should now be able to:
- distinguish the chemistry of catalytic cracking from the chemistry of thermal cracking and illustrate the formation of carbocations and IUPAC terminology for classification of carbocations;
- categorize the formation of different carbocations on active sites of cracking catalysts and assess the classification of acid sites (Lewis vs Bronsted) on catalyst surfaces;
- compare with examples how the product yields and composition obtained from catalytic processes differ from those from thermal cracking processes;
- analyze the thermodynamics of carbocation formation and evaluate how ionic chain reactions produce hydrocarbons with high octane numbers;
- appraise the historical evolution of catalytic cracking processes and formulate the driving forces that have shaped this evolution in reactor design and catalyst development;
- locate the hydrocracking process and hydroprocessing in the refinery flow diagram, illustrate hydrocracking processes, and evaluate different process objectives.
Reminder - Complete all of the Lesson 7 tasks!
You have reached the end of Lesson 7! Double-check the to-do list below to make sure you have completed all of the activities listed there before you begin Lesson 8. Please refer to the Course Syllabus for specific time frames and due dates. Specific directions for the assignments below can be found within this lesson.
| Readings | J. H. Gary, G. E. Handwerk, Mark J. Kaiser, Chapters 7 (Catalytic Hydrocracking) and Chapter 8 (Hydroprocessing and Resid Processing |
|---|---|
| Assignments | Exercise 6: The dry air flow rate to the regenerator is given as 593 SCMM (standard cubic meters per minute). Considering that a significant portion of coke is carbon, calculate the carbon burning rate in the regenerator in kg/min. Remember: (1 kgmole at STP = 22.4 m3). Quiz 3. Will cover material in Lessons 6 and 7. Check the Syllabus, or Course Calendar for Quiz 3 schedule. |
Questions?
If you have any questions, please post them to our Help Discussion (not email), located in Canvas. I will check that discussion forum daily to respond. While you are there, feel free to post your own responses if you, too, are able to help out a classmate.
Lesson 8: Catalytic Conversion Processes Part 2
Lesson 8 Overview
Overview
Video: FSC 432 Lesson 8 (7:52)
Hello. Welcome to lesson eight. We will talk about more catalytic conversion processes. We'll talk about in this class about alkylation, about polymerization, catalytic reforming, and isomerization. All of these processes are catalytic processes to produce high octane number gasoline.
Remember, for high performance, high power, we needed to produce high octane number gasoline. FCC obviously is the principal process in a refinery to produce high octane gasoline. Catalytic reforming, developed also during the Second World War, was really popular, very popular process.
Now the feed stock for catalytic cracking comes from the light ends unit. You'll remember the naphtha fractionater in the light ends unit. The heaviest product from the light ends unit is the heavy naphtha. The reason it's heavy-- it has a lot of naphthenes, or cycloalkanes in its composition.
So what happens in catalytic reforming, essentially converting these naphthenes or cycloalkanes into aromatics. Aromatics have very large octane numbers. Benzene, for example, has octane number of 100. So that it's highly, highly desirable high octane number component in the refinery blending scheme, if you will.
So dehydrogenation of naphthenes using a precious metal catalyst like platinum is pretty straightforward if you do have a clean heavy naphtha. If you have sulphur, associated with clean, or with naphtha feed, you need to hydro treat it to remove, because platinum is very susceptible to poisoning by sulphur. So you need a pre hydro treatment before catalytic reforming.
Now, up until 1990s, cat reforming was one of the most popular processes in the refinery as far as producing high octane number gasoline. But with the introduction of 1990 Clean Air Act amendments, the amount of gasoline or benzene and aromatics in gasoline were limited because of environmental issues or reasons of toxicity.
So all of a sudden now, catalytic reforming that produces a high aromatic content wasn't so desirable. But the refiners could not give up catalytic reforming. Why? Because there is a byproduct from cat reforming that is very, very valuable for the refinery. It has become, of course, increasingly valuable in the recent times. And that is hydrogen.
If you do dehydrogenate naphthenes, the byproduct is hydrogen, in addition to making aromatics. And hydrogen is needed in hydro treating processes and finishing processes that we will be talking about in the next lesson. So that is the cheapest source of hydrogen.
Obviously, you can make hydrogen from natural gas by reforming natural gas. And that is the done in refineries as well to produce additional hydrogen. But the cheapest source of hydrogen in a refinery comes from catalytic reforming. So it's still used in US refineries to make gasoline that is a reformate and, of course, the byproduct hydrogen.
The second process we will talk about this alkylation. Alkylation is, in a sense, the opposite of cracking, where you have a larger molecule, you crack it into smaller molecules. In Alkylation, we do the opposite. We take the smaller molecules and combine them into larger molecules that would fall in the boiling range for gasoline.
So the feed stocks for alkylation are three to four carbon atom alkanes, isoalkanes. Isobutane is the principal feed stock that comes from FCC. And also, olefins, three to four carbon atom olefins. That is propene and butene.
So combining isobutane with propene or butene will put you in the gasoline boiling range with seven to eight-carbon atoms. And the resulting product will be an isoalkane with a high octane number. That would be essentially making up the alkylate.
So alkylation is an alternative to catalytic reforming to make high octane gasoline without the aromatic. So that looks like really a nice alternative. But there is one problem. And the problem is for alkylation, you would need as catalyst highly concentrated acids, like highly concentrated sulfuric acid or highly concentrated hydrofluoric acid. These are, of course, not easy to our work with or transport or to have around, because of the risks involved with using this highly acidic materials.
Another process that generates larger hydrocarbons from smaller fragments are called polymerization. The difference between alkylation and polymerization is that we use just olefins in polymerization. No isobutane here.
So we use three to four carbon atom olefins-- typically again come from FCC process-- combine them using a milder acid as a catalyst this time-- so phosphoric acid. So the problems with handling phosphoric acids are not as severe as those with highly concentrated sulphuric or hydrogen fluoride used in alkylation. So polymerization produces branched olefins, which also have respectable octane numbers.
The last process we will talk about is isomerization. That's actually adding branching to straight-run paraffins. This is essentially the light naphtha that comes from the light end unit, as opposed to heavy naphtha that is naphthenic like naphtha is paraffinic. But it has only straight chain paraffins with low octane numbers. So isomerization add branching to these straight chains to increase the octane number. So all these processes just make high octane gasoline, which is, of course, the most important fuel in US refineries.
Overview
Among the catalytic conversion processes developed just before and during the Second World War are included, in addition to catalytic cracking, polymerization processes that were introduced in the mid- to late 1930s, and alkylation and isomerization processes that were developed in the early 1940s. The principal impetus for developing these processes was to meet the demand for high-octane-number gasoline required by the high compression gasoline engines, including those used in the aircraft. Catalytic reforming and catalytic isomerization were developed in the 1950s to increase the high-octane-number gasoline yields from refineries. These processes are still important in current refineries that are directed to maximize gasoline yield from the crude oil feedstock. By-products from some of these processes, such as LPG and hydrogen, have gained significance because of the increasing demand in modern refineries for LPG recently used as automobile fuel and for hydrogen to supply the increasing demand for hydrotreating and hydrocracking processes.
Learning Outcomes
By the end of this lesson, you should be able to:
- locate the catalytic reforming process in the refinery flow diagram, summarize the process objectives and evaluate the chemical reactions that take place in catalytic reforming to realize the process objectives;
- identify the catalysts used for catalytic reforming, evaluate the reaction network and the activity of catalysts, and illustrate the desirable reactions with specific examples;
- outline the principles of thermodynamics, kinetics, and transport phenomena to formulate limits on reaction conditions for controlling desirable and undesirable reactions in catalytic reforming;
- assess the commercial catalytic reforming processes and compare catalyst regeneration practice in each process;
- place the alkylation process in the refinery flow diagram particularly in relation to FCC process and describe the purpose of alkylation;
- demonstrate alkylation reaction mechanisms and evaluate the use of concentrated acid catalysis of alkylation;
- demonstrate polymerization reaction mechanisms and compare alkylation and polymerization reactions and catalysis.
What is due for Lesson 8?
This lesson will take us one week to complete. Please refer to the Course Syllabus for specific time frames and due dates. Specific directions for the assignments below can be found on the Assignments page within this lesson.
| Readings: | J. H. Gary, G. E. Handwerk, Mark J. Kaiser, Chapters 10 (Catalytic Reforming and Isomerization)and 11(Alkylation and Polymerization) |
|---|---|
| Assignments: | Exercise 7 |
Questions?
If you have any questions, please post them to our Help Discussion (not email), located in Canvas. I will check that discussion forum daily to respond. While you are there, feel free to post your own responses if you, too, are able to help out a classmate.
Catalytic Reforming
Catalytic Reforming
Catalytic reforming converts low-octane, straight-run naphtha fractions, particularly heavy naphtha that is rich in naphthenes, into a high-octane, low-sulfur reformate, which is a major blending product for gasoline. The most valuable byproduct from catalytic reforming is hydrogen to satisfy the increasing demand for hydrogen in hydrotreating and hydrocracking processes. Most reforming catalysts contain platinum as the active metal supported on alumina, and some may contain additional metals such as rhenium and tin in bi- or tri-metallic catalyst formulations. In most cases, the naphtha feedstock needs to be hydrotreated before reforming to protect the platinum catalyst from poisoning by sulfur or nitrogen species. With the more stringent requirements on benzene and the total aromatics limit for gasoline in the United States and Europe, the amount of reformate that can be used in gasoline blending has been limited, but the function of catalytic reforming as the only internal source of hydrogen continues to be important for refineries.
Figure 8.1 locates the catalytic reforming process in a refinery. The feedstock for catalytic reforming is straight-run (directly from the crude oil) heavy naphtha that is separated in the naphtha fractionator of the Light Ends Unit, as discussed in Lesson 4. Light naphtha from the naphtha fractionator, inherently a low-octane-number fraction, can be sent directly to blending in gasoline pool after hydrotreating, if necessary, or sent to an isomerization process to increase its octane number. As discussed in Lesson 3, hydrotreating heavy naphtha is often necessary before catalytic reforming to protect the noble metal catalyst (e.g., Pt) used in the reforming process. The intended product from catalytic reforming is the high-octane-number reformate and the most significant by-product is hydrogen gas.
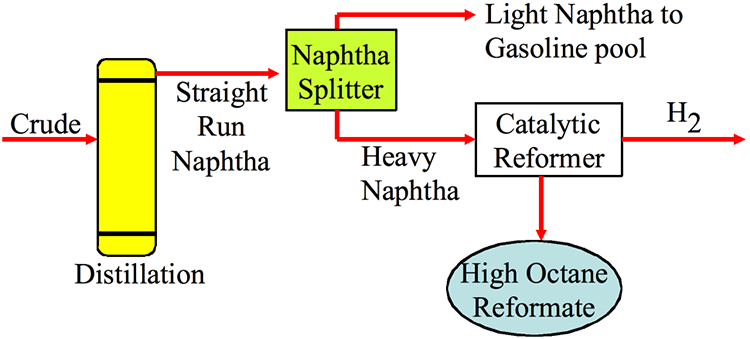
Chemistry of Catalytic Reforming
Chemistry of Catalytic Reforming
The general categories of the desired reactions in catalytic reforming are identified in the list below, along with the catalysts used in the process. Considering that the main purpose of the process is to increase the octane number of heavy naphtha, conversion of naphthenes to aromatics and isomerization of n-paraffins to i-paraffins are the most important reactions of interest. Under the right reaction conditions, aromatics in the feed, or those produced by dehydrogenation naphthenes, should remain unchanged. The reforming reactions produce large quantities of hydrogen, and one should remember that the dehydrogenation catalysts used in reforming can also catalyze hydrogenation and hydrocracking of aromatics during catalytic reforming. It is, therefore, important to keep these side reactions to a minimum by controlling the reactor conditions such as temperature and hydrogen pressure, as discussed in more detail later in this section.
The catalysts used in reforming contains platinum (Pt), palladium (Pd), or, in some processes, bimetallic formulations of Pt with Iridium or Rhenium supported on alumina (Al2O3).
Catalytic Reforming Reactions and Catalysts
Reactions of Interest
- naphthenes → aromatics
- paraffins are isomerized
- aromatics are unchanged
Catalysts Used
Platinum catalyst on metal oxide support (platforming)
Pt/Al2O3
Bimetallic – Iridium or Rhenium
Pt-Re/Al2O3
The information above shows the ranges of composition for feedstock heavy naphtha and the reformate product (high-octane gasoline). Comparing the compositions of the feedstock and the product, one can see that the largest change in feedstock composition is a substantial increase in the aromatics content of the feedstock, with attendant decreases in naphthene and paraffin contents to constitute the product.
Catalytic Reforming Feedstock and Product
|
Feedstock: Heavy Naphtha Paraffins ⇒ 45-55% Naphthenes ⇒ 30-40% Aromatics ⇒ 5-10% |
Product: High Octane Gasoline Paraffins ⇒ 30-50% Naphthenes ⇒ 5-10% Aromatics ⇒ 45-60% |
Low severity (relatively low octane) → low paraffin conversion
High severity → high paraffin conversion
Lean naphtha → high n-paraffinic content - difficult to process
Rich naphtha → low n-paraffinic (high naphthene) content - easy to process
The information above also defines some specific terms for catalytic reforming related to the feedstock composition (lean, or rich naphtha), or to the extent of n-paraffin conversion in the process (low-, or high-severity). One could conclude from these terms that reforming of heavy naphtha that contains higher n-paraffin content requires more severe conditions in the reactor.
Desirable Chemical Reactions
Desirable Chemical Reactions
Figure 8.2 illustrates more specifically the desirable chemical reactions of catalytic reforming, including:
- dehydrogenation of naphthenes to aromatics,
- dehydroisomerization of alkyl-C5-naphthenes,
- dehydrocyclization of n-paraffins to aromatics, and
- isomerization of n-alkanes to i-alkanes.
All of these reactions significantly increase the octane number (research octane number [RON] from 75 to 110 in Reaction 1, from 91 through 83 [cyclohexane] to 100 in Reaction 2, from 0 to 110 in Reaction 3, and from –19 to 90 in Reaction 4).
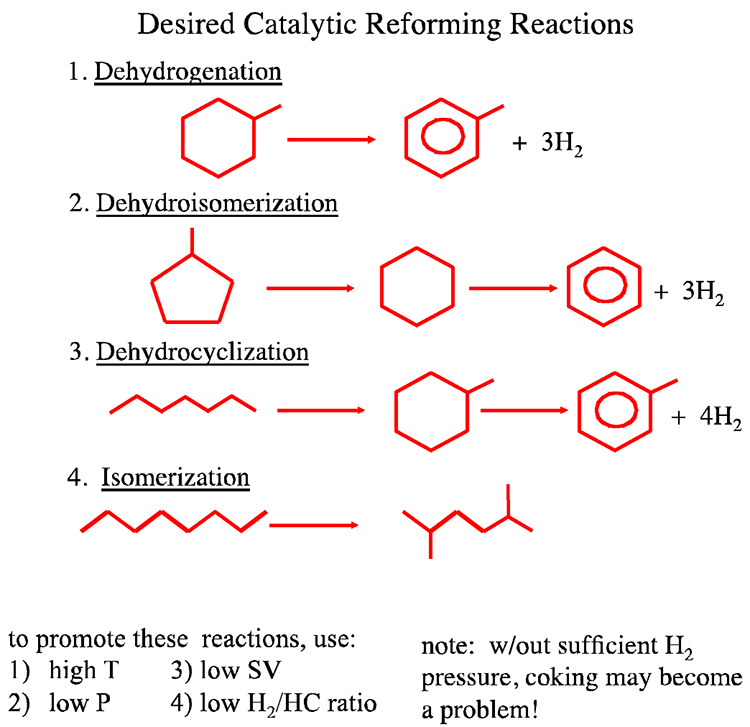
Reaction conditions that promote the desirable reactions are also listed in Figure 8.2. As can be seen in Figure 8.2, aromatic compounds and large quantities of by-product H2 are produced in the highly endothermic Reactions 1–3. High temperatures, low hydrogen pressures, low space velocity (SV), and low H2/HC ratio strongly promote the conversion in Reaction 1-3. Although maintaining a low hydrogen pressure is needed for promoting equilibrium conversion in Reactions 1-3, it is, however, necessary to maintain a sufficiently high hydrogen pressure in the reactors to inhibit coke deposition on the catalyst surfaces.
Undesired Reactions
Undesired Reactions
Hydrocracking is an undesired side reaction in catalytic reforming because it consumes hydrogen and decreases the reformate yield by producing gaseous hydrocarbons. Hydrocracking reactions are exothermic, but they can still be kinetically favored at high temperatures, and favored, obviously, by high hydrogen pressures. Below lists the heat of reactions for catalytic reforming reactions. Typically, reformers operate at pressures from 50 to 350 psig (345–2415 kPa), a hydrogen/feed ratio of 3–8 mol H2/mol feed, and liquid hourly space velocities of 1–3 h-1[1]. These conditions are chosen to promote the desired conversion reactions and inhibit hydrocracking while limiting coke deposition on the catalyst surfaces.
Undesired Reactions in Catalytic Reforming
Hydrocracking
n-C10+H2 → n-C6+n-C4
to inhibit this reaction, use
- high T
- high SV
- Low H2P
Catalytic reformers are normally run at low H2 pressure to inhibit hydrocracking!
Heats of Reactions:
paraffin to naphthene → 44 kJ/mol H2 - endothermic
naphthenes to aromatics → 71 kJ/mol H2 - endothermic
hydrocracking → -56 kJ/mol H2 - exothermic
Reaction Network
Reaction Network
A reaction network for catalytic reforming is shown in Figure 8.3 [2], indicating the role of metallic (M) and the acidic (A) sites on the support in catalyzing the chemical reactions. The surfaces of metals (e.g., Pt) catalyze dehydrogenation reactions, whereas the acid sites on the support (e.g., alumina) catalyze isomerization and cracking reactions. Metal and acid sites are involved in the catalysis of hydrocracking reactions. Achieving the principal objective of catalytic reforming—high yields and high quality of reformate—can be achieved, to a large extent, by controlling the activity of the catalysts and the balance between acidic and metallic sites to increase the selectivity to desirable reactions in the reaction network.
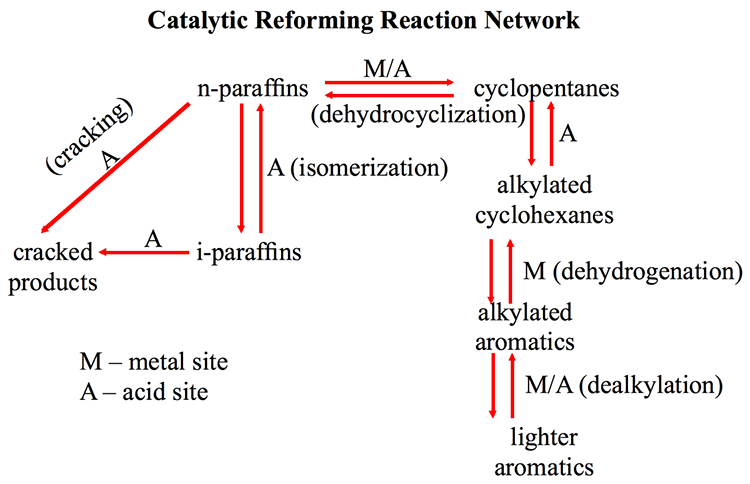
Catalytic Reforming Reaction network
KEY: R= Reversible, M = Metal Site, A=Acid Site
Lighter aromatics become alkylated aromatics (R)
-M/A (dealkylation)
Alkylated Aromatics become alkylated cyclohexanes (R)
-M (dehydrogenation)
Alkylated cyclohexanes become cyclopentanes (R)
-A
Cyclopentanes become n-paraffins (R)
-M/A (dehydrocyclization)
n-paraffins become i-paraffins (R)
-A (isomerization)
i-paraffins and n-paraffins to cracked products
-A (cracking)
Catalytic Reforming Processes
Catalytic Reforming Processes
Even in the presence of hydrogen during reforming reactions, catalysts are deactivated by coke deposition. Commercial catalytic cracking processes are classified based on how catalysts are regenerated, as shown below, as semi-regenerative, cyclic, and continuous reforming processes. The first commercial catalytic reforming process was introduced by UOP in 1949 as the PlatformingTM process that used three fixed-bed reactors. Figure 8.4 (on next page), shows a process with two reactors. The reactors operate in series with furnaces placed before each reactor to heat the feedstock and the reactor effluents to 500–530°C before entering each reactor because the predominant reforming reactions are highly endothermic. These units, called “semi-regenerative catalytic reformers,” need to be shut down once every 6–24 months for the in-situ regeneration of catalysts that are deactivated by coke deposition. Later designs included an extra reactor (a swing reactor) to enable isolation of one reactor at a time to undergo catalyst regeneration, whereas the other three reactors are running (Cyclic). This configuration enables longer on-stream times (up to 5 years) before scheduled shutdowns for catalyst regeneration, but it has not become popular. In the HYSYS Project 2, you will be comparing the performance of the three different configurations of catalytic reforming processes.
Catalytic Reforming Processes
Catalytic Reforming Processes Based on Catalyst Regeneration
- Semi-regenerative (1949) – unit taken off-stream anywhere from every 3 to 24 months
- Cyclic (1960) – involves swing reactor. Basically, operate 3 out of 4 and use extra reactor to take one offline.
- Continuous (1971) – catalyst is removed and replaced during the operation. Maintains high activity. Expensive.
Licenced Processes (differences in catalysts and reactor configurations)
- Platforming (UOP process) (1949)
- Powerforming (Exxon)
- Ultraforming (Amoco)
- Catalytic Reforming (Engelhard)
- Magnaforming (Arco)
- Reforming (IEP)
- Rheniforming (Chevron)
Continuous Catalyst Regeneration
Continuous Catalyst Regeneration
A continuous catalyst regeneration (CCR) scheme for reforming came on stream in 1971. Figure 8.5 shows a flow diagram for the CCR process. The reactors are stacked with a moving bed of catalyst trickling from the top reactor to the bottom reactor by gravity. Partially deactivated catalyst from the bottom of the reactor stack is continuously withdrawn and transferred to the CCR regenerator. The regenerated catalyst is re-injected to the top of the first reactor to complete the catalyst circulation cycle. Hydrotreated naphtha feed is combined with recycled hydrogen gas and heat exchanged with the reactor effluent. The combined feed is then raised to the reaction temperature in the charge heater and sent to the first reactor section. Because the predominant reforming reactions are endothermic, an inter-reactor heater is used to reheat the charge to the desired reaction temperature before it is introduced to the next reactor. The effluent from the last reactor is heat exchanged with the combined feed, cooled, and separated into vapor and liquid products in a separator.
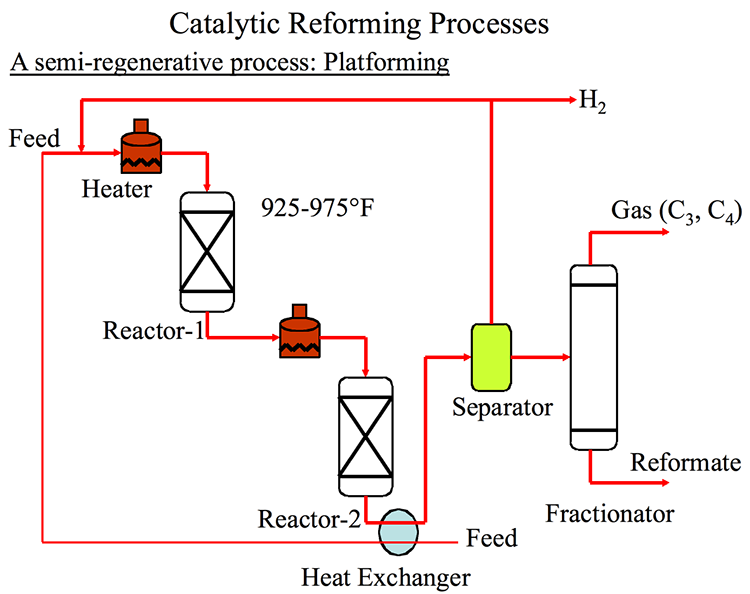
The vapor phase is rich in hydrogen gas, and a portion of the gas is compressed and recycled back to the reactors. Recycling hydrogen is necessary to suppress coking on the catalysts. The hydrogen-rich gas is compressed and charged together with the separator liquid phase to the product recovery section. The performance of the unit (i.e., steady reformate yield and quality) depends strongly on the ability of the CCR regenerator to completely regenerate the catalyst. In addition to UOP’s Platforming process, the major commercial catalytic reforming processes include PowerformingTM (ExxonMobil), UltraformingTM and MagnaformingTM (BP), Catalytic Reforming (Engelhard), Reforming (IFP), and RheniformingTM (Chevron).
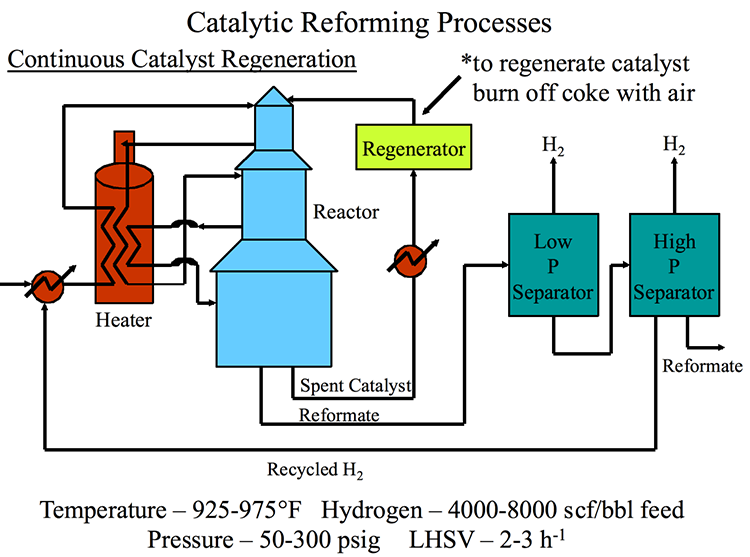
The continuous catalytic reforming process starts at the heater, which goes to the reactor. From the reactor, it can either go back to the heater or move on. The spent catalyst exits and goes to a regenerator to regenerate the catalyst and burn off coke with air. The reformate continues to a low p separator and then a high p separator. Both separators give off H2 gas. Reformate excits and recycled H2 heads back to the heater. The temperatures are 925-975*F, Hydrogen – 4000-8000 scf/bbl fee, Pressure – 50-300 psig, LHSV – 2-3/hr.
Alkylation
Alkylation
The alkylation process combines light iso-paraffins, most commonly isobutane, with C3–C4 olefins, to produce a mixture of higher molecular weight iso-paraffins (i.e., alkylate) as a high-octane number blending component for the gasoline pool. Iso-butane and C3–C4 olefins are produced as by-products from FCC and other catalytic and thermal conversion processes in a refinery. The alkylation process was developed in the 1930s and 1940s to initially produce high-octane aviation gasoline, but later it became important for producing motor gasoline because the spark ignition engines have become more powerful with higher compression ratios that require fuel with higher octane numbers. With the recent restrictions on benzene and the total aromatic hydrocarbon contents of gasoline by environmental regulations, alkylation has gained favor as an octane number booster over catalytic reforming. Alkylate does not contain any olefinic or aromatic hydrocarbons.
Alkylation reactions are catalyzed by strong acids (i.e., sulfuric acid [H2SO4] and hydrofluoric acid [HF]) to take place more selectively at low temperatures of 70°F for H2SO4 and 100°F for HF. By careful selection of the operating conditions, a high proportion of products can fall in the gasoline boiling range with motor octane numbers (MONs) of 88–94 and RONs of 94–99 [15]. Early commercial units used H2SO4, but more recently, HF alkylation has been used more commonly in petroleum refineries. HF can be more easily regenerated than H2SO4 in the alkylation process, and HF alkylation is less sensitive to temperature fluctuations than H2SO4 alkylation [3]. In both processes, the volume of acid used is approximately equal to the volume of liquid hydrocarbon feed. Important operating variables include acid strength, reaction temperature, iso-butane/olefin ratio, and olefin space velocity. The reactions are run at sufficiently high pressures to keep the hydrocarbons and the acid in the liquid phase. Good mixing of acid with hydrocarbons is essential for high conversions.
Some examples of desired alkylation reactions (combination of iso-paraffins with olefins) are given in Figure 8.6. These occur through ionic chain reactions (Figure 8.7) initiated by donation of a proton from the acid catalyst to an olefin to produce a carbocation that reacts with iso-butane to form a tert-butyl cation. Subsequent propagation reactions involve the reactions of a tert-butyl cation with olefins to form larger iso-paraffin cations that lead to final products through reactions with iso-butane to form a new tert-butyl cation to sustain the chain reaction [3]. The alkylation reaction is highly exothermic; therefore, cooling the reactor contents during alkylation is important.
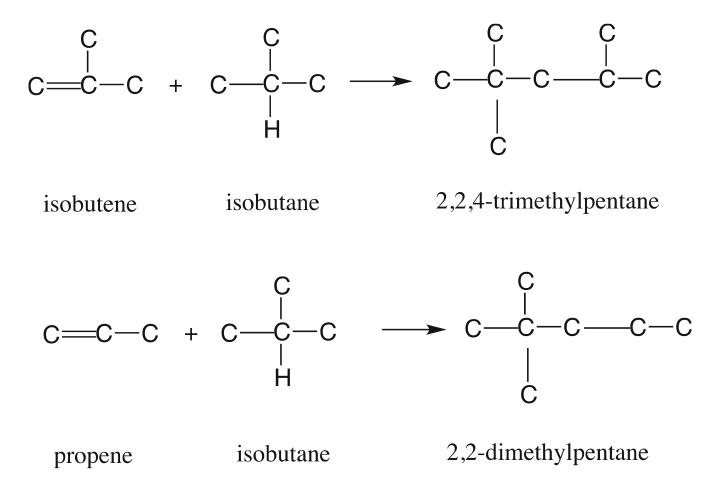
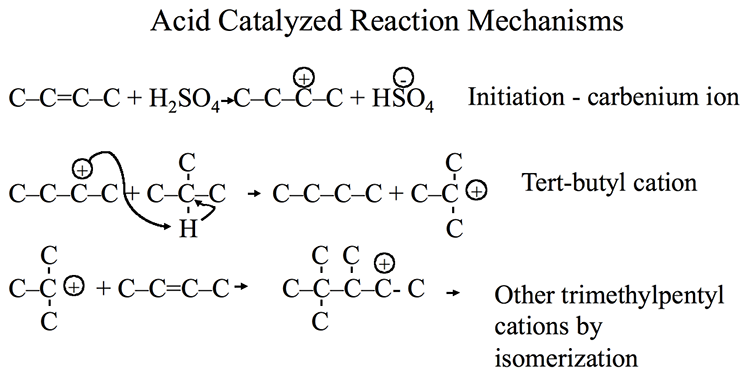
UOP HF Alkylation Process
UOP HF Alkylation Process
Figure 8.8 shows a flow diagram for a UOP HF alkylation process [4]. Olefin and iso-butane feed streams are dried to remove water before they are mixed with the iso-butane recycle stream. The mixture is fed to the reactor, where it is highly dispersed into an incoming stream of acid catalyst. Conversion of reactants to high-quality alkylate takes place quickly, and the mixture flows up to the settling zone. In the settler, the catalyst is separated out as a bottom phase and flows, by gravity, through the catalyst cooler and returns to the reactor. The hydrocarbon phase from the settler, which contains propane, recycled iso-butane, normal butane, and alkylate, is charged to the main fractionator. High-purity propane is sent overhead to pass through the HF- propane stripper, de-fluorinator, and potassium hydroxide (KOH) treater before it is recovered. Recycled iso-butane is drawn from the side of the fractionator and returned to the entrance of the reactor after it is mixed with the dried olefin and isobutane feed. The n-butane product is taken from the side of the fractionators as vapor, condensed and KOH- treated before recovery. The alkylate product is obtained from the bottom of the fractionator. The HF catalyst is regenerated onsite in the regeneration section, where heavy oils (tars) are removed from the catalyst.
![UOP HF Alkylation Process [4]. More info in text above.](/fsc432/sites/www.e-education.psu.edu.fsc432/files/Lesson7/Lesson8Fig12.png)
Transporting and working with concentrated acids pose safety risks. In particular, HF tends to form a vapor cloud that is difficult to disperse. The major licensor of the HF alkylation processes is UOP, whereas ExxonMobil and Stratford Engineering Corporation license H2SO4 alkylation processes. A newly designed alkylation process by UOP uses a solid catalyst called Alkylene®. Advantages of this new process over traditional HF alkylation processes (liquid acid technology) include no acid transportation, no acid spills, no corrosion, and reduced maintenance cost. Efforts to develop alternative processes that use solid acid catalysts instead of concentrated HF and H2SO4 for alkylation are underway.
Polymerization
Polymerization
The polymerization process combines propenes and butenes to produce higher olefins with high-octane numbers (97 RON and 83 MON) for the gasoline pool. The polymerization process was used extensively in the 1930s and 1940s, but it was replaced to a large extent by the alkylation process after World War II. It has gained favor after phasing out the addition of tetraethyl lead (TEL) to gasoline, and the demand for unleaded gasoline has increased. Typical polymerization reactions are shown in Figure 8.9 [5].
The most commonly licensed polymerization process is the UOP polymerization process, which uses phosphoric acid as catalyst. IFP licenses a Dimersol® process that produces dimers from propene or butene using a homogeneous aluminum alkyl catalyst.
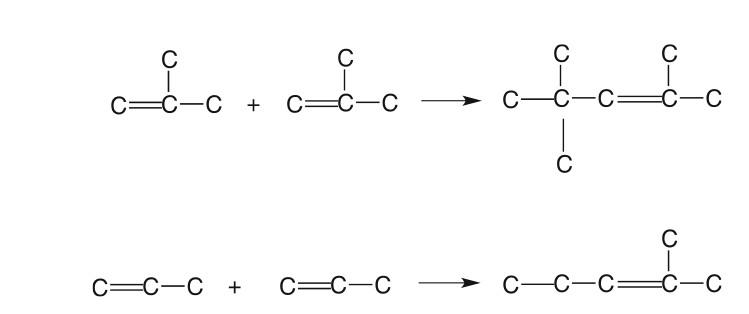
Isomerization
Isomerization
Isomerization processes have been used to isomerize n-butane to iso-butane used in alkylation and C5 /C6 n-paraffins in light naphtha to the corresponding iso-paraffins to produce high-octane number gasoline stocks after the adoption of lead-free gasoline. Catalytic isomerization processes that use hydrogen have been developed to operate under moderate conditions. Typical feedstocks for the isomerization process include hydrotreated light straight-run naphtha, light natural gasoline, or condensate. The fresh C5/C6 feed combined with make-up and recycled hydrogen is directed to a heat exchanger for heating the reactants to reaction temperature. Hot oil or high-pressure steam can be used as the heat source in this exchanger. The heated feed is sent to the reactor. Typical isomerate product (C5+) yields are 97 wt% of the fresh feed, and the product octane number ranges from 81 to 87, depending on the flow configuration and feedstock properties.
Self-Check Questions
Self-Check Questions
Before attempting to take the quiz this week, spend a few minutes answering the questions below. Make sure to click Check to see how well you understand the content.
Assignments
Assignment Reminder
Each week, you will have a number of assignments. This week's assignments are listed below with instructions on how and where to submit them. For due dates, please check your syllabus.
Exercise 7
Exercise 7 Instructions
Material Balance for FCC Regenerator
Problem
Burning the coke deposited on the catalyst particles generates all the heat necessary for catalytic cracking. Therefore, the coke burning rate is a critical parameter to control the rate of cracking. The composition of dry flue gas from the regenerator of an FCC unit is given in vol% as follows:
GasVolume %
N281.6
CO215.7
CO 1.5
O2 1.2
The dry air flow rate to the regenerator is given as 593 SCMM (standard cubic meters per minute). Considering that a significant portion of coke is carbon, you calculated in Exercise 6 the carbon burning rate in the regenerator as 52.6 kg/min.
For this exercise, calculate the coke burning rate in kg/min and the hydrogen content (wt%) of the coke burnt. Assume that the coke consists only of carbon and hydrogen.
Hint: Use an oxygen balance to determine the missing oxygen which was consumed to burn the hydrogen in coke. Water content of the flue gas is not given because only the dry gas analysis is reported.
Note: The assumption that “coke consists only of carbon and hydrogen” may be justified for gas oil feedstock that is virtually free of sulfur and other heteroatom species. For high sulfur feeds, sulfur content of the burnt coke can also calculated from the dry flue gas analysis.
Instructions for Submitting Response:
Once you have a solution to the exercises, you will submit your answers as a PDF by uploading your file to be graded. The MS Word, or Excel files should be saved as a PDF before submitting the exercise. Please Note: Scans of handwritten pages are not acceptable.
Please follow the instructions below.
- Find the Exercise 7 assignment in the Lesson 8 Module by either clicking Next until you find it or by clicking Assignments and scrolling down until you find it.
- Make sure that your name is in the document title before uploading it to the correct assignment (i.e. Lesson8_Exercise7_Tom Smith).
Summary and Final Tasks
Summary
Catalytic reforming, alkylation and polymerization processes aim at increasing the yield of high-octane-number gasoline in the refineries. Catalytic reforming uses naphthene-rich, straight-run heavy naphtha as feedstock and produces a high-octane number reformate for the gasoline blending pool in a refinery. Principal catalytic reactions that take place on noble metals (e.g., Pt) and on acidic catalyst supports (e.g., Al2O3) produce high yields of aromatic hydrocarbons and i-alkanes, respectively, to result in a high-octane number product. A valuable by-product from catalytic reforming is hydrogen gas for which the demand is increasing in the refineries, particularly for finishing processes, such as hydrotreatment. Alkylation and polymerization reactions take shorter chains of C3, C4 alkanes and olefins and combine them to get branched C7, C8 alkanes in alkylate, and polymerate, respectively, to increase the yield of high-octane gasoline. Isomerization processes convert n-butane to i-butane to be used as feed in alkylation processes, or isomerize n-C5 and n-C6 to the corresponding i-alkane to produce, again, high-octane-number gasoline stock.
Learning Outcomes
You should now be able to:
- locate the catalytic reforming process in the refinery flow diagram, summarize the process objectives and evaluate the chemical reactions that take place in catalytic reforming to realize the process objectives;
- identify the catalysts used for catalytic reforming, evaluate the reaction network and the activity of catalysts, and illustrate the desirable reactions with specific examples;
- outline the principles of thermodynamics, kinetics and transport phenomena to formulate limits on reaction conditions for controlling desirable and undesirable reactions in catalytic reforming;
- assess the commercial catalytic reforming processes and compare catalyst regeneration practice in each process;
- place the alkylation process in the refinery flow diagram particularly in relation to FCC process and describe the purpose of alkylation;
- demonstrate alkylation reaction mechanisms and evaluate the use of concentrated acid catalysis of alkylation;
- demonstrate polymerization reaction mechanisms and compare alkylation and polymerization reactions and catalysis.
Reminder - Complete all of the Lesson 8 tasks (Blog 8 and Quiz 4)!
You have reached the end of Lesson 8! Double-check the to-do list in the table below to make sure you have completed all of the activities listed there before you begin Lesson 9. Please refer to the Course Syllabus for specific time frames and due dates. Specific directions for the assignment below can be found within this lesson.
Questions?
If you have any questions, please post them to our Help Discussion (not email), located in Canvas. I will check that discussion forum daily to respond. While you are there, feel free to post your own responses if you, too, are able to help out a classmate.
| Readings: | J. H. Gary, G. E. Handwerk, Mark J. Kaiser, Chapters 10 (Catalytic Reforming and Isomerization)and 11(Alkylation and Polymerization) |
|---|---|
| Assignments: | Exercise 7 |
Lesson 9: Finishing Processes
Lesson 9 Overview
Overview
Video: FSC 432 Lesson 9 (7:46)
So in the good old days of Penn crude-- this is a simple now I'm holding in my hand of Pennsylvania crude. You can how fluid that is, or low viscosity. You can really see that it's almost drinkable. I'm tempted to actually take a sip from this now, but that's probably against regulations here in the museum.
Now for this you would not need any hydrotreatment because this has virtually no sulfur in it. But the current crude oil, which would be much more viscous than this, much more aromatic-- this essentially paraffinic crude-- then you would really need hydrotreatment to remove sulfur, nitrogen, or metals associated with this. This is an extinct crude oil. This is the early Pennsylvania crude.
Here we see some samples of Pennsylvania crude oil, the first group that was drilled and produced in the United States. And Penn crude, or Pennsylvania crude, is a very special crude oil. It is the sweetest. The sweet means, in this case, not really with a lot of sugar, but very low sulfur.
So you can see the light color of the crude oil. This is actually as it came from underground without any refining. This is very rare now, and Penn crude is pretty much extinct these days. This was so sweet that some entrepreneurs could actually sell this as a remedy.
There was one man who was Samuel Kier in Pittsburgh, I think he was in Canal Street. He put the Penn crude in pint bottles and sold them as remedies for different ailments, such as stomach aches, headaches, or growing mustaches on young boys who wanted to have a mustache to show off.
So sour crude oils, obviously, are what we have today. That means high sulfur crude oil, which would require quite a bit of hydrotreatment to remove sulfur, unlike the sweet Penn crude grade oil.
Having talked about the separation processes and the conversion units, we are now ready to talk about the finishing processes-- that's the third kind of processes using petroleum refining. Now finishing is done essentially to make sure that the product that is leaving the refinery is compliant with the required performance specifications, such as octane number for gasoline, or cetane number for diesel fuel. And also the environmental regulations, like sulfur, nitrogen, or metal contents of these fuels that are leaving the refinery to be sold in the marketplace.
So the finishing processes are hydrotreatment and blending. We do categorized them into these two main categories. In hydrotreatment the point is to remove the heteroatom, whatever that is, sulfur, nitrogen, or metal, with the help of a catalyst and hydrogen. So the objective is to use the minimum amount of hydrogen and make the minimum amount of change in the hydrocarbon structure of your feed materials to remove the sulfur, nitrogen, or metal out.
Minimizing hydrogen is important because hydrogen is a very expensive chemical material. And, of course, hydrotreatment or finishing is not a place to make the chemical changes desired in the hydrocarbon skeleton, or hydrocarbon structure. Conversion processes do that.
So in hydrotreatment then we would need catalysts. These are typically supported catalysts. The support is alumina, silica, in some cases, mixed oxides. And the metals typically molybdenum, cobalt or nickel that are put on these supports.
We need these metals to dissociate molecular hydrogen, so that it can actually react with these heteroatom species. In hydrodesulfurization, we remove sulfur as H 2 S, which is an acidic gas, nitrogen as ammonia, which is a base. So the purpose of hydrogen is to really seek out and find that heteroatom, and pull that out of the hydrocarbon structure as H 2 S, for sulfur, and ammonia from the nitrogen-containing species.
The metals typically of vanadium and nickel are separated as sulfides on catalyst surfaces-- a pretty interesting chemistry, as we will discuss this in lesson. So hydrotreatment would give us desirable heteroatom content, or regulated heteroatom content in the products.
With blending we need to look into all the specifications that are needed for a given product. For example, for diesel fuel the viscosity, or pour point, could be important. And typically, in a refinery to make a product like gasoline or diesel, you will be blending a large number of streams. Remember, there are quite a few different streams coming from different conversion processes, or separation processes, to be blended to make these final products.
For gasoline, it's the octane number. So we will go through some of the procedures we can use to calculate the physical properties like pour point or viscosity of these blends, to make sure that they actually follow the specifications needed for these products.
You would see that many of these calculations are nonlinear. If you take, say, sample A and sample B, blend them together, the viscosity of that blend would not be the average of two, using essentially a linear mixing formula. So there are correlations that were developed to incorporate these non-linearities into calculating, determining, the final properties of the blends from multiple streams to make the final product from the refinery.
Overview
Following our discussion on separation and conversion processes, this lesson will cover the third type of refining processes – finishing processes. Finishing processes include hydrogenation for stabilization of petroleum products, hydrotreating to remove heteroatoms (S, N, and metals) and product blending to attain the product specifications and assure compliance with environmental and government regulations on petroleum fuels and materials. The finishing step is the last stage before the hydrocarbon streams from different units leave the refinery as commercial fuels and materials. Therefore, the challenges involved both hydrotreatment and blending operations are diverse and complex. The constraints on the commercial fuels that need to be satisfied simultaneously range from composition and performance specifications to seasonal fluctuations in demand for different fuels and materials. A brief overview of only the basic concepts in finishing operations is presented in this lesson.
Learning Outcomes
By the end of this lesson, you should be able to:
- compare hydrogenation and hydrotreatment with respect to process goals, catalysis, and chemistry;
- categorize and evaluate HDS, HDN, and HDM processes;
- assess hydrotreatment catalysts, kinetics and process configurations;
- demonstrate procedures to calculate critical properties of blended products, e.g., octane number, pour point, and viscosity.
What is due for Lesson 9?
Please refer to the Course Syllabus for specific time frames and due dates. Specific directions for the assignments below can be found in this lesson.
| Readings: | Petroleum Refining, by J. H. Gary and G. E. Handwerk, Chapter 9 (Hydrotreating) and Chapter 12 (Product Blending) |
|---|---|
| Assignments: | Exercise 8 Exam 2. Will cover material in Lessons 6-9. Exam 2 is found in the Exam 2 Module. |
Questions?
If you have any questions, please post them to our Help Discussion Forum (not email), located in Canvas. I will check that discussion forum daily to respond. While you are there, feel free to post your own responses if you, too, are able to help out a classmate.
Hydrogenation
Hydrogenation
Hydrogenation, or adding hydrogen to unsaturated hydrocarbons, is used for stabilization of petroleum products and aromatic reduction [1]. One particular application of hydrogenation is to saturate unstable olefins and di-olefins that are implicated in producing gums (high-molecular-weight sticky semi-solid material) during the storage of fuels, such as gasoline and jet fuel. Gum formation is detrimental, particularly, to the operation of fuel injectors in combustion engines. Narrow passages found in fuel injectors can be partially or completely plugged with deposition/accumulation of gums on flow surfaces, causing engine failures. Figure 9.1 on the next page shows examples of hydrogenation of an aromatic compound (alkylated naphthalene) and an olefin. The objective of hydrogenation is just adding hydrogen to unsaturated hydrocarbons using precious metal (Pt, Pd) or Ni catalysts at low temperatures to avoid cracking or other chemical changes.
[1] Petroleum Refining, by J. H. Gary, G. E. Handwerk, M. J. Kaiser, 5th Edition, CRC Press NY, 2007, Chapter 9, Hydrotreatment, pp. 195-203.
Hydrotreatment
Hydrotreatment
As a natural substance, crude oil contains heteroatom (S, N, and O) compounds as well as metals (mainly Ni and V) in addition to hydrocarbons. The sulfur content of crude oils normally ranges from 0.05 to 6 wt %, nitrogen content varies from 0.1 to 1 wt %, oxygen from 0.1 to 2.0 wt %, and metals from 10 to 1000 ppm. Once crude is fractionated by distillation, the heteroatoms (particularly S, N, and metal compounds) are distributed in the products. Heteroatom compounds are mainly associated with the higher boiling fractions and the residues that are rich in aromatic compounds. The presence of heteroatom compounds in petroleum products is undesirable because they reduce fuel stability, contribute to the emission of pollutants, and damage engines. Heteroatom compounds in refinery streams (e.g., basic nitrogen compounds, sulfur compounds, and metals) can deactivate catalysts and promote coke formation [2].
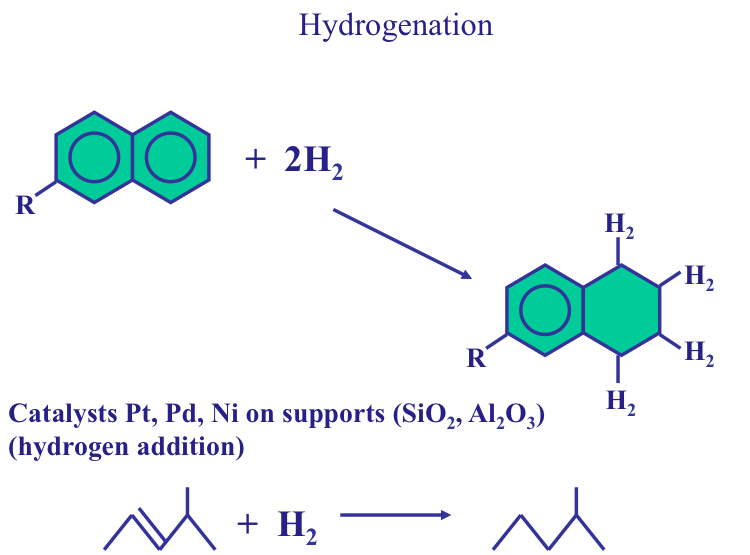
The light products such as LPG and naphthas have low concentrations of sulfur and require minimal treatment, such as absorption in alkaline solvents (e.g., H2S or mercaptan sulfur) or conversion of mercaptans to sulfides to eliminate odor. For example, the UOP MeroxTM process is widely used to remove H2S and mercaptan sulfur (Merox extraction) or to convert mercaptan sulfur to less-objectionable disulfides (Merox sweetening) [2]. The Merox process can be used to treat liquids such as LPG, naphtha, and kerosene. Removing sulfur from higher molecular weight and more complex molecules requires hydrotreatment processes that use hydrogen.
[2] S. Eser and M. R. Riazi, “Crude Oil Refining Processes” In Petroleum Refining and Natural Gas Processing, Editors: M. R. Riazi, S. Eser, J. L. Peña, ASTM International, West Conshohocken, PA, 2013, p. 119.
Hydrodesulfurization
Hydrodesulfurization
Desulfurization of fuels is commonly achieved by catalytic hydrodesulfurization (HDS), in which the organic sulfur species are converted to H2S and the corresponding hydrocarbon, as in the following reaction: R-SH + H2 → R-H + H2S. Here R represents an alkyl group, such as methyl (CH3–), or ethyl (C2H5–). Figure 9.2 shows the type and relative reactivity of different sulfur species in HDS reactions. The reactivity of R-SH (mercaptan, or thiol) compounds is higher than that of disulfides (R-S-S-R). The H2S is easily removed from the desulfurized oil by absorption in a gas treatment unit and subsequently converted to elemental sulfur by the Claus process, as will be discussed in Lesson 10.
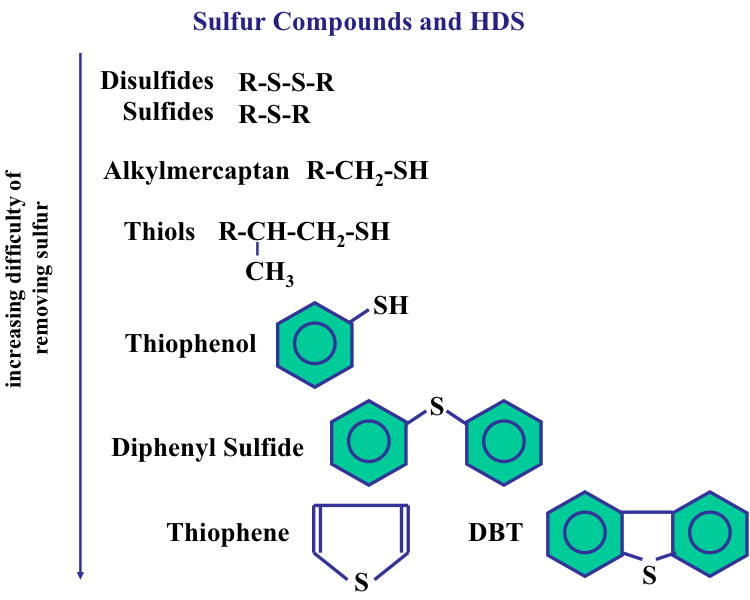
Some HDS reactions are shown in Figure 9.3. Note that the objective of hydrotreatment reactions is to take the heteroatom out with minimum hydrogen consumption. The ideal scenario is to get the hydrogen atoms to break the carbon-sulfur bonds and to remove sulfur as H2S. This may not always be possible because of problems with the accessibility of sulfur atoms to hydrogen atoms. Sulfur ring compounds such as methylated dibenzothiophenes have the lowest reactivity in HDS reactions because they are planar compounds, and in some methylated DBTs the S atom is shielded by the methyl groups (See Figure 9.4). Removing sulfur from these compounds requires more hydrogen consumption in order to saturate the aromatic rings in dibenzothiophene (DBT) to form non-planar compounds. Remember that, as opposed to aromatic compounds, cycloalkanes are not planar compounds. Therefore, saturation of the aromatic rings in methylated DBTs eliminates the steric hindrance (shielding) of methyl groups to make the S atom accessible to active sites on the catalyst surface for removal as H2S. The geometry of this proposition is better understood when one looks at the configuration of active sites on the HDS catalysts shown in Figure 9.5.
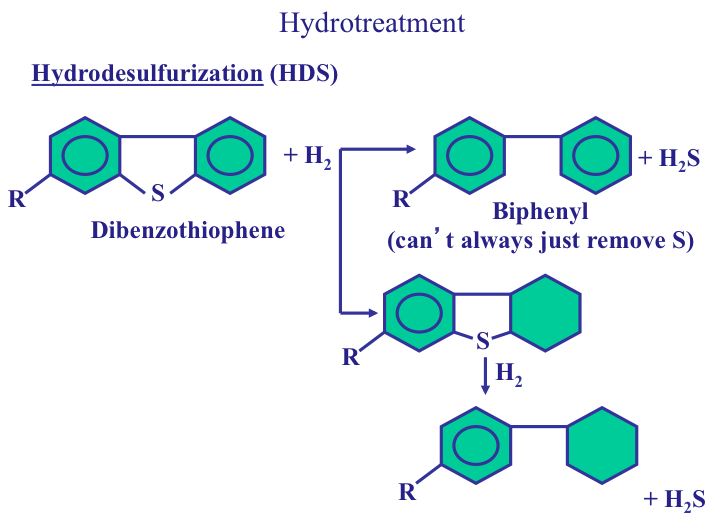
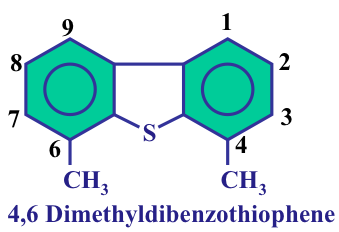
HDS catalysts
HDS catalysts
The HDS catalysts consist of sulfided molybdenum supported on Al2O3. Sulfided molybdenum surfaces have vacancies (with missing S atom in the sequence) that act as active sites on the catalyst surface (Figure 9.5). In addition to Mo, HDS catalysts also contain other metals, such as cobalt (Co) as promoters, the main function of which is believed to dissociate H2 to atomic species that readily react with S. The HDS mechanism involves inviting the sulfur atom at the HDS target to sit in the vacancy and once the S is in the vacancy, dispatching H atoms to clip C-S atoms to make H2S that will leave the vacancy and make it available for the next action. You can see that this scenario would get into trouble if S cannot sit in the vacancy, as would happen with the compound 4,6 dimethyldibenzothiophene (Figure 9.4 on the previous page and Figure 9.5 below). This calls for saturating the aromatic rings to twist the methyl groups aside to make the S atom fit in the vacancy to be taken away as H2S. The list below lists the relative HDS reactivities of methylated DBT compounds relative to HDS of unsubstituted DBT.
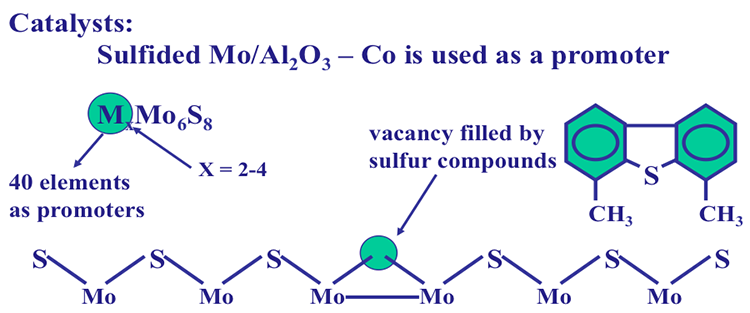
Reactivity in HDS (k methylated DBT/k DBT)
- 4, 6 dimethylIDBT → 0.1
- 3,7 dimethylIDBT → 1.5
- 2,8 dimethylIDBT → 2.6
- 4-methyl-DBT → 0.2
One can see above that the HDS reactivity of 4,6 dimethyldibenzothiophene (4,6 dimethylDBT) is one-tenth of unsubstituted dibenzothiophene (DBT), because of the shielding of the S atom by methyl groups as discussed above. Moving the methyl groups away from the sulfur atom to 3,7 positions (See Figure 9.4) increases the HDS reactivity 15- fold to 1.5 times of DBT. Interestingly, having methyl groups away from the S atom (as in 3,7 and 2,8 positions) increases the HDS reactivity relative to that of DBT. Methyl substitution on DBT away from the S atom increases the HDS reactivity by promoting adsorption of the compounds on the catalyst surface and may weaken the C-S bonds on DMDBTs. In contrast, even one methyl group shielding the S atom (4-methyldibenzothiphene in list above) reduces the reactivity of the methylatedDBT to one-fifth of the reactivity of DBT.
Hydrodenitrogenation
Hydrodenitrogenation
Hydrodenitrogenation (HDN) is a similar process to HDS in which hydrogen is used to remove nitrogen, and for this reason during HDS the nitrogen content of fuels is also reduced. Figure 9.6 shows different types of nitrogen-containing compounds in crude oil and refinery unit products. In addition to reducing the N content in fuels as a finishing process, basic nitrogen compounds such as pyridine and quinoline shown in Figure 9.6 should also be removed as a pretreatment step to protect the acidic catalysts used in processes such as FCC. This is similar to HDS being an important pretreatment process for feedstocks that would be exposed to noble metal catalysts (such as Pt in a catalytic reforming process) that are poisoned by sulfur compounds. Figure 9.7 shows examples of HDN reactions and catalysts used for HDN. Similar to HDN reactions for quinoline, shown in Figure 9.7, pyridine (C5H5N) can be reduced to pentane (C5H12) and ammonia (NH3) by adding 5 molesH2 in three steps. The overall HDN reaction for pyridine is C5H5N + 5H2 → C5H12 + NH3.
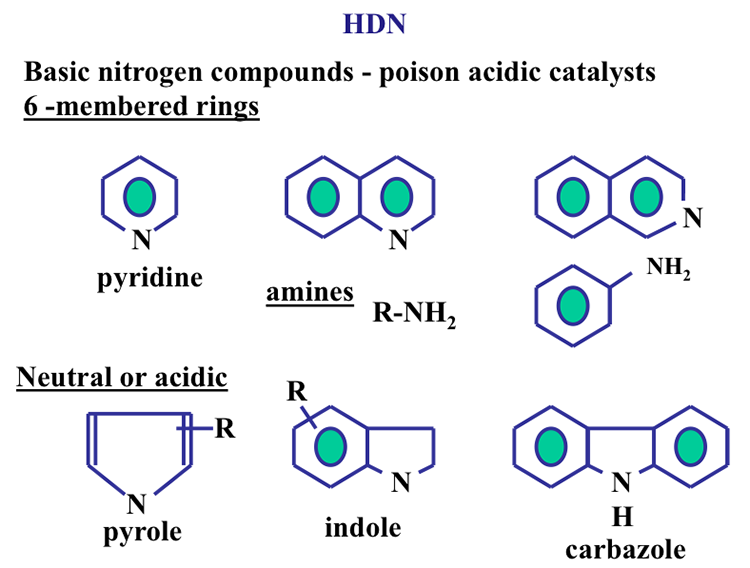
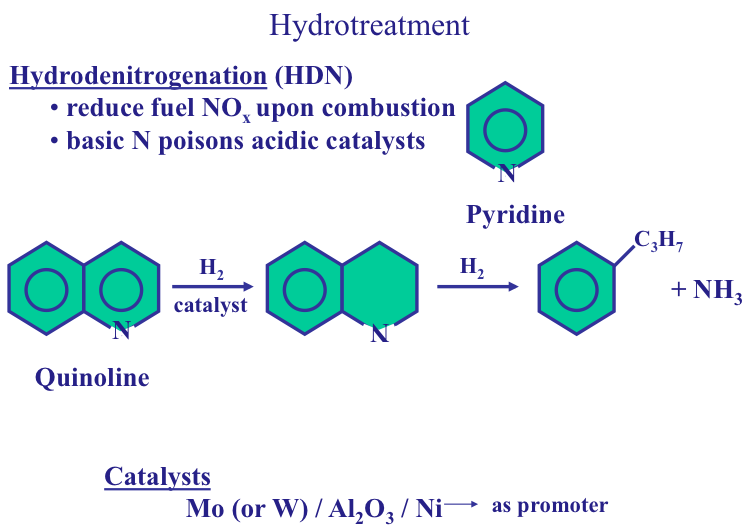
Hydrodemetallation
Hydrodemetallation
Similar to HDS and HDN, hydrodemetallation (HDM) is carried out: 1) as a pretreatment operation to remove metals (mostly nickel and vanadium) to protect the catalysts in subsequent conversion reactions, and 2) for removing metals in petroleum fuels to prevent corrosion in furnaces and toxic emissions from combustion engines. As mentioned in Lesson 1, metals (Ni, V) are mostly incorporated in the cage-like structures of highly stable organometallic compounds called porphyrins. As seen in Figure 9.8, to remove the metals, the cage structure of porphryins needs to be broken up. Similar to HDS and HDN, hydrotreatment on a Mo/Al2O3 catalyst first breaks up the chemical bonds in porphyrins to free the metals. The metals are then reacted with H2S and precipitated as metal sulfides, e.g., NixSy, on catalyst surfaces. Note that this is different from HDS and HDN where the heteroatoms are removed as gas (H2S and NH3, respectively). [Think: What would be the significance of removing metals as metal sulfides as far as the morphology of the HDM catalysts is concerned? Save your answer for the Self-Check question later in this lesson. ] Metals Ni and V deposited on the catalysts can be recovered by post treatment of the used catalysts.
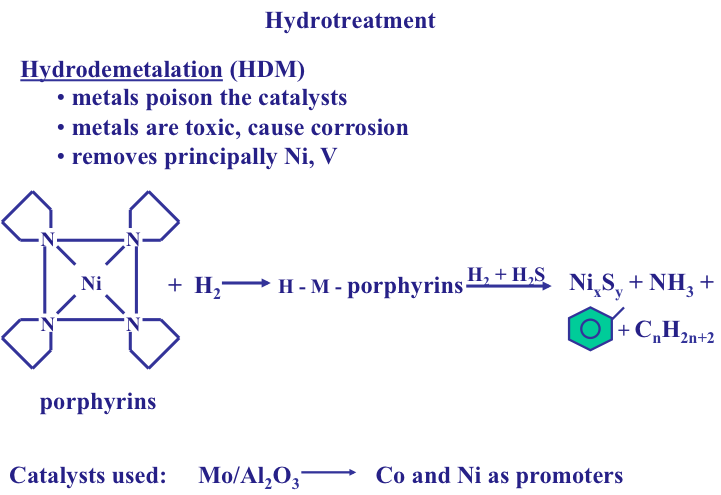
In addition to HDS, HDM, and HDN, there may be a need for hydrodeoxygenation and hydrodehalogenation processes to remove O, or Cl in petroleum products [1].
[1] Petroleum Refining, by J. H. Gary, G. E. Handwerk, M. J. Kaiser, 5th Edition, CRC Press NY, 2007, Chapter 9, Hydrotreatment, pp. 195-203.
Hydrotreatment Processes
Hydrotreatment Processes
Process objectives, conditions, and configurations are similar for all hydrotreatment processes [1]. As an example, HDS list, below, lists the project objectives and selected conditions for HDS processes. Minimization of cracking (or any other chemical change that is not needed for removing heteroatoms) and minimization of hydrogen consumption are the two principal objectives of hydrotreatment processes for reducing the heteroatom concentrations to the desired levels in the reaction products. These objectives are achieved by careful selection of process conditions that need to be adjusted based on the chemical composition of the feedstock. You can see in HDS list, that more severe reaction conditions (e.g., higher reaction temperatures, higher hydrogen/feed ratios, and lower space velocities) are necessary for treating heavy residue compared to treating light distillates. Catalysts have shorter lives in residue treatment processes, as well, because of harsh reaction conditions and more excessive deposition on catalysts during the treatment of heavy residue.
HDS (Hydrodesulfurization)
Objectives
- minimizing cracking
- minimizing hydrogen consumption
| Process Conditions |
Light Distillate |
Heavy Residue |
|
Temperature,&;ºC |
300-400 |
340-425 |
| LHSV, h-1 | 2-10 | 0.2-1 |
| H2/Oil, scf/bbl | 300-2000 | 2000-10000 |
| Catalyst life, years | 10 | ~1 |
Note: LHSV (Liquid Hourly Space Velocity) – the volumetric flow rate of liquid reactant passing through a reactor divided by the volume of the catalyst in the reactor, measured in units of h-1. Lower LHSV (i.e., longer exposure to catalyst in the reactor) is needed for more challenging hydrotreatment tasks.
Figure 9.9 shows a process flow diagram for HDS. The feed is introduced into a fixed-bed catalytic reactor along with hydrogen, and the products are sent to a high-pressure separator to separate H2 and H2S gases from the hydrocarbons. The gases are sent to a scrubber with a basic solution (containing ethanol amine or diethanol amine) to remove H2S that is sent to the sulfur recovery unit and H2 is recycled to the treatment reactor. Desulfurized products are sent to a fractionator to separate C3 and C4 alkanes (LPG) and the liquid products.
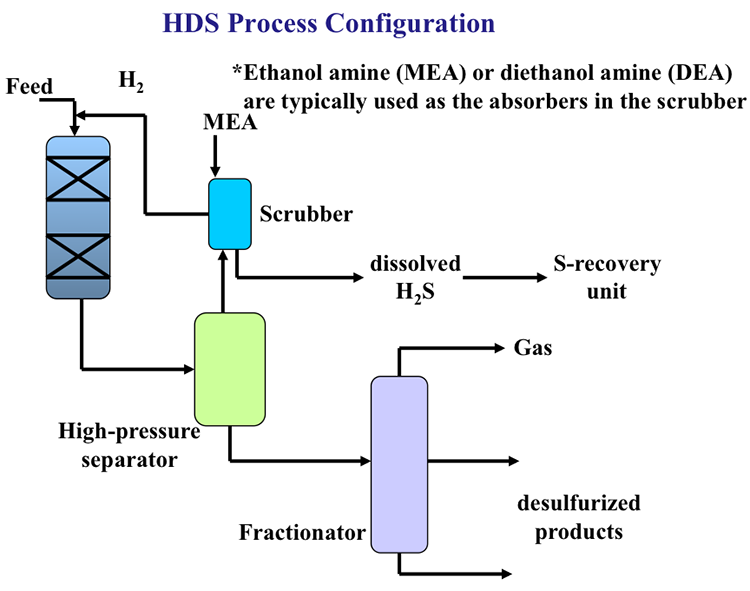
For HDS, HDN and HDM sequential reactors can be configured with different catalysts optimized for the targeted heteroatom removal. Figure 9.10 shows staging of the HDM and HDS operations. The first step in a series of reactors is always HDM because of the unique removal mechanism of the metals (Ni and V), as solid materials on catalyst surfaces, catalysts with large pores in the support materials are needed so that the problems with reactor plugging can be avoided. Following the removal of metals, HDS and HDN can be conducted on medium-pore and small-pore catalysts, in some cases simultaneously in the same reactor or the same catalyst bed.
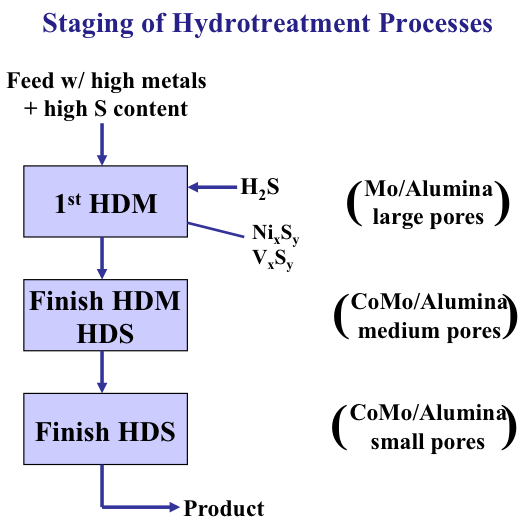
Staging of Hydrotreatment Processes
-Feed w/high metals + high S content
-First HDM
-H2S, NixSy, VxSy
-Mo/Alumina, large pores
-Finish HDM then HDS
-CoMo/Alumina, medium pores
-Finish HDS
-CoMo/Alumina, small pores
-Product
Increasing sulfur contents of the crude oils available for the U.S. refineries on one hand, and decreasing sulfur contents of regulated fuels on the other, have increased the sulfur production in the U.S. refineries as a by-product to 40,000 tons/day [4]. This is sufficient capacity to meet all sulfur demand for the chemical industry, particularly for H2SO4 production used in many chemical industries. One should note that this quantity of sulfur comes only from desulfurization of the fuels that are subject to sulfur regulation. A significant fraction of sulfur in crude oil (>60%) is concentrated in the heavy ends (e.g., residual fuel oil, asphalt) that are not regulated for sulfur content.
[1] Petroleum Refining, by J. H. Gary, G. E. Handwerk, M. J. Kaiser, 5th Edition, CRC Press NY, 2007, Chapter 9, Hydrotreatment, pp. 195-203.
[4] Petroleum Refining, by J. H. Gary, G. E. Handwerk, M. J. Kaiser, 5th Edition, CRC Press NY, 2007, Chapter 12, Product Blending, pp.257-270.
Product Blending
Product Blending
Product blending plays a key role in preparing the refinery products for the market to satisfy the product specifications and environmental regulations. The objective of product blending is to assign all available blend components to satisfy the product demand and specifications to minimize cost and maximize overall profit [5]. Almost all refinery products are blended for the optimal use of all of the intermediate product streams for the most efficient and profitable conversion of petroleum to marketable products. For example, typical motor gasolines may consist of straight-run naphtha from distillation, crackate (from FCC), reformate, alkylate, isomerate, and polymerate, in proportions to make the desired grades of gasoline and the specifications.
Basic intermediate streams can be blended into different finished products. For example, naphthas can be blended into gasoline, or jet fuel streams, depending on the demand. Until the 1960s, the blending was performed in batch operations. With computerization and the availability of the required equipment, online blending operations have replaced blending in batch processes. Keeping inventories of the blending stocks along with cost and physical data has increased the flexibility of and profits from online blending through optimization programs. In most cases, the components blend nonlinearly for a given property (e.g., vapor pressure, octane number, cetane number, viscosity, pour point), and correlations and programming are required for reliable predictions of the specified properties in the blends [3].
[3] U.S. Refinery Sulfur Production Capacity [14]
[5] Petroleum Refining, by J. H. Gary, G. E. Handwerk, M. J. Kaiser, 5th Edition, CRC Press NY, 2007, Chapter 12, Product Blending, p.267.
Octane Number Blending
Octane Number Blending
Octane numbers are blended on a volumetric basis using the blending octane numbers of the components. True octane numbers do not blend linearly, thus it is necessary to use blending octane numbers in calculating the octane number of the blend. Blending octane numbers can be estimated from empirical correlations that have been developed over the years. Blending octane numbers, when added on a volumetric average basis, will give the true octane of the blend, as can be obtained from standard test using CFR test engines.
(True Octane Number of a blend) ON = Σ xi∗ ONi
Where xi is the volume fraction of component i in the blend, and ONi is the blending octane number of component i.
For example, if you have
- a light naptha stream with a blending octane number = 75
- a reformate with a blending octane number = 86
and would like to get a gasoline of ON = 83, what would be the volume fraction of reformate (x) in the blend?
- ON = x(86) + (1-x)(75) = 83
- x = 0.73
So, you need 73% by volume of reformate in your blend. Additive concentration may be calculated the same way, and ON for multicomponent blends can be calculated the same way for research or motor octane numbers.
Pour Point Blending
Pour Point Blending
Pour point is an important property for diesel and fuel oil blends. Pour point blending is also non-linear, and pour point blending indices were developed to enable reliable calculation of the pour points of the blends. Pour point blending indices for some distillate fuels are given in Table 12.7 of the textbook, and copied in Figure 9.11, where the blending indices are tabulated as a function of ASTM 50% temperature, °F (first horizontal listing) and Pour Point, °F (first vertical listing). For example, pour point blending index for a distillate that has an ASTM 50% temperature of 500°F and a pour point of 40°F would be 36. This index can be used in calculating the pour point of blends using this distillate as a component.
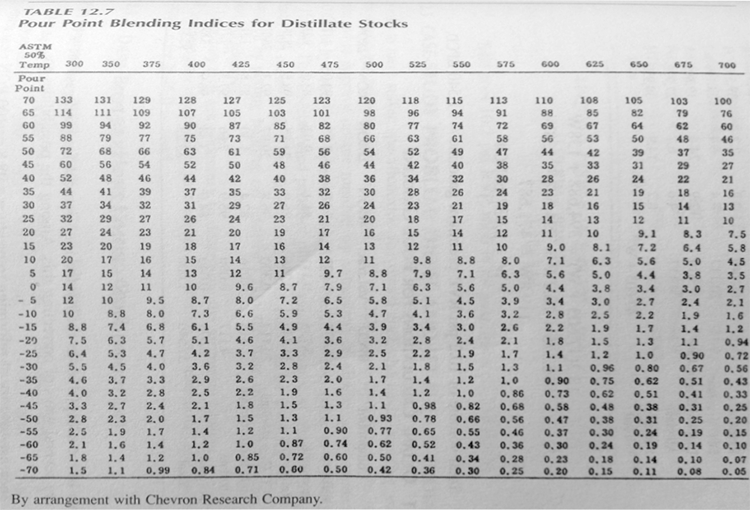
As an example of using blending indices to calculate the pour point of a blend, consider blending a straight-run gas oil (50% ASTM T = 470°F and pour point = -6°F) and a hydrotreated heavy gas oil (50% ASTM T = 620°F and pour point = 40°F). What would be the pour point of a binary blend that consists of 68.7 % vol of straight-run gas oil and 31.3% vol of hydrotreated heavy gas oil?
The procedure used to calculate the pour point of the blend (shown Figure 9.12) can be summarized as follows:
- Read pour point blending indices for the two distillates in the table (PPI column) shown in Figure 9.11, and list it in the table (Figure 9.12). Straight- run gas oil PPBI =6.3 (using double interpolation), and Hydrotreated heavy gas oil PPBI = 26.
- Multiply PPBI for individual distillates with their respective volume fraction to calculate the Pour Factor. For example, the Pour Factor for straight-run gas oil = 0.687 x 6.3 = 4.33. Add the pour factors for each component, to calculate the blending index for the blend = 12.47.
- Calculate blend 50% ASTM temperature (linearly additive) of the blend by multiplying the volume fraction with ASTM 50% T of each component and adding them together (0.687x470 +0.313x620 = 517).
- Using the blend ASTM 50% just calculated (517) and the blending index for the blend from the pour factors (12.47), interpolate/read the pour point of the blend from the table in Figure 9.11, as 15°F.
Note that if you would assume linear addition of the pour points, you would calculate a blend pour point as = 0.687x(-6) +0.313x40 = 8.4°F. A serious underestimation of the pour point! Thinking that your diesel fuel has a pour point 8.4 °F, you may try to start your diesel truck on a 12°F day, to no avail, not knowing that your fuel tank has a gel, and not a liquid that can be easily pumped to the combustion cylinder.
Similar to pour point, the viscosity of blends can also be calculates using blending index numbers, or plots developed for this purpose. For the same blend, we can use the Viscosity Blending Index Numbers in Table 12. 3. of your textbook [6], and the procedure shown in Figure 9.13 to calculate the viscosity of the blend. Try to verify the numbers given in Figure 9.13, and calculate a viscosity of the blend if viscosities were linearly additive to compare with the value calculated in Figure 9.13. Post your questions, if any, and comments in the Help Discussion Forum.
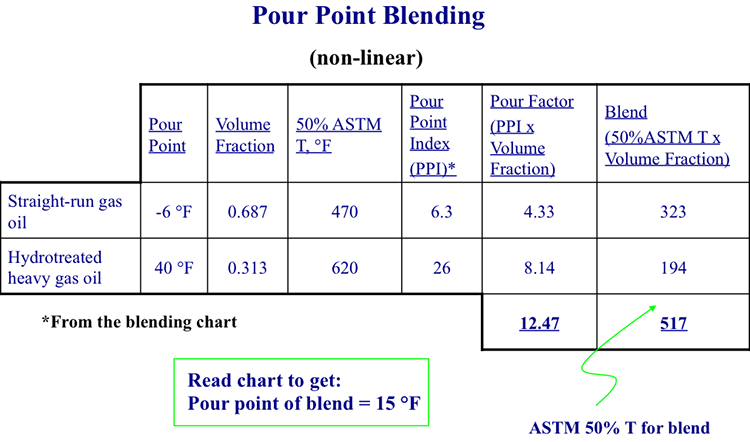
| Pour Point | Volume Fraction |
50% ASTM T, ºF |
Pour Point Index (PPI) |
Pour Factor (PPI x Volume Fraction) |
Blend (50% ASTM T x Volume Fraction |
|
| Straight-run gas oil | -6ºF | 0.687 | 470 | 6.3 | 4.33 | 323 |
| Hydrotreated heavy gas oil | 40ºF | 0.313 | 620 | 26 | 8.14 | 194 |
| Total | - | - | - | - | 12.47 | 517 |
Read chart using this information to get a pour point of 15ºF
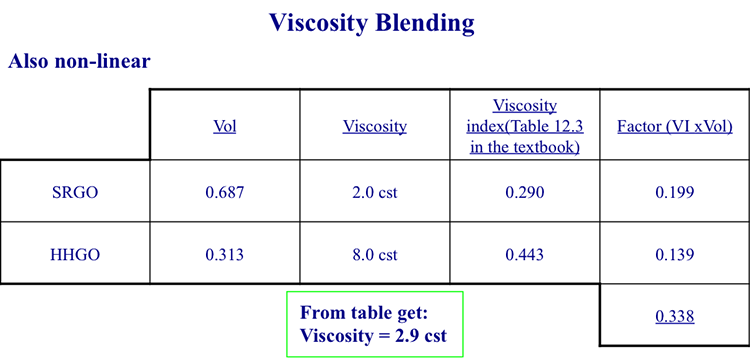
| Volume | Viscosity | Viscosity Index (Table 12.3 in the textbook) | Factor (VI x Vol) | |
| SRGO | 0.687 | 2.0 cst | 0.290 | 0.199 |
| HHGO | 0.313 | 8.0 cst | 0.443 | 0.139 |
| Total | - | - | - | 0.338 |
From the table, you get: Viscosity = 2.9 cst
[6] Petroleum Refining, by J. H. Gary, G. E. Handwerk, M. J. Kaiser, 5th Edition, CRC Press NY, 2007, Chapter 12, Product Blending, p.263.
Self-Check Questions
Self-Check Questions
Please take a few minutes to answer the questions below. When you are happy with your answers, click Check.
Assignments
Assignment Reminder
The assignments for this week are listed below. Please be aware that you have an exam next week!
Exam 2
Exam 2 (eTest). Will cover material in Lessons 6-9. Check the Syllabus, or Course Calendar for Exam 2 schedule and venue.
Exercise 8
Exercise 8 Instructions
Please follow the instructions below.
- Find the Exercise 8 assignment (downloadable Word Doc) in the Lesson 9 Module
- Make sure that your name is in the document title before uploading it to the correct assignment (i.e. Lesson9_Exercise8_Tom Smith).
Summary and Final Tasks
Summary
Finishing processes make sure that the refinery products fully comply with the commercial specifications and environmental regulations. Hydrotreatment removes heteroatoms from intermediate refinery products to protect the catalysts in the subsequent processes, or from final products to be sent out to the market. A particular challenge for hydrotreatment is that while the crude oil slate is getting more contaminated, the demand for cleaner fuels is mandated by the increasingly stringent environmental regulations. Major hydrotreatment processes include hydrodesulfurization, hydrodenitrogenation, and hydrodemetallation, all using hydrogen and specially designed catalysts to remove heteroatoms with minimal change to the hydrocarbon constitution of petroleum products. Product blending as a major finishing process takes up the challenge of the optimum allocation of many intermediate streams in the refinery to make up the refinery products to satisfy all performance parameters and environmental mandates. Product blending is carried out using linear and non-linear programming techniques for online blending.
Learning Outcomes
You should now be able to:
- compare hydrogenation and hydrotreatment with respect to process goals, catalysis, and chemistry;
- categorize and evaluate HDS, HDN, and HDM processes;
- assess hydrotreatment catalysts, kinetics, and process configurations;
- demonstarate procedures to calculate critical properties of blended products, e.g., octane number, pour point, and viscosity.
Reminder - Complete all of the Lesson 9 tasks
You have reached the end of Lesson 9! Double-check the to-do list below to make sure you have completed all of the activities listed there before you begin Lesson 10.
| Readings: | Petroleum Refining, by J. H. Gary and G. E. Handwerk, Chapter 9 (Hydrotreating) and Chapter 12 (Product Blending) |
|---|---|
| Assignments: | Exercise 8 Exam 2. Will cover material in Lessons 6-9. Exam 2 is found in the Exam 2 Module. |
Questions?
If you have any questions, please post them to our Help Discussion Forum (not email), located in Canvas. I will check that discussion forum daily to respond. While you are there, feel free to post your own responses if you, too, are able to help out a classmate.
Lesson 10: Supporting Processes
Lesson 10 Overview
Overview
Video: FSC 432 Lesson 10 (6:33)
PRESENTER: Now, this is the last kind or the fourth kind of processes found in a petroleum refinery, the supporting process. Interestingly enough, you will see that we also make a product here, another product that the refinery could sell, a byproduct, if you will, to make revenue for the refinery. So supporting processes make sure that the refinery could actually run.
It's not a huge chemical conversion process, if you will, that have to do with making the desirable hydrocarbons. But the principal supporting process is acid gas recovery and sulfur recovery or acid gas removal and sulfur recovery. What is acid gas? Well, H2S is the principal acid gas that is produced in a refinery from the hydro treatment processes.
Remember, we remove sulfur from the fuels, from the fractions of crude oil as hydrogen sulfide. Hydrogen sulfide is an acidic gas. So it needs to be removed from the rest of the gases, typically, methane, ethane, that come with hydrogen sulfide to the recovery or the removal acid gas removal process.
And we use a basic solvent to capture the acid gas, particularly hydrogen sulfide. So it's essentially an acid based interaction. We can use ethanolamine as a base in a solvent extraction process and in a liquid extraction process to remove high H2S, hydrogen sulfide, from methane, ethane, other hydrocarbons that are not acidic. You will see that we also have some carbon dioxide that is found along with H2S. That's also an acidic gas that tends to be separated with hydrogen sulfide party by solvent extraction and this basic solvent.
So once H2S is captured or removed using the solvent extraction process, now we need to convert that into a sellable product. I know people always think that here is a point we could recover hydrogen for reuse. Hydrogen, being such a valuable material. But unfortunately, that is not possible.
We need to burn hydrogen into water waste pretty much, hydrogen, so that we can recover sulfur as an elemental sulfur, in a solid or liquid form, that is sold to a chemical industry, chemical manufacturing industry. You know that the basic material, the primary chemical that is made from sulfur for the chemical industry is sulfuric acid manufacturing. So you use sulfur, elemental sulfur, produced in refineries in large quantities to make sulfuric acid, which is a very important raw material, a reactant in many chemical processes.
So instead of mining for sulfur, as was done in the early days, now sulfur, a large fraction of sulfur, almost 2/3 of sulfur used in sulfuric acid manufacturing, comes from petroleum refineries as a byproduct. Why is that? Because the crude oil that is refined in then these refineries becoming more sour or higher sulfur content, that should be removed because we would like cleaner fuels by environmental regulations.
So dirtier crude oil means higher sulfur crude oil coming in. And we need cleaner fuels because increasingly strict environmental regulations on the sulfur content, particularly on diesel fuel. And that gives us large quantities of sulfur recovered in the supporting processes. There are two back to back processes, as you will see, Claus and SCOT, to remove elemental sulfur and sell it as a byproduct from the refinery.
The last process we will talk about, and as a supporting process, is of course wastewater treatment. Water and steam are used in huge quantities. There is no process in petroleum refining that steam or water is not used. And of course, a refinery generates a lot of wastewater.
There are different extents of contamination. There is actually steam or water that comes into direct contact with the hydrocarbons or crude oil. Those are the most heavily polluted water. They should be treated separately.
One very important point to make, in order to have the best water treatment process, the key is segregation of the waste streams. You don't want to mix the waste water coming from, say, distillation with the stormwater. That is also contaminated because it runs through the surfaces of the refinery that may be contaminated with oil or other species. So we need to keep these streams segregated in the wastewater treatment process.
And we should also make some wise decisions about water use. For example, for desalting, you don't really need to use fresh water. You can use wastewater that is contaminated with hydrocarbons, but doesn't contain salt to remove salt from crude oil, the very first process before the distillation.
Overview
The fourth type of refining processes constitutes the supporting processes. Figure 10.1 lists the supporting role of these processes as:
- acid gas removal to separate and concentrate H2S and other acid gases produced in hydrotreatment and conversion operations;
- sulfur recovery from H2S captured in acid gas removal unit;
- hydrogen production for hydrocracking and hydrotreatment processes; and
- wastewater treatment.
Although these processes and units are not involved directly in hydrocarbon fuels production, their roles are essential for the operation of a refinery.
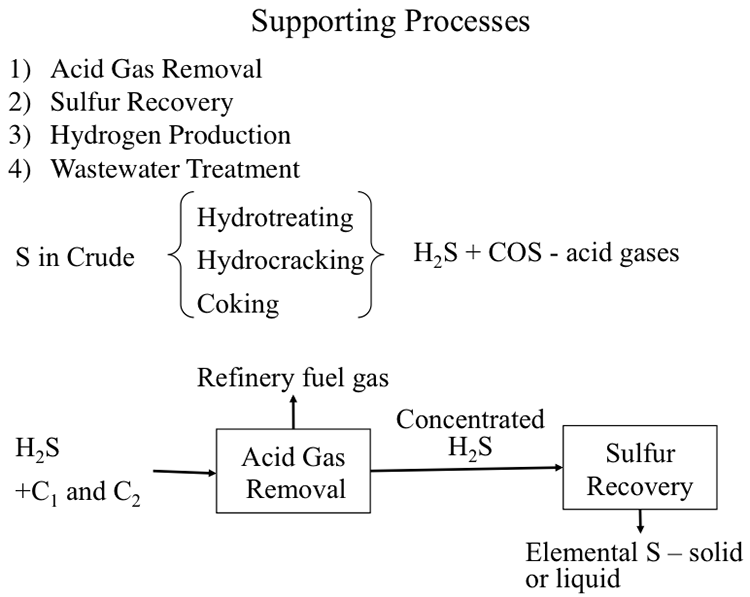
Learning Outcomes
By the end of this lesson, you should be able to:
- outline and assess the processes for acid gas removal and elemental sulfur recovery from H2S;
- discuss and illustrate sources of hydrogen and hydrogen production processes;
- assess primary water toxicants and waste water characterization parameters, and outline waste water treatment processes.
What is due for Lesson 10?
This lesson will take us one week to complete. Please refer to the Course Syllabus for specific time frames and due dates. Specific directions for the assignment below can be found in this lesson.
| Reading: | J. H. Gary and G. E. Handwerk, Chapter 13 (Supporting Processes) |
|---|---|
| Assignments: | Exercise 9 |
Questions?
If you have any questions, please post them to our Help Discussion (not email), located in Canvas. I will check that discussion forum daily to respond. While you are there, feel free to post your own responses if you, too, are able to help out a classmate.
Gas Processing Unit
Gas Processing Unit
The gas streams produced in refinery units such as catalytic crackers, cokers, hydrocrackers, and reformers are sent to the Gas Processing Unit [1] in order to:
- recover C3-C6 hydrocarbons for LPG production (C3 and C4) and feedstocks (C5 and C6) for isomerization (light naphtha) and reformer (heavy naphtha) units;
- separate H2S in a sour gas stream that also contains C1 and C2 gases.
In some refineries, Gas Processing Units also function as Light End Units.
[1] Petroleum Refining, by J. H. Gary, G. E. Handwerk, M. J. Kaiser, 5th Edition, CRC Press NY, 2007, Chapter 13, Supporting Processes, pp. 278-280.
Acid Gas Removal
Acid Gas Removal
Sour gas separated in the Gas Processing unit is sent to the Amine Unit for acid gas removal using chemical solvents such as monoethanolamine (MEA), or diethanolamine (DEA), as shown in Figure 10.2.
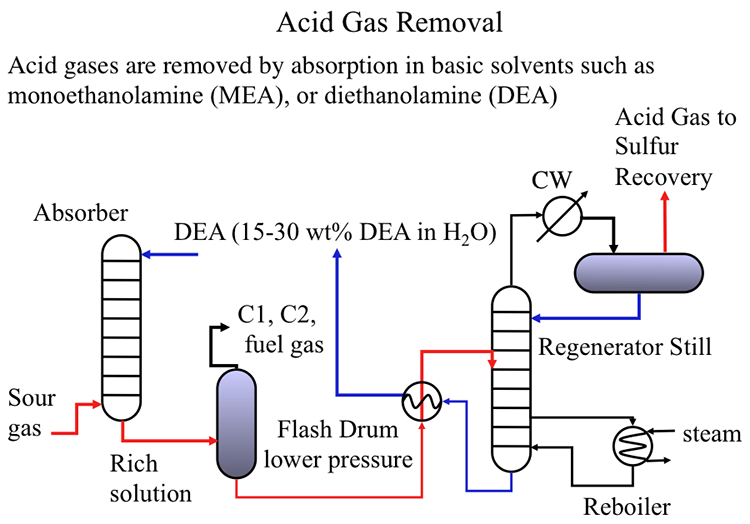
As shown in Figure 10.2, the sour gas is pumped from the bottom of an absorption column to get in contact with the basic solution (typically 15-30wt% diethanolamine) to capture H2S (and other acidic gases such as CO2) in the solution. The rich solution containing the acid gases is sent to a flash drum to recover the C1 and C2 hydrocarbons from the rich solution to be used as fuel gas in the refinery to generate process heat, or steam in fired furnaces. The rich solvent is then sent to a regenerator still to remove the acid gases that are sent to the sulfur recovery unit. The remaining solvent is cooled in a heat exchanger and recycled to the absorption unit to close the loop [2].
[2] Petroleum Refining, by J. H. Gary, G. E. Handwerk, M. J. Kaiser, 5th Edition, CRC Press NY, 2007, Chapter 13, Supporting Processes, pp. 280-283.
Sulfur Recovery
Sulfur Recovery
As indicated in Figure 10.3, the objective of the sulfur recovery process is to convert H2S to elemental sulfur. Sulfur recovery takes place in a series of two steps: Claus Process and SCOT Process [3]. In the Modified Claus Process, partial combustion of H2S takes place to generate SO2 that is reacted with the remaining H2S to recover sulfur as elemental sulfur. The Modified Claus Process, once-through burner operation, works only with acid gases that contain more than 50% H2S by volume. In the process, hydrogen in H2S is converted to H2O. The second stage, the SCOT Process, functions as a tail gas clean-up operation to remove the sulfur compounds produced in the side reactions of the Claus Process, i.e., carbonyl sulfide (COS) and carbon disulfide (CS2).
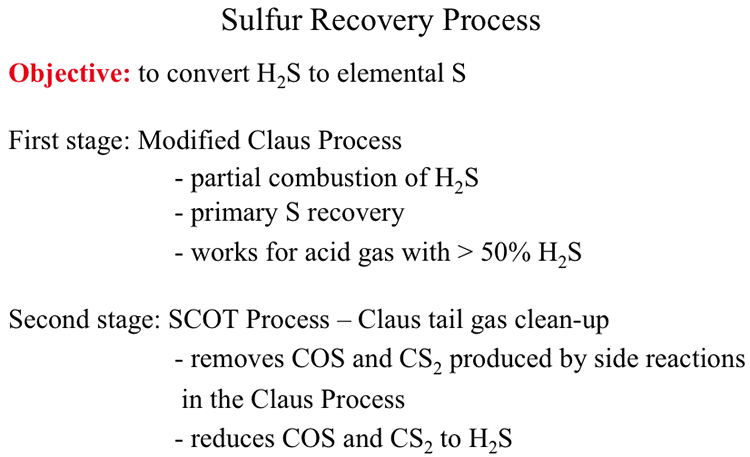
Sulfur Recovery Process
Objective: to convert H2S to elemental S
First stage: Modified Clause Process
-partial combustion of H2S
-primary S recovery
-works for acid gas with >50% H2S
Second Stage: SCOT Process – Claus tail gas clean-up
-removes COS and CS2 produced by side reactions in the Clause Process
-reduces COS and CS2 to H2S
[3] Petroleum Refining, by J. H. Gary, G. E. Handwerk, M. J. Kaiser, 5th Edition, CRC Press NY, 2007, Chapter 13, Supporting Processes, pp. 283-290.
Modified Claus Process
Modified Claus Process
Figure 10.4 shows the configuration of the multi-step Modified Claus Process that includes two kinds of reactors: a burner reactor and a converter reactor. In the burner reactor, H2S is burned with compressed air to SO2 and H2O. Two critically important variables of the burner reactor are the oxygen to H2S ratio and the reactor temperature. The O2/H2S ratio needs to be one-third of the stoichiometric ratio for complete combustion of H2S. The significance of the O2/H2S will be discussed further in the next section. The temperature in the burner reactor must be maintained typically at 1850°F to make sure that any ammonia present in the feed gas is completely destroyed to protect the catalysts in the converter reactor. The effluent gas from the burner reactor is cooled to 450°F (above the dew point of S) in the waste heat boiler as it enters the converter reactor for catalytic conversion of H2S and SO2 to elemental sulfur and water. The converter effluent is introduced into a condenser unit to obtain elemental sulfur as a liquid product. Small quantities of S produced in the burner reactor may also be recovered after the waste heat boiler. Typically, three sets of converter-condenser units in series are needed to achieve 95% recovery of S in the Modified Claus Process.

Figure 10.5 shows the principal reactions in the Modified Claus Process in the burner and converter-reactor sections. In the burner, H2S is partially oxidized to produce H2O and SO2. In the reactor converter, the burner product SO2 reacts with the remaining H2S to produce elemental sulfur (the intended product in the sulfur recovery process) along with the side product water. Ideally, the final products should consist only of elemental sulfur and water with no H2S or SO2 present. The only way to achieve the intended product mix is to control the O2/H2S ratio in the burner. As can be seen, the stoichiometric ratio of O2/H2S for complete conversion of H2S to SO2 is 3/2 which would effectively convert all H2S to SO2. In order to reserve part of the feed H2S to react with the burner product so that no H2S or SO2 remains in the final product from the converter, the O2/H2S ratio should be controlled at 1/3 of the stoichiometric ratio, that is (1/3)(3/2)=1/2. As a self-check exercise, explain with chemical equations why the desired oxygen/hydrogen sulfide ratio in the feed to the Burner in the Claus Process should be 1/3 of the stoichiometric oxygen/hydrogen sulfide ratio (for complete combustion of hydrogen sulfide). The answer to this exercise is given at the end of the lesson.
As seen in Figure 10.5, the side reactions in the burner produce COS and CS2 which cannot be converted in the catalytic reactions that take place in the converter reactor. Therefore, a tail gas clean-up process, or SCOT Process, is needed to reduce the concentration of these side products to less than 20 ppm by volume in the outlet.
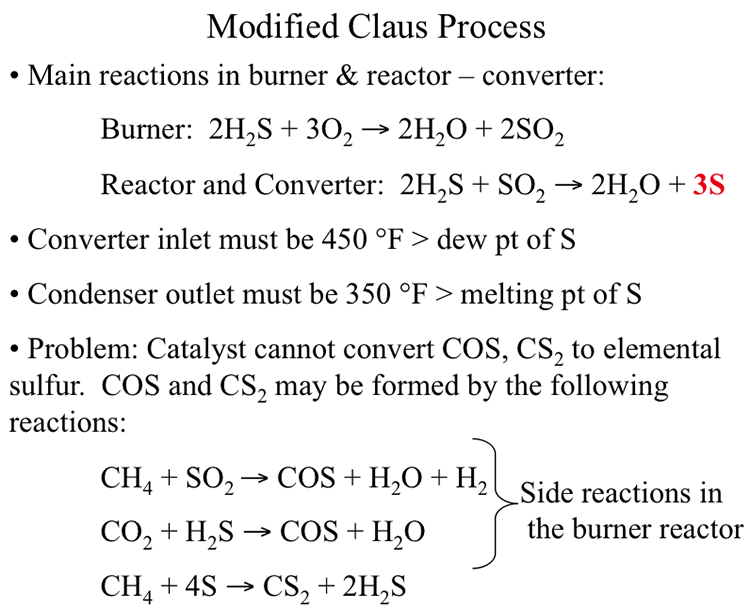
Modified Claus Process
Main reactions in burner & reactor – converter:
Burner: 2H2S + 3O2 → 2H20 + 2SO2
Reactor and Converter 2H2S + SO2 → 2H2O + 3S
Converter inlet must be 450ºF > dew point of S
Condenser outlet must be 350ºF > melting point of S
Problem: Catalyst cannot convert COS, CS2 to elemental sulfur. COS and CS2 may be formed by the following reactions
CH4 + SO2 → COS + H20 + H2 (Side reaction in the burner reactor)
CO2 + H2S → COS + H20 (Side reaction in the burner reactor)
CH4 + 4S → CS2 + 2H2S
SCOT Process
SCOT Process
Figure 10.6 illustrates how the SCOT Process is integrated with the Claus Unit to convert COS, CS2 and any remaining SO2 by reacting with H2 in the catalytic reactor back to H2S to be recycled to the Claus Unit to close the loop. The hydrogenating catalysts used in SCOT contain nickel or tungsten on alumina support, and the reaction takes place at 480-570°. By coupling Claus and SCOT processes, more than 99% of sulfur entering the Claus unit can be recovered as elemental sulfur to be sold as a refinery product.
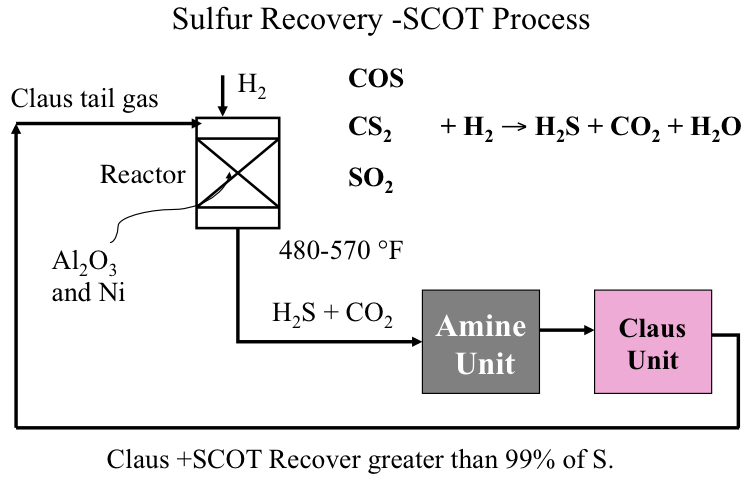
Hydrogen Production
Hydrogen Production
Although refineries produce a significant quantity of hydrogen needed for hydrotreating and hydroconversion processes, in most cases, additional hydrogen is needed particularly for refining the sour crudes. Therefore, a Hydrogen Plant is needed on site to provide the additional hydrogen demand. As seen in Figure 10.7, steam reforming of natural gas is most commonly used in the U.S. to produce hydrogen, whereas partial oxidation of heavy hydrocarbons is preferred in Europe [4].
For the partial oxidation process, a heavy hydrocarbon fraction, typically fuel oil, is reacted at high pressures (1300-1800 psig) with pure oxygen supplied in strictly controlled quantities for partial oxidation of hydrocarbons to carbon monoxide and hydrogen, as shown in Figure 10.7. Carbon monoxide produced in the reaction is converted to hydrogen by catalytic shift reaction with steam. In the purification step, CO2 produced in the shift reaction is removed by absorption in a basic solvent such as potassium carbonate.
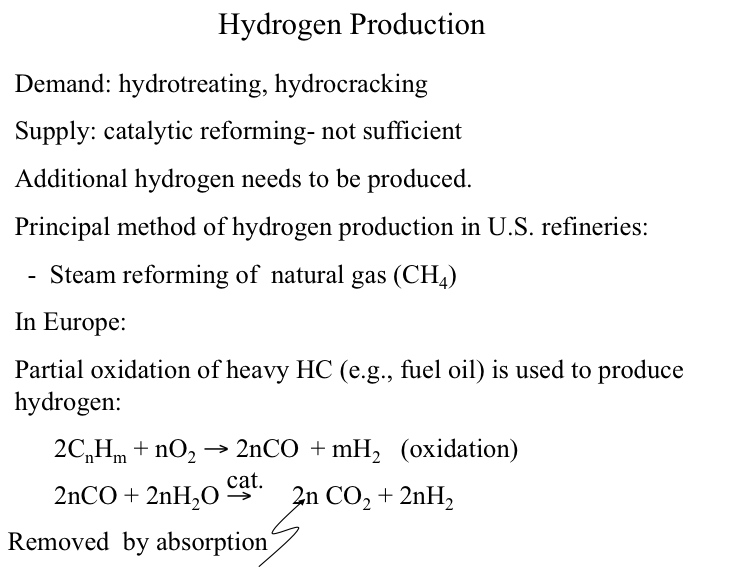
Image reads:
Hydrogen Production
Demand: hydrotreating, hydrocracking
Supply: Catalytic reforming – not sufficient
Additional hydrogen needs to be produced
The principle method of hydrogen production in US refineries:
-Steam reforming of natural gas (CH4)
The principle method of hydrogen production in European refineries:
-Partain oxidation of heavy HC (e.g., fuel oil) is used to produce hydrogen
2CnHm + nO2 → 2nCO + mH2 (oxidation)
2nCO + 2nH2O → 2nCO2 (removed by absorption) + 2nH2
Figure 10.8 illustrates the reactions in steam reforming of natural gas (CH4) to produce hydrogen in the U.S. refineries. In the reforming reaction, CH4 is converted to H2 and CO on a NiO/SiO2-Al2O3 catalyst at temperatures of 760-816°C. Reforming is followed by the water gas shift reaction at 343°C to shift CO to H2 and CO2 on a Cr2O3 and Fe2O3 catalyst in multiple catalyst beds with external cooling to control the temperature to achieve high conversion in the exothermic reaction. The product gas is purified by absorption of CO2 in an Amine Unit. In the final step of methanation, residual CO and CO2 is removed by hydrogenation on a Ni/Al2O3 catalyst at 370-427°C.
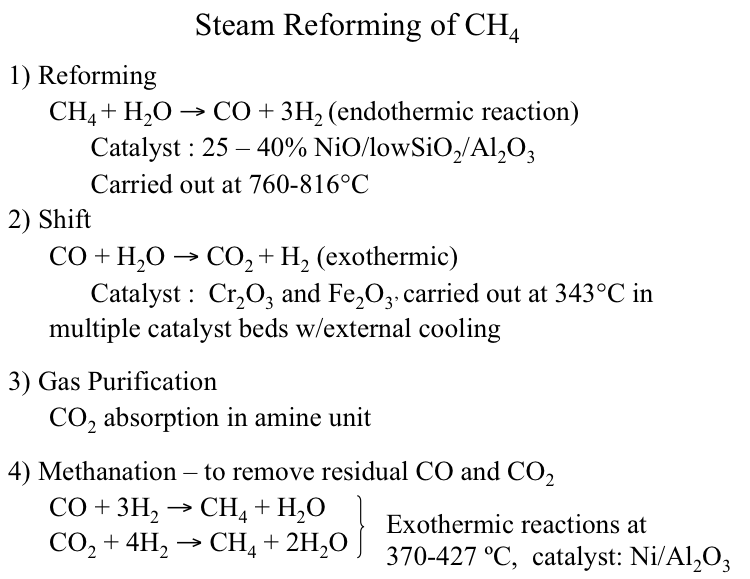
Image reads:
Steam Reforming of CH4
1) Reforming
CH4 + H2O → CO + 3H2 (endothermic)
Catalyst: 25-40% NiO/low SiO2/ Al2O3
Carried out at 760-816ºC
2) Shift
CO + H2O → CO2 + H2 (exothermic)
Catalyst: Cr2O3 and Fe2O3
Carried out at 343ºC in multiple catalyst beds w/ external cooling
3) Gas Purification
CO2 absorption in amine unit
4) Methanation - to remove residual CO and CO2
CO + 3H2 → CH2 + H2O (Exothermic)
CO2 + 4H2 → CH2 + 2H2O (Exothermic)
Carried out at 370-427ºC
Catalyst: Ni/Al2O3
[4] Petroleum Refining, by J. H. Gary, G. E. Handwerk, M. J. Kaiser, 5th Edition, CRC Press NY, 2007, Chapter 13, Supporting Processes, pp. 273-278.
Wastewater Treatment
Wastewater Treatment
Considering the vast amounts of water used in a refinery, wastewater treatment constitutes a very significant supporting process for safe operation. Figure 10.9 lists the different types of wastewater, pollutants involved in wastewater streams, and the major refinery units that generate significant amounts of wastewater. The four types of refinery wastewater include cooling water, process water and steam, storm water, and sanitary sewage water. Among these, the most heavily polluted wastewater stream that requires serious treatment is the process water and steam that come into direct contact with petroleum fractions. Storm water may be contaminated because of incidental exposure to pollutant sources on refinery surfaces and accidental spills. Cooling water and sanitary sewage water may not require much treatment before they are sent to public water treatment facilities. One rule of thumb is to avoid mixing different types of wastewater streams to reduce the load on the treatment units.
Pollutants found in the wastewater streams include hydrocarbons with particular concern for toxic aromatic compounds, such as benzene; heteroatom compounds, such as mercaptans, amines, phenols, and cyanides; dissolved gases such as H2S and NH3, and acids, such as H2SO4 and HF; and suspended and dissolved solids. The refinery units that generate the most significant amount of wastewater are desalting, distillation, thermal and catalytic cracking, coking, as well as heat exchangers and storage tanks [5].
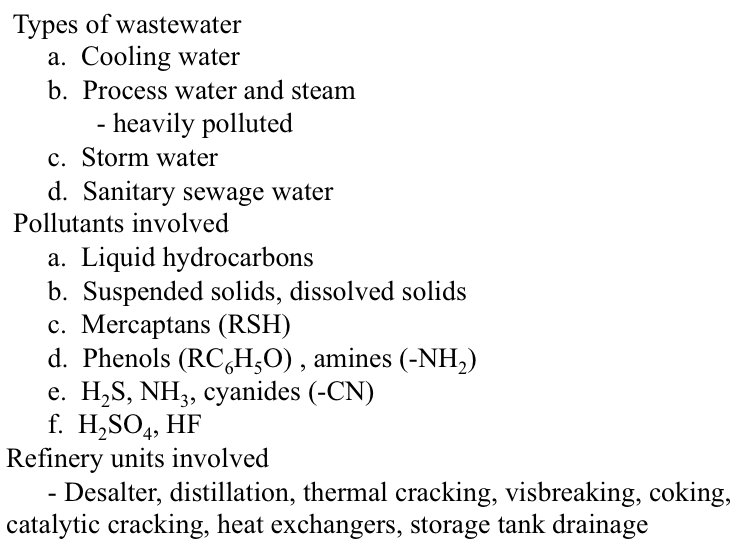
Types of wastewater
a. Cooling water
b. Process water and steam
-heavily polluted
c. Stormwater
d. Sanitary sewage water
Pollutants involved
a. Liquid hydrocarbons
b. Suspended solids, dissolved solids
c. Mercaptans (RSH)
d. Phenols (RC6H5O), amines (-NH2)
e. H2S, NH3, cyanides (-CN)
f. H2SO4, HF
Refinery units involved
Desalter, distillation, thermal cracking, visbreaking, coking, catalytic cracking, heat exchangers, storage tank drainage
[5] Petroleum Refining, by J. H. Gary, G. E. Handwerk, M. J. Kaiser, 5th Edition, CRC Press NY, 2007, Chapter 13, Supporting Processes, pp. 290-293.
Wastewater characterization
Wastewater characterization
Standard measurements used for wastewater characterization are listed in Figure 10.10. Biochemical Oxygen Demand (BOD) measures the amount of oxygen consumed by microorganisms in decomposing organic matter, whereas Chemical Oxygen Demand (COD) measures the total oxygen consumption by organic and inorganic chemicals present in water. Both measurements relate to the level of contamination in wastewater, and they are used to gauge the effectiveness of the wastewater treatment processes. Other water quality parameters include the amount of suspended solids, hydrocarbon content, nitrogen content, phenols content, and acidity.
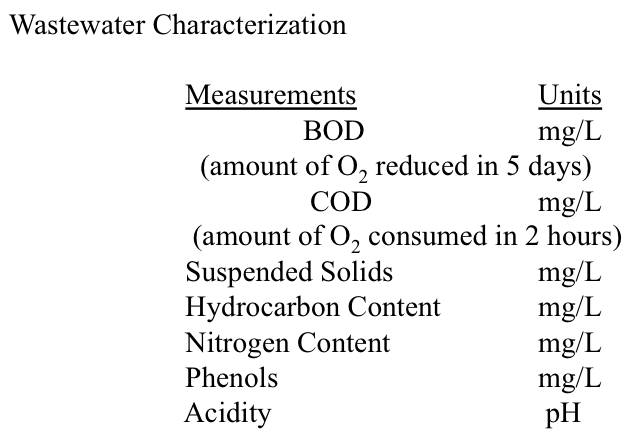
Primary and secondary treatment processes
Primary and secondary treatment processes
Figures 10.11 and 10.12 illustrate the primary (physical) and secondary (biological) treatment processes, respectively. The primary treatment of sour water contaminated with oils and solid particles involve the stripping of dissolved H2S using steam, float/sink density separation for skimming the floating oil, and the settling tanks to separate heavier oil and solids, usually in multiple stages, before the treated water can be directed to public treatment facilities. The secondary treatment uses micro-organisms to further remove organic contaminants.
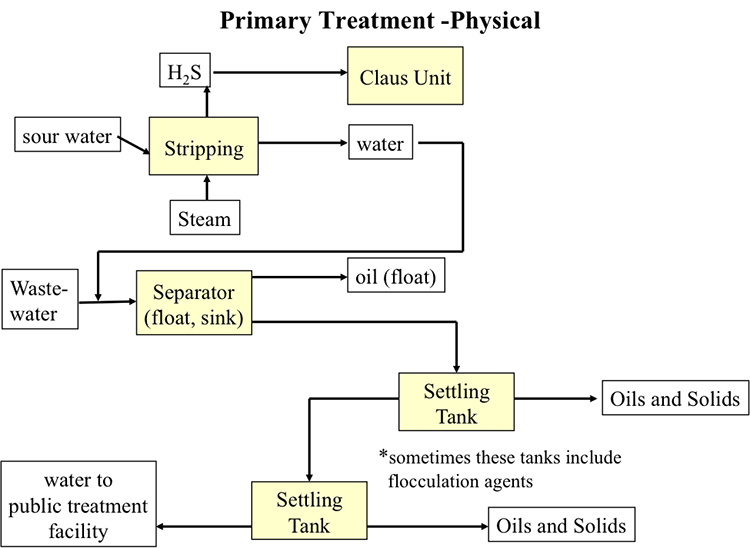
Simplified primary treatment diagram. Sour water and steam undergo stripping. H2S is removed and sent to a Claus Unit. Everything else is sent, with wastewater to the separator (float, sink). Oil floats and is removed, the rest goes to two successive settling tanks (which sometimes include flocculation agents) where oils and solids are removed. Finally, the remaining water is sent to a public treatment facility.
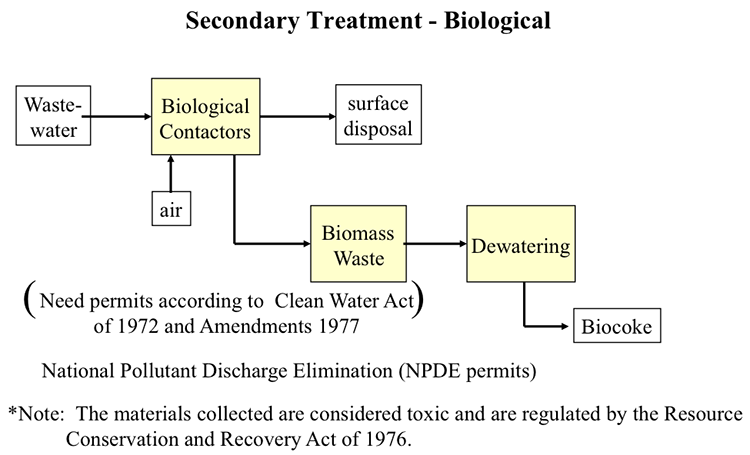
Simplified secondary treatment diagram. National pollutant discharge elimination (NPDS) permits are needed according to the clean water act of 1972 and amendments of 1977. The materials collected are considered toxic and are regulated by the resource conservation and recovery act of 1976.
Wastewater and air enter biological contactors. From there some products go to surface disposal and some of the products go to biomass waste, then dewatering and is finally turned into biocoke.
Environmental Regulation of Refineries
Environmental Regulation of Refineries
Air pollutant emissions from the refinery processes are also controlled. Figure 10.13 lists the major legislations and regulations that affect the environmental impact of refineries in the U.S. [6].
- Clean Water Act (CWA)
- Safe Drinking Water Act
- Clean Air Act of 1963
- Clean Air Act of 1970 (CAA) and regulations
- Clean Air Act Amendments of 1977 and 1990 (CAAA) and regulations thereunder
- Clear Skies Act of 2003
- Resource Conservation and Recovery Act (RCRA)
- Superfund: Comprehensive Environmental Response, Compensation, and Liability Act (CERCLA)
- Emergency Planning and Community Right-to-Know (EPCRA)
- Occupational Safety and Health Act (OSHA)
- Toxic Substances Control Act (TSCA)
- Oil Pollution Act
- Spill Prevention Control and Countermeasure Plans
[6] C. S. Khor and A. Elkamel, “Environmental Issues Related to the Petroleum Refining Industry” In Petroleum Refining and Natural Gas Processing, Editors: M. R. Riazi, S. Eser, J. L. Peña, ASTM International, West Conshohocken, PA, 2013, pp. 701-716.
Self-Check Questions
Self-Check Questions
Please take a few minutes to complete the exercise and then answer the questions below.
Assignments
Assignment Reminder
This week Exercise 9 is due.
Summary and Final Tasks
Summary
Supporting processes are essential to the operation of a refinery. These processes have become more important as the crude oil base has become more sour. The demand for hydrogen has increased to support the required finishing processes for heteroatom removal and recovery of sulfur and metals. Refineries have become major producers of elemental sulfur for the chemical industry.
Learning Outcomes
You should now be able to:
- outline and assess the processes for acid gas removal and elemental sulfur recovery from H2S;
- discuss and illustrate sources of hydrogen and hydrogen production processes;
- assess primary water toxicants and waste water characterization parameters, and outline waste water treatment processes.
Reminder - Complete all of the Lesson 10 tasks.
You have reached the end of Lesson 10! Double-check the to-do list below to make sure you have completed all of the activities listed there before you begin Lesson 11.
What is due for Lesson 10?
Please refer to the Course Syllabus for specific time frames and due dates. Specific directions for the assignments below can be found within this lesson.
| Reading: | J. H. Gary and G. E. Handwerk, Chapter 13 (Supporting Processes) |
|---|---|
| Assignments: | Exercise 9 |
Questions?
If you have any questions, please post them to our Help Discussion Forum (not email), located in Canvas. I will check that discussion forum daily to respond. While you are there, feel free to post your own responses if you, too, are able to help out a classmate.
Lesson 11: Past and Future of Petroleum Refining
Lesson 11 Overview
Overview
Video: FSC 432 Lesson 11 (5:18)
PRESENTER: Now we have talked about on many occasions the evolution of a refinery based on, of course, the demands for the products. All the way from a one pot distillation refinery. Or we can call it a separation refinery. Just to make kerosene for the lamps, for lighting.
Now it's widely considered and claimed that very process saved the whales from extinction. Because instead of now using whale oil in lamps, one could use kerosene without much smoke. And the light to actually let people extend daylight in essence.
Of course, with the electric light, kerosene was not demanded. But as you know, as we've talked about before, the demand for another fuel, or gasoline, was increasing. So from separation, or distillation refinery, we went to the thermal refinery to make more gasoline for the increasing number of automobiles. And, of course, the lubricating oil that is needed in these engines.
So the thermal refinery performed quite well, up until the 2nd World War, to use just heat to make the chemical changes that are needed to change the composition of the crude oil to fit with the product demand in essence. With the 2nd World War raging, with the demand for high performance fuels, the catalytic processes were introduced.
So we are in the catalytic refinery, taking over from the thermal refinery. And the catalytic refinery continued, of course, after the 2nd World War. An interesting historical note.
The oil companies that were competing before the 2nd World War, in the United States, and in Western Europe, got together to develop these catalytic, many of these catalytic processes that are still used today. In an effort, obviously, to develop more powerful fuels for the war effort.
So that is a very interesting era in the history of petroleum refining, where competition turns into collaboration. To make, of course, more powerful fuels for the more powerful war machine. Until the end of the century, obviously, this trend continued.
And the next stage is referred, in some text, as the end of the century refinery. Where the focus now is really on the very heavy end. Because as we are using crude oil in the marketplace, the crude oil available for becoming or for refining becomes heavier.
So when you do the distillation, there's a huge amount of active distillation residue that is separated. So the end of the century refinery focuses on treating these heavy ends, essentially hydro processing. Using different reactor configurations. Using essentially the chemistry, chemical modeling, to determine the reaction chemistry.
Kinetics for more optimum conversion of these very heavy ends. The most challenging parts of the crude oil to be converted into the light distillates.
So on one hand, we have an increasing demand for lighter fuels like gasoline, diesel, jet fuel. And on the other hand, we do have a crude oil base that is getting increasingly heavier, and dirtier. So the end of the century refinery focused on treating and hydro treating these heavy ends to make the lighter and cleaner products.
As we have mentioned at the beginning of this course, there's a new trend. That is the hydro fracking to make, essentially to produce shale gas. But there is a liquid byproduct. And it won't be too long before hydro fracking is used to produce oil also.
So in the 21st century we may see yet another significant change in the refinery scheme to incorporate shale oil that is produced by hydro fracking into the refinery. To be refined into the mix of the fuels and materials that are needed in the marketplace.
Overview
In the roughly 150-year history of petroleum refining, remarkable changes have taken place in refining processes and refinery configurations. These changes were driven by transitions and developments in combustion engines, the wars (World War I and, most notably, World War II), variations in the crude oil slate available for refining, and the environmental regulations. This historical evolution has taken place with the introduction of new processes more or less in the order of the four refinery processes that we have discussed: separation, conversion, finishing, and support. The new petroleum refining processes were developed and incorporated into the refinery to control the yield and properties of the desired fuels and refineries. Through the stages of the refinery evolution, it is interesting to note that the demand for even the same petroleum product has changed not only in the desired composition, as it is linked to properties, but also in its application to a particular commercial sector. In this regard, kerosene provides a good example of this change from being primarily a source of light in lamps (as a replacement for whale oil which allegedly saved the sperm whales from extinction) in the 1850s to becoming an established base fuel for jet aircraft since the end of World War II. Kerosene has also been used as a fuel for domestic heating and cooking in many parts of the world, long after the introduction of electric lamps.
This lesson will provide an overview of the historical evolution of the petroleum refinery and discuss some current developments in crude oil supply and in related energy technologies to catch a glimpse of what the near future could bring to the refinery practice. The overview and discussions will often reflect on specific aspects of different refinery processes that have been introduced in previous lessons.
Learning Outcomes
By the end of this lesson, you should be able to:
- review, illustrate, appraise, and critique discrete stages in the history of petroleum refining;
- evaluate driving forces that could impact the future of petroleum refineries and propose scenarios for responding to the driving forces.
What is due for Lesson 11?
This lesson will take us one week to complete. Please refer to the Course Syllabus for specific time frames and due dates. Specific directions for the assignment below can be found in this lesson.
| Readings: | F. Self, E. Ekholm, and K. Bowers, Refining Overview - Petroleum, Processes and Products, AIChE CD-ROM, 2000. |
|---|---|
| Assignment: |
Exercise 10: Refinery Flow Diagrams Quiz 4. Will cover material in Lessons 10-11. Check the Syllabus or Course Calendar for Quiz 4 schedule. |
Questions?
If you have any questions, please post them to our Help Discussion (not email), located in Canvas. I will check that discussion forum daily to respond. While you are there, feel free to post your own responses if you, too, are able to help out a classmate.
Refinery Evolution
Refinery Evolution
The configuration and complexity of a petroleum refinery has evolved from one-pot batch distillation to produce kerosene as the major product (1850s) to the complex refinery of the day [1] that produces a multitude of fuels and petrochemical feedstocks from a wide range of crude oils, as discussed in Lessons 1 and 2. Different stages of this evolution, in tune with the changing demand for petroleum products as well as the changing crude oil base over time, are presented in the following sections listed below and in your menu.
Batch Fractionation (1855-1880)
Batch Fractionation (1855-1880)
In the first refineries of the United States, Pennsylvania crude was easily distilled to produce kerosene for lamps (which burned cleanly without producing much smoke because of the paraffinic composition of Penn crude) and lubricating oil for steam engines. Lighter fractions obtained from distillation such as naphtha, propane, and butane were largely considered a nuisance and were flared for disposal because of their high vapor pressure and low flash points that would cause difficulties with storage. Figure 11.1 shows a typical batch distillation process in early refineries of the 1850s used primarily to produce kerosene, labeled as “product” from the separator in the diagram. For the distillation process, crude oil feed was filled into a kettle heated by burning gas, or other fuels in a fire box and the residual tar was removed after the distillation was over. The Dephlegmator Tower worked as a distillation column and as the crude boiled in the still, the vapor fraction from the dephlegmator was condensed and sent to the separator [2]. The separated kerosene fraction often went through a second distillation process to control the flash point for the safe use of fuel in lamps and reduce odor. The residue fraction was also distilled using vacuum to produce lubricating oil and grease for the steam engines and wax for making candles.
Charging the kettle with crude oil and emptying the residue left over from distillation took a lot of time and effort, making the batch distillation highly inefficient. In most cases, the recovered overhead fraction was fed back to the same still to drive off more hydrogen sulfide and lighter fractions to control the flammability (flash point) of kerosene. Driving off hydrogen sulfide and other light sulfur species also reduced the odor of kerosene and of the products obtained from burning kerosene in gas lamps. As the demand increased for kerosene, the refiners began to use two stills, one for the first fractionation of a kerosene cut and the second one to redistill the kerosene for purification. Using two stills in series marked the beginning of the continuous stills [2].
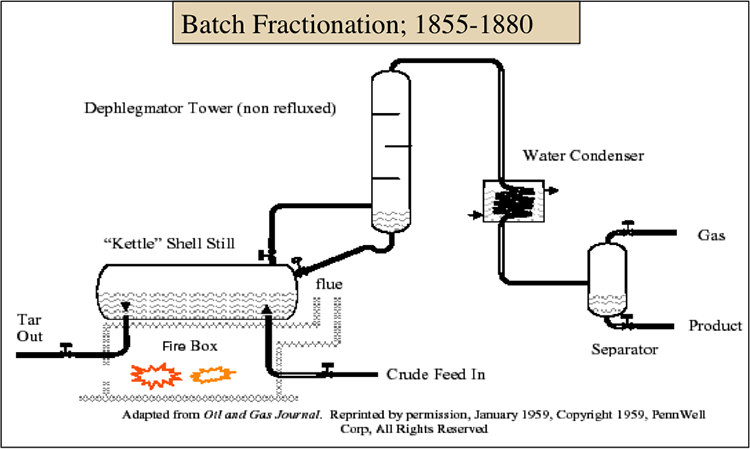
[2.] F. Self, E. Ekholm, and K. Bowers, Refining Overview - Petroleum, Processes and Products, AIChE, 2000, Chapter 4.
Continuous Fractionation (1880-1910)
Continuous Fractionation (1880-1910)
Continuous fraction with multiple stills replaced batch operations in the refineries, enabling increased throughputs and the production of multiple distillate fractions as products from a refinery [2]. As shown in Figure 11.2, a series of stills could operate continuously by taking an overhead fraction from the crude oil in the first still by flashing and moving the remaining liquid to a still drum while continuously introducing more fresh feed to the first still. The second still operates at a higher temperature to produce a higher boiling distillate. The reflux to the column with bubble trays was adjusted from the color of the overhead stream, utilizing a “look box,” shown in the diagram in Figure 11.2, to improve separation.
The demand for kerosene as a source of light declined with the invention of the electric light bulb in 1879. However, the first powered airplane flight in 1903 and mass production of an automobile (Model T) in 1908 ushered in a large demand for gasoline that cannot be met by simple distillation. Thermal cracking provided means to increase gasoline supply. This was the beginning of a new era in petroleum refining, incorporating a conversion process with separation processes.
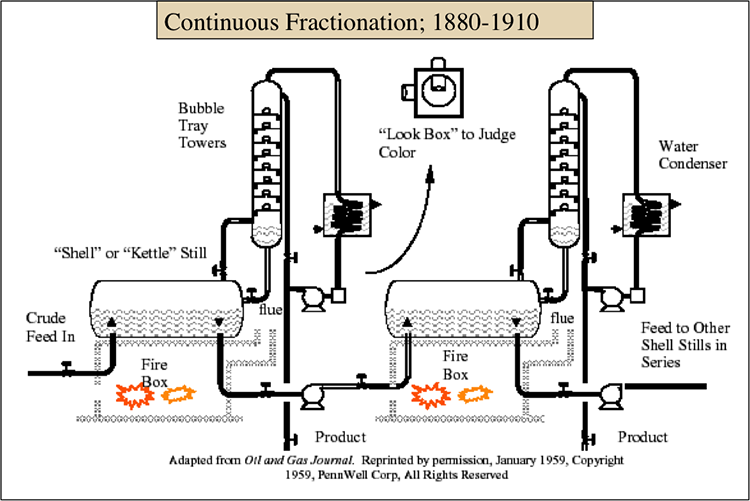
The Thermal Refinery (1910-1940)
The Thermal Refinery (1910-1940)
Incorporating thermal cracking of gas oil into the refinery increased the yield of light and middle distillates, i.e., gasoline, kerosene, and diesel fuel, from crude oil. Although the electric light made the kerosene lamps obsolete, there was still continued demand for kerosene in rural regions because of slow electrification outside the urban areas. The evolution of the refinery in the three decades between 1910 and 1940 was driven largely by the development of thermal cracking processes, although finishing (or chemical treating) processes also started to become important in this era to stabilize and purify the products of thermal cracking.
Figure 11.3 shows a simple schematic diagram of the Burton-Clark batch thermal cracking process. The process employed tubular heating similar to those used in a steam boiler. The series of tubes in the firebox circulate the hot gas oil back to the drum by thermal convection for more uniform heating. The hot gases from the coal-fired furnace are directed up over the high end of the tubes and down over the low end of the slanted bundle. Feed is introduced in the low end of the tubes and tar is withdrawn from the bottom set of tubes. The products of thermal cracking are fractionated in the Bubble Tray Tower and in the high-pressure and low-pressure separators. In the high-pressure separator are the gaseous products hydrogen, methane, and ethane, and in the low-pressure separator are the gases ethane and propane and the liquid products gasoline and kerosene.
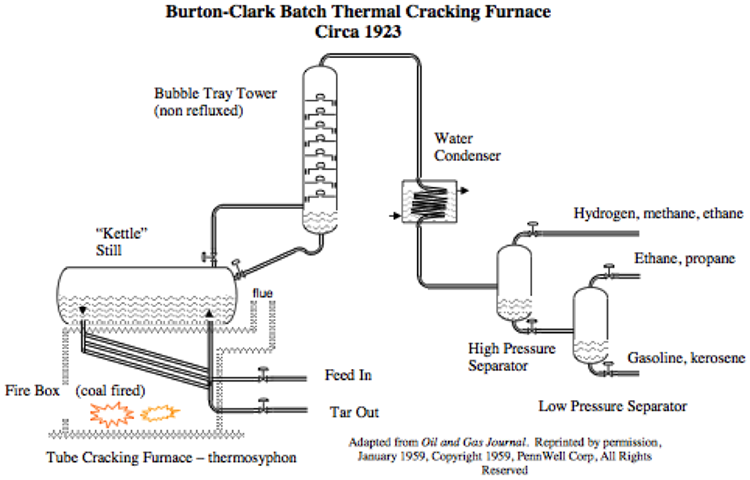
Figure 11.4 shows the configuration of different processes in the thermal refinery. As different from the thermal processes in a current refinery, the thermal refinery includes processes such as Thermal Polymerization, making gasoline from the light olefins propene and butene; Thermal Reforming, to make relatively high octane number gasoline from straight-run naphtha; and gasification of heavy gas oil with steam, to produce town gas (CO+H2) which predates the use of natural gas in cities for domestic heating and cooking.
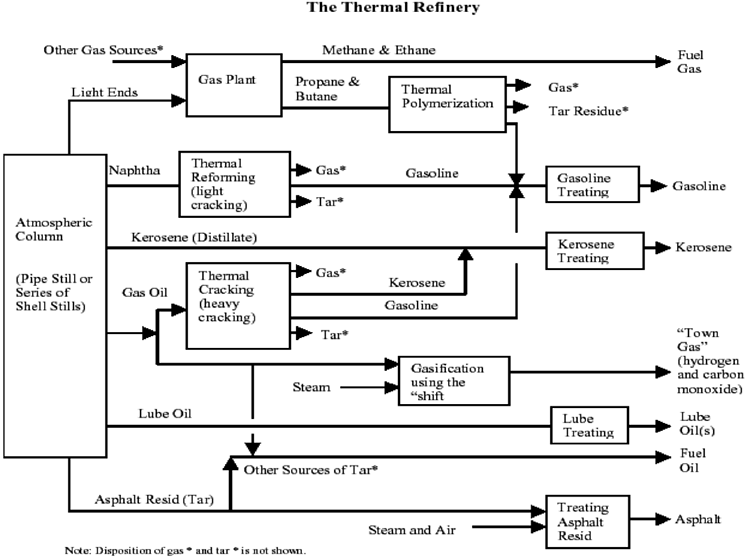
Atmospheric Column (Pipe Still of Series of Shell Stills)
-Light ends & Other gas sources
Gas Plant
Methane and ethane (fuel gas)
Propane and Butane
Thermal Polymerization
Gas
Tar Residue
Gasoline (joins gasoline treating process)
-Naphtha
Thermal Reforming (light cracking)
Gas
Tar
Gasoline
Gasoline Treating
Gasoline
-Kerosene (Distillate)
Kerosene Treating
Kerosene
-Gas Oil
Thermal Cracking (heavy cracking)
Gas
Tar
Kerosene (Joins kerosene treating process)
Gasoline (joins gasoline treating process)
Gasification using the shift (uses Steam)
“town gas” (hydrogen and carbon monoxide)
-Lube Oil
Lube treating
Lube Oils
-Asphalt Resid (Tar)
Treating asphalt resid (uses steam and air)
Asphalt
-Other Sources of Tar
Fuel Oil
The essential driver of the Thermal Refinery was the shift in demand to gasoline from kerosene because of the introduction of the automobile, the airplane, and electricity. The demand for gasoline rapidly increased when the U.S. declared war on Germany in 1917 and became a party in World War I. Thermal refinery processes, thermal cracking, thermal reforming, and thermal polymerization enabled the expansion of gasoline supply [3]. With the introduction of tetraethyl lead (TEL) as an octane number boosting additive in 1923, a growing interest was directed to production of high-performance gasoline which would be defined later as a high-octane number-gasoline after the introduction of a test method to measure the octane number of gasoline as an anti-knock property in 1931. Because of the toxicity of lead, TEL concentration was limited to 3 milliliters per gallon of finished gasoline (approximately 800 ppm by volume). The addition of lead to motor gasoline continued until the 1970s in the United States when the mandate for adding catalytic converters to automobiles took effect in accordance with the Clean Air Act to reduce tailpipe emissions, and the unleaded gasoline was introduced. Lead is still added to aviation gasoline used in turboprop aircraft in quantities 0.3-0.56 g/L in a range of avgas grades, and efforts are underway to remove lead from the aviation gasoline as well in the near future.
Up through 1924, even with the rapid introduction of various thermal cracking processes, only 20% of the gasoline produced in the U.S. came from thermal processes. But after the introduction of TEL, the contribution of gasoline produced by thermal cracking has steadily increased to reach over 50% of the gasoline pool by the end of the age of the Thermal Refinery in 1940. For reasons discussed in Lessons 6 and 7, the Catalytic Refinery arrived in the scene of brutal competition of making high-performance gasoline and other petroleum fuels in the period leading to and during World War II.
[3.] F. Self, E. Ekholm, and K. Bowers, Refining Overview - Petroleum, Processes and Products, AIChE, 2000, Chapter 5.
The Catalytic Refinery (1940-1970)
The Catalytic Refinery (1940-1970)
As discussed in Lessons 6 and 7, the development of catalytic processes has changed the chemistry of petroleum refining from free radical to ionic reactions. World War II provided the stimulus to urgently develop catalytic technologies that were being investigated in the late thirties. The catalytic age of refining, which could be bracketed between1940 and 1970 also brought the advent of the petrochemical industry.
Figure 11.5 shows a configuration of the catalytic refinery which resembles, to a large extent, the current day refineries focused on making high yields of gasoline. The introduction of catalytic cracking, reforming, alkylation, polymerization has revolutionized the ways of making high octane number gasoline. Development of hydrotreatment processes was also an important asset of the catalytic refinery. Hydrotreatment was essential to protect the platinum catalyst used in reforming from sulfur and as a versatile finishing process to replace the chemical treatments used in the thermal refinery to finish fuels.
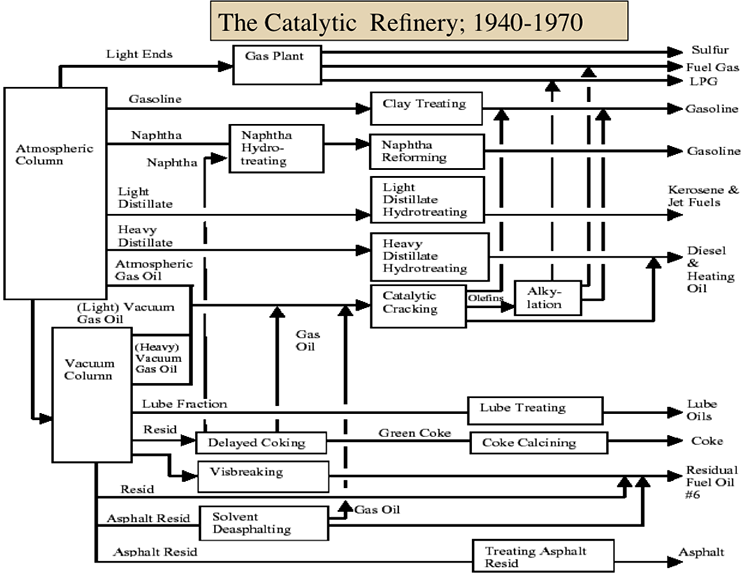
One should note in Figure 11.5 that the catalytic refinery also incorporated new thermal processes such as delayed coking and visbreaking, and separation processes, such as deasphalting. Principles of chemical engineering have found great applications in the development of the catalytic refinery with particular emphasis on designing different catalytic process configurations (remember Fixed-Bed, Moving-Bed, and Fluid-Bed Catalytic Cracking), catalyst development, thermal efficiency (e.g., FCC) and product yield and selectivity. The catalytic refinery produced large quantities of LPG (for reasons discussed in Lesson 7) and witnessed the increasing demand for kerosene, now as jet fuel. The time-line for the development of refining processes shown in Table 11.1 shows the intense activity of process development, particularly during World War II.
The age of catalytic refining may be considered to have ended in the 1970s, not because new chemistry was introduced, as it happened in the transition from thermal to catalytic refinery or the development of new process concepts. The oil crises of the 1970s highlighted the significance of refinery flexibility with respect to the diversity of crude oil slates. Further, the concerns for environmental pollution by the combustion of petroleum fuels have brought emphasis on more effective finishing processes. These factors lead to the development of the modern refinery focused on processing the heavy ends of petroleum and making cleaner fuels.
| Year | Process Name | Purpose | Byproducts, etc. |
|---|---|---|---|
| 1849 | Canadian geologist Abraham Gesner distills kerosine from crude oil | ||
| 1859 | An oil refinery is built in Baku (Azerbaijan) | ||
| 1860-1861 |
Oil refineries are built near Oil Creek, Pennsylvania; Petrolia, Ontario, Canada; and Union County, Arkansas |
||
| 1862 | Atmosphere distillation | Produce kerosine | Naphtha, tar, etc. |
| 1870 | Vacuum distillation | Lubricants (original) cracking feedstocks (1930s) |
Asphalt, residual coker feedstocks |
| 1913 | Thermal Cracking | Increase gasoline |
Residual, bunker fuel |
| 1916 | Sweetening | Reduce sulfur and odor | Sulfur |
| 1930 | Thermal reforming | Improve octane number | Residual |
| 1932 | Hydrogenation | Remove sulfur | Sulfur |
| 1932 | Coking | Produce gasoline base stocks |
Coke |
| 1933 | Solvent extraction | Improve lubricant viscosity index | Aromatics |
| 1935 | Solvent dewaxing | Improve pour point | Waxes |
| 1935 | Catalyst polymerization | Improve gasoline yield and octane number | Petrochemical feedstocks |
| 1937 | Catalytic cracking | Higher octane gasoline | Petrochemical feedstocks |
| 1939 | Visbreaking | Reduce viscosity | Increased distillate, tar |
| 1940 | Alkylation | Increase gasoline octane and yield | High-octane aviation gasoline |
| 1940 | Isomerization | Produce alkylation feedstock | Naphtha |
| 1942 | Fluid catalytic cracking | Increase gasoline yield and octane | Petrochemical feedstocks |
| 1950 | Deasphalting | Increase cracking feedstock | Asphalt |
| 1952 | Catalytic reforming | Convert low-quality naphtha | Aromatic |
| 1954 | Hydrodesulfurization | Remove sulfur | Sulfur |
| 1956 | Inhibitor sweetening | Remove mercaptan | Disulfides |
| 1957 | Catalytic isomerization | Convert to molecules with high octane number | Alkylation feedstocks |
| 1960 | Hydrocracking | Improve quality and reduce sulfur | Alkylation feedstocks |
| 1974 | Catalytic dewaxing | Improve pour point | Wax |
| 1975 | Residual hydrocracking | Increase gasoline yield from residual | Heavy residuals |
| 1975 | Catalytic converter | The phaseout of tetraethyl lead begins | Cleaner air |
| 1990s | SCANfining (Exxon), OCTGAIN (Mobil), Prime G (Axens), and S Zorb (Phillips) | Reformulated gasoline and low-sulfur diesel | Low sulfur fuel |
| 2000 | Deep or ultra-deep desulfurization (ULSD) | Decrease sulfur level in diesel (2 ppm0 | Sulfur |
Heavy Ends Conversion Refinery (1970-)
Heavy Ends Conversion Refinery (1970-)
Oil crises of 1973 and 1979, which created crude oil price shocks, contributed to an increasing emphasis on energy efficiency and independence. These events along with the stricter environmental regulations set up the evolution of the End of the Century Refinery (or Heavy Ends Conversion Refinery) which has focused on efficient processing of heavy crudes as well as the heavy ends of crude oils to produce higher yields of distillate fuels. Producing cleaner fuels and cleaner operation of refining processes have been mandated by environmental regulations.
Figure 11.6 shows the configuration of the Heavy Ends Conversion refinery, with emphasis on processes marked with the red rectangle in Figure 11.6. These processes include hydrotreating of heavy gas oils before catalytic cracking to remove sulfur that contaminates downstream catalysts and to saturate aromatic C-C bonds to produce higher yields of fuel products from catalytic cracking. With better protection from sulfur contamination, FCC units can use modified catalysts to increase gasoline yield and reduce coke yield.
HECR offers four primary heavy oil or residue processing technologies as options for processing heavy crudes or “bottom-of-the barrel” processing. These processes have become more important as the world crude slate becomes heavier and more contaminated with sulfur and other heteroatom species, as sulfur limits become more stringent with environmental regulations.
Hydrocracking of heavy oils removes downstream catalyst contaminants and saturate aromatic compounds to produce higher yields of fuel products. Hydrocracking offers flexibility to choose between gasoline, jet fuel, and diesel fuel by coordinating the operations of fluid catalytic cracking and hydrocracking.
Other options for residue processing include coking, visbreaking, and deasphalting. Coking followed by catalytic upgrading of coking products (naphtha and gas oils) by hydrogenation, or hydrocracking generates high-quality distillates from residua that are not suitable for catalytic processes due to large concentrations of asphaltenes and heteroatom compounds (sulfur, nitrogen, oxygen, metals). Visbreaking and deasphalting removes the highly reactive compounds and asphaltenes from residua making the visbroken and deasphalted oils attractive feedstocks for catalytic hydroprocessing to produce distillate fuels.
The End of the 20th Century Refinery (the present-day refinery) is much more complex and versatile than its predecessor, The Catalytic Refinery. In addition, there are differences that are not so visible in conventional descriptions and flow sheets, such as computerized control of the operations and on-line measurements of product composition and properties.
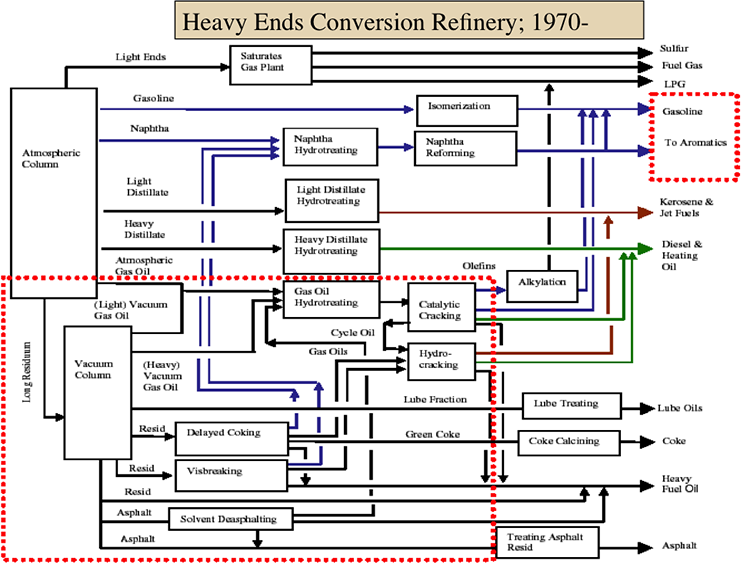
Future Trends in Petroleum Refining
Future Trends in Petroleum Refining
Speculation about the future of refining is risky at best, but some trends are described as to be more certain by Self, Ekholm, and Bowers [5], as follows:
- Computers will increasingly be used for research, design, control and operation, maintenance, information handling, supply chain management, marketing execution, and distribution. As a result, research will broaden and manufacturing facilities will become more complex.
- The sophistication of competitors and customers, both domestic and international, will drive more transparent and efficient markets.
- Consumers will continue to search for energy sources that are reliable and independent of political forces, sustainable, environmentally acceptable, simple to generate and store and distribute, and inexpensive. Consequently, companies will hasten to reconcile the position of fossil fuels within emerging energy alternatives. Meanwhile, fuel formulations and usage will evolve, particularly for better performance and pollution prevention. This will progress despite the apparent trend of heavier crudes with increased sulfur, metals, solids, and water.
- Sensitivity will spread for the concerns and desires of consumers, communities, investors, and other stakeholders in all aspects of refining. Interaction with all stakeholders will be critical.
- Strategic consolidation of the size, number, and ownership of facilities and companies will continue. New partnerships will form among customers, competitors, and suppliers. Companies will attempt to maximize their return on assets, optimize allocation of capital, and reduce operating costs. In particular, efforts at hazard elimination and pollution prevention will intensify to reduce operational and liability costs.
Factors that may influence the future of petroleum refining
Factors that may influence the future of petroleum refining
Figure 11.7 lists four factors that may influence the future of petroleum refining, including product demand, crude supply, environmental regulations, and new technology development. It is expected that in the near future, the demand for distillate fuels will keep increasing, while the conventional crude oil slate will become heavier and more contaminated. This conflict between the trends in supply and demand that is aggravated by stricter environmental regulations on the purity of fuels can be mitigated by new and more effective technologies (processes and catalysts). Although the conventional crude oils are becoming heavier (Figure 11.8), non-conventional liquids such as synthetic crude oil from oil sands in Canada and shale gas liquid by-products are lighter than the conventional crude oils and could be used as blend components to dilute the heavy crudes. Natural gas liquids and coal-derived liquids may also be used as alternative feedstocks for refining. The diversity in crude oil supply calls out the need to plan/operate a more flexible and versatile refinery.
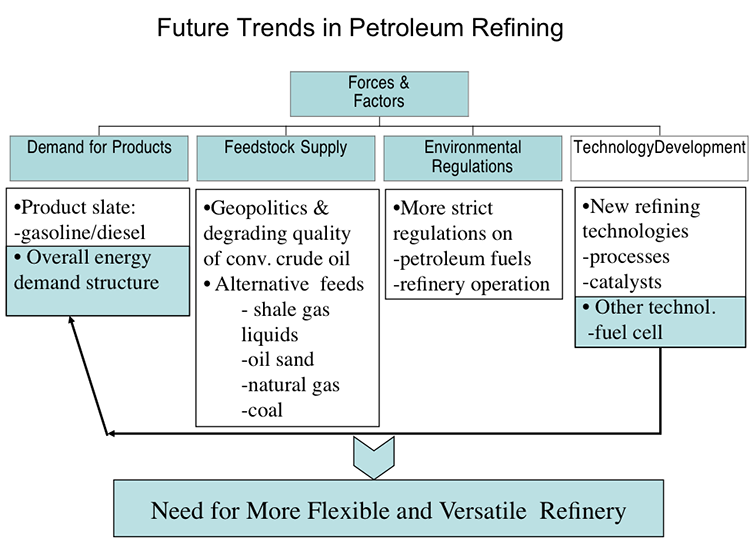
Future Trends in Petroleum Refining
Forces and Factors
-Demand for products
Product slate: gasoline/diesel
Overall energy demand structure
-Feedstock supply
Geopolitics & degrading quality of conv. Crude oil
Alternative feeds: shale gas liquids, oil sand, natural gas, coal
-Environmental Regulations
More strict regulations on: petroleum fuels & refinery operations
-Technology Development
New refining technologies: processes & catalysts
Other technology: fuel cell
Need for more flexible and versatile Refinery!
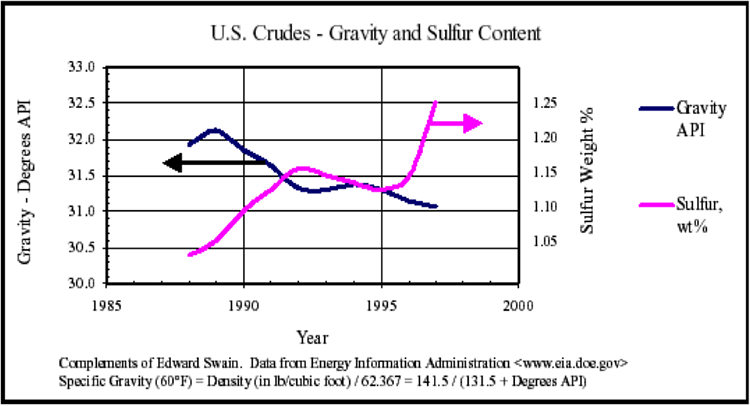
[1.] F. Self, E. Ekholm, and K. Bowers, Refining Overview - Petroleum, Processes and Products, AIChE, 2000, Chapter 1.
Considerations for the Future Refinery
Considerations for the Future Refinery
Figure 11.9 recaps some considerations for the future refinery, as discussed above, and lists the future challenges that include the need to process heavier and more contaminated crude oils to produce cleaner products than before. Production of diesel from highly aromatic by-product from FCC (LCO) remains a concern for the cost and quality of diesel fuel produced in the U.S. refineries. Also, extensive hydrotreatment to comply with the limits on heteroatom levels in fuels would negatively affect the octane numbers of gasoline because during hydrotreatment, olefins and aromatic compounds may be hydrogenated, thus reducing the octane number. No such conflict exists for diesel fuel, because cetane number of diesel actually increases with hydrogenation. It is clear that the hydrogen demand for the future refinery will keep increasing, and refineries will build or expand the existing hydrogen production capacity.
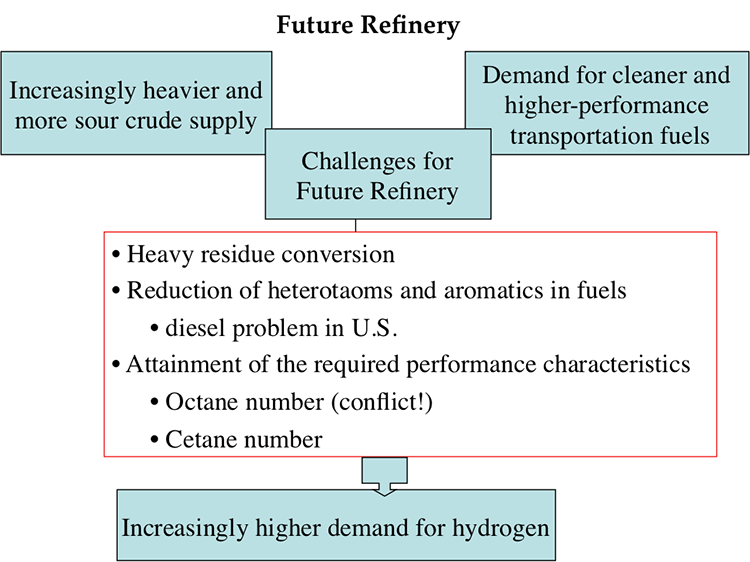
Future Refinery
-Increasingly heavier and more sour crude supply
-Demand for cleaner and higher-performance transportation fuels
-Challenges for future refineries
Heavy residue conversion
Reduction of heteroatoms and aromatics in fuels
Diesel problem in the US
Attainment of the required performance characteristics
Octane number (Conflict!)
Centane number
-Increasingly higher demand for hydrogen
Self-Check Questions
Please take a few minutes to work through the review questions. These questions will help you study for the final.
Assignments
Assignment Reminder
The assignments for this week include Exercise 10 and Quiz 4.
Exercise 10
Exercise 10 Instructions
- Draw a block flow diagram for a petroleum refinery that includes three different separation processes, five different conversion processes along with one or more finishing processes, and one supporting process to produce altogether nine commercial fuels and materials from a sour crude oil. Clearly label all the feedstocks, processes, and products on your diagram including the type of process (separation, conversion, finishing, and support) and the intermediate products. Make sure that all processes are correctly connected. Write down the principal objectives of this refinery. 60 pts
- Draw a block flow diagram for a petroleum refinery to maximize the diesel fuel yield from a paraffinic crude oil. In your flow diagram, include only the processes that are absolutely necessary for maximum diesel yield and make sure that the whole crude is converted completely to commercial (sellable) products in this refinery. 40 pts
Special Note:
You may use PowerPoint to draw the diagrams, or scan neatly hand-drawn diagrams and submit as a PDF to the Assignment.
Instructions for Submitting Response:
Once you have a solution to the exercises you will submit your answers as a PDF by uploading your file to be graded.
Please follow the instructions below.
- Find the Exercise 10 assignment in the Lesson 11 Module by either clicking Next until you find it or by clicking Assignments and scrolling down until you find it.
- Make sure that your name is in the document title before uploading it to the correct assignment (i.e. Lesson11_Exercise10_Tom Smith).
Quiz 4
Quiz 4. Will cover material in Lessons 10-11. Check the Syllabus, or Course Calendar for Quiz 4 schedule.
Summary and Final Tasks
Summary
The evolution of petroleum refinery can be considered to have taken in four stages from being just a separation refinery (distillation and dewaxing) to a conversion refinery in accordance with the demand for petroleum products. The conversion refinery evolved first as a thermal refinery with the development of thermal cracking, reforming, and polymerization, and transitioned into the catalytic refinery during World War II, with the development of processes such as catalytic cracking, catalytic reforming, alkylation, and catalytic hydrotreatment to define the finishing processes. The next stage of evolution after the catalytic refinery, high-end conversion refinery, has kept all the catalytic processes and added hydrocracking with emphasis on processing the heavy crude oils and production of cleaner fuels in compliance with environmental regulations. The increasing demand for hydrogen for hydrocracking and hydrotreatment operations and the need to recover increasing quantities of elemental sulfur highlighted the requirement of supporting processes for the operation of this refinery.
Learning Outcomes
- Comprehension of discrete stages in the history of petroleum refining and the driving forces that ushered in these stages.
- Evaluation of the driving forces that could impact the future of petroleum refineries and consideration of different scenarios for responding to the driving forces.
Reminder - Complete all of the Lesson 11 tasks!
| Readings: | F. Self, E. Ekholm, and K. Bowers, Refining Overview - Petroleum, Processes and Products, AIChE CD-ROM, 2000. |
|---|---|
| Assignment: | Exercise 10: Construct refinery flow diagrams. Quiz 4. Will cover material in Lessons10-11. Check the syllabus and course calendar for Quiz 4 schedule. |
Questions?
If you have any questions, please post them to our Help Discussion (not email), located in Canvas. I will check that discussion forum daily to respond. While you are there, feel free to post your own responses if you, too, are able to help out a classmate.
Lesson 12: Natural Gas Processing
Lesson 12 Overview
Overview
Video: Lesson 12 (5:38)
PRESENTER: Natural gas is a very important fuel fossil fuel in the United States. Its significance has increased since the hydrofracking operations to produce shale gas as an unconventional source for natural gas. Now, the production of natural gas through hydrofracking or other techniques is beyond the scope of this course. But we will focus on the processing of natural gas as it comes out of the ground.
The main component of natural gas is methane, but it also contains heavier hydrocarbons-- principally, ethane, propane, butane and pentanes, which may be referred to as the natural gas liquids. In addition, the raw gas could contain significant amounts of water, hydrogen sulfide, carbon dioxide, and nitrogen, in some cases. So there is a need to process the natural gas as it comes out of the ground before it is sent to, or fed into the pipeline system for transport to remote locations.
There are essentially four components of natural gas processing, which are oil and condensate removal, and sulfur and carbon dioxide removal. Sulfur comes out as H2S, mainly. Removing water is important, and the separation and fractionation of natural gas liquids. That's anywhere from butane or propane, butane up to and about pentanes.
Now, as we have talked about before, these natural gas liquids are-- in a sense-- newer feeds to the refinery as liquid materials to be blended into practically to gasoline product as an additional feed material. So it's important that we really look at this natural gas processing techniques.
Now, for processing of natural gas, we use pretty much the same techniques as we have in petroleum refining. One major process is, of course, removal of H2S and carbon dioxide as acid gases. We'll use the amine absorption or solutions that contain the base-- ethanolamine or diethanolamine-- to absorb these acid gases, H2S and carbon dioxide, which are, of course sent to sulfur recovery using, again, the similar techniques that we have talked about for petroleum refining. That is the Claus and then also the SCOT method.
The separation and fractionation of natural gas liquids uses essentially the same processes as we have talked about in the lights end unit-- a petroleum refinery-- to separate ethane and butane and propane and the heavier liquids in this unit. That's essentially going to be a similar setup as we have talked about in the lights end unit.
Overview
Natural gas has become a very significant fossil fuel in the U.S. because of a sharp increase in shale gas production starting in 2006. The U.S. Energy Information Administration projects that the U.S. natural gas production will increase 44% from 23.0 trillion cubic feet in 2011 to 33.1 trillion cubic feet in 2040 [1]. Almost all of this increase in domestic natural gas production is due to projected growth in shale gas production, which is projected to grow from 7.8 trillion cubic feet in 2011 to 16.7 trillion cubic feet in 2040. It is interesting to note that before the shale gas boom (that has taken place largely in Pennsylvania), the U.S. was planning to import liquefied natural gas (LNG) from countries as far as Peru with the planned construction of LNG ports in California and other states. Currently, there are prospects of exporting LNG overseas in the near future. One particular aspect of the natural gas boom that concerns the petroleum refining industry is the increased production of natural gas liquids (NGL) that are co-produced with natural gas. NGL consist of light hydrocarbons, and they have become an important non-conventional feedstock for refineries, contributing mainly to gasoline production. This new input to refineries along with the increased domestic oil production by the new drilling technology has helped small inland refineries that do not have easy access to imported crude oil as, for example, Gulf Coast refineries.
This lesson will provide an overview of the natural gas processing that employs the same techniques and processes as we have covered in petroleum refining operations, such as in Light Ends Unit for fractionation of light hydrocarbons, and recovering H2S, as well as its conversion to S. Brief introductions to shale gas and natural gas liquids will be presented before discussing the natural gas processing.
Learning Outcomes
By the end of this lesson, you should be able to:
- appraise different natural gas reserves (conventional, tight, and shale) and assess the contribution of natural gas to energy supply;
- illustrate and evaluate the different stages of natural gas processing, including condensate removal, acid gas removal, water removal, fractionation of natural gas liquids.
What is due for Lesson 12?
This lesson will take us one week to complete. Please refer to the Course Syllabus for specific time frames and due dates. Specific directions for the assignment below can be found in this lesson.
| Readings: | Natural Gas |
|---|---|
| Assignments: |
Review the DOE page on shalle gas: https://www.energy.gov/articles/producing-natural-gas-shale [16] |
Questions?
If you have any questions, please post them to our Help Discussion (not email), located in Canvas. I will check that discussion forum daily to respond. While you are there, feel free to post your own responses if you, too, are able to help out a classmate.
Shale Gas
Shale Gas
Shale gas refers to natural gas that is trapped within shale formations, as different from conventional natural gas resources, such as associated (produced with crude oil), or non-associated (without crude oil) natural gas that is found mostly in sandstone formations. Shales are fine-grained sedimentary rocks that can be rich sources of petroleum and natural gas. Over the past decade, the combination of horizontal drilling and hydraulic fracturing has allowed access to large volumes of shale gas that were previously uneconomical to produce. The production of natural gas from shale formations has invigorated the natural gas industry and the small inland refineries in the United States.
Figure 12.1 shows the EIA data and projections on dry natural gas production in the U.S., indicating the surge in shale gas production, while the conventional associated and non-associated gas production are expected to decline [3]. Dry natural gas refers to natural gas that consists, essentially, of methane without any significant concentration of condensable hydrocarbons, such as propane and butane, that are present in natural gas liquids.
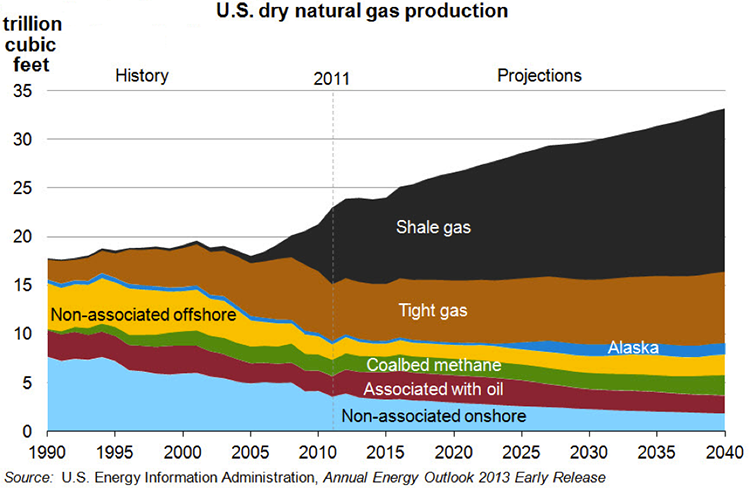
[2.] Natural Gas Overview [18]
[3.] What are Natural Gas Liquids? [19]
Natural Gas Liquids
Natural Gas Liquids
Natural gas liquids (NGLs) are composed of hydrocarbons, including ethane, propane, butane, isobutane, pentane, and higher alkanes. Although ethane cannot be readily liquefied by pressure at ambient temperature such as propane and butane (LPG) it is considered a component of NGL. There are many uses for NGLs, as summarized in Table 12.1 [3]. NGLs are extracted from the natural gas production stream in field processing plants, using techniques discussed related to petroleum refining operations.
NGL field production is growing in the United States, representing an important part of the supply picture.
| Natural Gas Liquid | Chemical Formula | Applications | End Use Products | Primary Sectors |
|---|---|---|---|---|
| Ethane |
C2H6
|
Ethylene for plastics production; petrochemical feedstock | Plastic bags; plastics; anti-freeze; detergent | Industrial |
| Propane | C3H8 | Residential and commercial heating; cooking fuel; petrochemical feedstock | Home heating; small stoves and barbeques; LPG | Industrial, Residential, Commercial |

| Natural Gas Liquid | Chemical Formula | Applications | End Use Products | Primary Sectors |
|---|---|---|---|---|
| Ethane |
C2H6
|
Ethylene for plastics production; petrochemical feedstock | Plastic bags; plastics; anti-freeze; detergent | Industrial |
| Propane |
C3H8
|
Residential and commercial heating; cooking fuel; petrochemical feedstock | Home heating; small stoves and barbeques; LPG | Industrial, Residential, Commercial |
| Butane |
C4H10
|
Petrochemical feedstock; blending with propane or gasoline | Synthetic rubber for tires; LPG; lighter fuel | Industrial, Transportation |
| Isobutane |
C4H10
|
Refiner feedstock; petrochemical feedstock | Alkylate for gasoline; aerosols; refrigerant | Industrial |
| Pentane |
C5H12
|
Natural gasoline; blowing agent for polystyrene foam | Gasoline; polystyrene; solvent | Transportation |
| Pentanes Plus* | Mix of C5H12 and heavier | Blending with vehicle fuel; exported for bitumen production in oil sands | Gasoline; ethanol blends; oil sands production | Transportation |


C indicates carbon, H indicates hydrogen; Ethane contains two carbon atoms and six hydrogen atoms
*Pentanes plus is also known as "natural gasoline." Contains pentane and heavier hydrocarbons.
Table 12.2. Some components and applications of natural gas liquids [3].
Source: US Energy Information Administration
[3.] What are Natural Gas Liquids? [19]
Natural Gas Composition and Specifications
Natural Gas Composition and Specifications
Natural gas as recovered at the wellhead consists of mostly methane (C1), but it contains other hydrocarbons, principally ethane (C2), propane (C3), butanes (C4), and pentanes C5 that constitute the natural gas liquids, as discussed in the previous section. Raw natural gas also contains water vapor, hydrogen sulfide (H2S), carbon dioxide, nitrogen, helium, and other impurities, such as mercury. Table 12.3 gives some examples of the composition of natural gas produced in three different locations, to give an example that methane content of natural gas can be as low as 65%. One can also note in Figure 12.2 that some natural gas streams may contain high concentrations of H2S and N2. Some natural gas streams could be a commercial source for helium [4]. One of the important objectives of natural gas processing is to remove the corrosive and toxic gas H2S and convert it to elemental sulfur, as will be discussed later. Important impurities, including those shown in Table 12.3, that need to be removed from natural gas are listed below [5].
| Canada | Kansas | Texas | |
|---|---|---|---|
| C1 | 77.1 | 73.0 | 65.8 |
| C2 | 6.6 | 6.3 | 3.8 |
| C3 | 3.1 | 3.7 | 1.7 |
| C4s | 2.0 | 1.4 | 0.8 |
| C5s+ | 3.0 | 0.6 | 0.5 |
| H2S | 3.3 | 0.0 | 0.0 |
| CO2 | 1.7 | 0.0 | 0.0 |
| N2 | 3.2 | 14.7 | 25.6 |
| He | 0.0 | 0.5 | 1.8 |
Important impurities found in natural gas [5].
- Water: Most gas produced contains water, which must be removed. Concentrations range from trace amounts to saturation.
- Sulfur species: If the hydrogen sulfide (H2S) concentration is greater than 2 to 3%, carbonyl sulfide (COS), carbon disulfide (CS2), elemental sulfur, and mercaptans may be present.
- Mercury: Trace quantities of mercury may be present in some gases; levels reported vary from 0.01 to 180 μg/Nm3. Typically, the mercury level in pipeline gas should be reduced to 0.01 μg/Nm3.
- Diluents: Although the gases shown in Figure 12.2 are typical, some gases have extreme amounts of undesirable components. For example, some wells in Colorado contain as much as 92% carbon dioxide. High hydrogen sulfide contents (e.g., in Alberta, Canada), and nitrogen contents (e.g., in Texas) have also been observed.
- Oxygen: Some gas-gathering systems in the United States operate below atmospheric pressure. As a result of leaking pipelines, open valves, and other system compromises, oxygen is an important impurity to monitor. A significant amount of corrosion in gas processing is related to oxygen contamination.
Considering that the principal transportation of natural gas over land is by pipeline, natural gas specifications for pipeline transmission have been developed. Table 12.4 gives the natural gas specifications that need to be satisfied for pipeline transportation. Note that in addition to the specified impurity levels for the contaminants, the specifications include the heating value of natural gas (950 -1150 Btu/scf) which depends on the composition, particularly the concentration of inert gases (e.g., N2 and CO2) and other diluents.
Table 12.4. Specifications for pipeline quality natural gas [6].
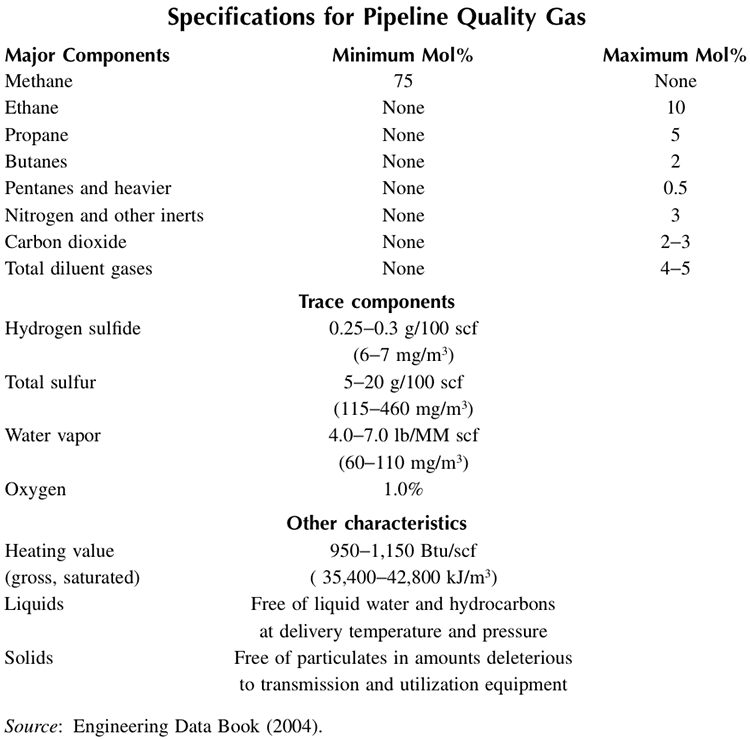
| Major Components | Minimum Mol% | Maximum Mol% |
|---|---|---|
| Methane | 75 | None |
| Ethane | None | 10 |
| Propane | None | 5 |
| Butanes | None | 2 |
| Pentanes and heavier | None | 0.5 |
| Nitrogen and other inerts | None | 3 |
| Carbon dioxide | None | 2-3 |
| Total diluent gases | None | 4-5 |
Trace Components:
- Hydrogen sulfide: 0.25-0.3 g/100 scf (6-7 mg/m3)
- Total sulfur: 5-20 g/100 scf (115-460 mg/m3)
- Water Vapor: 4.0-7.0 lb/MM scf (60-110 mg/m3)
- Oxygen: 1.0%
Other Characteristics:
- Heating calculated (gross, saturated): 950-1,150 Btu/scf (35,400-42,800 kJ/m3)
- Liquids: Free of liquid water and hydrocarbons at delivery temperature and pressure.
- Solids: Free of particulates in amounts deleterious to transmission and utilization equipment.
[4.] A. J. Kidnay and W. R. Parrish, Fundamentals of Natural Gas Processing, CRC Press, Boca Raton, FL, 2006, p.9.
[5.] A. J. Kidnay and W. R. Parrish, Fundamentals of Natural Gas Processing, CRC Press, Boca Raton, FL, 2006, p.10.
[6.] A. J. Kidnay and W. R. Parrish, Fundamentals of Natural Gas Processing, CRC Press, Boca Raton, FL, 2006, p.16.
Natural Gas Processing
Natural Gas Processing
A comparison of Images 12.2 and 12.3 illustrates the significance of natural gas processing for purification of the raw natural gas to obtain a pipeline quality gas. In general, natural gas processing includes the following steps:
- Condensate and Water Removal
- Acid Gas Removal
- Dehydration – moisture removal
- Mercury Removal
- Nitrogen Rejection
- NGL Recovery, Separation, Fractionation, and Treatment of Natural Gas Liquids
In addition to these processes, it is often necessary to install scrubbers and heaters at or near the wellhead. The scrubbers remove sand and other large-particle impurities. The heaters ensure that the temperature of the natural gas does not drop too low and form a hydrate with the water in the gas stream. Natural gas hydrates are crystalline ice-like solids or semi-solids that can impede the passage of natural gas through valves and pipes.
A generalized natural gas flow diagram is shown in Figure 12.2 [7]. After initial scrubbing to remove particles, the first step in natural gas processing is the removal of condensate (oil) and water that is achieved by controlling the temperature and pressure of the inlet stream from the well, as shown in Figure 12.4. Gas separated in this unit is sent to acid gas recovery; the condensate or the oil recovered is usually sent to a refinery for processing, while water is disposed, or treated as wastewater.
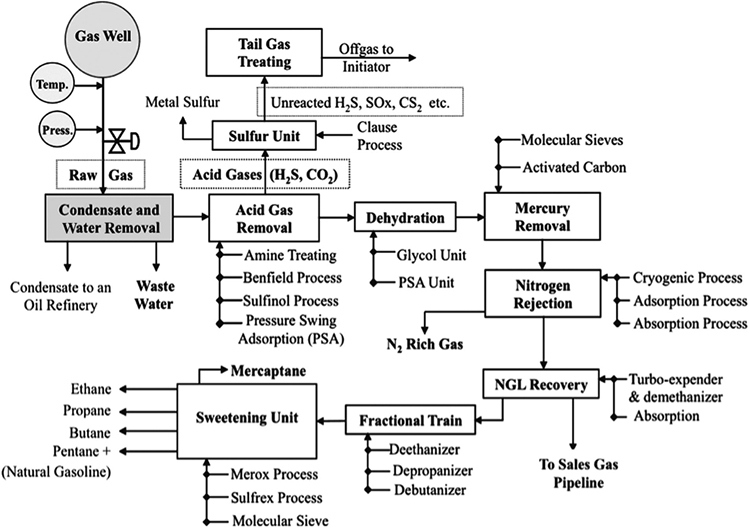
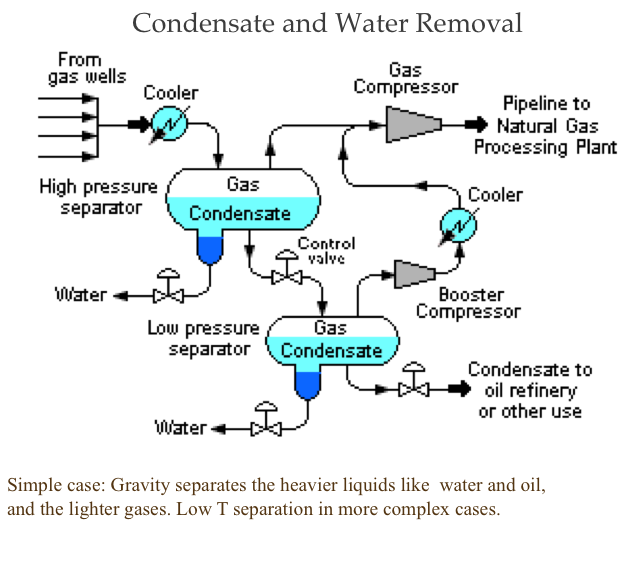
Acid gases (H2S and CO2) are separated usually by absorption in an amine solution, as discussed for H2S recovery in a petroleum refinery in Lesson 10. The recovered H2S is sent to a combined Claus-SCOT (Tail Gas Treating) unit to be converted to elemental sulfur, as was also discussed in Lesson 10. After removing the acid gases, the natural gas stream is sent to a dehydration unit to remove water typically by absorption in a glycol unit, followed by mercury removal (by adsorption on activated carbons or other sorbents), and nitrogen rejection either cryogenically, or by adsorption, or absorption depending on the nitrogen concentration. The last step in the processing sequence is the Natural Gas Liquids (NGL) extraction, fractionation, and treatment, as described in Figure 12.4.
Figure 12.4: Separation and Fractionation of Natural Gas Liquids [6]
Natural gas liquids (NGLs) have a higher value as separate products.
Two basic steps: 1) Extraction, 2) Fractionation
- NGL Extraction
Absorption Method- Similar to using absorption for dehydration, using a different absorbing oil for hydrocarbons.
- Dropping the temperature of the gas stream to around -120°F by expansion and external refrigeration
- Natural Gas Liquid Fractionation - works like Light Ends Unit
- Deethanizer - separates ethane from the NGL stream
- Depropanizer - separates propane.
- Debutanizer - boils off the butanes
- Butane Splitter or Deisobutanizer - separates iso and n-butanes.
NGL extraction can be carried out by absorption in oil that selectively absorbs hydrocarbons heavier than methane, or by a cryogenic expansion and external refrigeration to condense NGL.
Following the NGL extraction, the treated natural gas stream that is, now, mostly methane, or a gas compliant with the natural gas specifications is sent to the pipeline for transmission to the point of use. The extracted NGL, on the other hand, is sent to a fractionation unit that operates like Light Ends Unit in a refinery, as discussed in Lesson 5, separating ethane, propane, butane, and naphtha (>C5, natural gasoline). Note that the fractionation unit may also include a butane splitter or deisobutanizer to separate n-butane and iso-butane. You may remember from Lesson 8 that iso-butane is a feedstock to alkylation to produce high-octane gasoline when reacted with C3 and C4 olefins. NGL from highly sour gases may need additional treatment to remove mercaptans and other sulfur species before NGL leaves the processing plant.
[6. ]A. J. Kidnay and W. R. Parrish, Fundamentals of Natural Gas Processing, CRC Press, Boca Raton, FL, 2006, p.16.
[7.] M.R. Riazi, S. Eser, J. L. Peña Díez, and S. S. Agrawal, “Introduction” In Petroleum Refining and Natural Gas Processing, Editors: M. R. Riazi, S. Eser, J. L. Peña, S. S. Agrawal, ASTM International, West Conshohocken, PA, 2013, p.12.
Self-Check Questions
Please take a few minutes to work through the questions below. They will help you study for the quiz this week.
Assignments
Assignment Reminder
Review the US DOE web page on shale gas [20].
The material in the section on Shale Gas Basics is included in the coverage of the final exam.
Also remember:
Final exam is comprehensive and will cover all the course material in Lessons 1-12. Will be given Finals Week. Check the schedule.
Summary and Final Tasks
Summary
Natural gas has gained prominence in the energy scene as a rising fossil fuel following the development of new drilling technology that set up a boom in shale gas production. As crude oil, natural gas contains wide-ranging impurities in addition to the main component, methane. Natural Gas Processing removes the contaminants in the raw gas and recovers some valuable byproducts, such as natural gas liquids. A number of separation and recovery processes used in a petroleum refinery can also be used for natural gas processing.
Learning Outcomes
By the end of this lesson, you should be able to:
- appraise different natural gas reserves (conventional, tight, and shale) and assess the contribution of natural gas to energy supply;
- illustrate and evaluate the different stages of natural gas processing, including condensate removal, acid gas removal, water removal, fractionation of natural gas liquids.
Reminder - Complete all Lesson 12 tasks!
| Readings: | Natural Gas |
|---|---|
| Assignments: |
Review the US DOE web page on shale gas [20]. The material in the section on Shale Gas Basics is included in the coverage of the final exam. |
Questions?
If you have any questions, please post them to our Help Discussion (not email), located in Canvas. I will check that discussion forum daily to respond. While you are there, feel free to post your own responses if you, too, are able to help out a classmate.