Module 2 - Coupled Human-Environment Systems
Introduction
About Module 2
This module addresses the complex and coupled linkages between human systems and ecosystems. It provides an overview of the key concepts that are necessary for understanding many of the environmental problems we face today and considers potential solutions. The perspective proposed here is a “systems perspective” that shows how human and environmental systems are coupled, how they are sustained through feedback mechanisms, and what important properties are of relevance for their resilience and sustainability.
This module focuses on the following questions:
- What are coupled human-environment systems?
- What are feedback mechanisms and how do they work?
- What are resilience and stability, and what do they have to do with sustainability?
- How do humans impact ecosystems?
- Can ecological systems develop and evolve in positive ways? What are the risks?
Use these questions to focus your thinking as you work through the lesson.
What will we learn in Module 2?
By the end of Module 2, you should be able to:
- define and use these concepts: landscape, system diagram, positive and negative feedback loops, carrying capacity, overshoot, resilience, and stability;
- explain what a systems perspective is, and use this perspective for understanding complex human-environment systems;
- draw a systems diagram;
- draw a resilience diagram and explain the connection between resilience and sustainability;
- understand each of the terms in I=PAT equation, as well as the overall significance of this equation and different perspectives on it.
Become familiar with these terms to the point where you, too, can use these in your own work.
What is due for Module 2?
There are a number of required readings in this module and two short assignments to submit. The material covered in this module will be necessary for the completion of Written Assignment 1 due next week. We recommend that you take a look at that assignment this week.
| Requirement | Location | Submitting Your Work |
|---|---|---|
| Reading Assignment: What is Human Ecology? | What are Coupled Human-Environment Systems? | No submission |
| Reading Assignment: The St. Matthew Island Reindeers | Feedback Mechanisms | No submission |
| Reading Assignments: Ehrlich, Simon, Kurzweil, Hynes | Population, Affluence, and Technology | No submission |
| Citation Training (Part 2) Assignment | End of Module 2 |
Connecting In-text to Reference List (quiz) Reflect and Share with your Peers (discussion post) |
Questions?
If you have any questions, please post them to our Course Q & A discussion forum in Canvas. I will check that discussion forum often to respond. While you are there, feel free to post your own responses if you, too, are able to help out a classmate. If you have a more specific concern, please send me a message through Inbox in Canvas.
Landscape
Landscape
Let's begin our discussion of coupled human-environment systems with a concept that is also a very important geographic perspective: landscape. The concept of landscape has for quite a long time been important to geographers and other environmental scientists in understanding human-environment systems. It has been used since the 1800s to focus on human-environment interactions and continues to evolve and be in widespread use.
A landscape, in this context, is not just the scenery that you view from a scenic lookout point. Instead, it is the combination of environmental and human phenomena that coexist together in a particular place on Earth's surface. Landscapes include physical features like streams, oceans, forests, and soils as well as human-constructed buildings, trails, fences, and mines. One emphasis of a landscape-based approach is that none of these features is entirely natural or entirely human. While the concept of “environment” often refers only to the non-human phenomena that humans interact with, the concept of “landscapes” refers to both human and non-human phenomena. Landscapes thus remind us that it is actually impossible to completely disentangle the human from the non-human.
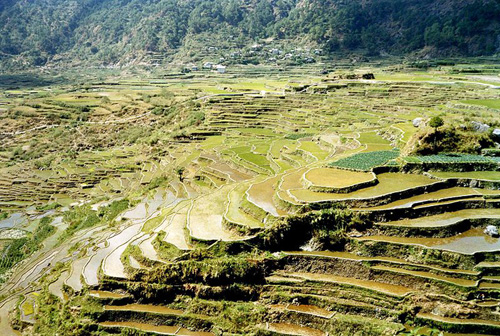
A vivid example of a landscape that shows the close coexistence of humans and environments is the agricultural terrace. A terrace for agriculture is a system of steps built into a hillside to facilitate growing crops or grazing animals. Compared to agriculture on unterraced slopes, terraces reduce erosion, capture more water, and make crops easier to harvest either mechanically or by hand. Terraces are found in sites across the world, including the Philippines, Peru, and England. Terraces show the coexistence and coevolution of human and environmental systems. If the environment were not hilly, then humans would not build terraces. This is an impact of the environment on humans. An impact of humans on the environment is the terrace structure, which becomes an enduring feature of the hill itself. Clearly, humans and the environment are inseparably part of the landscape. In other words, the human part and the environment part are closely coupled.
The famous geographer Carl Sauer (1889-1975) encouraged environmental thinkers to study the humanized environment (i.e., the environment as influenced by human activity) in terms of landscapes during the early and mid-twentieth century. This was a formative period in our understanding of the role of humans in environments. Sauer characterized the process of landscape creation as always ongoing and thus necessary to see in historical terms. He imagined a landscape being transformed through time from its original, natural form into a “cultural landscape” via the influence of human technologies and economies. As our understanding of the dynamism of human-environment systems has evolved, geographers have continued to recognize the importance of history while building a new emphasis on the recursive relationships (interactions in both directions) within the human-environment landscapes. We cannot simply think about how humans have shaped a landscape, we must also think about how the natural features have enabled and constrained human efforts. This bi-directional interaction, or coupledness, is why we study landscapes as a human-environment system.
A dynamic historical perspective also reminds us that there is no pre-determined way that a human-environment landscape will evolve or should evolve. For example, Iowa was not destined to become “the corn belt.” Its emergence as that type of cultural landscape was contingent upon the historical interactions between particular cultural values, economic systems, and environmental conditions. The ability for you to conceive landscapes that are multi-layered, recursive and contingent will enrich your studies of human-environment systems.
One final important feature of a landscape-based approach is the emphasis on perception. Geographer Donald Meinig (1924-2020) writes that "any landscape is composed not only of what lies before our eyes, but what lies within our heads." Landscapes aren’t just “out there” waiting for us to interact with and learn from them. Instead, our interpretations of landscapes are shaped by our own preferences, needs, and experiences. In other words, we mentally “construct” landscapes based on our perspective. For some, a particular landscape of coastal environments may represent environmental preservation. For others, it may reflect recreation. For still others, it may evoke labor and oppression. This means that when we study a landscape, we have to be careful not to imagine that we immediately see all that is there or that our initial perceptions are correct.
What Are Coupled Human-Environment Systems?
What Are Coupled Human-Environment Systems?
As the concept of the human-environment landscape clearly shows, humans impact the environment, and the environment impacts humans. These impacts happen in many different ways. In other words, there are very many interactions between humans and the environment. In order to help us keep track of all these interactions, and to learn from them, it is very useful to use a systems perspective. This means treating humans and the environment as systems: the human system and the environmental system. We could even treat them as one combined human-environment system.
What is a system? In simple terms, it is a collection of components that interact with each other to form some aggregated whole. For example, this course is a system. It has many components, including the modules, the course assignments, the instructor, and the students. These components all interact with each other to form the course. The components can also be thought of as systems. For example, this module has several web pages, some supplemental readings, and a learning activity at the end. Each of these module components can be thought of as a system, too.
To help us visualize and understand systems, it is often helpful to use a systems diagram. A systems diagram displays the system’s components and the interactions between them. In a systems diagram, we put short descriptive phrases (not sentences) in boxes to represent the components that make up the system. Interactions between the components are often symbolized by arrows pointing in a logical direction. Sometimes we also place single words or short phrases along the arrows to explain the nature of these interactions.
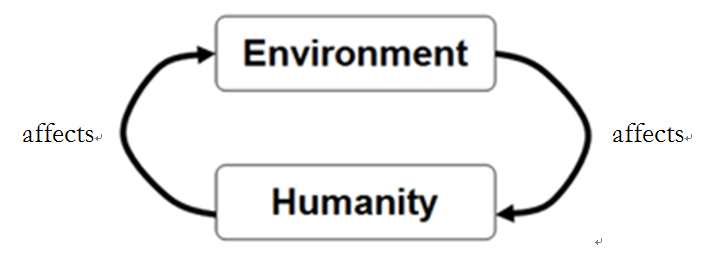
Here is an oversimplified systems diagram showing a human-environment system in which humans and the environment both impact each other:
The systems diagram above is far too simple to illustrate how humans and the environment interact with each other. Let’s take a closer look at the concept of human-environment systems. This concept is developed very well in Gerry Marten’s online textbook Human Ecology. This textbook has excellent systems diagrams and discussions of other aspects of human-environment systems that could serve as a helpful resource for you if you need it.
Reading Assignment: "What is Human Ecology?"
Here, please read just the first section, “What is Human Ecology?” The second section covers sustainable development, which we’ll return to later.
- Marten, Introduction: What is Human Ecology?
As you’re reading this first section, think about how systems are being used to describe humanity, the environment, and interactions between them. Here are some more questions to think about as you read:
- What, according to this reading, is the relationship between humanity and the environment?
- What are some components of the human system and the environment system? How do these components interact?
- What are the specific examples of human-environment systems being presented? What are the components, and how do they interact?
- If you were given a story about a human-environment system, could you draw a systems diagram for it?
Feedback Mechanisms
What are feedback mechanisms and how do they work?
Let’s revisit that very simple human-environment systems diagram from the "What are coupled human-environment systems?" page:
The diagram in Figure 2.2 shows that humanity impacts the environment and that the environment impacts humanity. But if the environment impacts humanity, then that can in turn impact how humanity impacts the environment, which can in turn impact how the environment impacts humanity.
This phenomenon of system components both impacting each other creates a feedback loop. Feedback is an impact to a system component that is a consequence of an action performed by that component. For example, suppose you take the action of writing an email to the instructor, asking a question about the course. The email you get back is a feedback. A loop is a circumstance in which system components impact each other, such that an action by a component affects subsequent performances of that action. This circumstance has a circular, loop-like appearance in a systems diagram, as seen in the diagram above.
There are two basic types of feedback: positive and negative. A positive feedback loop is a circumstance in which performing an action causes more performances of the action. For example, suppose that every time you emailed the instructor with a question about the course, the instructor wrote back with an email so confusing that you had even more questions about the course, which cause you to write two emails back for more clarification. This would be a positive feedback loop.
A negative feedback loop is a circumstance in which performing an action causes fewer performances of the action. For example, suppose that every time you emailed the instructor with a question about the course, the instructor wrote back in an email that clarified the entire course for you, so that you had fewer questions about the course and thus wrote fewer emails for clarification. This would be a negative feedback loop.
It is important to understand that for feedback loops, the terms "positive" and "negative" do not mean good and bad. A positive feedback loop can be a bad thing, and a negative feedback loop can be a good thing or vice versa. Whether or not any given feedback loop is positive or negative is ultimately an ethical question. We’ll cover ethics in Module 3.
Self-check
Now that you have read a bit about what feedback loops entail, here are a few multiple-choice questions that will test your understanding of the differences between what a feedback loop is, and whether it is positive or negative feedback. These should be very simple questions and the purpose here is to give you some confidence in understanding this material so far.
Think About It!
Come up with an answer to these questions by yourself and then click below to reveal the answer.
1. An arms race is an example of:
a. Positive feedback
b. Negative feedback
c. Neither
POSITIVE FEEDBACK - An arms race is an example of positive feedback because when one side of the race builds more arms, the other side then builds more arms, which causes the first side to build even more arms, and so on. For example, in the Cold War, when the United States built more nuclear weapons, this prompted the Soviet Union to build more nuclear weapons, which prompted the United States to build even more nuclear weapons, and so on.
2. Exponential population growth is an example of:
a. Positive feedback
b. Negative feedback
c. Neither
POSITIVE FEEDBACK - Exponential population growth is an example of positive feedback. Exponential population growth occurs when each set of parents have more children than there are parents, and then these children grow up to become parents themselves. Thus, having more children causes there to be more parents, which in turn causes even more children, and so on.
3. Body temperature control is an example of:
a. Positive feedback
b. Negative feedback
c. Neither
NEGATIVE FEEDBACK - Body temperature control is an example of negative feedback because when body temperature goes too far in one direction, the control mechanisms push the temperature back in the other direction. For example, when our bodies get too hot, we start to sweat, which causes our bodies to cool. Or, when our bodies get too cold, we start to shiver, which causes our bodies to warm.
4. Population regulation is an example of:
a. Positive feedback
b. Negative feedback
c. Neither
NEGATIVE FEEDBACK - Population regulation is an example of negative feedback because when a population gets too high for the ecosystem in which it's living, the population declines. Specifically, when individuals in the population consume too much, then there are no longer enough resources to sustain the population, and the population declines.
Carrying Capacity
As the Self-check indicates, population change can involve either positive or negative feedback loops. When a population is growing exponentially, there is a positive feedback loop: more children bring more parents, which in turn bring even more children, and so on:
The plusses here signify that each set of parents brings more children, and each group of children brings more parents. If the birthrate is constant over time, and if each generation is larger than the previous, then there will be exponential population growth, as shown in Figure 2.10 in the Marten reading “What is Human Ecology?” But population can’t maintain exponential growth forever. To do so would require an infinite amount of resources, but we live in a finite world. Here’s where the negative feedback loop comes in. The resources provide sustenance to the population: food, water, energy, or whatever other resources are being used. As the population runs out of resources, it can’t have as many children – or, the children can’t grow up to become parents.
The + here signifies that more resources bring more individuals since individuals need resources to survive. The - here signifies that more individuals bring fewer resources since a larger population will consume more, leaving fewer resources available for anyone else. If a population continues to grow exponentially for long enough, eventually it will hit a point where there aren’t enough resources for it to continue growing. At this point, the population has reached the largest size that the resources permit. This size is called the carrying capacity.
It is important to understand that the carrying capacity refers to the largest population that can be sustained over the long-term. Carrying capacity is not constant and varies over time in response to changes in the environment. For example, disturbances from extreme natural events (e.g., volcanic eruptions) and human activities (e.g., pollution) can alter the environment to a great extent and consequently influence carrying capacity.
A population can temporarily exceed the carrying capacity. For example, imagine a population of rabbits that lives off of carrots. The rabbits have to leave enough carrots in the ground each year so that they will have enough carrots to eat the following year. The carrying capacity is thus the largest number of rabbits that can live one year while still leaving enough carrots left over for the same number of rabbits to live the following year. The rabbits could exceed the carrying capacity one year, but then there wouldn’t be enough carrots the following year. To exceed the carrying capacity is called overshoot, as seen in Figure 2.11 of the Marten reading “What is human ecology?” Overshoot is followed by a major decline in population.
Reading Assignment: The St. Matthew Island Reindeers
A vivid example of population overshoot is found in the story of the reindeer that briefly lived on St. Matthew Island off the coast of Alaska. Please read the story in the following two articles by Ned Rozell:
St. Matthew Island -- Overshoot and Collapse, Resilience, November 22, 2003.
What wiped out St. Matthew Island's reindeer?, Anchorage Daily News, Published January 16, 2010; Updated December 29, 2017
As you read this, consider the following questions. When and why did the population crash occur? How could it have been prevented? Is the human population destined for the same fate? Why or why not?
Here's a graph showing the reindeer’s exponential population growth and dramatic decline. As you examine the graph, consider how the graph relates to the story and to the concept of feedback mechanisms within a system.
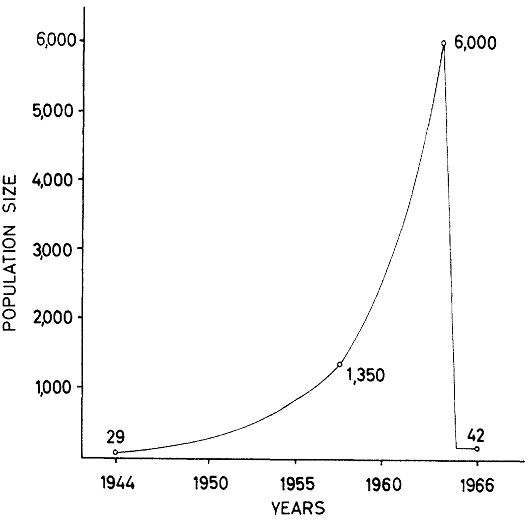
Figure 2.5 Assumed population growth of St. Matthew Island reindeer herd. Actual counts are indicated in the population curve
Source: Klein, David R. (1968). The Introduction, Increase, and Crash of Reindeer on St. Matthew Island. The Journal of Wildlife Management:32 (2): 350-367 Wildlife Society
The full article is available via Penn State e-journals, in case you're interested in reading it.
Carrying Capacity and Sustainability
Carrying capacity is closely related to sustainability. Sustainability is, in the simplest terms, the ability for something to be maintained into the future. If that something is a population, then for it to be sustained, it cannot exceed the carrying capacity of the system it’s living in. This is just a brief introduction to the idea of sustainability. There is a lot more to it. We’ll cover sustainability in more detail in the ethics module.
A key question in GEOG 030N – perhaps the key question – is whether today’s human population is sustainable. You might try to answer this question by comparing the human population to Earth’s carrying capacity for humans. But this is not an easy answer to provide! One reason is that the global human-environment system is very complex. Another reason is that human activity is changing the carrying capacity, in both positive and negative ways. In fact, it is important to consider whether the carrying capacity concept (which was developed to model non-human populations) can actually be applied to humans. Our behavior and consumption habits do not follow the same rules and patterns that we see in non-human populations. Many of the new technologies that we develop enable us to support larger populations, thereby increasing the carrying capacity. Some things we do such as unchecked timber harvesting deteriorate our resource base, lowering the carrying capacity. We also have economies, social and cultural customs, and government regulations that can influence and change resource use in both positive and negative ways. Given all this, no one is sure just how many people can be sustained on Earth over the long term. But we can get some important insights by studying human-environment systems, as we do in this course.
Resilience and Stability
Resilience and Stability
On the previous page, we saw that the idea of carrying capacity is closely related to the idea of sustainability. Here we’re going to explore another closely related idea: resilience. Resilience is a property of systems related to how a system responds to a disturbance or stressor. In rough terms, the more resilient a system is, the larger a disturbance it can handle.
To understand resilience with more precision, we need to first understand the concept of a system state. A system’s state is the general configuration that it is in. For example, if we think of a glass jar as being a system, then smashing the jar into little pieces would be a change to the system’s state. Or, if we think of a farm as being a system, then neglecting the farm for so long that it grows into a forest would be a change to the system’s state.
What qualifies as a state change depends on how we define the system. There are often many ways of defining a system, so there will also be many ways of defining its states and changes to them. We should have the mental flexibility to imagine systems and states being defined in different ways so that we can define them in ways that are helpful for our purposes, and so that we can understand how other people are defining them.
Given this understanding of system state, we can now define resilience with more precision.
Resilience is the ability of a system to maintain certain functions, processes, or populations after experiencing a disturbance.
Let's continue with the jar metaphor, and imagine that the jar is a system for holding sand. The system components would then be the glass jar, the lid, and the sand and air inside the jar. If our glass jar system is thrown at a wall with enough force, it will smash into little pieces and no longer be able to perform its principal function of holding sand (or anything, for that matter). But what if the force of impact was only strong enough to crack the jar without breaking it apart? In this case, one of the system components - the jar - is changed, but the system can continue to hold sand, and thus its system state remains essentially the same. The jar system's resilience, then, is the size of the impact it can withstand without smashing to pieces. Remember that disturbances always change systems in some way (otherwise we wouldn't call them disturbances). The more a system is able to maintain its functions and components after a disturbance, the greater its resilience to that disturbance.
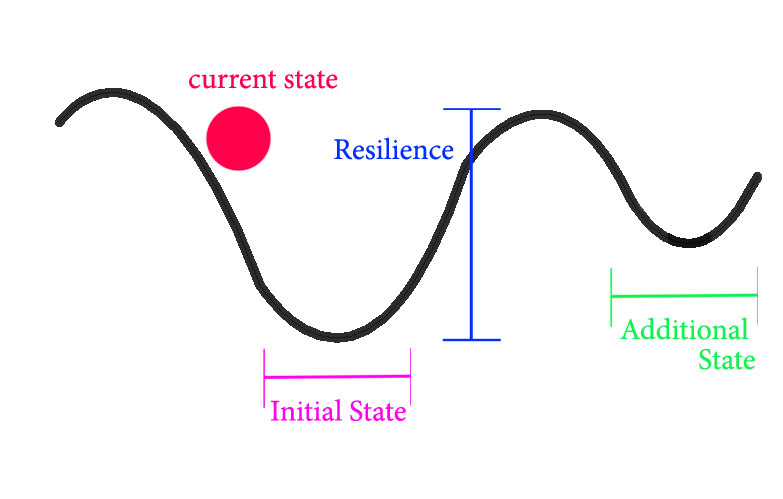
With simple systems like the glass jar filled with sand, resilience can be (and often is) represented using the metaphor of a ball in a basin. If the ball is pushed a little bit, it will return to the bottom of the basin, i.e., to its initial state. If the ball is pushed hard enough, it will leave the basin and eventually settle somewhere else, i.e., in an additional state. The height of the basin thus corresponds with resilience: the higher the basin, the harder of a push the ball can withstand and still return to its initial state. Of course, this metaphor becomes less helpful with more complex systems that have many constituents, processes, and functions. In reality, most systems are only relatively resilient to most disturbances. Most complex systems are able to maintain some, but not all, components, processes, and functions after any given disturbance (as long as it is not catastrophic). In other words, resilience in real-world systems is usually relative to the type of disturbance and specific constituents, processes, and functions.
Is Resilience Good?
Resilience is often viewed as a good thing. If an ecosystem is resilient, or if human society is resilient, then they will be quite capable of withstanding the disturbances that they face. For any system to sustain any particular state, then the system cannot experience any disturbances that exceed its resilience for that state. Thus resilience, like carrying capacity, is closely related to sustainability. This is why we see efforts to enhance resilience from groups like the Resilience Alliance. They would like for our human-environment systems to be sustained.
But whether or not resilience actually is good is an ethical question, and the answer is not automatically yes. We’ll discuss ethics further in Module 3, but for now, consider this. An exploitative agricultural production system, such as one that sources labor from human-trafficking network, might be resilient if it can withstand efforts to dismantle it. In these two cases, resilience is certainly not a good thing. So, while resilience is certainly an important concept and may often be considered a good thing, we should not blindly assume that it always is.
Stability
An important concept related to resilience is stability. Stability refers to the disturbances a system faces. If there are few disturbances or small disturbances, then the system is relatively stable. If there are many disturbances or large disturbances, then the system is relatively unstable.
Stability is a very important concept in agriculture. We would very much like it if our farms would yield (produce) about the same amount of food each year because in general, we eat about the same amount of food each year. If there is an unusually large food yield one year, this can cause complications but is typically not a huge problem. However, if there is an unusually small food yield one year, then this can be a huge problem. A famine can ensue, and people can die. In the food and agriculture module, we’ll examine yield stability in more detail. There, we’ll consider the Irish Potato Famine, which occurred in the mid-1800s. This was a case of extreme instability in food yield, which had disastrous consequences.
One might think that a resilient system would be one with more stability. However, this is not always the case. Sometimes, some instability can help increase resilience. This occurs when the disturbances increase the system’s ability to respond to further disturbances. For example, think of our bodies as systems. If we don’t exercise a lot, then we can’t do much exercise before we collapse. However, as we get more exercise, then there is an increase in our ability to withstand further exercise without collapsing. Here, the exercise is a disturbance, and collapsing is sending our bodies into a different state. As we exercise more, our bodies get less stability but more resilience. This often happens with other systems, too.
Population, Affluence, and Technology
Population, Affluence, and Technology
Now that we’ve covered resilience, let’s return to the question of humans and carrying capacity. There is no doubt that human impacts on our environments are often very strong – frequently strong enough to exceed the systems’ resilience. Here, we’re going to explore the relationship between human population, resource consumption, and the impact on ecosystems.
The IPAT Equation: I = P x A x T
A classic attempt to explain the relationship between a human population and its impact on the environment is the IPAT equation. The equation maintains that impacts on ecosystems (I) are the product of the population size (P), affluence (A), and technology (T) of the human population in question. This equation was developed by biologist Paul Ehrlich and environmental scientist John Holdren in 1971, and you might notice that the concept is very similar to the notion of carrying capacity presented earlier in this module. It is elegant in its simplicity, and compelling because it presents such an intuitive narrative. But intuitive narratives are not always the best explanation for complex problems. Remember the caution about carrying capacity: does it really apply to human populations?
Reading Assignment: "Too Many People, Too Much Consumption"
To gain a more detailed understanding of the arguments supporting the IPAT equation, please read the article:
"Too Many People, Too Much Consumption” by Paul and Anne Ehrlich.
The Ehrlichs are among those who initially developed the equation and remain strong supporters of it.
As you read this, consider what the equation means for human impact on the environment.
- Which areas of the world will have the largest impact?
- Also, note that the equation has been controversial. What parts of it – including how it is being used – do you agree or disagree with? Why?
Ehrlich and other IPAT supporters might attempt to explain the geographic distribution of the PAT side of the equation by looking at a map of GDP (gross domestic product) density:
The map shows where economic activity is concentrated. This might be a reasonable approximation for population times affluence, though it does not factor in technology. GDP is an important statistic, but it is important to remember that it is a measure of gross economic production and not a measure of national wellbeing. One can have a high GDP and still not be well-off, for example, if the population is overworked and/or underpaid, or if the environment suffers excessively. High GDP could also mean more sustainable consumption, energy-saving and recycling technologies, and better environmental regulations. Finally, note that this is a (rough) map of some of the potential drivers of environmental impacts. It is not a map of the impacts themselves. While the environmental impacts may be driven by human activities in these regions, the impacts often occur in different places, due to the globalized nature of both human and environmental systems. For example, economic activity in one place can cause the extraction of resources in other places, or cause pollution which spread to other places.
Different Perspectives on IPAT
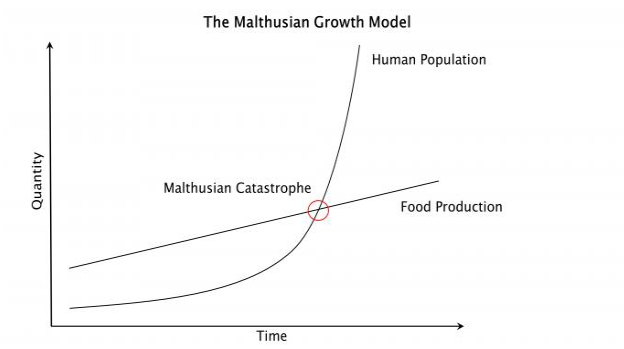
The IPAT equation and other environmental explanations based on population and resource scarcity became very popular in the 1970's with the birth of the modern environmental movement, and they have often dominated environmental activism and regulation since that time. But the ideas are actually much older than Paul Ehrlich. These arguments originated in late 18th Century England with the work of cleric and scholar Thomas Robert Malthus. In his 1798 book An Essay on the Principle of Population, Malthus argued that human population growth is exponential while natural resources (particularly food) are fixed, and their availability can only grow linearly. Thus, he argued that unless the human population was regulated in some way, the population would surpass resource availability, leading to famine, disease, and population collapse (a moment dubbed the 'Malthusian catastrophe.' see figure 2.8 below).
Straightforward though this may seem, Malthus placed most of the blame for human population problems squarely on the shoulders of the poor and people from less developed nations, finding fault with their ignorance and lack of moral discipline. You may think that this is a rather ugly position to take, and you are not alone. Malthusian arguments had lost prominence until the middle of the 20th Century when a new group of scholars took up the mantel of unchecked population and resource scarcity. These thinkers are known as neomalthusians because their theories are an update to the work of Malthus. The main difference in neomalthusian explanations is the acknowledgment that affluence and technology influence consumption and resource supply problems (and thus environmental impact) as well as total population. In other words, richer nations are also part of the problem - hence the IPAT equation. However, the basic premise still hinges on the notion of overpopulation and resource scarcity. Paul Ehrlich is perhaps the best known and most vocal of the neomalthusian thinkers, and his work and activism have contributed to the dominant position that neomalthusian arguments have in environmental and sustainability circles.
As mentioned earlier, these arguments are compelling, and in absolute terms they are correct. The Earth cannot support an infinite number of humans consuming an infinite number of resources. But neomalthusian arguments are based on a number of assumptions that might be problematic. First, they assume that human population growth is generally exponential. As we will discuss later on, this has not always been, nor is it now, true. Secondly, neomalthusians assume that natural resources are essentially fixed, which is why supply will eventually not keep up with demand. The truth, as you surely know, is much more complicated than that. Technology has played a crucial role in expanding resource availability in ways that may not be adequately considered in IPAT. Lastly, the neomalthusian argument assumes that growing affluence necessarily increases consumption and environmental impact. This is certainly true in some cases, like meat consumption, but not so in others, like renewable energy. Ehrlich and his neomalthusian colleagues have many critics, and we will now read a few of their arguments. As you read these articles, keep in mind our overarching question, does the carrying capacity concept really apply to human populations?
Reading Assignment: part of "The Doomslayer"
Please read part of the article:
"The Doomslayer" by Ed Regis, which was published in Wired Magazine
Read the text beginning “Still, that was a mere flash in the pan…” and stop at the paragraph beginning “A more perfect resolution of the Ehrlich-Simon debate could not be imagined…”
Consider the following. What are Simon’s views on the IPAT equation and how do they compare to Ehrlich’s?
Simon is essentially arguing that throughout history technological advances have made it so that natural resource and food production have more than kept up with population growth and demand. He also suggests that human impact on the environment is not as negative as some have claimed. These are important aspects of the IPAT equation: if more population, affluence, and technology do not bring resource scarcity and greater environmental impact, then the equation does not hold. Simon won his bet with Ehrlich (as described in the Wired Magazine reading), so there must be some substance to Simon’s ideas. He was certainly correct that in virtually all cases, natural resources and commodities like food are more plentiful now than in the past, and supply has certainly kept up with demand. What Simon does not mention, and what Ehrlich and his colleagues failed to realize, is that commodity prices are not merely a reflection of overall supply or scarcity. Consider the price of oil. Oil prices in 2016 reached record lows even though oil is absolutely a finite resource. Much of this is due to hydraulic fracturing technologies, which have temporarily increased supply, but at a potentially great environmental price. Thus, when looking at these debates, it is important for us to be able to analyze the evidence and the arguments for ourselves, so that we can avoid making the same mistakes as others may be making.
Reading Assignment: part of "What Are You Optimistic About? Why?"
Please read the following article by Ray Kurzweil:
What Are You Optimistic About? Why? by Ray Kurzweil.
Consider what Kurzweil’s views on the IPAT equation might be, and how they compare to Ehrlich’s and Simon’s.
Kurzweil is a famous inventor and futurist. He argues that future technologies will be able to address our environmental concerns. This type of solution to environmental problems is called a technofix, and it raises an important point about the “T” in the IPAT equation. While some technology certainly does increase environmental impact, other technology decreases it. For example, coal power technology generally increases our greenhouse gas emissions, whereas solar power technology generally decreases emissions. To be more specific, some coal technology can decrease emissions, if it produces energy from coal more efficiently than other coal technology. Also, coal technology can reduce other environmental impacts, such as deforestation, if coal is used for energy instead of wood or charcoal. So, technology impacts the environment in many ways – which is a good reason for us to maintain a systems perspective.
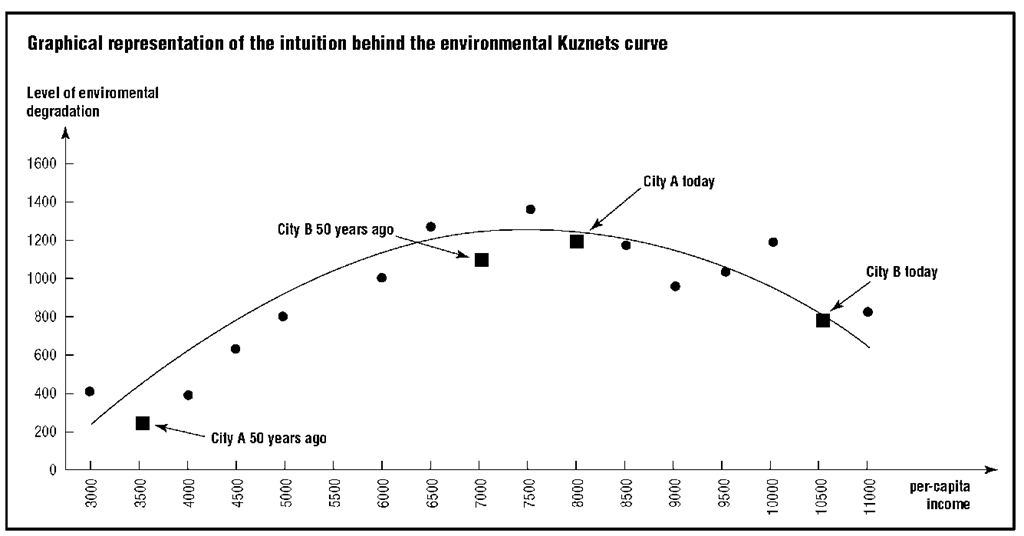
Kurzweil's fervent belief in technology also relates to the "A" (affluence) component of IPAT. Alternative energy technologies and most other technological research and development happens in the richest nations. And wealthy countries are almost always the first to adopt these new technologies. This links Kurzweil's viewpoint with another prominent counterpoint to IPAT and the neomalthusian approach: the Environmental Kuznets Curve (Figure 2.10). Both Kuznets and the neomalthusian models assert that consumption increases with affluence, but the Kuznets model argues that the environmental impact of that increased consumption eventually levels off and decreases as more affluent populations adopt more sustainable consumption habits and technologies.
The arguments of Kuznets and Kurzweil are supported by numerous examples from wealthier and technologically advanced nations and cities around the world. A geographic approach to human-environment issues raises an important challenge: are these affluent populations really decreasing their environmental impacts, or are they just moving the impacts someplace else? Consider the example of forest cover. The United States and many western European countries have experienced a significant expansion of forest cover over the last 50-100 years. Kurzweil or the Kuznets model might argue that this is because the populations have developed resource saving technologies or more responsible consumption habits. To a certain extent, this is probably true. But over the same period that the US and Europe watched their forests grow back, forests in the tropics, particularly in Brazil and Indonesia, experienced devastating losses. This is partly because richer nations began sourcing some of their food and timber products from other places rather than producing them at home. The web of resource use is complex and difficult to unravel. One of the goals of this course is to give you the tools to think critically and geographically about human-environment interactions.
Kurzweil is arguing that technology can and will be developed so as to resolve some of our major environmental concerns. Is this true? Right now, it is very difficult to say. Technology is notoriously difficult to predict. While there probably will be at least some technological advances that decrease our environmental impact, we simply don’t know how successful this will be.
Reading Assignment: "Taking Population Out of the Equation"
Please read the article:
"Taking Population Out of the Equation" by H. Patricia Hynes, published by the Committee on Women, Population, and the Environment.
Consider what Hynes’s views on the IPAT equation are, and how they compare to the others we have seen.
Hynes is arguing that the IPAT equation has inappropriately focused attention on the world’s poor as causes of environmental problems. Hynes emphasizes a distinction between the environmental impacts of consumption that is necessary for survival and of consumption that is a luxury. Perhaps we should be more critical of luxury consumption. But what is luxury consumption, anyway? Hynes suggests things like golf courses and speedboats, but there is a big difference between necessary consumption and speedboats. The truth is that even average consumption in the US consumes vastly more resources than in even relatively well-off countries. You can calculate your ecological footprint , and you might be surprised what you find. In most cases, the American lifestyle would only be sustainable for a global population that is about 1/4 the current total. So is "P" or "A" the main problem? You be the judge. Hynes also emphasizes the environmental impacts of military activity. It is true that the military has a large environmental impact. For example, the United States military consumes more energy than any other organization in the world.
Finally, Hynes emphasizes the gender issues surrounding population, such as the ability of women to choose when to become pregnant. An alternative model to malthusian population growth is the demographic transition model (figure 2.11). The transition model argues that as populations become more industrialized, more educated, and more affluent, fertility and death rates decline significantly. In the long-term, this leads to a stabilization and eventual decrease in total population. As Hynes would point out, the developments that lead to the demographic transition usually usher in more rights for women, including access to effective family planning. We've seen this transition in many of the world's countries, and fertility rates have been in decline in virtually all areas of the world. You can explore the rates by country. Notice that in many countries, the fertility rate is around 2.5, and in most industrialized countries like the US, it is well below 2. Many demographers consider a fertility rate of 2.5 to be stable since not all children will survive to reproduce. Rates of 2.5 or less are considered a long-run contraction of a population. This is yet another reason why it is so difficult to apply the carrying capacity concept to humans.
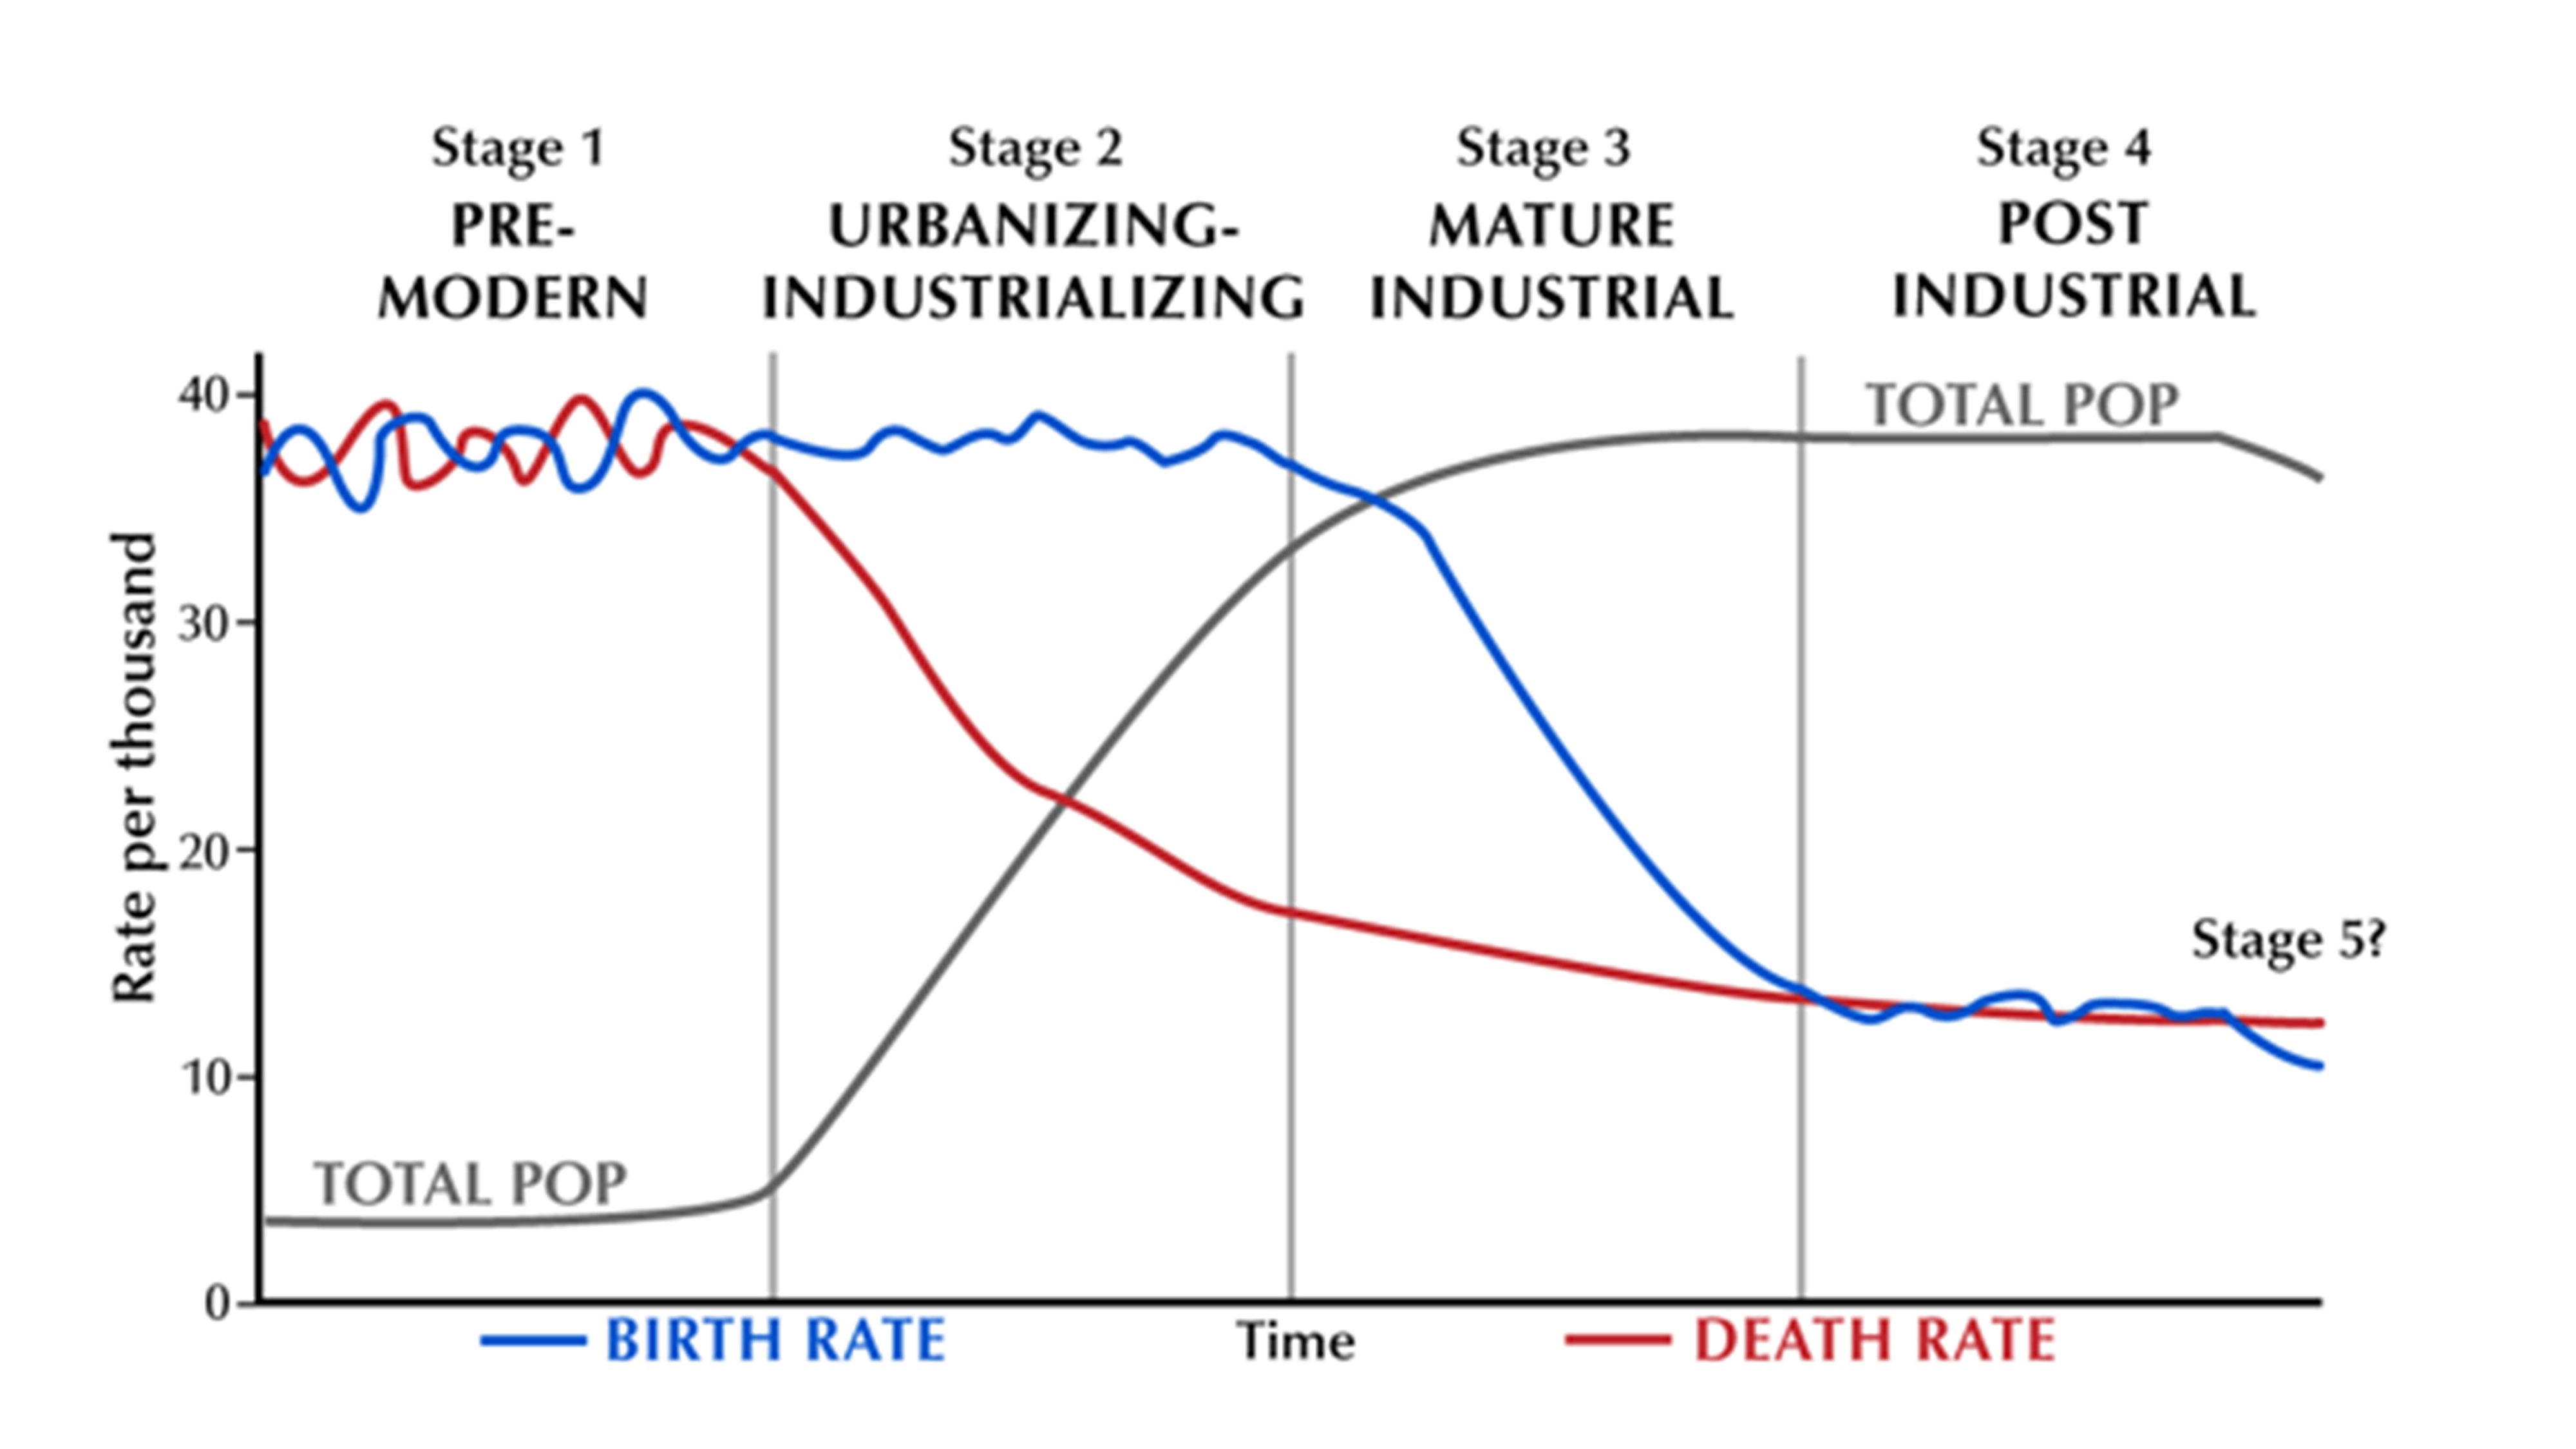
Graph of birth and death rate per thousand over time through four stages. The four stages from longest time ago till now are: stage 1 – premodern, stage 2 – urbanizing/industrializing, stage 3- mature industrial, stage 4 – post-industrial.
Total population begins is steady through stage 1 increasing drastically till stage three where it stays steady till the end of stage four where is starts to drop slightly.
Birth rate is fluctuating between 36 and 40 births per thousand during stage 1, steading out to ~38 births per month in stage 2 then dropping steadily in stage 3 till it steadies out ~12 births per thousand in stage 4. At the very end of stage 4 it starts to drop slightly.
Death rate is fluctuating between 36 and 40 deaths per thousand during stage 1, declining roughly during stage 2 to ~15 deaths per thousand, then declining less rapidly in stage 3 to ~12 deaths per thousand in stage 4.
The Takeaway
As you have now read, there are many different viewpoints on the impact of humans on their environments. Malthus and his modern proponents like Ehrlich have made many dire predictions, none of which have come true. Does that mean that human population has nothing to do with human impacts on the environment? Of course not. What it does mean is that population is far from the whole story and that technology and human adaptation are also incredibly important. The Demographic Transition model suggests that the global population will eventually stabilize, or even contract. Does that mean that economic development and equal rights are the checks to population growth that Malthus called for? Perhaps. One thing we can say for sure is that these issues are far too complex for any one theory or approach to be completely correct. Keep your critical eyes open as we continue through the course!
Summary
Summary
This module was designed to introduce you to systems analysis as applied to coupled human-environment systems. A system is a collection of components that interact with each other to form some aggregated whole. A coupled human-environment system is a system in which there are both human components and environmental components which interact with each other, i.e., are coupled to each other. Here, humanity affects the environment and the environment also affects humanity. For example, landscapes are systems in which human activity interacts with the natural environment to produce specific patterns on Earth's surface.
Interactions in human-environment systems often occur in a variety of often complex ways. The complexity can often be well represented in a system diagram, which displays system components and their interactions. Systems often contain positive and negative feedback loops, such as in exponential population growth (positive) or in the population regulation that occurs when a population exceeds its ecosystem's carrying capacity (negative). A population that exceeds the carrying capacity is unsustainable, as is a system that receives a disturbance that exceeds its resilience. Disturbances (or impacts) of human activity on the environment is often conceptualized as the product of population, affluence, and technology, but many scholars have questioned this conceptualization.
References
Sources for this module include:
Adams, W.M. 2001. Green Development: Environment and Sustainability in the Third World. London: Routledge (Second edition).
Beck, U. 1992. Risk Society: Towards a new Modernity. Sage: London.