Chapter 1: Location is Where It’s At: Introduction to GIScience and Technology
Overview
Have you ever found driving directions and maps online, used a smartphone to ‘check in’ to your favorite restaurant, or entered a town name or ZIP code to retrieve the local weather forecast?
Every time you and millions of other users perform these tasks, you are making use of Geographic Information Science (GIScience) and related spatial technologies. Many of these technologies, such as Global Positioning Systems (GPS) and in-vehicle navigation units, are very well known, and you can probably recall the last time you’ve used them.
Other applications and services that are the products of GIScience are a little less obvious, but they are every bit as ubiquitous. In fact, if you’re connected to the Internet, you’re making use of geospatial technologies right now. Every time your browser requests a webpage from a Content Delivery Network (CDN), a geographic lookup occurs, and the server you’re connected to contacts other servers that are closest to it and retrieves the information. This happens so that the delay between your request to view the data and the data being sent to you is as short as possible.
Simply put, GIScience and the related technologies are everywhere, and we use them every day!
In this chapter, you will learn about how location-based data makes GIScience possible; ways geographical data are used; geographical information systems (GIS) that have been developed to collect, store, analyze, and disseminate geographical information; the ways in which GIScience knowledge can contribute to careers as diverse as urban planning, information science, or public health, and the kinds of careers followed by those within GIScience itself.
Objectives
The goal of Chapter 1 is to introduce the many kinds of geographical information that permeate our daily lives and to situate that information and its uses within the larger enterprise known as Geographic Information Science and Technology (GIS&T), what the U.S. Department of Labor calls the "geospatial industry." In particular, students who successfully complete Chapter 1 should be able to:
- identify geographic data and what makes location-based data special;
- explain the qualities of a map and what separates maps from other graphics;
- recognize the sources of geographic data;
- describe the kinds of questions that GIS can help answer.
Chapter lead author: Joshua Stevens.
Portions of this chapter were drawn directly from the following text:
Joshua Stevens, Jennifer M. Smith, and Raechel A. Bianchetti (2012), Mapping Our Changing World, Editors: Alan M. MacEachren and Donna J. Peuquet, University Park, PA: Department of Geography, The Pennsylvania State University.
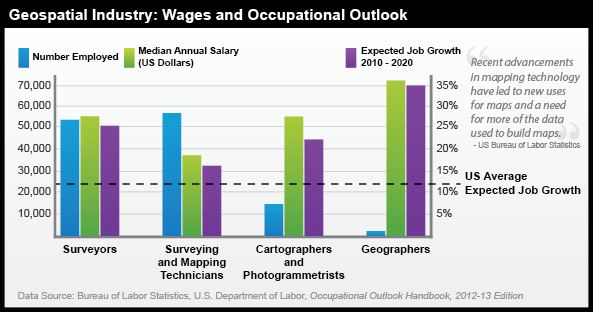
1.1 Geospatial Research, Careers, and Competencies
"A body of knowledge" is one way to think about the GIS&T field. Another way is as an industry made up of agencies and firms that produce and consume goods and services, generate sales and (sometimes) profits, and employ people. In 2003, the U.S. Department of Labor identified "geospatial technology" as one of 14 "high growth" technology industries, along with biotech, nanotech, and others. However, the Department of Labor also observed that the geospatial technology industry was ill-defined, and poorly understood by the public.
Subsequent efforts by the Department of Labor and other organizations helped to clarify the industry's nature and scope. Following a series of "roundtable" discussions involving industry thought leaders, the Geospatial Information Technology Association (GITA) and the Association of American Geographers (AAG) submitted the following "consensus" definition to the Department of Labor in 2006:
The geospatial industry acquires, integrates, manages, analyzes, maps, distributes, and uses geographic, temporal, and spatial information and knowledge. The industry includes basic and applied research, technology development, education, and applications to address the planning, decision-making, and operational needs of people and organizations of all types.
Currently, the Department of Labor recognizes 10 geospatial occupations: Surveyors, Surveying Technicians, Surveying and Mapping Technicians, Cartographers and Photogrammetrists, Geospatial Information Scientists and Technologists, Geographic Information Systems Technicians, Remote Sensing Scientists and Technologists, Remote Sensing Technicians, Precision Agriculture Technicians, and Geodetic Surveyors. Beyond these explicitly geospatial occupations, there are many others that rely heavily on geographical data and technology; these include urban and regional planning, many careers associated with location-based services, environmental management, landscape architecture and geo-design, transportation engineering, precision agriculture, and others. Still others use geographical data and technologies for selected tasks such as in public health (for infectious disease modeling and health care accessibility analysis), energy industries (to analyze distribution of oil and gas reserves or plan shipments), disaster management (to plan for and respond to events), and criminology (to identify crime hotspots and allocate patrols).
In addition to providing a wide array of occupational opportunities, the geospatial industry is considered a high growth industry. As of 2010, the US Employment and Training Administration is investing $260,000,000 through the WIRED (Workforce Innovation in Regional Economic Development) initiative to promote high-paying geospatial careers.
Although it is helpful to see how the Department of Labor and other agencies define the geospatial industry and how these occupations are expected to grow in the coming decade, many other careers and positions reliant on GIScience exist. Similar to how some geospatial technologies are well known while others operate behind the scenes, some careers in the geospatial industry might seem obvious to you, while others will be a surprise. Some of these careers and applications likely fall within a discipline or area you already find interesting.
Visit the links below to see examples of GIScience being used in fields you might not have considered.
If you like...Video Games and Entertainment,
EA Sports Uses NASA Topographic Data in SSX Game
Link: How NASA topography brought dose of reality to SSX snowboarding courses [4] (ArsTechnica)
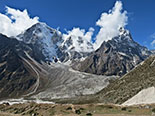
"He was like, 'Name any mountain on Earth,' and I was like, 'I don't know, Mount Everest.' So he goes on Wikipedia, gets the latitude and longitude coordinates... and in about 28 seconds, delivered a 3D model of Mount Everest and all the surrounding mountains in that grid from the data. He's like, 'If you give me a couple of days, we can take it for a ride...'"

If you like...Fisheries and Wildlife,
GIS and Remote Sensing are "Critical" to US Fish & Wildlife Service
Link: U.S. Fish & Wildlife Service: Information Resources and Technology Management [6] | Critical Habitat Portal [7]
“Geospatial services provide the technology to create, analyze, maintain, and distribute geospatial data and information. GIS, GPS and remote sensing play a vital role in all of the Service’s long-term goals and in analyzing and quantifying the USFWS Operational Plan Measures.”
1.2 Data and Information
Whether it is a single geographic position of a movie-goer checking in at her favorite restaurant or the locations of thousands of animals equipped with GPS transmitters in a wildlife refuge, every GIS project and application is driven by data.
Data, generally, can be considered to be “values” of “variables”; the variables are the kind of phenomenon or its attributes that are measured, and the values can be numerical (e.g., the population of a city) or categorical (e.g., whether a highway is an Interstate or a U.S. route). When used in a computer system, these data must be in a form suitable for storage and processing. Data can represent all types of information and may consist of numbers, text, images, and many other formats. If you have an online profile, it probably asked you to enter a name, email address, photo, or phone number. These categories are data variables, and what you enter are the data values.
People create and study data as a means to help understand how natural and social systems work. Such systems can be hard to study because they're made up of many interacting phenomena that are often difficult to observe directly, and because they tend to change over time. We attempt to make systems and phenomena easier to study by measuring their characteristics at certain times. Because it's not practical to measure everything, everywhere, at all times, we measure selectively. How accurately data reflect the phenomena they represent depends on how, when, where, and what aspects of the phenomena were measured. It is important to keep in mind that all measurements contain a certain amount of error; the types of error, along with the concepts of accuracy and precision, will be discussed later. For now, however, we will focus on the characteristics of data and how data relate to information.
When phenomena are measured, one or more variables are recorded. As we have mentioned, recorded variables might consist of numerical values, names, or even pictures. All of these are referred to as variables, since they are only representations of the phenomena and may consist of several different values of the same type. Once collected, the variables can be treated as-is or combined and recalculated to form additional representations of the phenomena.
Encoding data in a form that can be reproduced on a computer facilitates storing these data components, sharing them with others, and adding them to structured collections, known as databases. Regardless of the type of data, computers follow instructions to convert data into various formats that are ultimately represented in binary form by series of ones and zeros, or bytes. Although the conversion of digital data to binary representations is beyond the scope of this course, it is important to remember one simple fact: if we can instruct computers to store digital data in this way, we can alter these instructions to make changes to the data. The ability to manipulate, combine, and process data is what allows us to turn a collection of measurements into information that can be used to answer specific questions.
Information is data that has been selected or created in response to a question. For example, the location of a building or a route is data, until it is needed to dispatch an ambulance in response to an emergency. When used to inform those who need to know "where is the emergency, and what's the fastest route between here and there?," the data are transformed into information. The transformation involves the ability to ask the right kind of question, and the ability to retrieve existing data--or to generate new data from the old--that help people answer the question. The more complex the question, and the more locations involved, the harder it becomes to produce timely information. As a result, advancements in both computer software and hardware devices that can collect, integrate, and process large volumes of data quickly have become critical assets in the geospatial industry.
Geographic data and the information derived from it have become valuable commodities. Interestingly, in contrast to a commodity such as corn, the potential value of data is not lost when they are used. Data can be transformed into information again and again, provided that the data are kept up to date. Given the rapidly increasing accessibility of computers and communications networks in the U.S. and abroad, it is not surprising that data and information have become commodities, and that the ability to produce both has become a major growth industry.
When it comes to information, “spatial is special.” Reliance on spatial attributes is what separates geographic information from other types of information. Goodchild (1992) points out several distinguishing properties of geographic information. These properties are paraphrased below. Understanding them, and their implications for the practice of geographic information science, is a key objective of this course.
- Geographic data represent spatial locations and non-spatial attributes measured at certain times.
- Geographic space is continuous.
- Geographic space is nearly spherical.
- Geographic data tend to be spatially dependent.
The next section will clarify some of these properties and prepare you to understand the others as you progress through the course.
Practice Quiz
Registered Penn State students should return now take the self-assessment quiz about the Data and Information.
You may take practice quizzes as many times as you wish. They are not scored and do not affect your grade in any way.
1.3 Location, Attributes, and the First Law of Geography
When we generate information about phenomena that occur on or near the Earth’s surface, we do so using geographic data. Geographic data are data that include a reference to location on the Earth together with some non-spatial attributes. To be useful, they also need to include an indication of when the data refer to. The location specification is a key difference from other types of information that might only have an ID number or other descriptors, like the example in Table 1.1. When locational data are added (Table 1.2), these locations alone may be used to access the data, or one may combine location and non-spatial attributes to access data more specifically, such as when asking, “Which emergency vehicles of the type ‘ambulance’ are within 40 miles of my current location?”
| ID | Type | Description |
|---|---|---|
| 42 | Patrol | Light-weight veh.. |
| 43 | Intercept | Performance crui.. |
| 44 | Ambulance | 2-axel diesel truc.. |
This is not geographic data. It does not have any locational data. Credit: Joshua Stevens, Department of Geography, The Pennsylvania State University.
The data in Table 1.1 above could not be used to answer the question posed. These data could only answer questions such as “which vehicle(s) is/are an ambulance?” (with an answer of ‘#44’) or “Are there any heavy-weight patrol cars in the fleet?” (with an answer of ‘no’). These data cannot answer any “where….?” question, because locations are not encoded.
By including coordinate information in the form of longitude and latitude, the data in Table 1.2 are geographic data. These spatial attributes can be used to identify the location of each item in the database, allowing us to ask questions of the type “where…?” and “how far…?”
| ID | Type | Description | Latitude | Longitude |
|---|---|---|---|---|
| 42 | Patrol | Light-weight veh.. | 40.776853 | -77.87650 |
| 43 | Intercept | Performance crui.. | 34.594421 | -80.301819 |
| 44 | Ambulance | 2-axel diesel truc.. | 34.612899 | -79.635086 |
These geographic data have spatial attributes that can be used to link each entity to a place in the real world. (Locational Data highlighted in table above.) Credit: Joshua Stevens, Department of Geography, The Pennsylvania State University.
Later chapters will cover coordinates in more detail. The key point is that spatial attributes tell us where things are, or where things were at the time the data were collected. By simply including spatial attributes, geographic data allow us to ask a plethora of geographic questions. For example, we might ask “are gas prices in PA high?” The interactive map from GasBuddy.com [8] can help us with such a question while enabling us to generate many other spatial inquiries related to the geographic variation in fuel prices. Section 1.6 of this chapter will provide several more examples of these questions and the types of geographic data that can be used to answer them.
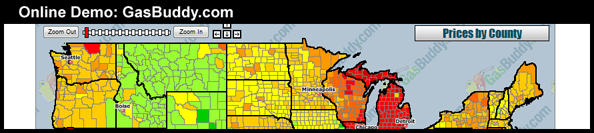 [8]
[8]
Another important characteristic of geographic space is that it is "continuous.” Although the Earth has valleys, canyons, caves, etc., there are no places on Earth without a location, and connections exist from one place to another. Outside of science fiction, there are no tears in the fabric of space-time. Modern technology can measure location very precisely, making it possible to generate extremely detailed depictions of geographic feature location (e.g., of the coastline of the eastern U.S). It is often possible to measure so precisely that we collect more location data than we can store and much more than is actually useful for practical applications. How much information is useful to store or to display in a map will depend on the map scale (how much of the world we represent within a fixed display such as the size of your computer screen) as well as on the map’s purpose.
Geographic data are generalized according to scale. Click on the buttons beneath the map to zoom in and out on the town of Gorham. (source: U.S. Geological Survey [9], public domain [10]).
For example, the illustration above shows a town called Gorham (in Maine) depicted on three different maps produced by the United States Geological Survey. Take note of the changes that occur when you select different scales (click the buttons below the map to change scale). The shape of the town along with the number and type of features included on the map are different at each scale. The cartographer has made generalization decisions to make sure that the information depicted is legible at each scale and to meet expected uses of maps produced at that scale.
As the map scale becomes larger (when you “zoom in”), the features become larger and more detailed. Switching to smaller scales (“zooming out”) reduces the number of features and simplifies their shapes. This feature reduction and simplification is an example of an important data processing operation called map generalization. Map generalization is a process that involves selecting which features of the world to represent (given what is possible with available data, which also will be selective) and multiple choices about the visible detail included in those representations. In the Gorham example, at the largest scale (1:24,000), all built structures in Gorham are depicted, while at 1:62,000, the built-up area is depicted abstractly as a pink polygon and you (as the map reader) are left to infer that towns include buildings. At the smallest scale (1:250,000), in addition to there being even fewer features depicted, many of the linear features have been smoothed out (e.g., highway 25 on the 1:250,000 map appears to have a slight, gentle curve as it cuts through town while its depiction on the 1:24,000 scale map shows that it has a distinct jog as well as an intersection that will appear to a driver as a U-turn).
In addition to being continuous, geographic data also tend to be spatially dependent. More simply, "everything is related to everything else, but near things are more related than distant things" (which leads to an expectation that things that are near to one another tend to be more alike than things that are far apart). The quote is the First Law of Geography, attributed to geographer Waldo Tobler (1970) -- University of California Department of Geography [11]. How alike things are in relation to their proximity to other things can be measured by a statistical calculation known as spatial autocorrelation. Without this fundamental property, geographic information science as we know it today would not be possible.
1.4 Communicating Geographic Data: What is a Map?
The table in Figure 1.2 of the previous section demonstrates one way to communicate geographic information. We can list data as a series of rows and columns and indicate locations with very specific coordinates. Despite being complete and efficient representations of data, text written in columns and rows is not very user friendly or easy for human beings to interpret. A visual representation would be much better.
The use of graphics and imagery as forms of communication predates written language by several thousand years. It is no surprise then that humans began to visually depict geographic information and have been doing so for millennia. Although the first graphic depiction of geographic information is debated (it is easy to imagine ephemeral maps drawn with sticks in the sand of a beach long before paper or even cave paintings), one of the earliest surviving representations to include both an indication of scale and orientation is the town plan of Nippur, created circa 1330 BC (O'Grady and O'Grady 2008 [12]); for a photo of this plan, see: Archaeology.org: Maps Exhibit review [13].
Try This: How would you define a map?
What is a map...exactly?
While there is a consensus that maps are extremely effective forms of communication, there are numerous definitions of what maps actually are and these definitions vary considerably. To understand why that is, let’s perform a simple exercise. Take a look at the images in Figure 1.5 below and decide which, if any, of them are maps.
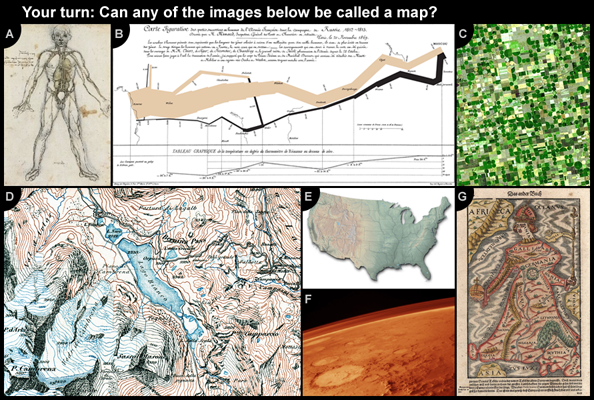
It might surprise you, but with the right definition, each of the images above could qualify as a map. All of them rely on the spatial arrangement of information to communicate, and it is the spatial relationships between the elements in each image that provides meaning. Although they are not all geographic, the maps above introduce the idea of abstraction, or the process of representing phenomena or ideas with a simplified counterpart.
The idea of a map, with which you might be most familiar, is also an abstraction. Geographic maps are abstractions of the world we live in and phenomena on, within, or above its surface. As abstractions, maps allow features in the real world to be represented in paper, digital media, and databases, allowing us to calculate, present, and better understand the relationships that objects in the real world have with one another. In this course, you will learn about two primary types of maps: reference maps and thematic maps, defined more completely in Chapter 3.
As can be seen above, and in dictionary definitions, the term “map” is used well beyond geographic representations (e.g., Merriam-Webster definition [14]). Even when a geographic context is assumed, definitions include a wide range of representation forms. The International Cartographic Association has developed the following definition of geographic maps: “A map is a symbolised image of geographical reality, representing selected features or characteristics, resulting from the creative effort of its author’s execution of choices, and is designed for use when spatial relationships are of primary relevance.” This definition still allows tremendous variety. The definition is intentionally broad to include, for example, tactile maps for the visually impaired as shown below in Figure 1.4.
Practice Quiz
Registered Penn State students should return now take the self-assessment quiz About Maps.
You may take practice quizzes as many times as you wish. They are not scored and do not affect your grade in any way.
1.5 Sources of Geographic Data
Geographic data come in many types, from many different sources and captured using many techniques; they are collected, sold, and distributed by a wide array of public and private entities.
In general, we can divide the collection of geographic data into two main types:
- Directly collected data
- Remotely sensed data
Directly collected data are generated at the source of the phenomena being measured. Examples of directly collected data include measurements such as temperature readings at specific weather stations, elevations recorded by visiting the location of interest, or the position of a grizzly bear equipped with a GPS-enabled collar. Also included here are data derived through survey (e.g., the census) or observation (e.g., Audubon Christmas bird count).
Remotely sensed data are measured from remote distances without any direct contact with the phenomena or a need to visit the locations of interest (although directly collected “ground truth” data are often used to support accurate interpretation of the remotely sensed data; this is a topic we will pick up in Chapter 8). Satellite images, sonar readings, and radar are all forms of remotely sensed data.
For each type of data, there is a range of important issues about collection and processing that have an impact on how reliable and useful the data are. The federal agencies that collect and distribute geographic data and the standards by which they operate will be covered in Chapter 8.
1.6 Examples of Geographic Questions and Answers
So far, we have learned why geographic data are unique, how information differs from data, and how various forms of geographic information can be represented in computers and communicated to human beings. Let us now consider the types of questions we can ask, now that we are equipped with this knowledge.
The simplest geographic questions pertain to individual entities
Such questions include:
Questions about space
- Where is the entity located?
- What is its extent?
Questions about attributes
- What are the attributes of the entity located there?
- Do its attributes match one or more criteria?
Questions about time
- When were the entity's location, extent, or attributes measured?
- Has the entity's location, extent, or attributes changed over time?
Simple questions like these can be answered effectively with a good printed map, of course. However, GIS becomes increasingly attractive as the number of people asking the questions and the required level of precision grows, especially if they lack access to the required paper maps.
Questions concerning multiple geographic entities
- Do the entities contain one another?
- Do they overlap?
- Are they connected?
- Are they situated within a certain distance of one another?
- What is the best route from one entity to the others?
- Where are entities with similar attributes located?
Questions about attribute relationships
- Do the entities share attributes that match one or more criteria?
- Are the attributes of one entity influenced by changes in another entity?
Questions about temporal relationships
- Have the entities' locations, extents, or attributes changed over time?
Notice that all of these questions deal with where things are, how things relate to other things, and how things change or persist relative to these locations. These are the kinds of questions that GIScience and professionals in the geospatial industry are prepared to answer.
Practice Quiz
Registered Penn State students should return now take the self-assessment quiz about Geographic Questions and Properties.
You may take practice quizzes as many times as you wish. They are not scored and do not affect your grade in any way.
1.7 Glossary
Abstraction: A simplified representation of an idea, phenomenon, or concept.
Attribute: Data about geographic features are often found in geographic databases and are typically represented in the columns of the database. The spatial dimension is stored as an attribute of geographic data.
Data: Measured values of stored variables that reflect phenomena or characteristics about phenomena.
Directly Measured Data: Data that are measured at the physical location of the phenomena of interest.
Tobler's First Law of Geography: “All things are related, but near things are more alike than distant things.”
Generalization: The product or process of simplifying data or geographic representations.
Geographic Data: Recorded to represent spatial locations, that is a reference to a location on the Earth; often have associated attributes that are variables of locations across dimensions.
Geographic Information Science (GIScience): The theory, use, and application of geographic information systems and databases to answer spatial questions.
Information: Data that has been selected or created to answer a specific question.
Map Scale: The proportional difference between a distance on a map and a corresponding distance on the ground (Dm / Dg).
Remotely Sensed Data: Data collected from a distance without visiting or physically interacting with the phenomena of interest.
Variable: A property of data, that is, a record of a kind of phenomena.
1.8 Bibliography
Carstensen, L. W. (1986). Regional land information systems development using relational databases and geographic information systems. Proceedings of the AutoCarto, London, 507-516.
City of Ontario, California. (n.d.). Geographic information web server. Retrieved on July 6, 1999, from https://www.ontarioca.gov/information-technology [17] (since retired).
Cowen, D. J. (1988). GIS versus CAD versus DBMS: What are the differences? Photogrammetric Engineering and Remote Sensing 54:11, 1551-1555.
DiBiase, D. and twelve others (2010). The New Geospatial Technology Competency Model: Bringing workforce needs into focus [18]. URISA Journal 22:2, 55-72.
DiBiase, D, M. DeMers, A. Johnson, K. Kemp, A. Luck, B. Plewe, and E. Wentz (2007). Introducing the First Edition of the GIS&T Body of Knowledge [19]. Cartography and Geographic Information Science, 34(2), pp. 113-120. U.S. National Report to the International Cartographic Association.
Ennis, M. R. (2008). Competency models: A review of the literature and the role of the employment and training administration (ETA). http://www.careeronestop.org/COMPETENCYMODEL/info_documents/OPDRLiteratureReview.pdf [20].
GITA and AAG (2006). Defining and communicating geospatial industry workforce demand: Phase I report.
Goodchild, M. (1992). Geographical information science. International Journal of Geographic Information Systems 6:1, 31-45.
Goodchild, M. (1995). GIS and geographic research. In J. Pickles (Ed.), Ground truth: the social implications of geographic information systems (pp. of chapter). New York: Guilford.
National Decision Systems. A zip code can make your company lots of money! Retrieved on July 6, 1999, from http://laguna.natdecsys.com/lifequiz [21] (since retired).
National Geodetic Survey. (1997). Image generated from 15'x15' geoid undulations covering the planet Earth. Retrieved 1999, from https://geodesy.noaa.gov/web/science_edu/presentations_archive/ [22] (since retired).
Nyerges, T. L. & Golledge, R. G. (n.d.) NCGIA core curriculum in GIS, National Center for Geographic Information and Analysis, University of California, Santa Barbara, Unit 007. Retrieved November 12, 1997, from http://www.ncgia.ucsb.edu/ [23] (since retired).
O'Grady, J. V. and K. V. O'Grady (2008). The Information Design Handbook. Cincinnati, HOW Books.
Tobler, W.R. 1970: A computer movie simulating urban growth in the Detroit region. Economic Geography 46, 234-240.
United States Department of the Interior Geological Survey. (1977). [map]. 1:24 000. 7.5 minute series. Washington, D.C.: USDI.
United States Geologic Survey. "Bellefonte, PA Quadrangle" (1971). [map]. 1:24 000. 7.5 minute series. Washington, D.C.:USGS.
University Consortium for Geographic Information Science. Retrieved April 26, 2006, from http://www.ucgis.org [24]
Wilson, J. D. (2001). Attention data providers: A billion-dollar application awaits. GEOWorld, February, 54.
Worboys, M. F. (1995). GIS: A computing perspective. London: Taylor and Francis.