Chapter 6: Can We Get There From Here? Applications of Topology, TIGER, and Geocoding
Overview
Chapters 1, 2, and 5 introduced the concepts of location specification, coordinate systems, and the methods used to determine positions anywhere on Earth. Together, these concepts provide the ability to easily acquire and organize vast amounts of spatial data. In Chapter 3, we saw how these data can be visualized in the form of thematic maps, with several examples that relied on or were enhanced by data from the US Census Bureau.
The US Census Bureau is well-known for collecting neighborhood statistics and social data. In addition to social and economic data, the Census is also responsible for another important product that underpins a wide array of geographical analysis and mapping: the Topologically Integrated Geographic Encoding and Referencing (TIGER) database. Developed in a partnership between the Geographic Division of the US Census Bureau and the US Geological Survey (USGS), TIGER data are fundamental components of some of the nation’s largest and most used databases for transportation and for the delineation of political boundaries, congressional districts and census tracts. In preparation for the 2010 census, the Bureau conducted a database redesign project that combined TIGER with a Master Address File (MAF) database. MAF/TIGER enables the Bureau to associate census data, which it collects by household address, with the right census areas and voting districts. This is an example of a process called address-matching that will be described in more detail in Sections 6.1 and 6.6.
By the end of this chapter, you will gain familiarity with TIGER data as well as the concepts of topology, geocoding, and map-based routing. You will also learn about the geographic entities on which these products and processes rely.
Objectives
Students who complete Chapter 6 should be able to
- explain how geometric primitives in MAF/TIGER are represented in TIGER/Line Shapefile extracts;
- define topology and explain why and how it is encoded in TIGER;
- understand what address geocoding is and how it works;
- describe how TIGER/Line files and similar products can be used for applications within transportation, routing, and business applications.
Table of Contents
- The MAF/TIGER Model
- Vector Extracts from MAF/TIGER
- TIGER Shapefiles
- Geometric Primitives
- Topology and Relationships Between Geometric Primitives
- Geocoding
- Geocoding Online
- Geocoding Your Customers
- Routing
- Delineating Service Areas
- TIGER, another TIGER, and the Future Going Forward
- Summary
- Glossary
- Biblography
6.1 The MAF/TIGER Model
The US Census Bureau performs many functions, including the collection of census data by mail and in the field, the production of maps and other data products, and generating various reports and documents. These products are then consumed by a wide array of users in the public and private sectors. MAF/TIGER is the geographic database system that houses the data necessary for the success of these operations.
6.1.1 Census by Mail
As the population of the U.S. increased, it became impractical to have census takers visit every household in person. Since 1970, the Census Bureau has mailed questionnaires to most households with instructions that completed forms should be returned by mail. An example of the 2010 surveys can be seen in Figure 6.1. The percentage of surveys that are successfully completed and returned may surprise you — about 72 percent of all questionnaires were returned in 2010. At that rate, the Census Bureau estimates that some $1.6 billion was saved by reducing the need for field workers to visit non-responding households.

To manage its mail delivery and return operations, the Census Bureau relies upon a Master Address File (MAF).
The process of linking these data is not as simple as it sounds. Postal addresses do not specify geographic locations precisely enough to fulfill the Census Bureau’s constitutional mandate. An address is not a position in a grid coordinate system--it is only one in a series of ill-defined positions along a route. The location of an address is often ambiguous because street names are not unique, numbering schemes are inconsistent, and because routes have two sides, left and right. Location matters, as you recall, because census data must be accurately georeferenced to be useful for reapportionment, redistricting, and allocation of federal funds. Thus, the Census Bureau had to find a way to assign address referenced data automatically to particular census blocks, block groups, tracts, voting districts, and so on with a minimum of error. That's what the "Geographic Encoding and Referencing" in the TIGER acronym refers to.
6.1.2 Maps for Census Field Workers
A second motivation that led to MAF/TIGER was the need to help census takers find their way around. Even with a success rate above 70%, the remaining households who fail to return census questionnaires number in the millions. Census takers (called “enumerators” at the Bureau) visit these non-responding households in person. Census enumerators need maps showing streets and select landmarks to help locate households. Census supervisors need maps to assign census takers to particular territories. In return, the notes collected by field workers are an important source of updates and corrections to the MAF/TIGER database.
Prior to 1990, the Bureau relied on local sources for its maps. For example, 137 maps of different scales, quality, and age were used to cover the 30-square-mile St. Louis area during the 1960 census. The need for maps of consistent scale and quality, as well as complete coverage, forced the Bureau to become a map maker as well as a map user. Using the MAF/TIGER system, Census Bureau geographers created over 17 million maps for a variety of purposes in preparation for the 2010 Census.
Data products, including maps and TIGER files, generated by the US Census can be explored at: US Census Maps and Data [1].
You can also hear more about how the Census Bureau's Geography Division uses MAF/TIGER and related tools to create maps for the 2010 Census in the following podcast: Directions Magazine Census1.mp3 [2]
6.2 Vector Extracts from MAF/TIGER
The Census Bureau began to develop a digital geographic database of 144 metropolitan areas in the 1960s. This earlier database enabled computer-based geocoding and map-based routing in those areas. By 1990, the early efforts had evolved into TIGER: a seamless digital geographic database that covered the whole of the United States and its territories.
TIGER/Line Shapefiles are digital map data products extracted from the MAF/TIGER database. They are freely available from the Census Bureau and are suitable for use by individuals, businesses, and other agencies that don’t have direct access to MAF/TIGER.
6.2.1 Geographies Represented in TIGER and Shapefile Extracts
The MAF/TIGER database is selective. Only those geographic entities needed to fulfill the Census Bureau’s operational mission are included. Entities that don't help the Census Bureau conduct its operations by mail or help field workers navigate a neighborhood are omitted. Terrain elevation data, for instance, are not included in MAF/TIGER. A comprehensive list of the "feature classes” and “superclasses” included in MAF/TIGER and Shapefiles can be found in Appendix F-1 of the 2009 TIGER/Line Shapefiles Technical Documentation [3]. Some examples are given in Table 6.1 below. Examples of superclasses include:
- potential living quarters (e.g., sites of shelters, retirement homes, prisons, dormitories);
- road/path features (e.g., primary roads, secondary roads, local neighborhood roads);
- hydrographic features (e.g., stream/river, lake/pond, ocean/sea);
- miscellaneous linear features (e.g., pipeline, powerline, fence line);
- tabulation areas (e.g., county or equivalent, tract, block group, block).
| MTFCC | Feature Class | Superclass | Point | Linear | Areal | Feature Class Description |
|---|---|---|---|---|---|---|
| K2459 | Runway/Taxiway | Transportation Terminal | Y | Y | Y | A fairly level and usually paved expanse used by airplanes for taking off and landing at an airport |
| K2460 | Helicopter Landing Pad | Transportation Terminal | Y | N | Y | A fairly level and usually paved expanse used by helicopters for taking off and landing. |
| K2540 | University or College | Other Workplace | Y | N | Y | A building or group of buildings used as an institution for post-secondary study, teaching, and learning.(including seminary) |
| K2543 | School or Academy | Other Workplace | Y | N | Y | A building or group of buildings used as an institution for preschool, elementary, or secondary study, teaching, and learning. (including elementary school and high school) |
Excerpt above from TIGER/Line Technical Documentation. Credit: Census Bureau 2009.
Note also that neither the MAF/TIGER database nor TIGER/Line Shapefiles include the population data collected through questionnaires and by census takers. MAF/TIGER merely provides the geographic framework within which address-referenced census data are tabulated.
6.3 TIGER Shapefiles
Esri, a leading geographic information systems software and service provider, developed the Shapefile format in the 1990s in order to have a native digital vector format for spatial data within the then-popular ArcView software (ArcInfo and ArcGIS are Esri’s present-day counterparts, which also rely on Shapefiles). Unlike many other common file formats, such as .jpeg, .png, .mp3 or .html, Shapefiles (.shp) are a special kind of file that is actually a package that contains several other files. Every valid Shapefile must contain at least three other files: the main.shp file containing the coordinate data, a .shx file that contains index information, and a .dbf file, which is the dBASE database table that stores all the attribute data for the particular shape.
For example, if we were interested in mapping county-wide statistics for the entire US, we might download a file called Counties.shp. Within Counties.shp we would expect to find:
- Counties.shp – this file contains coordinate information for drawing the shapes of the counties.
- Counties.shx – contains an index of all the information within the file, speeding up many computer operations that occur with the file
- Counties.dbf – the database of all the counties, including their names, unique IDs, and other statistical information of interest. DBF files are also a popular format for database software that does not include mapping capabilities. DBF files can also be read and saved by many spreadsheet applications, such as the open source LibreOffice suite and Open Office, and very old versions of Microsoft Excel.
Many Shapefiles also include an optional .prj file that indicates the appropriate projection to be used by the mapping software when drawing the Shapefile.
Although the Esri Shapefile format is proprietary and developed by a corporate entity, it is an open format and is supported by many open source GIS tools and mapping software. For this reason, the Shapefile format is now considered a de facto standard for spatial data. MAF/TIGER is distributed in the Shapefile format, and has been since 2007.
A single Shapefile data set can contain one of three types of spatial data primitives, or features – points, lines, or polygons (areas). These features and their counterparts in the MAF/TIGER database will be covered in the next section.
6.4 Geometric Primitives
Previous chapters have described the collection and storage of geospatial data in terms of coordinates and locations. Since a location is a zero-dimensional entity (it has no length, width, height, or volume), locations alone are not sufficient for representing the complexity of the real world. Locations are frequently composed into one or more geometric primitives, which include the set of entities more commonly referred to as:
- Points;
- Lines; and
- Polygons (or Areas).
The concepts of a point, line, and polygon (or area) have been discussed briefly in Chapter 4. In the context of the MAF/TIGER model, we will expand upon these terms and refer to them (in the same order) by the labels used in the field of Topology (discussed in more detail in section 6.5):
- Nodes;
- Edges; and
- Faces.
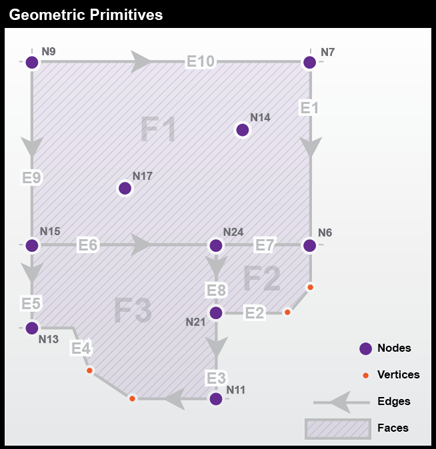
Nodes are zero-dimensional entities represented by coordinate pairs. Coordinates for nodes may be x,y values like those in Euclidean geometry or longitude and latitude coordinates that represent places on Earth’s surface. In both cases, a third z value is sometimes added to specify a location in three dimensions.
Edges are the one-dimensional entities created by connecting two nodes. The nodes at either end of an edge are called connecting nodes and can be referred to more specifically as a start node or end node, depending on the direction of the edge, which is indicated by arrowheads. Edges in TIGER have direction so that the left and right side of the street can be determined for use in address matching. Nodes that are not associated with an edge and exist by themselves are called isolated nodes. Edges can also contain vertices, which are optional intermediate points along an edge that can define the shape of an edge with more specificity than start and end nodes alone. Examples of edges encoded in TIGER are streets, railroads, pipelines, and rivers.
Faces are two-dimensional (length and width) entities that are bounded by edges. Blocks, counties, and voting districts are examples of faces. Since faces are bounded by edges and edges have direction, faces can be designated as right faces or left faces.
Figure 6.3 below shows an example of these geometric primitives in a realistic arrangement. In this example, note that:
- Nodes N17 and N14 are isolated nodes;
- N.D and N.D are the start and end nodes of edge E-M; and
- Due to the directionality of edges, face F'S is on the left of edge E-M.
6.4.1 Geometric Accuracy of TIGER Features
Until recently, the geometric accuracy of the vector features encoded in TIGER were notoriously poor (see illustration below in Figure 6.4). How poor? Through 2003, the TIGER/Line metadata [4] stated that:
Coordinates in the TIGER/Line files have six implied decimal places, but the positional accuracy of these coordinates is not as great as the six decimal places suggest. The positional accuracy varies with the source materials used, but generally the information is no better than the established National Map Accuracy standards for 1:100,000-scale maps from the U.S. Geological Survey (Census Bureau 2003)
NAS horizontal accuracy requires that at least 90 percent of points tested are within 0.02 inch of the true position. On a 1:100,000 map, 0.02 in = approximately 166 feet (about 50 meters).
Fortunately this lack of accuracy has been addressed during a project that began in preparation for the 2010 census. During this time, the Census Bureau commissioned a six-year, $200 million MAF/TIGER Accuracy Improvement Project (MTA). One objective of the effort was to use GPS to capture accurate geographic coordinates for every household in the MAF. Another objective was to improve the accuracy of TIGER's road/path features. The project aimed to adjust the geometry of street networks to align within 7.6 meters of street intersections observed in aerial images or measured using GPS. The corrected streets are necessary not just for mapping, but for accurate geocoding. Because streets often form the boundaries of census areas, it is essential that accurate household locations are associated with accurate street networks.
MTA integrated over 2,000 source files submitted by state, tribal, county, and local governments. Contractors used survey-grade GPS to evaluate the accuracy of a random sample of street centerline intersections of the integrated source files. The evaluation confirmed that most, but not all, features in the spatial database equal or exceed the 7.6 meter target.
MTA was completed in 2008. In conjunction with the continuous American Community Survey and other census operations, corrections and updates are now ongoing. TIGER/Line Shapefile updates are now released annually.
Practice Quiz
Registered Penn State students should return now take the self-assessment quiz about the Geometric Primitives.
You may take practice quizzes as many times as you wish. They are not scored and do not affect your grade in any way.
6.5 Topology and Relationships Between Geometric Primitives
Topology is the subfield of mathematics that deals with the relationship between geometric entities, specifically with properties of objects that are preserved under continuous deformation. As will be illustrated in this section, the concepts of topology are very useful for geographers, surveyors, transportation specialists, and others interested in how places and locations relate to one another.
In the previous section, you learned how coordinates, both geometric and geographic, can define points and nodes, how nodes can build edges, and how edges create faces. We will now consider how nodes, edges, and faces can relate to one another through the concepts of containment, connectedness, and adjacency. A fundamental property of all topological relations is that they are constant under continuous deformation: re-projecting a map will not alter topology, nor will any amount of rubber-sheeting or other data transformations change relations from one form to another.
Containment is the property that defines one entity as being within another. For example, if an isolated node (representing a household) is located inside a face (representing a congressional district) in the MAF/TIGER database, you can count on it remaining inside that face no matter how you transform the data. Topology is vitally important to the Census Bureau, whose constitutional mandate is to accurately associate population counts and characteristics with political districts and other geographic areas.
Connectedness refers to the property of two or more entities being connected. Recall the visual representation of the geometric primitives in Figure 6.3. Topologically, node N14 is not connected to any other nodes. Nodes N9 and N21 are connected because they are joined by edges E10, E1, and E10. In other words, nodes can be considered connected if and only if they are reachable through a set of nodes that are also connected; if a node is a destination, we must have a path to reach it.
Connectedness is not immediately as intuitive as it may seem. A famous problem related to topology is the Königsberg bridge puzzle (Figure 6.5).
Try This: Can you solve the Königsberg bridge problem?
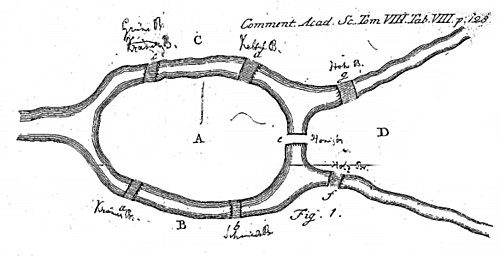
The challenge of the puzzle is to find a route that crosses all seven bridges, while respecting the following criteria:
- Each bridge must be crossed;
- A bridge is a directional edge and can only be crossed once (no backtracking);
- Bridges must be fully crossed in one attempt (you cannot turn around halfway, and then do the same on the other side to consider it “crossed”).
- Optional: You must start and end at the same location. (It has been said that this was a traditional requirement of the problem, though it turns out that it doesn’t actually matter – try it with and without this requirement to see if you can discover why.)
Take some time to see if you can figure out the solution. When you’ve found the answer or given up, scroll down the page to see the correct solution to the problem.
Did you find the route that crosses all seven bridges and meets the above criteria? If not, you got the right answer; there is no such route. Euler proved, in 1736, that there was no solution to this problem. In fact, his techniques paved the way for graph theory, an important area of mathematics and computer science that deals with graphs and connections. Graph theory is beyond the scope of this course, but it does have applications to geography. Interested readers can learn more about graph theory at Diestel Graph Theory [5].
The property of adjacency relates to entities being directly next to one another. In Figure 6.3, all of the faces are adjacent. This is easy to determine: if two faces share an edge, they are adjacent. Adjacency becomes less intuitive with other entities, however. See Figure 6.6 for an example of adjacency and why it cannot be simply assessed from a visual perspective:
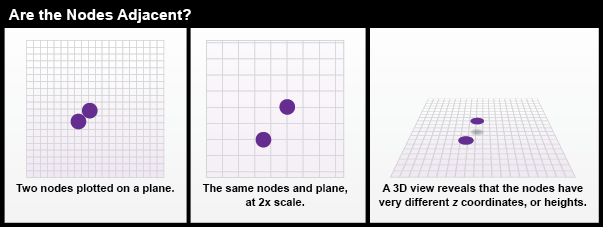
At first, the two nodes in Figure 6.6 might look like they are adjacent. Zooming in or tilting the plane of view reveals otherwise. This is because nodes, as points made from coordinate pairs, do not have a length or width; they are size-less and shapeless. Without any size or dimensionality, it is impossible for nodes to be adjacent. The only way for two nodes to ‘touch’ would be for them to have the exact same coordinates – which then means that there aren’t really two nodes, just one that has been duplicated.
This is exactly why features in the MAF/TIGER database are represented only once. As David Galdi (2005) explains in his white paper “Spatial Data Storage and Topology in the Redesigned MAF/TIGER System,” the “TI” in TIGER stands for “Topologically Integrated.” This means that the various features represented in the MAF/TIGER database—such as streets, waterways, boundaries, and landmarks (but not elevation!)—are not encoded on separate “layers.” Instead, features are made up of a small set of geometric primitives — including 0-dimensional nodes and vertices, 1-dimensional edges, and 2-dimensional faces —without redundancy. That means that where a waterway coincides with a boundary, for instance, MAF/TIGER represents them both with one set of edges, nodes and vertices. The attributes associated with the geometric primitives allow database operators to retrieve feature sets efficiently with simple spatial queries.
To accommodate this efficient design and eliminate the need for visual or mental exercises in order to determine topological states, the MAF/TIGER structure abides by very specific rules that define the relations of entities in the database (Galdi 2005):
- Every edge must be bounded by two nodes (start and end nodes).
- Every edge has a left and right face.
- Every face has a closed boundary consisting of an alternating sequence of nodes and edges.
- There is an alternating closed sequence of edges and faces around every node.
- Edges do not intersect each other, except at nodes (note, this is a specialized use of the term "intersect" that includes the concept of "cross", which edges do not do, and "meet" which they can do).
Compliance with these topological rules is an aspect of data quality called logical consistency. In addition, the boundaries of geographic areas that are related hierarchically — such as blocks, block groups, tracts, and counties (all defined in Chapter 3) — are represented with common, non-redundant edges. Features that do not conform to the topological rules can be identified automatically, and corrected by the Census geographers who edit the database. Given that the MAF/TIGER database covers the entire U.S. and its territories, and includes many millions of primitives, the ability to identify errors in the database efficiently is crucial.
So how does topology help the Census Bureau assure the accuracy of population data needed for reapportionment and redistricting? To do so, the Bureau must aggregate counts and characteristics to various geographic areas, including blocks, tracts, and voting districts. This involves a process called “address matching” or “address geocoding” in which data collected by household is assigned a topologically-correct geographic location. The following pages explain how that works.
6.6 Geocoding
Geocoding is the process used to convert location codes, such as street addresses or postal codes, into geographic (or other) coordinates. The terms “address geocoding” and “address mapping” refer to the same process. Geocoding address-referenced population data is one of the Census Bureau’s key responsibilities. However, as you may know, it is also a very popular capability of online mapping and routing services. In addition, geocoding is an essential element of a suite of techniques that are becoming known as “business intelligence.” We will look at applications like these later in this chapter, but, first, let’s consider how the Census Bureau performs address geocoding.
6.6.1 Address Geocoding at the US Census: Pre-Modernization
Prior to the MAF/TIGER modernization project that led up to the decennial census of 2010, the TIGER database did not include a complete set of point locations for U.S. households. Lacking point locations, TIGER was designed to support address geocoding by approximation. As illustrated below, the pre-modernization TIGER database included address range attributes for the edges that represent streets. Address range attributes were also included in the TIGER/Line files extracted from TIGER. Coupled with the Start and End nodes bounding each edge, address ranges enable users to estimate locations of household addresses (Figure 6.7).
Here’s how it works. The diagram above highlights an edge that represents a one-block segment of Oak Avenue. The edge is bounded by two nodes, labeled "Start" and "End." A corresponding record in an attribute table includes the unique ID number (0007654320) that identifies the edge, along with starting and ending addresses for the left (FRADDL, TOADDL) and right (FRADDR, TOADDR) sides of Oak Avenue. Note also that the address ranges include potential addresses, not just existing ones. This is done in order to future-proof the records, ensuring that the data will still be valid as new buildings and addresses are added to the street.
6.6.2 After MAF/TIGER Modernization
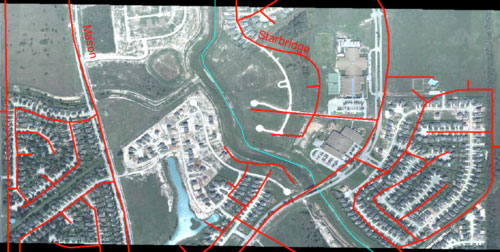
Prior to MAF/TIGER modernization, local governments relied on their own digitized data for location-sensitive projects such as property tax assessments, E-911 dispatch, and the like. The modernization project for MAF/TIGER, which began in 2002, aimed to bring the accuracy of the local data to the entire nation in time for the 2010 census. The illustration in Figure 6.8 shows the intended result of the modernization project, including properly aligned streets, shorelines, and individual household locations, shown in relation to an aerial image.
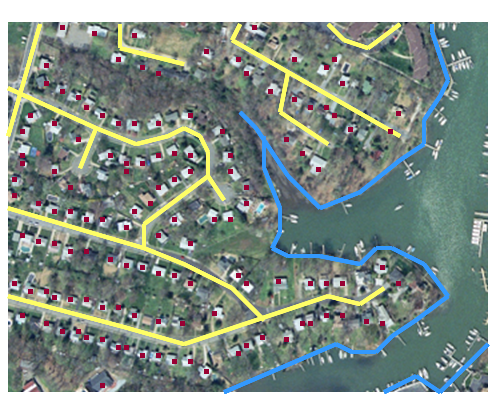
The modernized MAF/TIGER database is now in use, including precise geographic locations of over 100 million household units. However, because household locations are considered confidential, non-federal government users of TIGER/Line Shapefiles extracted from the MAF/TIGER database still must rely upon address geocoding using address ranges.
6.6.3 TIGER’s Role in the Geospatial Boom
Launched in 1996, MapQuest was one of the earliest online mapping, geocoding and routing services. MapQuest combined the capabilities of two companies: a cartographic design firm with long experience in producing road atlases and a start-up company that specialized in custom geocoding applications for business. Initially, MapQuest relied in part on TIGER/Line street data extracted from the pre-modernization TIGER database. MapQuest and other commercial firms were able to build their businesses on TIGER data because of the U.S. government’s wise decision not to restrict its reuse. It has been said that this decision triggered the rapid growth of the U.S. geospatial industry.
6.7 Geocoding Online
No doubt you're familiar with one or more popular online mapping services. How well do they do at geocoding the location of a postal address? You can try it out for yourself at several Web-based mapping services, including MapQuest.com (Mapquest [6]), Microsoft's Bing Maps (Bing Maps [7]), and similar user-created tools like GPS Visualizer (GPSVisualizer.com [8]). Other services, such as the Federal Financial Institutions Examination Council (FFIEC)’s geocoding system (FFIEC Geocoding System [9]) provide census information instead of latitude and longitude. Try using the FFIEC’s system and view related census information for your area.
Let's compare the geocoding capabilities of MapQuest.com to locate the address on an actual map. Figure 6.9 displays a recent screen capture of an address lookup.
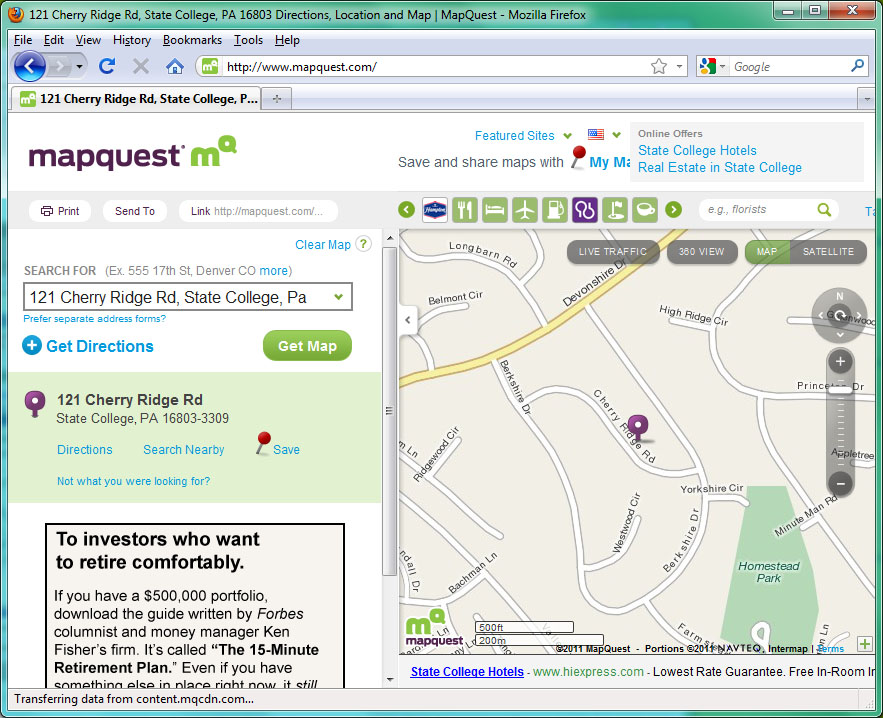
The MapQuest.com map generated in 2011 places the address close to its actual location. Below, Figure 6.10 shows a similar MapQuest product created back in 1998, when this course was first being developed. On the older map, the same address is plotted on the opposite side of the street. What do you suppose is wrong with the address range attribute in that case? Also, note the shapes of the streets and the differences in map design.
It is likely that the older map relied on pre-modernization TIGER data from 1990 for the street shapes. MapQuest, like many other commercial navigation services, now uses detailed street data purchased from NAVTEQ (Navteq.com [10]).
The point of this section is to show that geocoding with address ranges involves a process of estimation. The Census Bureau's TIGER/Line Shapefiles, like the commercial street databases produced by Tele Atlas, Navigation Technologies, and other private firms, represents streets as vector line segments. The vector segments are associated with address range attributes, one for the left side of the street, one for the right side. The geocoding process takes a street address as input, finds the line segment that represents the specified street, checks the address ranges to determine the correct side of the street, then estimates a location at the appropriate point between the minimum and maximum address for that segment and assigns an estimated latitude/longitude coordinate to that location. For example, if the minimum address is 401, and the maximum is 421, a geocoding algorithm would locate address 411 at the midpoint of the street segment. This estimation process is approximate and some addresses will not be located correctly as explained in the Google Earth help system explanation of what they call “address interpolation,” see: Google Earth Support [11].
Practice Quiz
Registered Penn State students should return now take the self-assessment quiz about Topology & Geocoding.
You may take practice quizzes as many times as you wish. They are not scored and do not affect your grade in any way.
6.8 Geocoding Your Customers
The amount of data collected about customers is so vast, and the resulting analysis so powerful, that companies can determine which of their customers may be pregnant and which aren’t. Earlier in 2012, a major retailer unknowingly informed a father that his teenage daughter was pregnant [12] – based on her recent purchases matching a trend of other expecting mothers – long before she had planned to share the news (Forbes, 2012).
Shoppers are frequently asked for their zip code while paying for items. Have you ever wondered why this is? Based on the content of this chapter, you can probably wager a pretty good guess. That’s right: the store or, more correctly, the company who owns the store, uses this information to pair places with purchases. This helps companies determine regional trends to see which items sell best in certain locations, deliver ads targeted for certain areas, and analyze the habits and characteristics of their customers. Analysis of this kind is a major component of modern business practices and helps increase efficiency, customer satisfaction, and overall sales. It can also lead to some very surprised customers, as we’ve seen in the example above.
Customer addresses can also be harvested from automobile license plates. Business owners pay to record license plate numbers of cars parked in their parking lots or in their competitors' lots. Addresses of registered owners can be purchased from organizations that acquire motor vehicle records from state departments of transportation. These addresses are used to identify trade areas, or the locations in which their customers live and work. Companies can then target their trade areas, or their competitors’ trade areas, with direct mail advertising or match their products and prices to the socio-economic characteristics of the local population.
Data of this type is also collected by popular websites who track their visitors; this happens frequently without the users’ knowledge. Chapter 1 discussed how Content Delivery Networks (CDNs) use locations to determine the closest server in order to speed up the load times of websites. When combined with the ads users click, the products users mention in status updates, and the “likes” made across popular social networking sites, geocoded data enables companies to analyze and discover a great deal of information about their users. Individual surfing habits and preferences are also collected behind the scenes via ‘cookies,’ which are small files stored by your web browser that allow one site to save and read information that was created when you viewed previous sites.
6.9 Routing
Operations such as mail and package delivery, food and beverage distribution, and emergency medical services need to know not only where their customers are located, but how to deliver products and services to those locations as efficiently as possible. Geographic data products like TIGER/Line Shapefiles are valuable to analysts responsible for prescribing the most efficient delivery routes. The larger and more complex the service areas of such organizations, the more incentive they have to automate their routing procedures.
In its simplest form, routing involves finding the shortest path through a network from an origin to a destination. If the nodes are specified within geographic or plane coordinate systems, the distance between them can be calculated readily. Routing procedures sum the lengths of every plausible sequence of line segments that begins and ends at the specified locations. The sequence of segments associated with the smallest sum represents the shortest route. In addition to geographic distances, modern transportation data can also make use of local speed limits or, where available, current traffic conditions to determine the length of time needed to travel a particular line segment. This allows analysts and users to compare and make compromises between a route of the shortest distance and a route of the shortest travel time.
To enable this kind of analysis and computation, the data must indicate which line segment follows immediately after another line segment. In other words, the procedure needs to know about the connectivity of features. As discussed earlier, connectivity is an example of a topological relationship. If topology is not encoded in the data product, it can be calculated by the GIS software in which the procedure is coded.
Several online travel planning services, including MapQuest.com and Google Maps, provide routing capabilities. Both take origin and destination addresses as input, and produce optimal routes as output. These services are based on vector feature databases in which street segments are attributed with address ranges, as well as with other data that describe the type and conditions of the roads they represent. Recent advances in these services have added routing for pedestrians and bicyclists as well as by mass transit.
Try This: Use a routing tool to help you find your way
Let’s take a practical look at a routing application you might use while on vacation or exploring a new city.
1: Visit Google Maps [13]
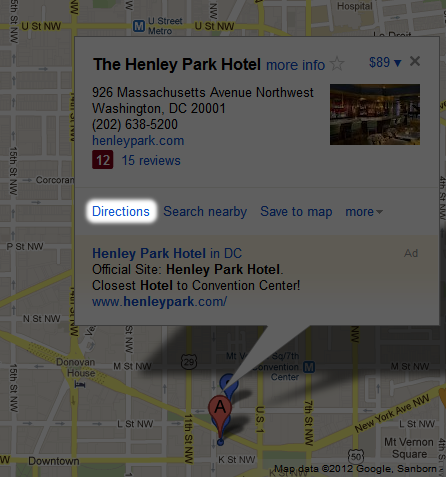
2: In the search box, enter: The Henley Park Hotel, Massachusetts Avenue Northwest, Washington, DC. The Henley Park Hotel will be marked by the ‘A’ pin.
3: Click it and then click the ‘Directions’ link shown in Figure 6.11:
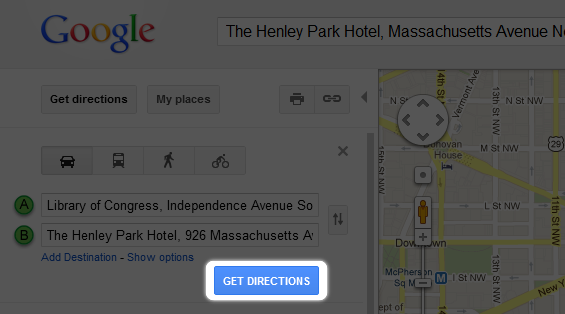
4: A new textbox will appear on the left of the map. Enter Library of Congress, Independence Avenue Southeast, DC in the empty textbox.
5: Click ‘Get Directions’ (Figure 6.12):
6: Use the buttons indicated in Figure 6.13 to toggle different transpiration options:

Experiment with the different routes and travel modes. Which travel mode takes the shortest route? Which route has more turns? Which travel mode/route is quickest? Note that each mode of travel may also have additional routes that can be toggled (Figure 6.14).
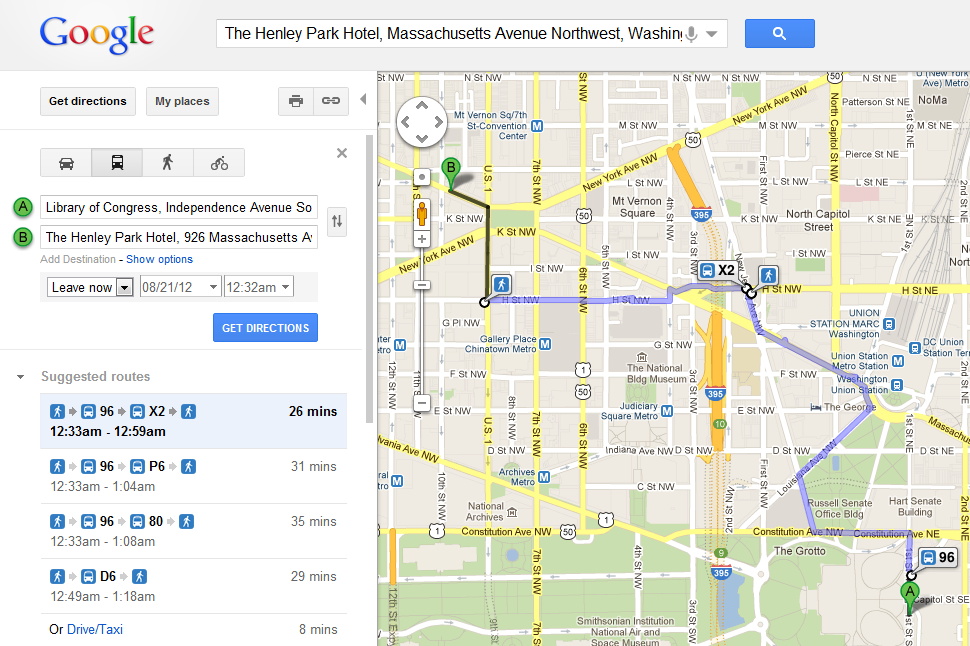
Which mode of travel would you choose?
Sometimes routes have more than one destination and several stops must be made during a trip. This is a complex special case of routing called the traveling salesman problem. School bus dispatchers, mail and package delivery service managers, and food and beverage distributors all seek to minimize the transportation costs involved in servicing multiple, dispersed destinations. Choosing the optimal route requires very sophisticated analysis to evaluate all possible routes, keeping in mind speed limits, typical traffic volumes, one-way streets, and other characteristics of the transportation network. As the number of destinations and the costs of travel increase, the high cost of purchasing up-to-date, properly attributed network data becomes easier to justify.
6.10 Delineating Service Areas
The need to redraw voting district boundaries every ten years was one of the motivations that led the Census Bureau to create its MAF/TIGER database. Like voting districts, many other kinds of service area boundaries need to be revised periodically. School districts are a good example. The state of Massachusetts, for instance, has adopted school districting laws that are similar in effect to the constitutional criteria used to guide congressional redistricting. The Framingham (Massachusetts) School District's Racial Balance Policy once stated that "each elementary and middle school shall enroll a student body that is racially balanced. ... each student body shall include a percentage of minority students, which reflects the system-wide percentage of minority students, plus or minus ten percent. ... The racial balance required by this policy shall be established by redrawing school enrollment areas" (Framingham Public Schools 1998). Particularly in places with policies like this, each time districts are redrawn, the students and locations served by the buses also changes. Thus, the routes must also be reanalyzed and optimized.
Another example of service area analysis is provided by the City of Beaverton, Oregon. In 1997, Beaverton officials realized that 25 percent of the volume of solid waste that was hauled away to land fills consisted of yard waste, such as grass clippings and leaves. Beaverton decided to establish a yard waste recycling program, but it knew that the program would not be successful if residents found it inconvenient to participate. A GIS procedure was used to partition Beaverton's street network into service areas that minimized the drive time from residents' homes to recycling facilities. Beaverton’s yard waste recycling program has since been updated and at the time of this writing includes curbside pickup.
6.11 TIGER, another TIGER, and the Future Going Forward
We’ve discussed how MAF/TIGER data have been used, improved, and relied upon for many projects, ranging from census data collection to geocoding and navigation. MAF/TIGER data are continuously being created, and projects related to developing and using the MAF/TIGER database are a major focus of the US Department of Transportation (USDOT).
As part of President Obama’s Build America: A 21st Century Infrastructure budget plan, $476 billion has been allocated for a six-year goal that includes improvements to surface transportation, such as motorways, runways, and passenger rail. This sum is separate from an initial $50 billion that was set aside for job creation related to the expansion of surface transportation (Whitehouse.gov, 2012).
Money provided by the President’s budget is being used by USDOT to fund several grants related to another kind of TIGER program – Transportation Investment Generating Economic Recovery. Secretary of USDOT, Ray LaHood, stated on his official blog:
From roadways to help reduce costly bottlenecks to transit choices that help commuters save on gas and freight rail upgrades that improve safety and efficiency, America needs a 21st century transportation system capable of supporting our 21st century economy. An America that's built to last needs transportation that's built to last (FastLane Blog, 2012).
Following through on these claims, LaHood and USDOT have announced several rounds of multi-million dollar grants that are being awarded to projects that extend America’s transportation potential and stimulate transportation-related job growth.
Building new roads or rails requires new entries to the MAF/TIGER database and a wide array of jobs for surveying, measuring, analyzing, and coding the updated information. Each of these activities relies in whole or in part on the geospatial technologies and methods that you have read about in this and previous chapters.
Practice Quiz
Registered Penn State students should return now take the self-assessment quiz about TIGER.
You may take practice quizzes as many times as you wish. They are not scored and do not affect your grade in any way.
6.12 Summary
To fulfill its mission of being the preeminent producer of attribute data about the population and economy of the United States, the U.S. Census Bureau also became an innovative producer of digital geographic data. The Bureau designed its MAF/TIGER database to support automatic geocoding of address-referenced census data, as well as automatic data quality control procedures. The key characteristics of TIGER/Line Shapefiles, including use of vector features to represent geographic entities, and address range attributes to enable address geocoding, are now common features of proprietary geographic databases used for trade area analysis, districting, routing, transportation, and allocation.
6.13 Glossary
Adjacency: The topological property of two faces being next to one another by sharing an edge.
Connectedness: A topological relationship that determines if nodes are connected, edges, or faces are connected.
Connecting Node: A node that is connected to an edge.
Containment: The topological relationship in which one primitive is contained within another, such as an isolated node existing within a face.
Edge: The segment represented between two connecting nodes.
End Node: The last node in a direction segment, or set of nodes along such a segment.
Face: The closed area created by three or more edges with a continuous linkage of connecting nodes.
Geocoding: The process of determining an address based on geographic coordinates or position along a spatially-referenced line segment.
Geometric Primitives: The fundamental entities that are represented within topology: nodes, edges, and faces.
Left Face: The face immediately to the left of a directional edge, in respect to the direction of the edge.
MAF/TIGER: The database resulting from a combination of the Master Address File and the Topologically Integrated Geographic Encoding and Referencing system.
Node: A zero-dimensional topographic primitive represented by spatial coordinates.
Master Address File (MAF): The complete inventory of housing units and many business locations in the U.S., Puerto Rico, and associated island areas.
Right Face: The face immediately to the right of a directional edge, in respect to the direction of the edge.
Routing: The process of analyzing possible paths between two locations in a transportation network and choosing the optimal path, based on either shortest distance or shortest travel time (or a trade-off of the two).
Shapefile: The proprietary but open file format developed by Esri to represent digital vector data for spatial applications.
Start Node: The first node along an edge.
Topology: The subfield of mathematics that deals with the relationship between geometric entities.
Vertice: An intermediate point along an edge that can define the shape of an edge with more specificity than start and end nodes alone, without being a recorded location.
6.14 Bibliography
Budget Overview, US White House (n.d.). Retrieved August 11, 2012, from http://www.whitehouse.gov/omb/overview [14]
Charlotte-Mecklenberg Public Schools (n. d.). Retrieved July 19, 1999, from http://www.cms.k12.nc.us [15]
Cooke, D. F. (1997). Topology and TIGER: The Census Bureau's Contribution. In T. W. Foresman (Ed.), The history of geographic information systems: Perspectives from the pioneers. (pp. 47 –57). Upper Saddle River, NJ: Prentice Hall.
Dangermond, J. (1982). A Classification of Software Components Commonly Used in Geographic Information Systems. In Proceedings of the U.S.—Australia Workshop on the Design and Implementation of Computer-Based Geographic Information Systems, Honolulu, HI, pp. 0-91.
Demers, M.N. (1997) Fundamentals of Geographic Information Systems. John Wiley & Sons, Inc.
Discreet Research (n.d.). Retrieved July 19, 1999, from http://www.dresearch.com [16]
ESRI (1998) Shapefile Technical Description, An ESRI White paper. Environmental Systems Research Institute, Inc. Retrieved October 4, 2010, from http://www.esri.com/library/whitepapers/pdfs/shapefile.pdf [17]
Federal Geographic Data Committee (April 2006). Retrieved July 19, 1999, from http://www.fgdc.gov [18]
Framingham Public Schools (1998). Racial balance policy: Assignment of students to schools. Retrieved July 19, 1999, from www.framingham.k12.ma.us/update/0198rbp.html [19] (since retired).
Francica, J. (n.d.). Geodezix Consulting. Retrieved July 19, 1999, from www.geodezix.com [20] (since retired).
Galdi, D. (2005). Spatial Data Storage and Topology in the Redesigned MAF/TIGER System. Retrieved 19 October 2010, from http://www.census.gov/geo/mtep_obj2/topo_and_data_stor.html [21] (since retired).
MapQuest (n.d. a). Retrieved July 19, 1998, from http://www.mapquest.com [6]
MapQuest (n.d. b). Retrieved August 2, 2011, from http://www.mapquest.com [6]
Marx, R. M. (Ed.). (1990). The Census Bureau's TIGER system. [Special issue]. Cartography and Geographic Information Systems 17:1.
MSN (2005). Maps and directions. Retrieved May 3, 2006, from http://www.mapblast.com [22]
Navigation Technologies Inc. (2006). Welcome to NavTech. Retrieved July 19, 1999, from http://www.navtech.com [23]
Rammage, S. and P. Woodsford (2002). The Benefits of Topology in the Database. Retrieved October 6, 2010, from http://spatialnews.geocomm.com/features/laserscan2/ [24]
TeleAtlas (2006). Welcome to TeleAtlas. Retrieved May 3, 2006, from http://www.teleatlas.com/Pub/Home [25] (since retired).
Theobald, D. M. (2001). Understanding Topology and Shapefiles. ArcUser April-June 2001. Retrieved October 5, 2010, from http://www.esri.com/news/arcuser/0401/topo.html [26]
US DOT Fast Lane Blog (2012).TIGER 2012 Applications Far Exceed Available Funds; Overwhelming Demand Demonstrates Investment Need. Retrieved August 11, 20012, from http://fastlane.dot.gov/2012/04/tiger-2012-applications.html#.UChF3cjSV7Q [27]
U.S. Census Bureau (1997). TIGER/Line Files (1997 Technical Documentation). Retrieved January 2, 1999, from http://www.census.gov/geo/tiger/TIGER97C.pdf [28] (since retired).
U.S. Census Bureau (2003). TIGER/Line Files, 2003 (metadata). Retrieved February 3, 2008, from http://www.census.gov/geo/www/tlmetadata/tl2003meta.txt [29]
U.S. Census Bureau (n. d.). 21st Century MAF/TIGER Enhancements. Retrieved February 3, 2008, from http://www.census.gov/geo/mod/overview.pdf [30] (since retired).
U.S. Census Bureau (2004). MAF/TIGER Redesign Project Overview. Retrieved October 19, 2010, from http://www.census.gov/geo/mtep_obj2/obj2_issuepaper12_2004.pdf [31] (since retired).
U.S. Census Bureau (2005). Geography division map gallery. Retrieved July 19, 1999, from http://www.census.gov/geo/www/mapGallery/ [32]
U.S. Census Bureau (2009). TIGER/Line Shapefiles Technical Documentation. Retrieved October 19, 2010, from http://www.census.gov/geo/www/tiger/tgrshp2009/TGRSHP09.pdf [33]