Water Sources for Crops
Where do plants get their water?
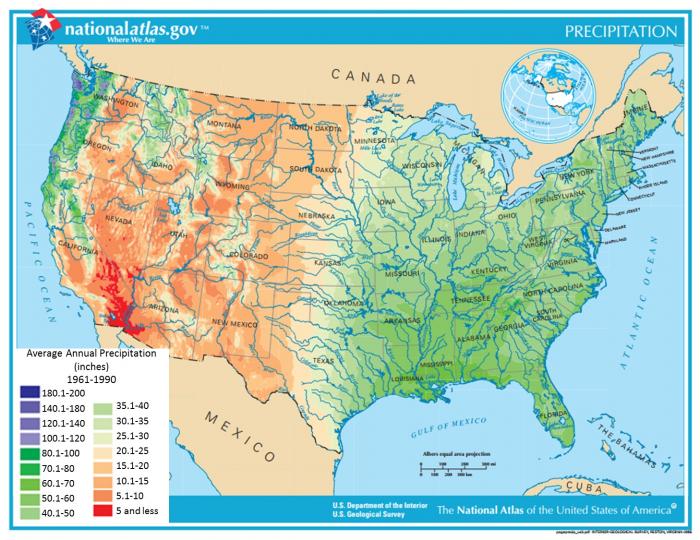
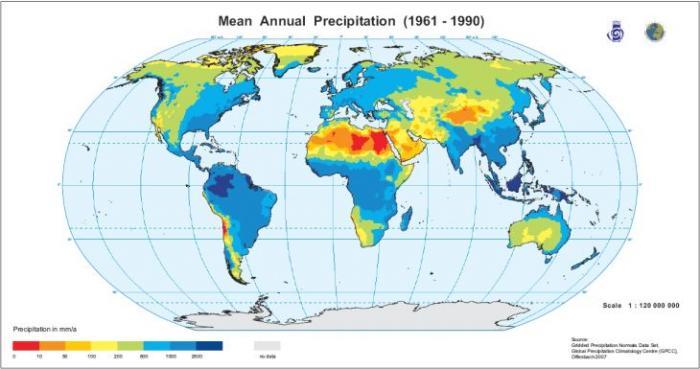
The source of water for most land plants is precipitation that infiltrates or soaks into the soil, but precipitation varies dramatically geographically. For example, we know that Florida gets a lot more precipitation per year than Arizona. Figure 4.1.5 below shows the average annual precipitation across the United States and around the globe. Notice on the map of the U.S. that the dark orange colors represent areas that get less than ten inches of precipitation per year. And, the darkest green to blue regions receive more than 100 inches or more than eight feet of precipitation per year!
Climate, including the temperature of a region and the amount of precipitation, plays an important role in determining what types of plants can grow in a particular area. Think about what types of plants you might see in a high water resource region versus a low water resource region. A low resource region with respect to water receives lower precipitation, so would have desert-like vegetation, whereas a higher resource region for water would have lusher native vegetation, such as the forests of the eastern US.
Regions that receive enough precipitation to grow crops without irrigation (i.e., those areas shaded green on the map below) would be considered high resource areas with respect to water. A high-resource region is more likely to be a more resilient food production region. In contrast, a low resource region with respect to water would be regions on the map below in the orange-shaded colors. In these regions, extra effort is needed to provide enough water for crops, such as through the development of an irrigation system.
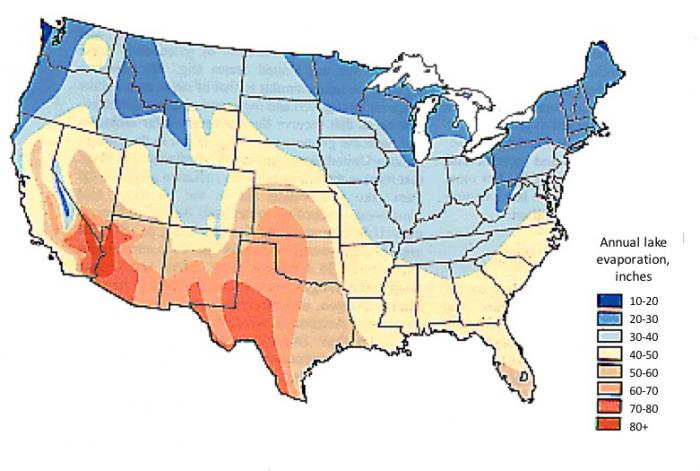
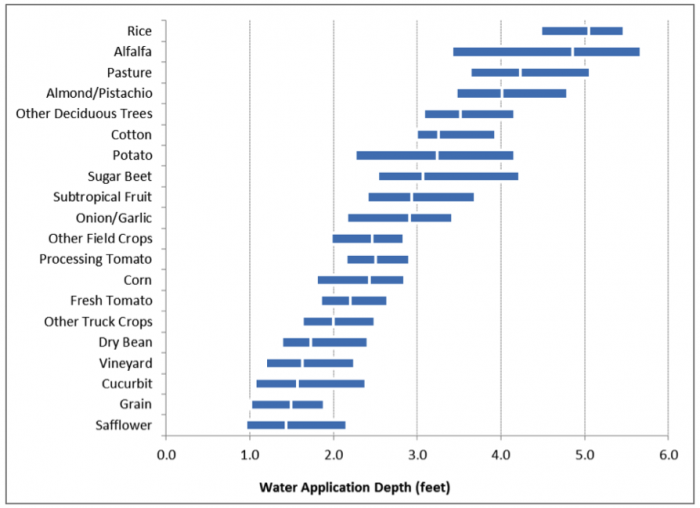
Compare the crop water use values in Figure 4.1.6 with the average annual precipitation in Figure 4.1.5 and you'll see that there are parts of the US where there isn't enough precipitation to grow many crops. In fact, there is a rough line running down the center of the US at about the 100th meridian that separates regions that get more than about 20 inches of rain per year from regions that get less than 20 inches of rain per year. On the map in Figure 4.1.5, this line is evident between the orange-colored areas and the green-colored areas. Generally, west of the 100th meridian there is insufficient precipitation to grow many crops. If a crop's consumptive water use or ET is greater than the amount of precipitation, then irrigation of the crop is necessary to achieve high yields.
How can we grow crops when there is insufficient precipitation?
In regions where precipitation is insufficient to grow crops, farmers turn to other sources of water to irrigate their crops. Irrigation is the artificial application of water to the soil to assist in the growth of agricultural crops and other vegetation in dry areas and during periods of inadequate rainfall. These sources of water can be from either surface or groundwater. Surface water sources include rivers and lakes, and diversion of water from surface water sources often requires dams and networks of irrigation canals, ditches, and pipelines. These diversions structures and the resulting depletion in river flow can have significant impacts on our river systems, which will be covered in the next part of this module. The pumping of water for irrigation from aquifers also has impacts, which are also discussed in the next part of this module.
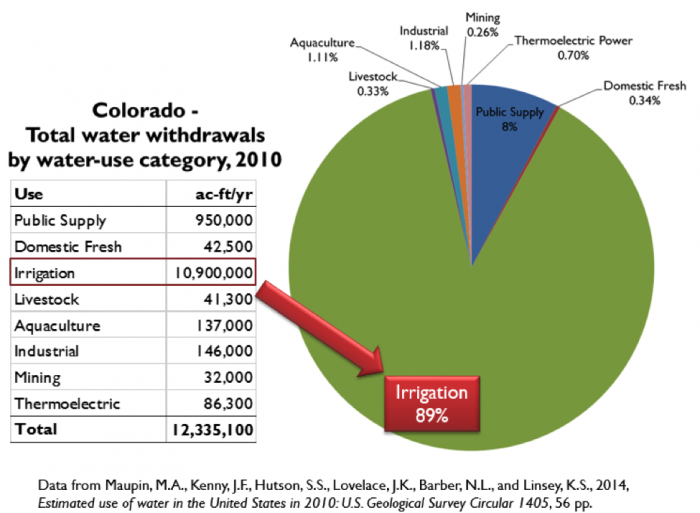
Water use for irrigation comprised about 80-90 percent of U.S. consumptive water use in 2005, with about three-quarters of the irrigated acreage being in the western-most contiguous states (from USDA Economic Research Service). For example, in the state of Colorado, irrigation comprised 89% of total water withdrawals in 2010 (Figure 4.1.7). Irrigated agriculture is also very important economically, accounting for 55 percent of the total value of crop sales in the US in 2007 (from USDA Economic Research Service). Globally only about 18 percent of cropland is irrigated, but that land produces 40 percent of the world's food and about 50 percent by value (Jones 2010).
Activate Your Learning
In this activity, you will employ geoscience ways of thinking and skills (spatial thinking and interpretation of the spatial data to characterize specific regions for the geographic facility).