
Understanding the Science of Climate Change
At this point, you should have either watched one or two of the videos from the introduction, or you're already familiar with how human activities have resulted in the warming of the planet in the last century. Now, we'll explore some of the latest data from the National Aeronautics and Space Administration (NASA), the National Oceanic and Atmospheric Administration (NOAA), and the Intergovernmental Panel on Climate Change (IPCC) to review and to help us better understand the connections between increases in atmospheric carbon dioxide and climate change.
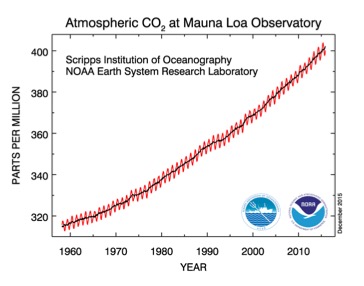
Data on current atmospheric concentrations of carbon dioxide are collected and compiled by NOAA and can be found at NOAA Earth System Research Laboratory. The longest record of carbon dioxide concentration in the atmosphere is from Mauna Loa in Hawaii and was initiated in the 1950s. The resulting curve is often referred to as the “Keeling Curve” (Figure 9.1.1) after the atmospheric scientist who first began collecting CO2 data.
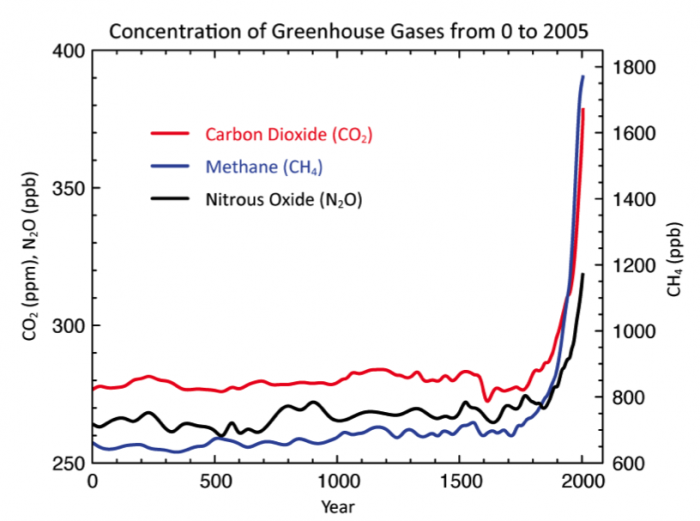
Carbon dioxide is not the only greenhouse gas. Human activities have also increased concentrations of methane and nitrous oxide. The IPCC has compiled data from many sources to summarize the changes in greenhouse gas concentrations for the last 2000 years (Figure 9.1.2), and concentrations of carbon dioxide, methane, and nitrous oxides have all risen dramatically with industrialization. The increases in carbon dioxide concentrations have the greatest impact on global climate, but the increases in the other greenhouse gases play a supporting role.
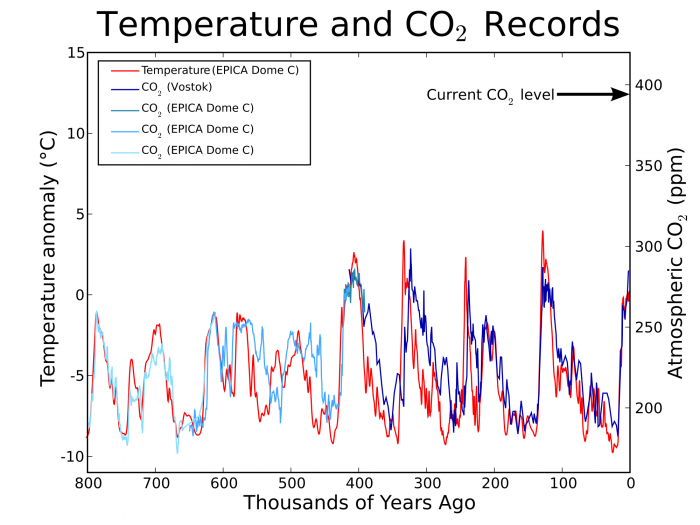
To understand Earth's past climate, scientists use data extracted from air bubbles trapped in ice cores from Greenland and Antarctica to study past carbon dioxide concentrations and temperatures. The longest ice core record is from Vostok, Antarctica and gives us a picture of changes in CO2 concentrations and temperatures for the last 800,000 years (Figure 9.1.3). In November 2015, CO2 concentrations in the atmosphere reached 400.16 ppm, a level not seen in the past 800,000 years on Earth. Also, there is a clear correlation between temperature changes and changes in atmospheric CO2 concentrations.
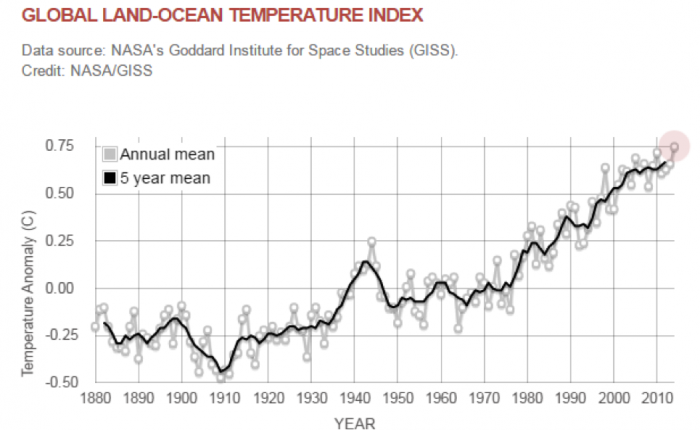
NASA has compiled surface air and ocean temperature data from around the globe and summarized temperature changes into an index (Global Climate Change: Vital Signs of the Planet) that compares annual average temperature with the average temperatures from 1951-1980 (Figure 9.1.4). Global temperatures have been rising for the last 100 years. We'll explore more temperature data and consider the impact of rising temperatures as we continue in this module.
Activate your learning
Question 1 - Short Answer
How does the current concentration of carbon dioxide in the atmosphere compare with atmospheric carbon dioxide concentrations measured in the Vostok ice core (Figure 9.1.3)?
Click for answer.
Current carbon dioxide concentrations (400 ppm in November 2015) are higher than at any time in at least the past 800,000 years.
Question 2 - Short Answer
In the Keeling Curve (Figure 9.1.1), there is a clear upward trend in carbon dioxide concentrations, and there is also a smaller oscillating pattern in the data. Each year, CO2 concentration increase and decrease. What could be causing the annual cycle in carbon dioxide concentrations?
Click for answer.
The annual cycle is a result of the large deciduous forests in the northern hemisphere. Trees take up more CO2 in the summer time when they have green leaves that are taking up CO2 to create new plant material via photosynthesis. In the fall, this process stops. In the winter, when deciduous trees lose their leaves, CO2 levels in the atmosphere increase as photosynthetic rates decline and as CO2 is released as plant material decays. The upward trend, since recording started in the late 1950s, is a result of the burning of fossil fuels and other anthropogenic greenhouse gas emissions.
Question 3 - Short Answer
What is the source of the increasing CO2 concentrations in the atmosphere that is evident in the Keeling Curve (Figure 9.1.1), and that has occurred since about 1850 (Figure 9.1.2)?
Click for answer.
The increase of CO2 concentrations in the atmosphere since 1850 is primarily from the burning of fossil fuels (petroleum, coal and natural gas). Other human activities also contribute, such as deforestation.
Question 4 - Short Answer
Global average temperatures have been increasing since about 1920. Explain the relationship between global temperature increase and increasing levels of CO2 in the atmosphere.
Click for answer.
As carbon dioxide concentrations in the atmosphere increase, more heat energy is trapped in the Earth's lower atmosphere, which results in an increase in temperature. As temperature increases, evaporation rates also increase. Water vapor is a very powerful greenhouse gas, so there is a positive feedback that causes an additional increase in temperature.