Projected Climate Changes
So far in module 9, we've studied the basics of the science of climate change and by now you should have a pretty good understanding of the relationship between greenhouse gases and temperature. We've seen how human activities, including our food systems, are contributing carbon dioxide and other greenhouse gases to the atmosphere. And, as greenhouse gas concentrations increase, more heat energy is trapped, so temperatures at the Earth's surface increase.
We've also seen that temperatures are already increasing around the globe and that precipitation patterns are changing, but what does the future hold? How much will temperatures increase? Will precipitation increase or decrease? Those are very good questions! And, the answers aren't perfectly clear. Atmospheric and climate scientists all over the world are working hard to estimate how Earth's climate will change as greenhouse gas concentrations increase. Future predictions are made by running computer models that simulate natural processes and human activities and estimate future conditions. Model results vary from model to model, but they all predict future warming. Also, as we've already seen, the amount of warming varies from place to place.
What are the predictions for future climate?
The models used to predict future climate are very complicated and incorporate a vast number of variables, natural processes, and human activities. Projecting into the future is always a tricky endeavor and is always fraught with uncertainty. However, all of the models predict continued warming in the future. The magnitude of the warming varies from model to model and depending on which carbon emission scenario is used. For example, warming might slow in the future if we manage to curb our burning of fossil fuels, which would result in lower carbon dioxide emissions.
The model results are presented on two websites (National Climate Change View and Global Climate Change Viewer) that allow us to view the future projections for the US and for the globe on easy-to-read maps. In the summative assessment for this module, you'll explore these websites in greater depth to extract data for your capstone assignment. Right now, we'll just look at a few of the maps to get an idea of how the climate is projected to change in the latter part of this century. Exploring these maps develops our spatial thinking skills, which in turn enhances our math skills! And, who doesn't want to be better at math?
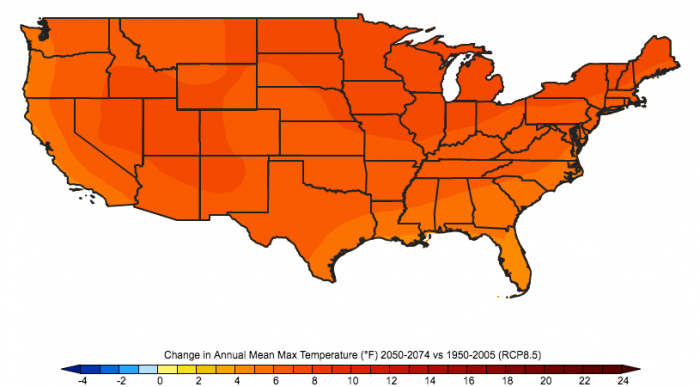
Future climate projections are presented as the projected change compared to the latter part of the last century (1950-2005). So for example, if the projected temperature change for 2050-2074 is 4oF, then that means the 2050-2074 average temperature is projected to be 4oF higher than the average temperature from 1950-2005. All of the following maps present projected change in this manner.
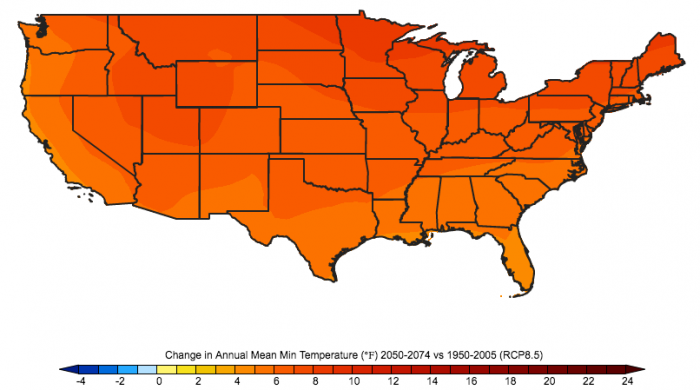
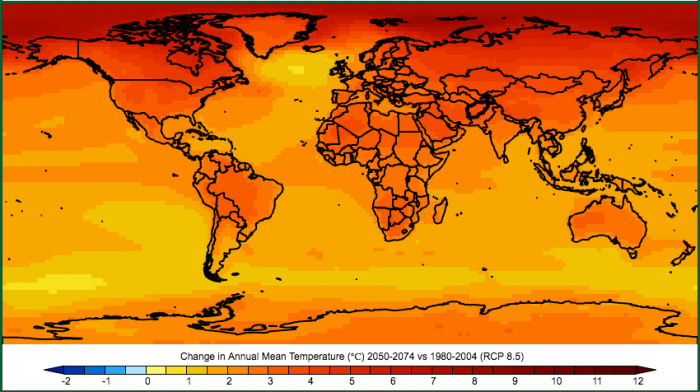
First, let's look at temperature. The National Climate Change Viewer (NCCV) (Figures 9.1.9 and 9.1.10) and Global Climate Change Viewer (GCCV) (Figure 9.1.11) both provide maps of projected temperature changes. Notice that the global map gives temperature change in degrees Celsius, and the US map is in Fahrenheit. One notable aspect of all three maps is that temperature is expected to increase everywhere. As you look at these maps, notice where the temperature change is expected to be the greatest. Can you make any generalizations? What is the expected temperature change in the region where you live right now? For example, if we were in New York City, the map in Figure 9.1.9 suggests that the average maximum temperature by 2050-2074 could be 4oF higher than it was in 1950-2005.
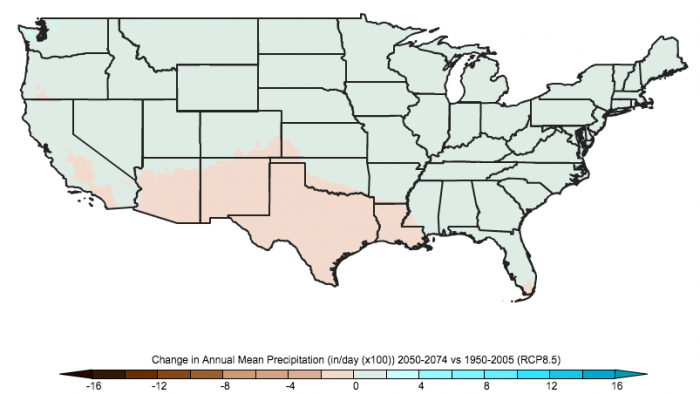
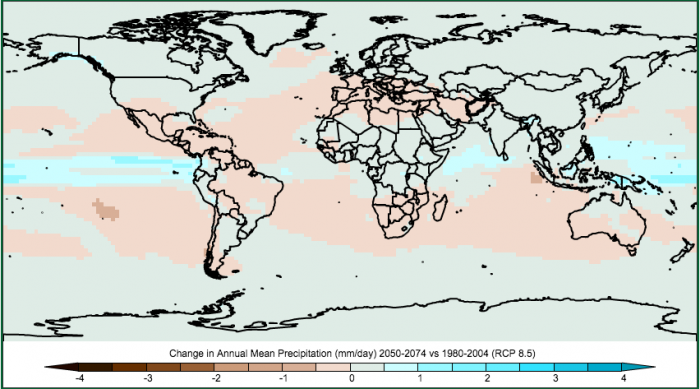
The projected changes in precipitation aren't quite as straightforward or certain as the projected temperature changes. Some regions are expected to receive more precipitation and some regions less. You can see in Figure 9.1.12 the southwestern US, a region that is already water-scarce, is expected to receive less annual precipitation on average. On the global map in Figure 9.1.13, equatorial regions are expected to receive a little more precipitation, and there's a band just north and south of the equator where precipitation is expected to decrease. The certainty in the precipitation predictions is lower than for temperature and the variability within a given year and from year to year in how the precipitation falls is expected to increase.
The NCCV also allows you to view projected changes in a few more variables that are not available on the GCCV. Students studying food regions outside of the US will need to work with their instructor to find similar data for their regions.
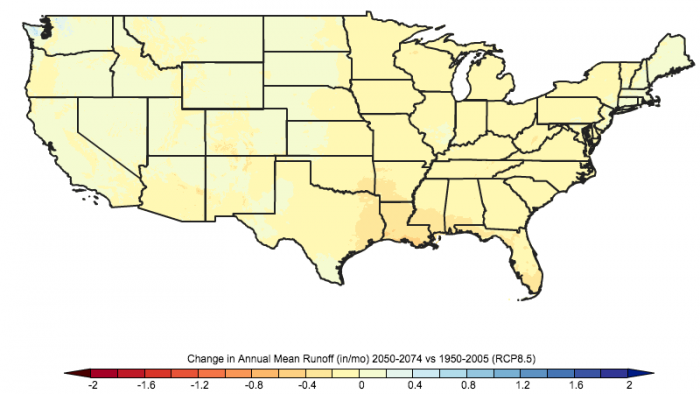
Precipitation falls on the land surface and flows into streams and rivers, which is called runoff. If precipitation is projected to decrease in the future, it would make sense that runoff would also decrease. Also, as temperatures increase and cause evaporation and transpiration to increase, there is less water available to run off into streams and rivers. The NCCV runoff map (Figure 9.1.14) suggests that runoff will also decrease in many areas of the US. The units for runoff are given in inches of water per month, similar to units for precipitation. In water-scarce regions where the precipitation is low, for example in deserts, often agriculture is irrigation with runoff from upstream regions where the precipitation is higher. Decreases in runoff could have adverse impacts on some regions that rely on runoff for irrigation.
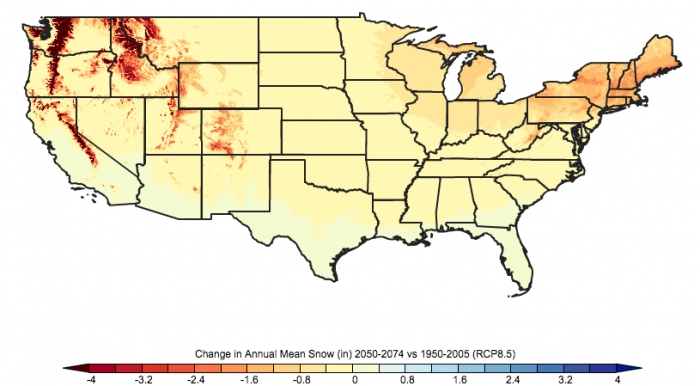
As temperatures increase, there is an expected decrease in annual snowpack. While this is bad news for avid skiers, it's also bad news for regions that rely on water stored in snowpack in the winter that melts and is used for irrigation in the summer months. Figure 9.1.15 illustrates the projected change in annual mean snow in inches. Regions that don't normally get snow are indicated as zero (the deep south and southwest). The Rockies, Sierra Nevadas, Cascades as well as the mountains in the northeast are all expected to see significant decreases in annual snowpack.
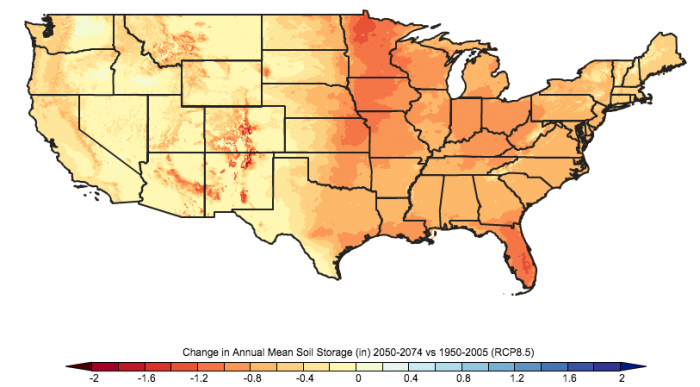
The combination of increased temperatures with increased evaporation and transpiration rates will leave soils drier. Soil moisture content is projected to decrease across much of the US (Figure 9.1.16). Soil moisture is measured in units of depth of water (inches) and is the water available to plants. Some of our very important agricultural regions, the Midwest, are expected to see some of the largest declines in soil moisture storage.
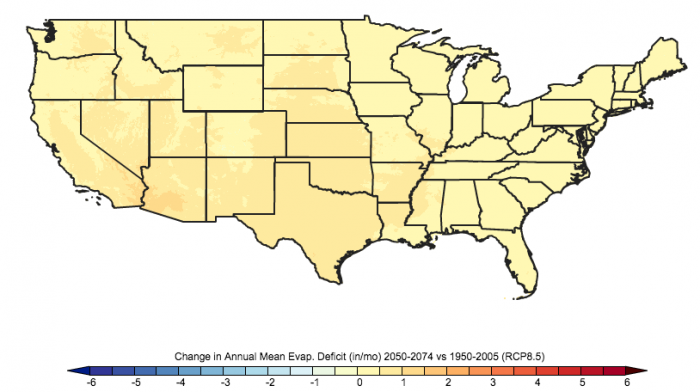
The last data set, evaporative deficit, (Figure 9.1.17) gives us an idea of how much water could evaporate compared to how much water is actually available. An increase in evaporative deficit is a symptom of a transition to a hotter and drier climate. Not surprisingly the entire US is projected to see an increase in evaporative deficit, with the highest increases being in the Southwest and Midwest.
In summary, the future projected climate for the US is generally hotter and drier. Precipitation projections are more variable and less certain, but the increase in temperature and resulting increase in evaporation and transpiration will result in less runoff and drier soils in much of the US. The implications for agriculture are significant. We've already seen how water is essential for crop growth and changes in the temperature regime may have some surprising impacts on growing our food. In the next section, we'll explore projected climate changes and the potential impacts on agriculture in more detail. We'll also consider some possible adaptation strategies that can make our food systems more resilient to our changing climate.