Section 4: Food Systems and Sustainability
Section 4: Food Systems and Sustainability
Overview
Modules
- Module 10: Food Systems
- Module 11: Human-Environment Interactions
- Capstone Stage 4
- Module 12: Capstone Stage 5
Section Goals
Upon completion of Section 4 students will be able to:
- Describe ways that food systems impact the earth system.
- Explain the characteristics and scale of the three major food systems coexisting in the world today and their overlap.
- Demonstrate the complexity and interconnectedness of food system types that connecting society to the environment in different ways within a globalized world.
- Construct an assessment that measures the impacts of food systems on the earth system and local environments.
- Describe the concepts of resilience, adaptive capacity, and vulnerability (RACV) in a food system.
- Explain food access and food insecurity as a key challenge to food systems.
- Appraise the value of human seed systems and agrobiodiversity as human system components that incorporate crops as natural components and foster resilience.
- Apply concepts of RACV to understand changes in seed systems and food production in examples.
- Analyze stresses and shocks from climate change and food system failure that lead to both gradual changes in food systems and acute crises such as famines.
Section Learning Objectives
In order to reach these goals, we have established the following learning objectives for student learning. Upon completion of the modules within Section 4, you will be able to:
- Define food systems and name the component systems, the roles played by each, and the three dominant and overlapping types of food systems in the world today.
- Name different types of impacts of the food system on earth’s natural systems.
- Define the basic elements of a coupled human-natural system.
- Describe a life cycle assessment (LCA) and state what it is used for.
- Explain examples of food systems to illustrate and compare the combined social and environmental inputs and impacts.
- Apply the concept of natural human systems to food systems and distinguish different ways that food systems develop and change because of human and natural factors.
- Apply a coupled natural system framework to describe how human systems affect earth’s natural systems within food systems.
- Construct life-cycle assessments using data on food production activities that compare the impacts of different types of food systems on the earth systems.
- Synthesize outputs of LCAs you have constructed to compare impacts of different food production systems.
- Define the concepts of perturbations and shocks, resilience, adaptive capacity, and vulnerability in the context of agri-food systems.
- Define and describe agrobiodiversity within food production systems and changes in this agrobiodiversity over time
- Define the concepts of food access, food security, food Insecurity, malnutrition, and famine.
- Give examples of resilience, adaptive capacity, and vulnerability in food systems.
- Give examples of support systems for biodiversity in land use and food systems
- Use an online mapping resource to compare different parts of the United States in terms of food access, and identify key areas with low food access.
- Evaluate recent examples in land use and food systems of resilience, adaptive capacity, and vulnerability (RACV).
- Analyze an example of a recent famine and understand how multiple factors of vulnerability and shocks combine to create widespread conditions of food insecurity known as famines.
- Propose actions that can be taken to respond to and prevent famine within a recent historical example.
- Propose principles embodying RACV for incorporation into a proposal/scenario for an example food system (capstone project)
Module 10: Food Systems
Module 10: Food Systems
Overview
Understanding Coupling in Natural and Human Systems
Module 10 continues the theme of human-environment interactions seen at smaller scales in agroecosystems in module 8 and elaborates on the coupled human-natural systems (CHNS) concept introduced in Module 1. As learners, in Module 10.1 you will explore different scales and types of food systems, learn about barriers food producers face within food systems, and look in detail at how the framework of CHNS allows us to see divergences of food system into different types, and transitions from one type to another. In Module 10.2 you’ll learn about the impacts of food systems on natural systems, and practice a method called Life-Cycle Assessment (LCA) which is used to measure the impact of Human Food System components on the environment. LCAs can be applied to measure the impacts of both particular products as well as complex human systems on the environment. The food systems typology, the CHNS framework, and the broad ideas behind LCAs in measuring impacts across a system are tools that you can use to develop your ideas for the capstone project and other learning efforts beyond this course.
As you apply the CHNS framework and the LCA method, you'll be using a geoscience habit of mind introduced in module 1, that of systems thinking. Systems-oriented frameworks and methods are ways of interpreting and measuring complex systems in a way that incorporates the scale of an entire system as well as linkages among many interacting parts. As designers of this course, we believe that these frameworks and skills will be useful to you whether or not you go in some area of geosciences since systems thinking is a needed skill in today's complex world.
Goals and Learning Objectives
Goals and Learning Objectives
Goals
- Describe ways that food systems impact the earth system.
- Explain the characteristics and scale of the three major food systems coexisting in the world today and their overlap.
- Demonstrate the complexity and interconnectedness of food system types that connecting society to the environment in different ways within a globalized world.
- Construct an assessment that measures the impacts of food systems on the earth system and local environments.
Learning Objectives
After completing this module, students will be able to:
- Define food systems and name the component systems, the roles played by each, and the three dominant and overlapping types of food systems in the world today.
- Name different types of impacts of the food system on earth’s natural systems.
- Define the basic elements of a coupled human-natural system.
- Describe a life cycle assessment (LCA) and state what it is used for.
- Explain examples of food systems to illustrate and compare their combined social and environmental inputs and impacts.
- Apply the concept of natural human systems to food systems and distinguish different ways that food systems develop and change because of human and natural factors.
- Apply a coupled natural system framework to describe how human systems affect earth’s natural systems within food systems.
- Construct life-cycle assessments using data on food production activities that compare the impacts of different types of food systems on the earth systems.
- Synthesize outputs of LCAs you have constructed to compare impacts of different food production systems.
Assignments
Module 10 Roadmap
Detailed instructions for completing the Summative Assessment will be provided in each module.
| Action | Assignment | Location |
|---|---|---|
| To Read |
|
|
| To Do |
|
|
Questions?
If you prefer to use email:
If you have any questions, please send them through Canvas e-mail. We will check daily to respond. If your question is one that is relevant to the entire class, we may respond to the entire class rather than individually.
If you prefer to use the discussion forums:
If you have any questions, please post them to the discussion forum in Canvas. We will check that discussion forum daily to respond. While you are there, feel free to post your own responses if you, too, are able to help out a classmate.
Module 10.1: Food Systems
Module 10.1: Food Systems
What are food systems and what do they do?
This module builds on the introductory material in modules one and two defining food systems as coupled human-natural systems: human society interacting with the natural earth system. It marks the transition in the course to focusing on human food systems and land use and their impacts on the environment and earth systems.
Introductory Video on Food Systems
Introductory Video on Food Systems
In the introductory video below you will see a particular local example of a food system, presented by the Food and Agriculture Organization (FAO) of the United Nations. As you watch, look for examples of Human and Natural system components in a local food system particular to the Red River Delta in Vietnam, and the way that the food system has changed over time. Human and Natural system components were introduced in Module 1, and we have been referring to them regularly along the way in the course, as we have considered the natural system elements in agroecosystems and the way these are managed by humans. Now we will begin to take a larger, whole systems view of food systems.
Please watch the below video celebrating world food day 2013, which describes the Vietnamese “Garden, Pond, Livestock Plan” (V.A.C) food system.
Video: World Food Day 2013 [4] (6:52)
Food Systems: Environments, Production, Distribution, and Household Utilization of Food
Food Systems: Environments, Production, Distribution, and Household Utilization of Food
The introductory section below is adapted from "Chapter 3: The food system and household food security” at the document website of the United Nations Food and Agriculture Organization [5] (FAO).
This section attempts to describe the parts of a food system in basic terms, starting from the standpoint of the systems approach. It begins, "the perception underlying the systems approach is that the whole is greater than the sum of its parts. Any situation is viewed in terms of relationships and integration. A food system may thus include all activities related to the production, distribution, and consumption of food that affect human nutrition and health (see Figure 10.1.1, which is reproduced from module 1).
Food production comprises such factors as the use of land for productive purposes (land use), the distribution of land ownership within communities and regions (land tenure), soil management, crop breeding and selection, crop management, livestock breeding and management and harvesting, which have been touched on in previous modules. Food distribution involves a series of post-harvest activities including the processing, transportation, storage, packaging, and marketing of food as well as activities related to household purchasing power, traditions of food use (including child feeding practices), food exchanges and gift-giving and public food distribution. Activities related to food utilization and consumption include those involved in the preparation, processing, and cooking of food at both the home and community levels, as well as household decision-making regarding food, household food distribution practices, cultural and individual food choices, and access to health care, sanitation, and knowledge.
Among the components of the food system, e.g. food processing, communication, and education, there is substantial overlap and interlinkage. For example, household decision-making behavior with regard to food is influenced by nutrition knowledge and by cultural practices with regard to food allocation within the household as well as by purchasing power and market prices."
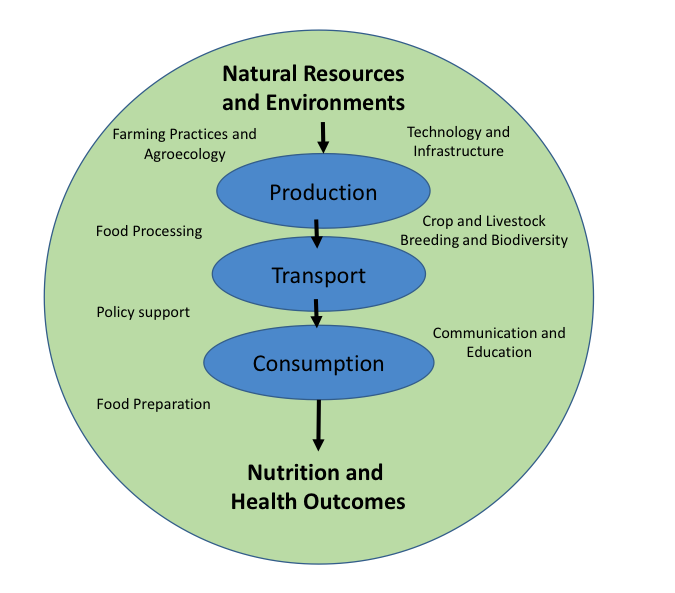
Food systems are further embedded in environments and societies (thus, both natural and social/political contexts) which differ according to a variety of factors such as agroecology (the composition of the local agroecosystem, see previous modules), climate, social aspects, economics, health, and policy. The model presented in Figure 10.1.1 above is useful in conceptualizing the various activities that determine food security and nutritional well-being and the interactions within the food system."
Two important features that we want to emphasize in the passage above from the FAO are first, the fact that food systems involve processes at multiple scales (e.g. local agroecosystems, government policy at a national scale, international research and technology development), which eventually have many impacts at a household scale, either in the livelihoods of food producers (who gain income from the food system and also consume food); and also for consumers around the world. Second, criteria with which we should evaluate food systems are their ability to deliver nutrition and health outcomes (see e.g. module 3), and also the sustainability of natural resources and environments, which we will consider in module 10.2. We note that these criteria of environmental sustainability and health are at opposite ends of this "conveyer belt" model of food systems, where the food system "conveyer belt" can be said to deliver nutrition and health outcomes by transforming the inputs from natural resources and environments. These health and nutrition outcomes are associated with the concept of food security (sufficient access to appropriate and healthy food) which was introduced in module 3 and will be further explored in module 11. Human health and environmental sustainability correspond roughly to the positive objectives that we conceive of for the human system and natural systems, respectively: health and equitable nutrition (or food security) in the human system, and environmental sustainability of natural systems. A final observation from Fig. 10.1.1 is that food systems are ubiquitous and touch on all aspects of human societies. We are all participants in food systems, either as producers, consumers, in the distribution or in other myriad ways.
Activate Your Learning: Food's Journey in the Food System
Food systems comprise the interacting parts of human society and nature that deliver food to households and communities (see the previous page), and can be used to understand food in its relation to the earth system. To better understand food systems, in the exercise below you'll be asked to consider a familiar food of your choice, and the journey this food takes from where it is produced to the meals that we consume every day. Within the food supply chain for this food, you'll be asked to distinguish between social (human system) aspects and environmental (natural system) aspects of that product's food production and supply chain.
Activate Your Learning Activity:
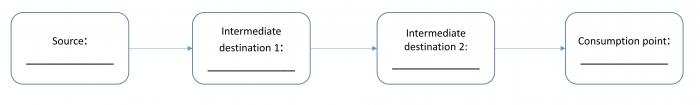
In the blanks below, fill in the blanks regarding the supply chain for food products. You can also download the worksheet [7] for filling in offline, or as part of a classroom activity. As depicted in Fig. 10.1.3, you’ll need to give the origin, some intermediate destinations, and then the final consumption point for the food product. Then you should think of some social or human system dimensions of the production, supply chain, or consumption of this product, as well as some ecological or natural system dimensions and fill in the corresponding blanks. Do this first for a product familiar to you, whose supply chain you either know about or can research quickly (part 1). Then repeat the activity for a food product in the online introductory video from the first page of this module, about food systems in Vietnam (part 2). When you are done with each part you can click on the ‘answers’ link in the below each part, and see how your answers match up.
Fill in the blanks below. If you are doing this online, just note your answers on a piece of paper regarding the food product you have chosen, or download the worksheet [7]. When you are done you can click on the ‘answers’ link below to see some possible examples and see if your answers match up with these answers.
- Food product ______________________________
- Food supply Chain:
- Source: Where main raw material is produced, fished, hunted: ___________________________
- Intermediate destination 1: ___________________________ (e.g processing plant, washing, trucking, warehouse, etc.)
- Intermediate destination 2: ___________________________ (e.g processing plant, washing, trucking, warehouse, etc.)
- Intermediate destination 2: ___________________________ (if needed)
- Consumption point: ___________________________
- Up to three social or human system dimensions of this food chain (e.g. policy, economic, or cultural factors associated with the production and consumption of this food, recall the Human System factors in a Coupled Human Natural Framework, module 1.2)
- _______________
- _______________
- _______________
- Up to three ecological or natural system dimensions of this food chain: (ecological factors would include crop and animal species, agroecosystems, climate, water, and soil influences on food production):
- _______________
- _______________
- _______________
Example answers
(These may be a good deal more complete than your examples but give a sense of the range of possible answers)
Example Answer 1 - frozen, breaded fish filet from a local supermarket:
Click for the answer.
- Frozen, breaded fish filet (i.e., the fish part)
- Food supply chain:
- Fishing boat in Atlantic, Chinese, or Alaskan Fishery, e.g., including flash-freezing.
- Preparation facility in Canada or U.S.
- Cold chain shipping / Supermarket
- Kitchen oven and dining table for food preparation and consumption.
See some fascinating details about the production process, in How It's Made [8].
- Social dimensions:
- Financing, organization, and contracts for a fishing fleet and processing
- Government and fishing communities’ agreements on fisheries regulation to avoid overfishing.
- Supermarket companies
- Ecological dimensions:
- The wild fish species itself
- Food sources for the fish (algae, other fish)
- Changing ocean temperatures and conditions with climate change
Example Answer 2 - Bagel or bread from a local bake or coffee shop:
Click for the answer.
- Baked good (i.e., flour it is made from)
- Food supply chain:
- Farm in Midwest or Western U.S.
- Grain elevator purchasing and storing grain
- Flour production facility
- Café or restaurant kitchen (may be a large centralized kitchen for a chain restaurant) and coffee shop table for consumption.
- Social dimensions: (could include any of these)
- Farm enterprise belonging to a farm family or company – organization of production labor and agroecosystem management.
- Supply chains and companies for fertilizers, seed, and other agricultural inputs
- Government policies regulating subsidies to farmers, tax on diesel fuel, pollution regulations etc.
- Grain commodity markets and corporations
- Ecological dimensions:
- Domesticated wheat species (Triticum aestivum)
- Prairie soils (Mollisols) with inherent good qualities and climate for wheat growing
- Soil bacteria breaking down organic matter, releasing nutrients, accessing fertilizer N and releasing nitrous oxide.
- Bread yeast and/or sourdough bacteria used in bread making.
Exercise 2:
Recall the video celebrating world food day 2013, World Food Day 2013 Video: the Vietnamese “Garden, Pond, Livestock Plan” (V.A.C) food system" [4]. You may want to quickly skim the video again and note the food pathways that foods are following in these systems. Then choose either a product that is consumed within the household that appears in the video or one that is sold outside the household (some products fit into both categories). Fill in the same set of production and transport steps for this product as you did in part 1, as well as some social and ecological aspects. You can use a piece of scrap paper or the downloaded worksheet. Note that a product consumed in this farming household may have a very short food supply chain!
Look at the following worksheet and fill in the blanks corresponding to the blanks below. When you are done you can click on the ‘answers’ link to see some possible examples and see if your answers match up with these answers.
- Food product ______________________________
- Food supply Chain:
- Source: Where main raw material is produced, fished, hunted: ___________________________
- Intermediate destination 1: ___________________________ (e.g processing plant, washing, trucking, warehouse, etc.)
- Intermediate destination 2: ___________________________ (e.g processing plant, washing, trucking, warehouse, etc.)
- Intermediate destination 2: ___________________________ (if needed)
- Consumption point: ___________________________
- Up to three social or human system dimensions of this food chain (e.g. policy, economic, or cultural factors associated with the production and consumption of this food, recall the Human System factors in a Coupled Human Natural Framework, module 1.2)
- _______________
- _______________
- _______________
- Up to three ecological or natural system dimensions of this food chain: (ecological factors would include crop and animal species, agroecosystems, climate, water, and soil influences on food production):
- _______________
- _______________
- _______________
Example Answers
Example for the Vietnam VAC food system example:
Click for the answer.
- Food Product: Fish from the fish pond in the video
- Food supply chain (if sold):
- Brought from pond
- Transported by cart or truck to city
- Sold in market
- Prepared at home
- Brought from pond
- Prepared and eaten.
- Social dimensions: (could include any of these)
- Farm enterprise belonging to a farm family – production roles of family members
- Government policies promoting choice by farmers of what to grow and the ability to market it (note as a communist government there was a time when this was not allowed)
- Government and community efforts to promote and adapt the V.A.C. food production methods.
- The organization of local markets and food sellers that allows farmers to sell products.
- Ecological dimensions:
- Fish species e.g. carp
- Pond / Garden agroecosystem
- Recycling of organic wastes from fish production into soils
- Rainy climate/river delta geography and abundant water for fish and crop production.
Spatial Scale and Typologies of Food Systems
Spatial Scale and Typologies of Food Systems
A good way to understand the complexity of different types of food systems is to look for organizing principles to classify them. In the introductory food supply chain exercise at the beginning of this module, if you chose a product that was produced a long distance from where you consumed it, you are aware that the global food system today handles food at an enormous spatial scale. This example leads to one way to organize our understanding of food systems, which is the hierarchy global, regional, and local scales of food systems (Fig. 10.1.4).
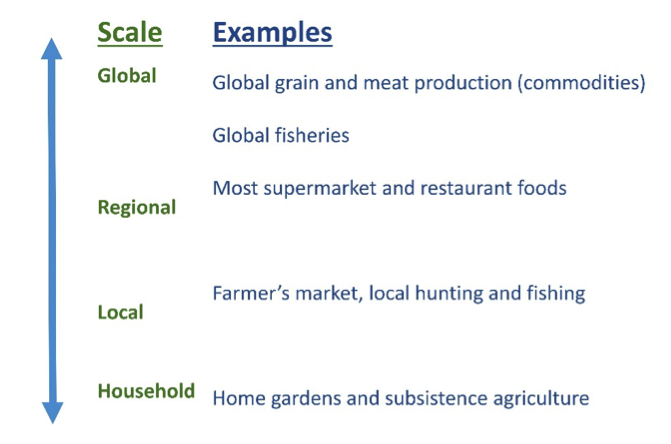
| Scale | Examples |
|---|---|
| Global | Global grain and meat production (commodities), Global fisheries |
| Regional | Most supermarket and restaurant foods |
| Local | Farmer's market, local hunting and fishing |
| Household | Home gardens and subsistence agriculture |
Another helpful way to classify food systems is to look for typologies of food systems. Building typologies is a somewhat subjective but often helpful process where we look for groups of systems or components that hang together in order to better understand their function, importance, or other attributes. For the typology of food systems we present here, we are thinking about classifying food systems based on how production occurs and at what scale, which portions of society are involved in production and distribution, and the rationale underlying production, distribution, and consumption. In this course, we use the scheme of three overlapping food systems that exist at global, regional, and local scales shown below in Fig. 10.1.5.
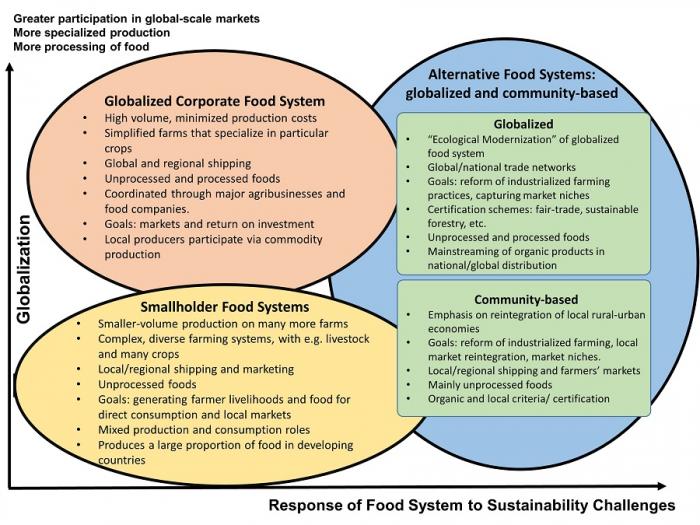
Global Corporate Food System
- High volume, minimized production costs
- Simplified farms that specialize in particular crops
- Global and regional shipping
- Unprocessed and processed foods
- Coordinated through major agribusinesses and food companies
- Goals: markets and return on investment
- Local producers participate via commodity production
Smallholder Food Systems
- Smaller-volume production on many more farms
- Complex, diverse farming systems with e.g. livestock and many crops
- Local/regional shipping and marketing
- Unprocessed foods
- Goals: generating farmer livelihoods and food for direct consumption and local markets
- Mixed production and consumption roles
- Produces a large proportion of food in developing countries
Alternative Food Systems: Globalized and Community-based
- Globalized
- "Ecological modernization" of globalized food system
- Global/national trade networks
- Goals: reform of industrialized farming practices
- Certification schemes: fair-trade, sustainable forestry, etc
- Unprocessed and processed foods
- Mainstreaming of organic products in national/global distribution
- Community-based
- Emphasis on reintegration of local rural-urban economies
- Goals: reform of industrialized farming, local economies
- Local/regional shipping and farmers' markets
- Mainly unprocessed foods
- Organic and local criteria/certification
The Globalized Corporate Food System
The Globalized Corporate Food System
Consumers worldwide who enter a supermarket are largely interacting with this type of food system. Some local and regional products are provided, but food is largely sourced from major national and global production regions and can be transported long distances (100 to thousands of miles or km) with enormous quantities of food moving through the system as a whole. There is an emphasis on modern production and processing techniques, efficiency, and lowering the immediate costs of production. Also, many of the products moving through this system are thought of as commodities: products that are generic and replaceable regardless of their origin and that carry standard global and national pricing frameworks. Examples would be corn grain for food, different grades of rice, soy and corn oils, supermarket potatoes and tomatoes, and cuts of pork for supermarket consumption.
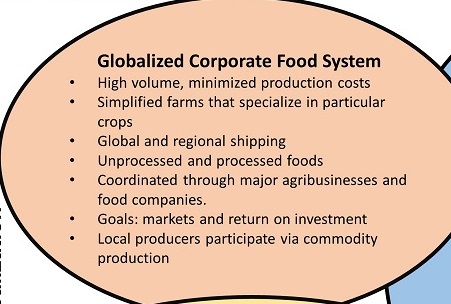
Globalized Corporate Food System
- High volume, minimized production costs
- simplified farms that specialize in particular crops
- global and regional shipping
- unprocessed and processed foods
- coordinated through major agribusiness and food companies
- goals: markets and return on investment
- local producers participate via commodity production
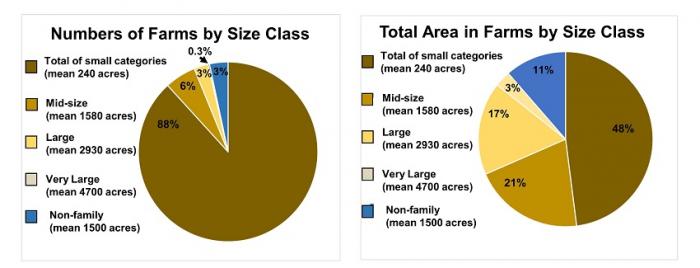
Calling this a ‘corporate’ system may obscure the fact that production for this national/global scale system occurs most commonly not on corporate property or company farms, but in family farm enterprises like the thousands of dairy and grain farms that populate many regions of the United States. For example, family farms still constitute about 97% of farms in the United States by number, although the acreage in company-owned farms and the value earned by these company-owned farms is larger than this numerical count suggests (top pie-charts within Figure 10.1.8a below). Also, in some areas of the country, ‘large’ and ‘very large’ family farms have mean farm sizes of many thousands of acres, which contradicts the traditional image of a small family enterprise, and illustrating the pressures for farms to become large in modern industrialized food systems, in order to take advantage of economies of scale in farming (economies of scale refers to the idea that as the size of an enterprise goes up, the efficiency of producing a given item goes up and the cost per item goes down, e.g. baking one tray of muffins every Saturday versus opening a muffin shop making hundreds of muffins every day).
Nevertheless, this portion of the food system is called both ‘global’ and ‘corporate’ because most organizations that coordinate demand and organize processing and distribution of foodstuffs in this layer of the global food system are corporations seeking benefit for their shareholders. In module 3 on nutrition we discussed the way that food has become fiscalized, i.e. it is not only a product working its way through a marketplace to consumers but an active object of investment in the future growth potential of the business of food. These investments are managed through large-scale exchanges like the stock exchange here in the United States. These exchanges allow large swaths of relatively wealthy world citizens (including many in the middle class) to invest in the large-scale production of food and reductions in prices, but can create sustainability issues within the food system because the return on investment rather than food security or environmental sustainability becomes the predominant objective of investors and corporations. Nevertheless, not just corporate entities but also government and civil society (e.g. farmer and community organizations, universities) are also heavily involved in these global systems and can act to reform problems or regulate damaging or unjust practices. They act by way of advocacy and regulation, national/international food policies and support structures such as research on food production and food processing methods.
Within this global system, then, local farmers and fishing communities often act as producers selling into commodity markets, alongside industry-owned farms, feedlots, and other production facilities. In addition to unprocessed food ingredients, the globalized corporate food system has also been largely responsible for the expansion in processed and prepared foods, that seeks to provide convenience for consumers as well as capture the added market value of more prepared foods. Processed foods have been criticized, especially by those advocating community food systems (see description further on), because they displace fresh and whole food components of diets that are important to good nutrition outcomes (see module 3). Processed foods often contain processed industrial ingredients such as corn syrup and processed, low-quality fats along with a lower fiber and vitamin content, which is usually not true of whole unprocessed foods.
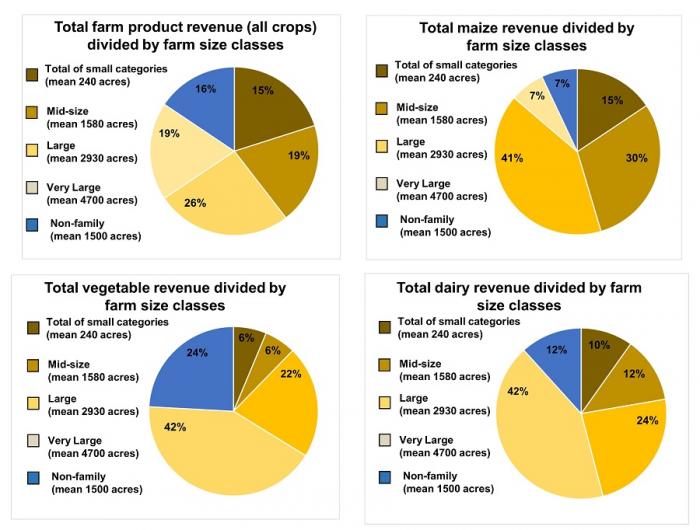
Farms and acreage of different crops in United States agriculture:
The pie charts below demonstrate aspects of the description of the globalized food system above. For example, at least in terms of numbers, smaller, family-owned farms with an average size of approximately 240 acres (around 100 hectares with one hectare = 100 x 100 m) dominate the numbers of farms in the United States (Fig. 10.1.8a). Nevertheless, large farms dominate to a greater extent than these smaller farms when considering the total area taken up by farms of different sizes, and a large proportion of income is going to larger operations in a number of classes of farm products (Fig. 10.1.8b). These patterns vary somewhat by what sector of the farming economy is being described, and we include some separate graphs for maize, vegetables, and dairy farms. You will use these graphs in the knowledge check activity below.
Knowledge Check: Food products and farm sizes in U.S. agriculture
Choose the correct answers based on the graphs in Figure 10.1.8 above and then click on the space for the correct answers.
Question 1 - Short Answer
Which food product type (maize, vegetables, dairy) above had the largest participation of non-family owned farms, in terms of revenue from sales of that food product type?
Click for the answer.
Vegetables. This means that in Maize and Dairy production, family-owned farms are more important in terms of total earnings.
Question 2 - Short Answer
Which crop type above has the largest participation of family-owned farms in the SMALL category, in terms of value sold?
Click for the answer.
Maize
Question 3 - Short Answer
These charts don’t show the large variation that exists in the distribution of farm sizes around the country, which you will want to incorporate into your capstone project for your capstone region. If you have looked up this information for your capstone, does your capstone region have a smaller or larger average (or median) farm size?
Click for the answer.
Here are some answers for different regions of the country that should help you to estimate how farm size varies: California – in line or larger than these figures; Colorado: in line with these figures on farm size; Pennsylvania: smaller. In particular, the Pennsylvania dairy sector is much less dominated by very large and corporate farm holdings. This is information you will be able to find in the USDA Census county-level reports, which give a breakdown on farmland areas for each county in the United States.
Question 4 - Short Answer
How do you think the “small” category of U.S. farms in land area (236 acres or just under 100 hectares) compares to the average landholdings of the “small” category for countries like Peru, Kenya, or India where smallholders (farmers on relatively small land areas) are a large part of the population?
Click for the answer.
The median small farm size of smallholder farmers in these countries is much smaller, often 10 acres (3-4 hectares) or less, which is less than a tenth of the "small" family farm in the united states.
Smallholder Farmer Food Systems
Smallholder Farmer Food Systems
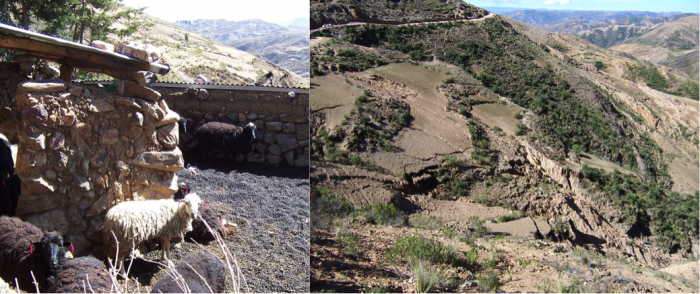
Approximately 500 million smallholder farms with areas less than 2 hectares (5 acres) support the nutrition and livelihood of approximately two billion people in smallholder farms globally (IFAD, 2013). As such smallholders form an important sector of the global food system, producing up to 80% of local and regional food supplies in Sub-Saharan Africa, South/Southeast Asia, and China. You saw an example of a smallholder system in the summative assessment for module 1. Livelihood strategies of households in this system attempt to overcome risk and guarantee subsistence as well as cash income. For this reason, these "semi-subsistence" farming systems are often complex, for example integrating agriculture, livestock, and agroforestry food production with off-farm livelihood activities that overlap with consumption from the globalized food system (previous page). Most food is consumed either on the farm where it is produced or locally and regionally, with transport and distribution handled by relatively short-distance networks.
Alternative Food Systems: Global and Local Variants
Alternative Food Systems: Global and Local Variants
"Quasi-Parallel" Alternatives to Modern Food Systems
You may recall that the concluding section of module 2 on the history of crop domestication and food systems we presented the recent development of alternatives to the modern globalized food system as "quasi-parallel" new movements as well as food production and distribution strategies intended to address sustainability issues. We use the word "quasi-parallel" because the global and local variants of these responses focus on different strategies and scales within the food system, and target different outcomes, even though both consider themselves to be responding to the sustainability challenges in the modern food system, sometimes using similar practices at the farm scale for managing crops and soils. Also, we acknowledge at the outset that dividing these strictly into two variants may not cover every case. The intention is to give you a sense of the range of alternatives being proposed so that you can potentially look for these types of alternative food systems in your capstone regions and integrate them into proposed sustainability strategies for the future of food in these regions. Also, it is likely that both variants will have advantages and disadvantages that are pointed out and debated by proponents and critics. From this debate we can see that sustainability is a contested concept, depending on the assumptions, goals, and arguments used by different advocates: it does not have a single definition to different camps in the debate over sustainability.
Globalized Alternatives: "Ecological Modernization" as a Reformation of Globalized Food Systems
Globalized variants of alternative food systems seek to correct issues of sustainability from within the framework of global food production and food trade networks. This has been called a case of "ecological modernization" because it seeks to reform certain aspects of globalized corporate food systems (previous pages) such as environmental impact and labor standards, while not altering the main features of the modern global system, for example, large scale of production, long-distance distribution, and leveraging the economic power of global investment to expand production and increase efficiency. Advocates of this approach promote strategies such as the "triple bottom line" for companies, which refers to positive environmental and social benefits from company activities being measures of company success in addition to economic profitability (thus a triple measure mirroring the "three-legged stool" of sustainability, see Module 1 and following pages in this module). Advocates also generally point to the fact that given the globalized corporate food system embodies by far the largest impact on levels of social equality and natural systems currently, reforming its activities and standards for performance is a way to have a tremendous impact on global sustainability. Detractors of "ecological modernization", including advocates of community-based food systems below, complain that these reform efforts leave in place unsustainable features of the system, such as large-scale production that is corrosive to local communities, or marginalization of smallholder farmers within markets or in land distribution in some cases (see the "agriculture of the middle" critique and the concept of a poverty trap in the following pages).
Notwithstanding this debate, it is useful to note some main features and trends in this globalized approach. Like the community-based variant, the globalized variant has prescriptive goals for the food system in response to sustainability problems of the modern food system. It supports substitution of more sustainable methods of food production, such as integrated pest management, organic methods, reduced tillage, and protection of watersheds from pollution with improved farming techniques, some of which have been seen in previous modules. Certification schemes are promoted that hold producers and distribution networks to a higher standard, such as organic certification (which generally must conform to standards in the country where the food product is sold). As another example, fair trade certification seeks to improve the price paid to local producers in source regions, who have generally received very low prices for their products, and thus shares the approach of strengthening local economies with the community-based approaches below, even if it uses global trading networks.
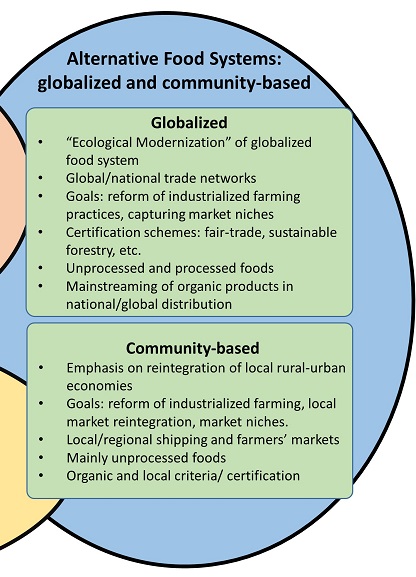
Alternative Food Systems: globalized and community-based
- Globalized
- "ecological modernization" of the globalized food system
- global/national trade networks
- goals: reform of industrialized farming practices, capturing market niches
- certification schemes: fair-trade, sustainable forestry, etc.
- unprocessed and processed foods
- mainstreaming of organic products in national/global distribution
- Community-based
- emphasis on reintegration of local rural-urban economies
- goals: reform of industrialized farming, local market reintegration, market niches, local/regional shipping and farmers' markets
- mainly unprocessed foods
- organic and local criteria/certification
Community-based Alternatives
Like the globalized variant, community-based alternative food systems define prescriptive goals but oppose many elements of the globalized corporate food system. The community food system primer (Wilkins and Eames-Sheavly 2010, see link below if further interested) states that "a community food system is a food system in which food production, processing, distribution, and consumption are integrated to enhance the environmental, economic, social and nutritional health of a particular place". Three examples of these prescriptive goals within common components of community food systems are:
- Organic agriculture as a way to reduce contamination of food with pesticides and improve the ecosystem health of farms
- Farmers markets and community-supported agriculture schemes that allow consumers to more directly support the activities of farmers
- An emphasis on supporting the activities of small and medium producers and resisting pressures for production and distribution enterprises to grow larger and larger
Many other examples of community food systems can be found, which also include efforts to link smallholder farmers and their food production systems (see previous page) as producers for burgeoning urban markets in developing countries, thus substituting some of the supply from the globalized corporate food system beyond the food products that are already supplied by smallholders to cities in these countries. The overall volume of food handled by these community-based food systems is generally much smaller than the globalized or smallholder types of food systems. Nevertheless, advocates point out that the potential market of urban consumers in relatively close proximity to small-scale producers around the world is potentially enormous. In fact, channels of alternative food production and distribution (e.g. organic agriculture) are among the fastest growing sectors in volume and economic value on a percentage basis, year after year [USDA-Economic Research Service [9]].
Additional Reading:
- "A Primer on Community Food Systems” [10]: Read the Introduction, Community Food Systems, and Goals of Community Food Systems.
Knowledge Check: Food System Typologies
For each of the following concepts, give which of the three types of food systems it pertains to (global corporate, smallholder, local/alternative).
- Shareholders invest in food companies
- Fairtrade organizations link smallholders in Kenya to consumers in the U.K.
- A dairy farmer sells small lots of milk using weekly deliveries to a mid-size city in New Hampshire.
- Most supermarket items
- Very important in densely populated rural areas of the developing world e.g. Ethiopia, Peru.
- Buying butternut squash at the local farmers market.
- Large wheat fields near Ciudad Obregón, Mexico for export to processors in Mexico, United States, and Colombia.
Scoring your answers to the knowledge check:
Click for the answer.
- global corporate
- global alternative
- local community-based, alternative
- global corporate
- smallholder
- alternative community based
- global corporate
Challenges to Producers: Sustainability and "Poverty Traps"
Challenges to Producers: Sustainability and "Poverty Traps"
- Environment
- reduce pollution and waste
- use renewable energy
- conservation
- restoration
- Community (and social sustainability)
- good working conditions
- health care
- education
- community and culture
- Economy
- employment
- profitable enterprises
- infrastructure
- fair trade
- security
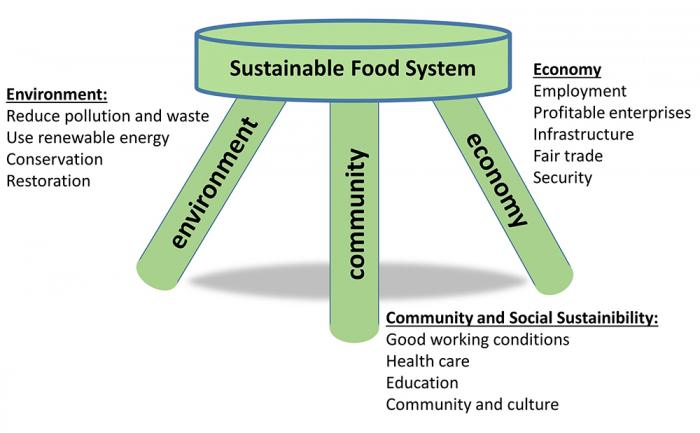
Challenges to Food Producers: The issue of scale and the “three-legged stool” of sustainability
The previous page on different variants of alternative food systems stressed different ways of analyzing and critiquing the modern global food system based on issues of sustainability. In your capstone projects, you are asked to propose ideas for sustainable food systems in your capstone regions. Therefore, in this page, we repeat from module one the concept of sustainability as a "three-legged stool" combining aspects of environmental, social, and economic sustainability (Fig. 10.1.15, also seen in module 1). We may be most used to thinking about Environmental Sustainability, for example in the need to conserve energy or recycle food containers to reduce pollution and energy generation by fossil fuels, as well as avoiding litter and saving on landfill space. As we presented in module 1, however, sustainability also contains economic or financial aspects devoted to employment, livelihood, and profitability, as well as the concept of social sustainability that embodies goals of social equity and more harmonious societies. Therefore, we are also interested in the nodes of food production such as farms because of the challenges to the economic sustainability of farm (and fishery) enterprises. It is important to think about economic sustainability because of the economic risks that food producers are exposed to. Economic risk is inherent in producing for local, regional and global food systems because producers may not be producing high-value products and must absorb environmental risk, for example from droughts, floods, or pests (see the previous modules, and module 11, next, regarding adaptive capacity). In a drought year, for example, selling vastly reduced yields of soybean or maize crops usually mean an economic loss for a farm because the price of these crops is not very high on the global or local market.
In addition, social sustainability concerns regarding food production are an important part of debates about modern society: for example, smallholder farmers, and laborers on larger farms and within fisheries in the United States and globally, are some of the most economically and politically marginalized populations in the world. Many researchers and advocates point out that food systems cannot be truly sustainable until they embody a more just distribution of resources and power. In this short section, we want to highlight two important concepts that link to these ideas of social sustainability and justice: first, the idea of “poverty traps” within smallholder farming around the world (see Carter and Barrett 2006, reference below), and on the next the threat posed to so-called “agriculture of the middle” in industrialized countries where pressures on producers lead either to a small-scale, niche markets orientation (e.g.. farmers markets) or an inexorable growth toward larger and larger farms that capture economies of scale in agriculture. By introducing these concepts now, you should see both how they fit into the analysis of vulnerability and resilience in the next module. You may be able to incorporate these challenges and potential solutions into your capstone region scenarios.
What is a poverty trap in smallholder agricultural systems?
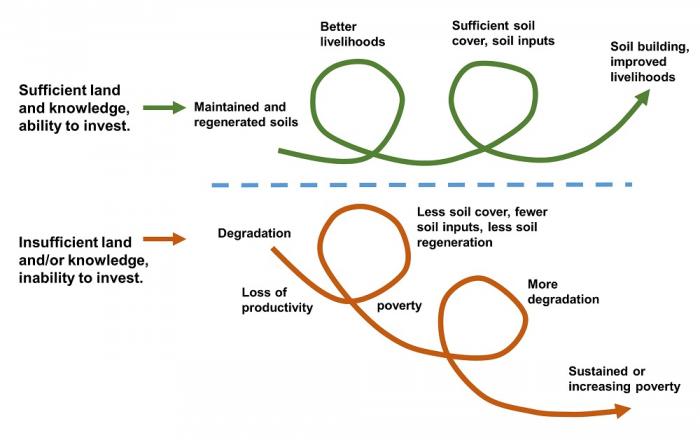
As you’ve seen in the “pond-garden-livestock” (VAC) system of Vietnam in the video at the beginning of this module, agriculture practiced in smallholder food systems on small plots of land (less than 10 acres or 4 hectares, say) around the world is a hugely important and often quite sustainable enterprise. Smallholder agriculture can embody some of the most efficient use of resources in use today, whether these are traditional methods, well-adapted domesticated plants, new innovations taken up by smallholder families, or labor that is efficiently allocated by a family that is in constant contact with their enterprise and ecosystem. However, a concern about the most impoverished smallholders is that they can fall into what is called a poverty trap, where smallholders produce food from a degraded resource base, either because they have degraded it or because they have been forced to the margins of local society, and many times, both. The diversity of diets can also suffer when the least expensive food sources are local cereal and starch crops or calories coming from the globalized food system. The combination of poverty and degradation of soils and other resources does not permit these farmers sufficient income or well-being to invest in and therefore improve their soils or other aspects of local agroecosystems, and so it is likely that they, and their farm ecosystems, will remain in a low level of productivity and earnings. This is therefore called a poverty trap, and it essentially combines a lack of economic, social, and environmental sustainability for these smallholder households. It has also been linked to the concept of a downward spiral of poverty and soil degradation (Fig. 10.1.16).
An example of this poverty trap "downward spiral" is furnished by the dust bowl of the 1930s in the United States, in the case of many families who farmed small plots of land during the depression. The combination of overexploited soils from decades of agricultural expansion after the U.S. civil war, a depressed economy contributing to overall hardship, and a multi-year drought led to a downward spiral in which many poor farmers were finally forced to leave their land and migrate to other areas of the country seeking employment and public assistance. In module 11, we'll examine further how combined human and natural system factors (like poverty and drought, for example) interact to create vulnerability for parts of human society, and ways that human systems have adapted to surviving such shocks and perturbations as drought. We'll include an example of a native American population that was relatively successful in weathering the Dust Bowl and was not subjected to this sort of poverty trap or downward spiral. Also, in the years after the dust bowl, the Soil Conservation Service of the United States Department of Agriculture (USDA) was highly active in helping farmers to transition to practices that helped to avoid soil erosion and aid in regeneration of degraded soils (see the additional reading resources below for this history of the Soil Conservation Service).
In current-day contexts where poverty traps represent a risk or chronic problem for small producers, then, both government agencies and development organizations focus on reducing barriers to practicing more sustainable agriculture. Development organizations include those called non-governmental organizations or NGOs, nonprofits, international aid organizations, as well as organizations founded by and managed by farmers themselves. For example, see the blog article below in "additional reading", regarding efforts to promote agroforestry in Haiti, where poverty and land degradation have long been intertwined. These organizations try to reduce barriers to investment in sustainable food production through the promotion of simple, low-cost strategies to conserve soils and raise crop diversity and productivity (see the previous modules for examples) that are within financial reach of smallholder producers. These technology options are optimally combined with credit and direct aid that helps farmers to overcome the resource barriers for investing in the protection of the natural systems that sustain their production. This sort of knowledge and technology, and the ability of farmers to invest in the productivity of their soils are an example of adaptive capacity, a concept that will a major topic of module 11. In addition, government, NGOs, and farmer organizations may also engage in political advocacy that seeks a more just distribution of land, credit, or access to markets that can help producers to avoid or move out of poverty traps.
Additional Reading:
- Carter, Michael R., and Christopher B. Barrett. "The economics of poverty traps and persistent poverty: An asset-based approach." The Journal of Development Studies 42.2 (2006): 178-199.
- Jacquet, Bruno: blog article, Agroforestry & Sustainable Land Management in Haiti [11], documenting efforts to promote agroforestry in Haiti with smallholder farmers.
- Natural Resource Conservation Service (USDA): web page giving a brief history of the dust bowl and the soil conservation service, which became the Natural Resource Conservation Service [12].
Challenges to Producers: Sustainability and "Agriculture of the Middle" in Globalized Food Systems
Challenges to Producers: Sustainability and "Agriculture of the Middle" in Globalized Food Systems
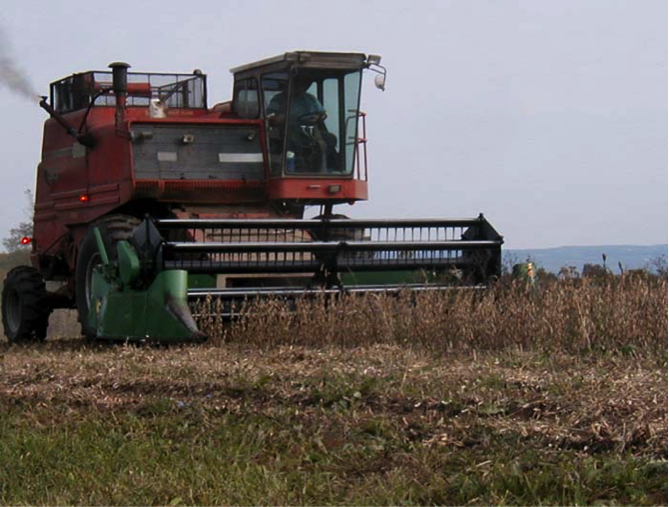
One of the characteristics of a globalized food system is that a smaller proportion of the population is needed to produce the large amounts of food for the global system. As a result, many analysts have noted shrinkage of the rural population in the rural United States over the last 100 years. Similar out-migrations from rural areas to cities have happened in Europe. Among other factors, this process has been hastened by the use of mechanization for agriculture (tractors, combine harvesters, mechanized crop processing, and transportation; we analyze the environmental impact of this in module 10.2). Mechanization and other factors mean that the cost of producing a bushel of corn, for example, and moving it into the global food system is cheaper when the scale of the farm and transportation infrastructure is larger. This phenomenon is referred to as economies of scale (recall also the example of dramatically scaled-up beef production in Greely, Colorado featured in the video of Module 1.2.) Farm producers in the United States and other industrialized economies thus often face pressures to grow their operations larger so that they can become more profitable, accentuated by competition against larger producers with lower prices, sometimes in other countries with lower labor prices.
These twin trends towards “get big or get out” and “get small for local markets” have left out a huge sector of farms that are mid-sized and that still generate a substantial amount of farm income in the U.S. economy and utilizing the lion’s share of cultivated soils (see figure 10.1.8 with pie-charts of earnings distributions different size farms in the United States). The analysis regarding this “Agriculture of the Middle” (Kirschenmann 2012) points out the threat posed to millions of farming households, most of whom produce for national and global commodity markets (e.g. soybeans, dairy). This analysis also points out that this sector of farms is vital as productive rural citizens that drive social organization, effective policy-making, and community values in most regions of the country. These mid-size farms are often leaders in the adoption of sustainable practices – especially when they are financially successful, illustrating potential linkages between financial and ecological sustainability. In any case, small and medium-sized farms have always played an important role in the maintenance of a rural landscape that most governments and citizens see as valuable. Agricultural landscapes and enterprises often contribute to the tourism value of a particular region, for example, the Pennsylvania Dutch region or wider presence of dairy farms in diverse, forested landscapes of Pennsylvania, or wine-producing regions of California and New York State.
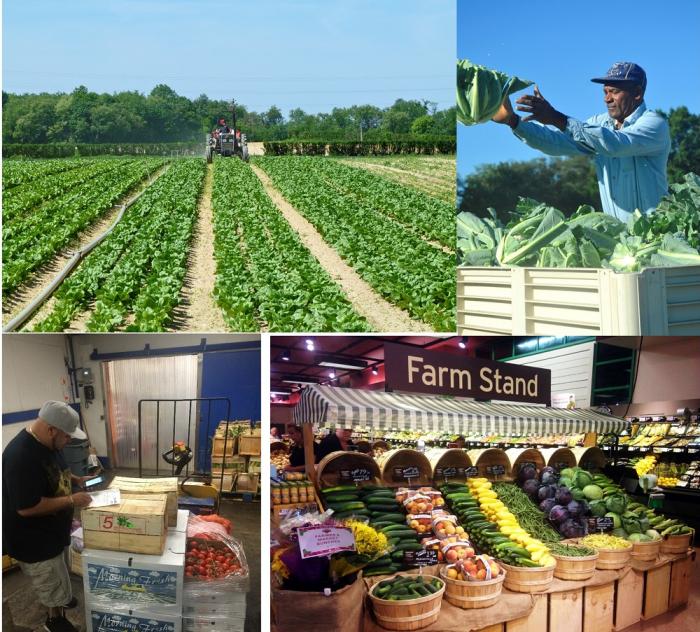
The role of “Agriculture of the Middle” in sustaining rural life according to this analysis is worth protecting, and advocates of this analysis and action to support mid-size farm enterprises point out a few advantages these farms have in interacting with regional farm systems. When effective linkages can be built to regional markets, these farms usually combine production at a medium to large scale (compared to small diversified farms supplying farmers’ markets, say) with a flexible outlook that can allow them to change products and markets quickly, and best adopt sustainable production methods in a way that is visible to consumers and local communities (Kirschenmann 2012). As in the case of poverty traps for small farms discussed above, organizations that promote agriculture of the middle seek to clear barriers to these mid-sized producers. Note also that these “mid-sized” producers are enormous compared to farms in smallholder contexts throughout the developing world, though they are community members in an equivalent way to the role of smallholders in a rural third-world context). Mid-size producers and the food distribution organization that work with them may seek to promote “values-based food supply chains” where not just the commodity value of a food product is taken into account but also the value of a farm that demonstrates environmental sustainability and positive participation in rural communities. For example, many agricultural states now have state-level marketing efforts that promote state and regional agriculture, and these programs increasingly integrate ideas that help to promote mid-sized producers. Farmers, distribution network companies, and food markets have also banded together in different configurations to form networks that seek to support not only food availability for consumers but environmental, social, and economic sustainability along the entire food chain. Some examples of these are the Organic Valley dairy cooperative which now operates across the entire United States, the Red Tomato regional fruit and vegetable marketing effort in New England, U.S.A. (see Fig. 10.1.17 and 10.1.18), or the Country Natural Beef producers in the Northwest United States.
More Information on Values-Based Food Supply Chains
You can view a PowerPoint slide set introducing nine case studies on values-based food supply chains like the ones described above: "Agriculture of the Middle" [13], a research and education effort of the University of Wisconsin.
Integration into the Capstone Project
As you consider the food system of your capstone region, you may want to incorporate references to efforts that support either smallholder farmers in avoiding poverty traps or encourage continued participation of “Agriculture of the Middle” in the regional food system. The formative assessment for this module asks you to address whether you think there are concerns about poverty traps or agriculture of the middle in your capstone region. As you develop your capstone project final scenarios for sustainability, you may want to search on the internet for resources on regional food chains and food systems, as well as local farmers' markets and other initiatives, within your region of interest.
Food Systems as Coupled Natural-Human Systems
Food Systems as Coupled Natural-Human Systems
As you saw in the introductory video about a food system in Vietnam, food systems incorporate both natural and human components. In fact, because of the ubiquitous need for food, food systems are among the most important ways that human societies interact with the physical and biological elements and processes on earth's surface. Land used in some way for food production already occupies over two-thirds of the ice-free land surface (Ellis, 2011 or similar on anthromes) and the trend is for this proportion as well as for the intensity (roughly, the production from each unit of land area) to increase. Human fisheries and other forms of food production from oceans (for example, kelp farming) are also tending to exploit wider and wider areas. In addition, as seen in the multiple types of food systems presented above in section II of this unit, the interactions of human societies with earth's ecosystems in food production is not governed by a single human process but depends greatly on human priorities, land management and food production knowledge, rationales and prescriptive goals for food systems, and government policies that regulate and reward food system outcomes. Understanding these societal factors is key to improving the sustainability of food systems in their impact on the earth's ecosystems.
To understand the interaction of human societies with the earth's surface, a common and productive framework is that of coupled natural-human systems [Liu et al., 2007]. These start from a relatively simple diagram (Fig. 8.9), in which a generic human system (e.g. a community within a human society) interacts with a generic natural system (e.g. a farming-dominated landscape within a production region). The framework also recognizes that natural and human systems have many internal interactions and processes such as biogeochemical nutrient cycling (e.g. the nitrogen cycle, see unit N.N in this course) or the policies, corporate actors, and markets determining food supply chains (a human factor).
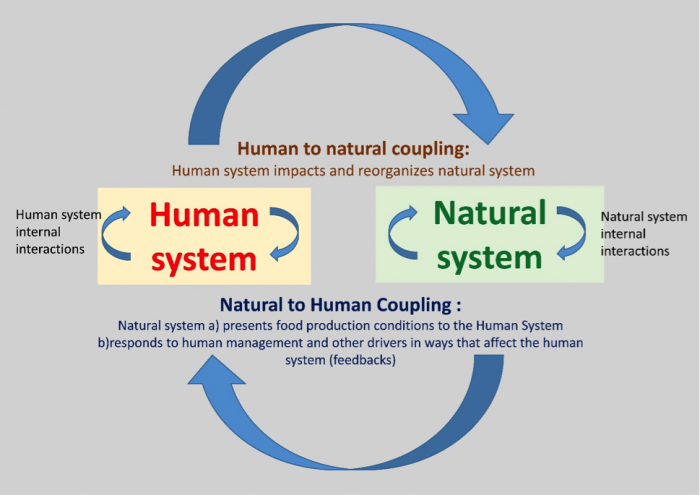
Generic Natural-Human system that can be applied to the food system in its interactions with earth system processes
Arrows labeled human to natural coupling and natural to human coupling form a circle between human system and natural system. Those are defined as follows:
Human system: human system internal interactions
Human to natural coupling: Human system impacts and reorganizes natural system
Natural System: natural system internal interactions
Natural to human coupling: Natural system a)presents food production conditions to the Human System b) responds to human management and other drivers in ways that affect the human system (feedbacks)
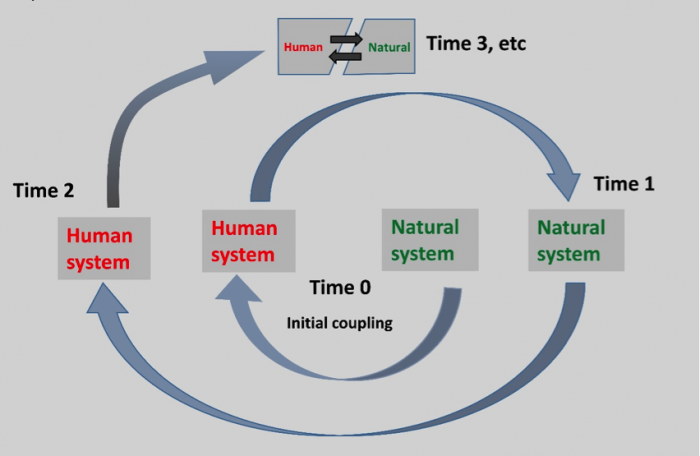
So, for example, in the video that you watched on the food system from the Red River delta in Vietnam, the river delta is the initial, broad natural system context that presents opportunities for farming, livestock production, and aquaculture to farming households and national/local government policies. Human farming/aquaculture knowledge and practices, markets and government policies are part of a human system that impacts and reorganizes the natural system over time into its current state. Over time the natural system internal interactions and processes may also change, for example, increases or decreases in soil fertility, crop pests, or animal diseases. Because of the evolution over time of the system, it is useful to reorganize the coupled natural-human system as evolving over time (Fig. 8.10).
Divergence and Transition of Food Systems: Human-Natural Interactions
Divergence and Transition of Food Systems: Human-Natural Interactions
Overlap and Transition in Food Systems
As a final observation about ourselves as consumers within different food system types, it is important to stress that most consumers and households participate in multiple types of food systems at once. For example, someone in a modern society might consume a breakfast energy bar with globally sourced processed ingredients, along with a fair-trade certified cup of coffee and regionally sourced milk, on the way to picking up sweet corn at a direct-marketing farm stand of a local farmer. In addition, and of special importance for thinking about sustainable scenarios for your capstone project, it is important to find explanations of how transitions occur in food systems from one type of predominant system, to the inclusion of alternatives, or in some cases a wholesale change from one food system type another.
Human-Natural Interactions as Drivers of Food System Variation and Transitions
Recall that in Module two we presented the broad strokes of the history of food systems, from prehistoric times to the modern-day, including the globalized and local-regional variants of alternative food systems that were featured on the previous page of this module. In module two, we presented the idea of drivers and feedbacks that have caused large changes in the environment-food relations over human history (for example, from hunting and gathering to agriculture). In this final page of module 10.1 we want to develop concepts that constitute Coupled Human-Natural Systems explanations or "ways of seeing" that can help to understand two different processes:
- The way that two different and parallel food systems can exist in the same place, based on divergence from a common origin
- The transition from one food system type to another, considering the three major types of food systems and the different variants of alternative food systems.
Both of these ways of seeing may be useful in understanding proposals for sustainable food systems, as well as the issues of resilience and vulnerability of food systems presented in the next module.
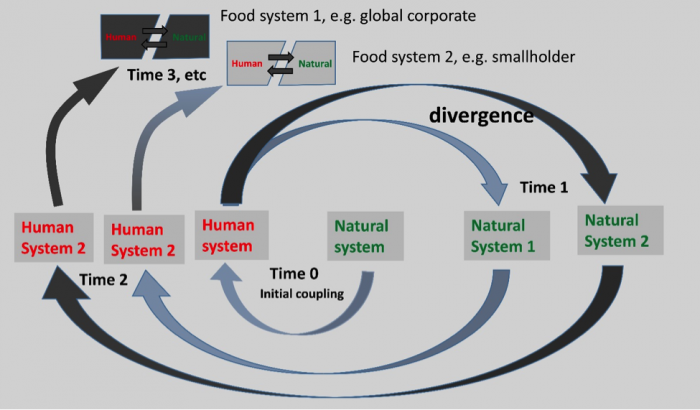
Regarding process (1) above, The fact that food systems develop over time due to the interactions of human and natural systems means that different food systems can develop in the same natural system environment. For example, the same environment or natural system can support either a smallholder type of food system (small plots, less mechanization, local consumption) or a global corporate food system (larger land sizes, more mechanization and industrially-produced soil inputs, global distribution and consumption). It can also support a mosaic of the two types. This overlay of two types is in fact fairly common: for example, smallholder agriculture on smaller plots for mixed home and regional consumption coexists in Central America with the export agriculture of major food commodities such as bananas or vegetables, and often involves marginalization of smallholders to smaller landholdings in less productive and more difficult to manage soils. This mosaic of food system types is also increasingly true in Southeast Asia as globalized agriculture for cassava and maize production for export to China as well as domestic consumption coexists with more traditional smallholder agriculture as portrayed in the Vietnamese "VAC" system in the introductory video for this module. Figure 10.1.19 shows how two parallel food systems can develop in the same environment according to the Coupled Human-Natural System diagram we have seen at other points in the course. Starting at "time 0" in the middle we can see how an initial food system type might develop via human system management (e.g., the smallholder system in the Central American or Southeast Asian case). At "time 1", meanwhile, differences in the human system (say marginalization of smallholders to certain environments, investment in industrial farming in other environments) have created two divergent food system types. These divergent types then develop on their own through times two and three, and into the future, incorporating interactions between human and natural systems that embody the issues of social, financial, and environmental sustainability. As we can see by the Central American and Southeast Asian examples, this parallel trajectory of two different food system types is highly relevant, since it represents exactly what has happened in developing countries that seek to industrialize their agricultural sectors but retain a large rural population practicing smallholder agriculture, often in more marginal regions with greater heterogeneity of environments (e.g. mountainous areas of Central and South America, mosaics of large export-oriented farms alongside smallholder agriculture in South and Southeast Asia as well as Eastern and Southern Africa)
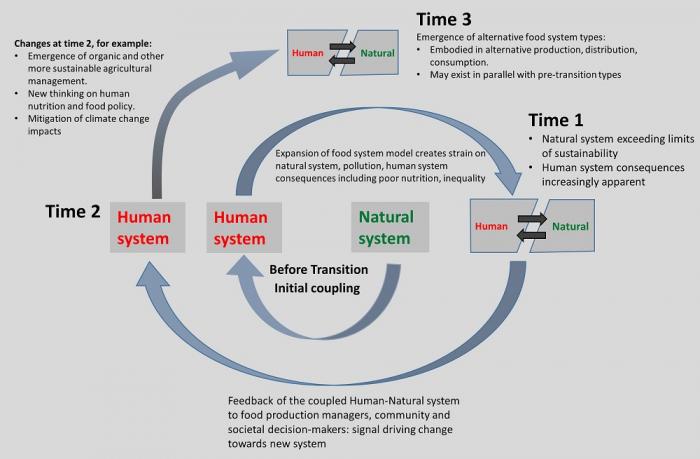
Regarding the transition from one food system type to another (process 2 as listed above), the CNHS diagram (figure 10.1.20 below) can help to understand these transitions. As an example, we'll use the transition to alternative food systems from the globalized industrial food system we described in module two and again in this module. In figure 10.1.19, between the "initial coupling" point at center and "Time 1", expansion of a dominant food system begins to create strains on both the natural and the human components of the system. In the case of the globalized industrial food system that emerged in developed countries (sometimes called the global north) after World War II, this system eventually created strains in the natural and human systems and a critique responding to the unintended consequences of the expansion of this industrial and globalized model. You'll recognize these strains and critique as the same issues of sustainability discussed in the previous modules:, "diseases of affluence" from poor nutrition, food insecurity, concerns about water use and the water footprint of food, soil degradation, pest and weed resistance to pesticide and herbicide management, and others. Between Time 1 and Time 2, the human society thus receives signals from the interactions and drivers within the coupled system, and then responds, in the form of a wide range of new policies and "models" of the new system that emerge during Time 3. In some cases, these responses are modest, for example, a new regulation on fertilizer or pesticide application to moderate the unintended negative consequences. In other cases, the responses are more dramatic and become the alternative food system types described in this module, both global and community-based. These different variants of the transition may increasingly create aspects of a "complete" food system, e.g. production, distribution, and consumption pathways in an integrated whole, as compared to their initial state as outliers, regulations, or policy proposals. Through different drivers and feedbacks from the natural and human sub-systems, a transition to new food system types occurs. These new types often coexist with a more dominant food system, which is certainly the case with the coexistence of alternative food systems in the present day with the still-dominant global corporate food system.
Module 10.2: Assessing Food System Impacts on Natural Systems and Sustainability
Module 10.2: Assessing Food System Impacts on Natural Systems and Sustainability
Introduction
What are the impacts of Food Systems on the Natural Systems that support our food production? You will learn about system-level impacts and impact assessment in module 10.2. You have already considered many of these impacts on the environment in earlier modules, for example, plant domestication, nutrient cycling, water use, and water pollution. You will learn about assessing impacts that emerge from the behavior of a whole food system, and practice life cycle assessment (LCA), one method used for assessing whole-system impacts.
Earth System Impacts and Energy Use by the Food System
Earth System Impacts and Energy Use by the Food System
Human System Impacts on the Environment Within Food Systems
In modules one and two of this course, and most recently in this module, we represent food systems as coupled human-natural systems. Throughout the course, we have tried to emphasize the dramatic impacts that human food production has had and continues to have on earth's natural systems. Here are some examples from previous modules:
- Changing river basins to create irrigation systems
- Exposing soils to greater rates of erosion, and stabilizing some soils against erosion
- Domestication and development of new crop types, including transgenic engineering of new crop traits in the recent past
- Contributions of agriculture to greenhouse gas emissions that are warming planet earth and leading to climate change
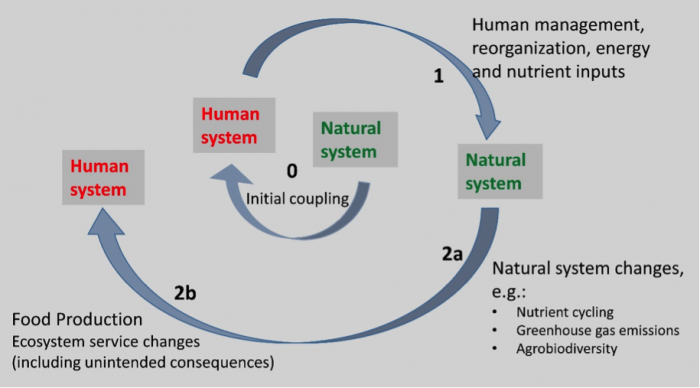
Different types of food systems – global, smallholder, and alternative, as we summarized in module 10.1 -- may all impact the earth's natural systems in a different way and to different degrees. You may recognize on the short list of examples above that the impacts from these changes and the creation of agroecosystems by humans may have both positive and negative aspects. For example, irrigation and crop breeding both have as objectives increasing the productive potential of crops. They may carry other unforeseen consequences, such as depletion and collapse of water resources, changes in the dietary quality of food with domestication and breeding, and greater use of herbicides in the case of Roundup-ready crops. These human system actions within the food system improve production can be seen as the initial driving arrow as part of a human-natural system coupling (Fig. 10.2.3) and generally involve management, reorganization of the ecosystem, and energy and nutrient inputs (e.g. the use of fossil fuels to create fertilizers). The natural system then responds with positive and negative impacts on productivity and other natural system processes, which can include positive and negative consequences. These consequences eventually determine the level of sustainability of the food system. The massive extent of food systems and food production globally, within different types of food systems, translates into a large effect, or leverage, on the sustainability of human societies. To promote the sustainability of food systems, we must understand how food systems as a whole affect measures of sustainability. In this unit, we will first refer to the different human system impacts on natural systems, and then allow you to practice life-cycle assessment (LCA) to compare the energy use of two food production systems in the Andes and North America.
Life Cycle Assessment (LCA): Measuring the Impacts of Systems in Multi-part Processes
Life Cycle Assessment (LCA): Measuring the Impacts of Systems in Multi-part Processes
Life Cycle Assessments
Life cycle assessments or life cycle analyses (LCAs) are defined as “a tool to analyze the potential environmental impacts of products at all stages in their life cycle” (International Standards Organization). Analogous to the food supply chain activity you completed in module 10.1, LCAs follow products (foods and otherwise) from production, through transport and assembly steps, to the consumption or operation of the product, and in some cases even its disposal. In contrast to the supply chain descriptions in module 10.1, at each of these stages of production, transport, consumption, and disposal, LCAs keep a running total of environmental costs or impacts of the product. Common impacts that are tracked by LCAs across product life cycles are greenhouse gas emissions, water pollution impacts, and energy use. As such LCAs are a key tool in analyzing the impacts of human on natural earth surface systems within the coupled natural-human food system (Fig. 10.2.3). LCAs require some careful thinking about where to draw the boundaries of the system for considering the life cycle of a product. For example, an LCA devoted to carrots would probably include the energy required to operate the refrigerated truck used to transport the carrots but not the energy needed to make the truck. Also, many LCAs are “cradle to grave” and include both impacts of all raw materials used in production as well as disposal impacts for the product, but some do not focus on the entire life cycle and assess other segments of the lifecycle such as “cradle to farm-gate” or “cradle to plate” in the case of food products.
Life cycle analyses are an excellent way of putting into practice a geosciences "habit of mind" of using systems thinking. Because food systems are complex, we think about a way to measure its performance and then explore all the linkages in the system within that single metric or measurement parameter (see module 1.2 for a discussion of complex systems behavior). That is, we don't content ourselves with just thinking about a crop plant in a field, the entire farm field, or the highway where foods are transported; we go several levels up to measure impacts along the entire pathway or web of interacting system parts. Along the way, it is likely that we will start to think in new ways about the linkages between parts of the system, about the most important contributions to impact, or about previously hidden factors or unexpected outcomes that explain the performance of the system.
Required Reading
National Center for Appropriate Technology (NCAT): Life Cycle Assessment of Agricultural Systems [2], pp. 1-3 and figure 3 for light bulb LCA on page 9.
You'll notice that the presentation of compact fluorescent light bulbs is somewhat dated since there has now been a big move to LED light bulbs that are further reducing energy usage for lighting. We continue to feature this presentation of LCA from the NCAT because it is one of the better non-technical introductions to the subject and also relates LCA concepts to agriculture. See the resources below if you want to read more about LCAs, including a detailed PowerPoint comparing different types of light bulbs.
Additional Reading on LCAs (optional)
- Colin Sage's book, Environment, and Food, pp. 167-172, Chapter 5, Final foods and their consequences. You may remember that the first few pages of this book were assigned as a reading in module 1.1. This document may be available through your E-Reserve System.
- A PowerPoint comparison of light bulbs to complement the reading from NCAT above, H. Dillon and C. Ross: "Updating the LED Life-Cycle Assessment [14]".
- A video of a "six-minute crash course, LCA 6 minute crash course Life cycle thinking and sustainability in design [15], by Leyla Acarogluintroducing.
Using LCAs, Part One: Comparing Costs and Impacts
Using LCAs, Part One: Comparing Costs and Impacts
Life cycle assessments are often used in two important ways. The first is to compare the costs or impacts of different products or production systems in a rigorous way, seen in Fig. 10.2.4 which compares the phosphorus water pollution resulting from three ways of producing pork meat in France (Basset-Mens and Van Der Werf, 2005). This “cradle to farm-gate” pork LCA includes the cropping used to produced pig feed as well as the animal raising methods at pig farms that use three different standard methods. In this example, two different ways of expressing LCA results show how different messages can emerge depending on how results are presented. The graph at left shows the impacts at a per-area of land used basis (per hectare), while the graph at right expresses the impact as a per-kg of food produced, which means that if a production method yields more on a per-area basis, its impact can be reduced compared to one with less productivity per hectare. Organic and red-label humane methods with straw-bedded barns pollute less on a per-hectare basis, but the organic methods are not less polluting than the conventional treatments on a per-kg of pig basis because more area is needed to both raise the pigs and grow the crops for feed in the organic system. Therefore if demand (in kg pork) remains the same for pigs while consumers switch from conventional to organic pork, total water pollution from phosphorus in pig production is unlikely to decline, at least according to this study. Rather, the red-label option seems to be able to shrink pollution per kg of pork consumed in the food system. Meanwhile, if you limited your viewpoint to a single watershed with a delimited area, you would say that both the red-label and organic methods reduce pollution. Despite some of the benefits of organic management generally, in reducing toxins in the environment and building soil quality (for example), this study can give us some pause in thinking about the particular system we are talking about (e.g. organic hog production versus organic apple production, for example) and the need to respect specific case analyses and the measures used in LCA analysis. When we talk about a whole food system, it may be best to employ a per-kg of food produced approach.
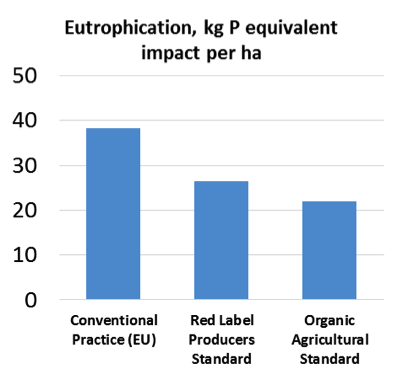
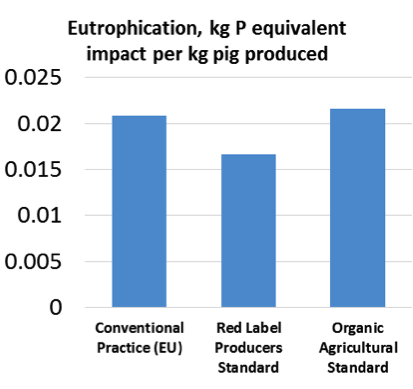
Using LCAs, Part Two: Assessing Hot Spots
Using LCAs, Part Two: Assessing Hot Spots
The second main way of using LCA is to assess which steps or process inputs in the production, consumption, and disposal of a product are most responsible for human negative impacts of practices. These “hot spots” in the analysis can then be the focus for better measurement to confirm the findings of the LCA and/or innovations in practices that eliminate these practices or limit their impact. One type of LCA uses the common measure of external energy inputs for food production (i.e., those not related to solar energy that is used by plants "for free") to analyze one aspect of the sustainability of food production. These energy inputs are visualized in Figure 10.2.5.
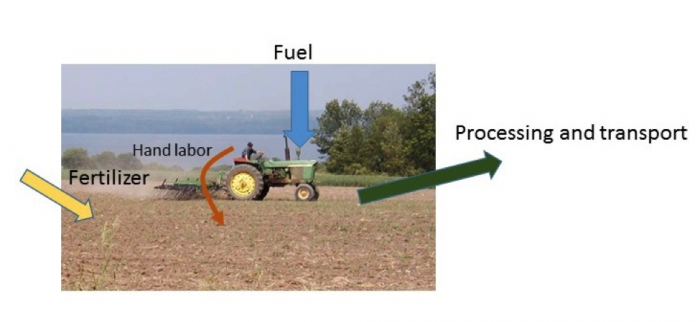
Dissecting an LCA
An LCA for energy use is illustrated below in Fig. 10.2.6 which shows the comparison of total energy used in different crop production practices in a long-term trial of farming practices in Switzerland. This graph shows the energy used in food production in two formats: stacked colored bars as kilowatt-hours (kWh) energy equivalent per land area under production (i.e. per Ha or 100 x 100 m area) of food production, and also as a total watt-hours (Wh) per kg of food produced (dark green lines and points above the stacked bars).
It's worth considering these results and the units used in more detail. First, for comparison, a typical U.S. home uses about 72 kWh per day for heating, cooling, and electricity, if we boil all these energy uses down to one energy equivalent* (calculations based on the U.S. Energy Information Administration, 2009 data [16]). Some further "ballpark" or rough calculations allow us to see that the fertilizer-based system (bar at right) uses a total of about 100 days of mean household energy**to produce food on one hectare in a year (per year), while the organic system (bar at left) uses a little over half this amount of energy. Meanwhile, if we express this daily household energy use as the energy used for food per kg of food, the 72 kWh become 94 kg of food in the fertilizer-based case at right, and 144 kg of food in the organic management case at left ***. Expressing LCA results as energy per land area and energy per kg food produced are common approaches, analogous to the pollution impact analysis on the previous page. In the summative assessment on the next page, you will use an LCA to calculate energy inputs per kg of potato production in two systems.
* That is the amount of heat and light given off by 30 100-watt light bulbs burning for 24 hours.
** That is, about 7200 kWh (height of rightmost split bar on the left axis showing energy use per hectare), divided by about 72 kWh household use per day, which is equal to 100 days.
*** Dividing 72 kWh by the energy amounts per kg from the green point+line data above the stacked bars, e.g. 72 kWh / 0.77 kWh per kg or 93 kg food for the fertilizer based-case, and 72 kWh / 0.50 kWh per kg, or 144 kg of food, for the organic case.
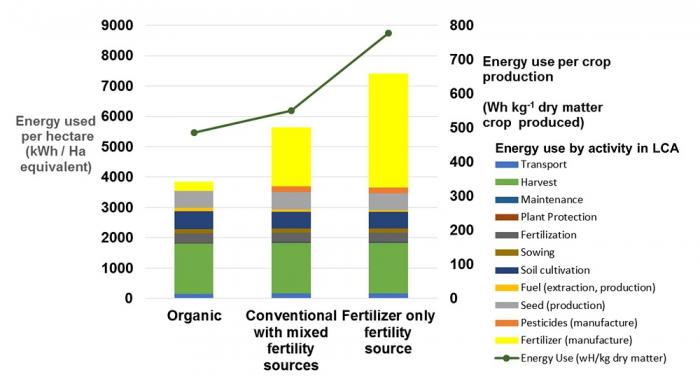
Fertilizer Use as a "Hot Spot" in the Analysis
Two additional observations: first, in this LCA there emerged large differences in energy use that have to do almost completely with the energy used to produce chemical fertilizer, especially of nitrogen fertilizers like those produced in the large fertilizer plant in India shown in Fig. 10.2.2. Energy inputs to fertilizer production are especially high for nitrogen fertilizer because it takes a great deal of energy to fix inert nitrogen in the atmosphere (N2) into reactive forms like ammonium and nitrate that can be easily taken up by crops (see module 5 and other previous modules). Fertilizer use emerges as a "hot spot" in this analysis and might prompt managers or policymakers to work towards reducing fertilizer use by incorporating aspects of the organic and manure-based system into the more conventional, fertilizer-based system. Many energy inputs in agriculture, such as these fertilizer inputs or tractor fuel that are tallied in the LCA above, are important to consider because they represent non-renewable fossil fuel energy sources that contribute to greenhouse gas emissions and anthropogenic climate change through the release of carbon dioxide. The LCA thus helps to measure natural system impacts and sustainability of food systems. Second, this LCA used energy as a yardstick to measure the impact of food production. As we will note for your summative assessment, such an LCA using energy inputs is only ONE measure of sustainability, and may not capture other measures of sustainability, like forest clearing needed to establish agroecosystems, runoff of nutrients that contribute to dead zones, pesticide effects on beneficial insects like pollinators, or whether farming practices provide sustained income and other livelihoods to farmers. As an example of using a different yardstick for LCAs, consider the emissions of greenhouse gases (GHG) by different pork production systems on the previous page, in which the organic management system, in fact, had higher potential to pollute waterways with phosphorus runoff per kg of pork produced, than either conventional or "best practices" red label standard in the European Union. This result contrasts with the favorable result shown on this page for organic management when energy inputs were used as a yardstick.
Knowledge Check: Earth System Impacts and Life Cycle Analysis
Question 1 - Short Answer on types of impacts from food system activities
One of the skills involved in building life-cycle analyses is the ability to conceptualize all the different impacts on natural systems related to the different functions of production, transport, and consumption of a product. The activities give below in each question form a part of the functioning of food systems. Identify an impact or impacts on the natural system (e.g. soil erosion, air pollution, water pollution) that would most likely result from these activities, based on the material in this module and previous modules. Then check your answers by clicking on "click for answer" as a review.
Transporting food by ship and truck:
Click for answer.
greenhouse gas emissions from burning fuel, other air pollution from burning fuel
Applying manure to soils:
Click for answer.
water pollution from nitrogen and phosphorus drainage and runoff if over-applied, and no measures in place to retain nutrients in soils (cover crops, riparian barriers that keep nutrients out of waterways). Greenhouse gases, especially N2O, will be emitted if manures are applied on waterlogged soils, and methane as a greenhouse gas is associated with the animal production (especially cows) used to produce the manure.
Applying fertilizer to soils:
Click for answer.
greenhouse gases because of fertilizer manufacturing, greenhouse gas due to denitrification and N20 emission, water pollution if over-applied as in the case of manure above.
Tillage of soils:
Click for answer.
if practiced irresponsibly, soil erosion; siltation of waterways; greenhouse gas emission from mechanized tillage with tractors; emission of carbon as carbon dioxide that was once part of organic matter in soils.
Pesticide and herbicide application:
Click for answer.
toxicity to organisms in the environment, e.g. honey bees, other beneficial insects and water pollution; evolving resistance of pests and weeds, greenhouse gas emissions from manufacture, transport to farms, and application with tractors
Question 2 - Short Answer
As preparation for doing your own life-cycle analysis, make a list of all of the energy needs you can think of that go into both manufacturing and operating a car. You may want to also refer to the NCAT/ATTRA required reading to review an example life cycle analysis:
Click for answer.
mining and refining metal ore to make steel, refining oil and synthetic production of plastics and paint, energy for water supply to all manner of production processes, burning gasoline or diesel in the engine for running the car, etc.
Summative Assessment: Life Cycle Assessment (LCA) of Energy Use in Potato Production in Smallholder Andean and North American Production Systems
Summative Assessment: Life Cycle Assessment (LCA) of Energy Use in Potato Production in Smallholder Andean and North American Production Systems
Instructions
This assignment has been broken down into three steps. First, you need to understand the LCA Spreadsheet, next you will need to complete the spreadsheet and finally you will complete the Summative Assessment Worksheet using the results of the completed spreadsheet. Please read all of the instructions very carefully. They are presented in the next three pages.
Files to Download
Energy Input LCA Activity Spreadsheet [18]
Summative Assessment Worksheet [19]
Submitting Your Assignment
Please complete the Module 10 Summative Assessment in Canvas.
Step 1: Description of the LCA Exercise
Step 1: Description of the LCA Exercise
Instructions for Filling in the LCA Spreadsheet
- If you haven't already done so, download the Energy Input LCA Activity Spreadsheet [20], which includes an excel spreadsheet with embedded calculations that will carry out some of the calculations in the LCA, and also a copy of the data table below.
- In a step-by-step fashion, the spreadsheet asks you to use data given in tables on the next page to calculate the total energy needed to produce and ship potatoes in two contrasting food system types: a smallholder agricultural system in Peru and an industrialized system like those in New York, Pennsylvania, Michigan, or Colorado, USA. See Fig. 10.2.5 (previous pages) for a simple view of the flows that will be accounted for in the LCA.
- To translate the energy usage into an understandable form, the energy results from the LCA are given in gallons of gasoline-equivalent, which is a “yardstick” of energy usage (for learners outside the United States, multiply by 3.8 for liters of gasoline). This is similar to the use of kilowatt-hours of electricity (kWh) as an energy yardstick for the LCA on production practices in Europe, two pages ago.
- The results we will calculate will be in gallons of gasoline equivalent per land area (per hectare or Ha, equal to a 100 by 100-meter area), and also per 1000 kg (metric ton) of potatoes (a metric ton is slightly more than a standard U.S. ton or 2000 lbs.)
- Detailed instructions for filling in the excel table appear on the following page. You will first fill in the excel table in the cells labeled as 1.1, 1.2, etc. for the smallholder system in the Andean region of South America, where yields are generally lower and satisfy the needs of households and local markets (a smallholder food system).
- You will then continue filling in the energy inputs for the United States-based industrial system for the excel cells labeled 2.1 through 2.17
- Note that to make the exercise easier, a few values in the excel sheet have been filled in for you. Also, greyed-in cells in the excel table will fill automatically by summing the blank cells once these have been filled in.
- After filling in both sides of the excel table carefully and checking, you will answer questions regarding the LCA on the page for step three, to complete the summative assessment.
Now, move to the next online page to start filling in the spreadsheet to complete this activity.
Step 2: Complete the Excel Spreadsheet
Step 2: Complete the Excel Spreadsheet
Instructions
Read the table below very carefully and follow the instructions to complete the spreadsheet (see the previous page for spreadsheet download) using the Gallon Gasoline Equivalents per Hectare given in table 10.2.1 below.
Instructions for lines 1.1 to 1.15 of Excel table. This is for potatoes produced in the Andean smallholder agriculture system.
The table below provides instructions for filling in the data needed for the LCA of energy use by Andean smallholder agriculture based on the agricultural practices in these systems. You will need the table of values for the two different systems (see table 10.2.1 below, see link below to download or use the online version)
| Line Number in Excel Table | What to enter into the spreadsheet -- you are entering 'Gallon Gasoline Equivalents' of energy |
|---|---|
| A.1 | Look up the smallholder tillage energy value (LEFT side of table 10.2.1 below) in the table and enter it. |
| A.2 | Look up the smallholder hand labor energy value on the LEFT side of table 10.2.1 below and enter it -- it is considerable because many operations like weeding and hilling up potatoes to make them yield better are done by hand. |
| A.3 | Manure energy is not counted as it is a by-product of other animal uses on the farm such as meat, wool, and traction uses, so enter zero. |
| A.4 | Irrigation - as explained on the right side of table 2, this does not use energy even when it is used, because it is usually gravity-fed. |
| A.5 & A.6 | This value has been entered to simplify the exercise, but please read this explanation: small amounts of fertilizers are used by smallholders, so use a value of 10 kg per Ha of nitrogen (N) and phosphorus (P) in fertilizers. The values in the table happen to be given just "per 10 kg of nutrient", so we have multiplied the figure in the table (4.9 gallons gasoline per 10 kg N) by 10 kg, which gives 4.9 gallons gasoline and 1.0 gallons of gasoline for N and P respectively. These are already filled in. |
| A.7 | Potassium fertilizer is not used, so enter zero. |
| A.8 | Energy is required to produce seed, in essence, the energy value from this LCA for the preceding crop multiplied by the seeding rate of potatoes. Enter this value into the excel table. |
| A.9 | Fungicide might be one chemical input that would be used in the Andes by smallholders to combat late blight and other common potato diseases, so we include it here. Enter the value shown in the table into your LCA excel table. |
| A.10 | This cell is summed automatically. You do not need to enter anything, but you should note it for comparison and checking with other findings of the LCA. The energy inputs for all production activities are summed automatically by the spreadsheet, in gallons gasoline equivalent per Ha. At right it is also given per 1000 kg of potatoes produced, assuming a yield of 10,000 kg/ha fresh weight of potatoes which is a medium to good yield for smallholders in the Andes. |
| A.11 | This cell is summed automatically and you do not need to fill in. Here the energy inputs are summed as in A10 but representing ONLY those energy sources that represent fossil fuel inputs (e.g. fertilizer, fungicide) |
| A.12 | Transport distance. For smallholder systems in the Andes, about half the crop might be transported about 100 km as an average. Half the crop being sold is already factored into the calculations for energy used (A13). |
| A.13 | This cell is calculated automatically. The transport energy required to transport half the crop to market is calculated by the spreadsheet. The other half is assumed to stay on the farm for home consumption. |
| A.14 | This represents a total of energy inputs for production plus transport to market per land area (Ha); at right on line 13, it is given per kg of potato produced. |
| A.15 | This represents only the fossil fuel energy required for production plus transport |
When you have entered all the values for the smallholder system, you will see the LCA results for production only, and production plus transport summarized at right in column E of the Excel spreadsheet.
Instructions for lines 2.1 to 2.17 of the excel table, LCA for industrial agriculture:
Use the instructions below to fill in the second LCA for industrial agriculture:
| Line Number in Excel Table | What to enter into the Excel Table -- you are entering 'Gallon Gasoline Equivalents' of energy |
|---|---|
| B.1 | look up the industrial agriculture value for tillage energy value (RIGHT side of table 10.2.1 below) in the table and enter it. |
| B.2 | look up the industrial agriculture hand labor energy value in table 10.2.1, RIGHT side, and enter it (hand labor energy is very small because most operations have been mechanized) |
| B.3 | We assume manure is not used on these potato farms. They tend to be large farms and not necessarily close to sources of manure, so we have already entered zero here. |
| B.4 | Irrigation: Enter the value on the right side of the table if you wish to model the case of Colorado or other regions where potatoes are grown in dry climates. Otherwise, you should enter zero because we assume that potatoes use only rainfall, and energy is not required to irrigate them. |
| B.5 | Nitrogen fertilizer: 180 kg/ha of nitrogen is applied to potatoes. The value in the table below gives an energy value in gallons of gasoline per 10 kg of N, so you should calculate 180/10= 18 and multiply it by the value in the table, equal to 18 x 4.9 or 88.2 gallons gasoline. This value has been entered in the excel table, and you will use the phosphorus and potassium fertilizer energy equivalents to enter them. |
| B.6 | Repeat the process above for N fertilizer, but using the P fertilizer value from the table and 120 kg of P/Ha as the application rate of phosphorus to potatoes (remember to divide this P rate by 10) |
| B.7 |
Repeat the process above for N fertilizer, but using the K fertilizer value from the table and 200 kg of P/Ha as the application rate of phosphorus to potatoes (remember to divide this P rate by 10)
|
| B.8 | Energy is required to produce seed, in essence, the energy value from this LCA for the preceding crop multiplied by the seeding rate of potatoes. This value is 35.4 and has been entered into the excel table. |
| B.9 | Fungicide is applied to combat fungal diseases that are common in potato-growing regions, and ensure high yields that justify the relative expensiveness of growing in this intensively managed crop. |
| B.10 | Insecticide is used to manage insect pests of the crops. These have an energy cost of manufacture, transport, and driving through the field on a tractor to apply them. Enter the value from the right side of the table |
| B.11 | Herbicide is used to control weeds in the potato crop. These have an energy cost of manufacture, transport, and driving through the field to apply them. Enter the value from the right side of the table. |
| B.12 | This cell is summed automatically. You do not need to enter anything, but you should note it for comparison and checking with other findings of the LCA. The energy inputs for all production activities are summed automatically by the spreadsheet, in gallons gasoline equivalent per Ha. At right it is also given per 1000 kg of potatoes produced, assuming a yield of 10,000 kg/ha fresh weight of potatoes which is a medium to good yield for smallholders in the Andes. |
| B.13 | This cell is summed automatically and you do not need to fill in. Here the energy inputs are summed as in A10 but representing ONLY those energy sources that represent fossil fuel inputs (e.g. fertilizer, fungicide) |
| B.14 | Transport distance: For potatoes in New York or Michigan (examples of eastern states in the U.S.) choose 200 km. For potatoes in more remote Colorado, the mean transport distance is approximately 700 km (on average), so enter this in the excel table. The energy for transport is calculated automatically in the next cell below. |
| B.15 | This cell is calculated automatically as the energy needed to transport the entire crop to ma et, since this is exclusively a cash crop by contrast to the smallholder system. |
| B.16 | This represents a total of energy inputs for production plus transport to market per land area (Ha). To the right on row 33, it is given per kg of potato produced. |
| B.17 | This represents only the fossil fuel energy required for production plus transport |
Also, in the case of the industrial system, the yield that is present in the excel table is a good deal higher than that shown for the Andean system, at 35,000 kg potatoes per Ha. This can be traced to a number of factors: less limiting fertility provided by higher nutrient inputs, different varieties specialized for high yields as well as different globalized market characteristics in North America, reduced pest and weed pressure, and better overall quality of soil resources where potatoes are grown, which may include flatter, deeper, and better-drained soils.
| LCA Category | Smallholder agriculture system description | Energy input for smallholder agriculture, in Gallon Gasoline Per Hectare equivalents | Industrial agriculture description | Energy input for industrial agriculture, in Gallon Gasoline Per Hectare equivalents |
|---|---|---|---|---|
| 1.Tillage and field operations | Energy input of oxen for plowing | 16.1 | Tractor fuel use and other machinery energy use on-farm | 146 |
| 2. Hand labor | Driving traction animals and several hand operations (hilling, weeding, harvesting) | 6.4 | Human operation of machinery and occasional direct field operations | 0.05 |
| 3. Irrigation | Irrigation is usually gravity-based if used at all. | none | Choose this value ONLY if you decide to do an LCA for Colorado potato production - all other areas use zero irrigation. | 137 |
| 4. Nitrogen (N) fertilizer | Manufacture of N fertilizer per 10 kg fertilizer | 4.9 | Manufacture of N fertilizer per 10 kg fertilizer | 4.9 |
| 5. Phosphorus (P) fertilizer | Manufacture of P fertilizer per 10 kg fertilizer | 1.0 | Manufacture of P fertilizer per 10 kg fertilizer | 1.0 |
| 6. Potassium (K) fertilizer | Manufacture of P fertilizer per 10 kg fertilizer | 0.5 | Manufacture of P fertilizer per 10 kg fertilizer | 0.5 |
| 7. Seed | Energy embodied in seed production | 2.3 | Energy embodied in seed production (in an industrial system) | 35.4 |
| 8. Insecticide | none | -- | Energy embodied in insecticide production and application | 87.6 |
| 9. Herbicide | none | -- | Energy embodied in herbicide production and application | 58.5 |
| 10. Fungicide | Energy embodied in fungicide production | 12.7 | Energy embodied in fungicide production and application | 12.7 |
| 11. Electricity | none | -- | Electrical equipment and lighting for processing potatoes | 4.4 |
| 12. Transport |
Energy to transport half of one-hectare yield to wholesale market or processor (for e.g. 100 km distance) - this will be calculated by the spreadsheet.
|
7.8 |
Energy to transport the whole yield of industrially produced potatoes to market. |
72.2 |
Step 3: Discussion and Analysis
Step 3: Discussion and Analysis
Conclusions: Discussion and Completing the Summative Assessment Worksheet
If you have finished both LCA sections, congratulations! You have just learned the basics of a common analysis tool for complex systems such as coupled natural-human food systems.
Taking stock: For discussion: here are some items you may want to discuss in your groups and with the class.
- Module 10.2 has been devoted to summarizing natural systems impacts of the food system. In this LCA, why did we focus on energy use and fossil fuel energy use in particular? What specific impact on natural systems, does fossil fuel use create that evokes sustainability concerns?
- Within the particular measurement parameter or metric from question one, which system created less impact on the earth system per unit of food produced (note that there might be other ways to measure the systems with other conclusions, see question 4)?
- Which system yielded more potatoes per area? Does this make a difference to the conclusions regarding energy use and its contribution to sustainability? (think about in which units we expressed the results of the analysis)
- What are other measures of sustainability that could be applied to the two systems? Think about the other natural systems components presented in sections II and III of the course and in modules 10.1 and 10.2 (water, soil, etc.), or the concepts of social and economic/financial sustainability.
- What lessons from the smallholder system, could be applied to the industrial system, and vice-versa?
You will now complete an assignment based on the LCAs you have just conducted, to submit as the second part of your summative assessment, using a worksheet you will download below.
Files to Download
Summative Assessment Worksheet [19]
Submitting your Answers
Complete the Summative Assessment Worksheet short answer and paragraph responses, based on modules 10.1 and 10.2 and your responses on the Excel LCA Spreadsheet you just completed. Then complete the Module 10 Summative Assessment in Canvas.
Summary and Final Tasks
Summary
In the first part of Module 10, you learned about some of the formal concepts around food systems seen either as food production, transport, and consumption chains, and as types of coupled natural-human systems, and explored these concepts using real examples: food products as windows into production and transport chains, and food system examples from around the United States and the world. In the second part, module 10.2, you learned about and practiced a skill for measuring impacts of food production activities and other human processes on the environment: Life cycle analysis. These are vital tools that you can use to understand human-environmental linkages that pertain to food, one of the main goals of section III of this course.
Reminder - Complete all of the Module 10 tasks!
You have reached the end of Module 10! Double-check the to-do list on the Module 10 Roadmap [22] to make sure you have completed all of the activities listed there before you begin Module 11.
References and Further Reading
Altieri, M. A., Funes-Monzote, F. R., & Petersen, P. (2012). Agroecologically efficient agricultural systems for smallholder farmers: contributions to food sovereignty. Agronomy for Sustainable Development, 32(1), 1-13.
Cooper, J. M., Butler, G., & Leifert, C. (2011). Life cycle analysis of greenhouse gas emissions from organic and conventional food production systems, with and without bio-energy options. Njas-Wageningen Journal of Life Sciences, 58(3), 185-192.
Ericksen, P. J. (2008). Conceptualizing food systems for global environmental change research. Global Environmental Change, 18(1), 234-245
Food and Agriculture Organization of the United Nations (FAO). 1997. "Chapter 3: The food system and household food security” in Agriculture food and nutrition for Africa - A resource book for teachers of agriculture. Available at the document website of the United Nations Food and Agriculture Organization [5] (http://www.fao.org/docrep/w0078e/w0078e04.htm [23]).
Hinrichs, C. C. (2003). The practice and politics of food system localization.Journal of rural studies, 19(1), 33-45.
IFAD (International Fund for Agricultural Development): Investing in smallholder family agriculture for global food security and nutrition. IFAD -2015 Policy Brief 3, 2013.
Liu, J., Dietz, T., Carpenter, S. R., Folke, C., Alberti, M., Redman, C. L.,& Provencher, W. (2007). Coupled human and natural systems. AMBIO: A Journal of the Human Environment, 36(8), 639-649.
NCAT/ATTRA: Life Cycle Assessment of Agricultural Systems. Available at: https://attra.ncat.org/wp-content/uploads/2022/12/life_cycle_assessment.pdf [24]
Netting, R. M. (1993). Smallholders, householders: farm families and the ecology of intensive, sustainable agriculture. Stanford University Press.
P. Pinstrup Andersen and D. D. Watson. 2011. Toward a dynamic global food system”. In: Food Policy for Developing Countries: The Role of Government in Global, National and Local Food Systems, 1-25
Sage, Colin. 2011. “Final foods and their consequences” Ch. 5 in Environment & Food. Routledge, 2011.
Module 11: Human-Environment Interactions
Module 11: Human-Environment Interactions
Overview
Human-Environment Interactions: Resilience, Vulnerability, and Adaptive Capacity (RACV) of Food Systems
In Module 11, we focus on human-environment interactions in food systems under stress. Just as a human body does not persist in a constant state of perfect health, farms, fisheries and other components of food systems face adversity. These components must have sources of resilience and restoration to overcome these challenges. Shocks and perturbations from the natural world are a major negative coupling force from the natural systems to human societies and are sometimes compounded by problems and crises within societies. Such shocks are most evident where the natural world meets human management in production areas, and so Module 11.1 focuses on the resilience and vulnerability of agriculture. As a premier example of this, we build on the material from module 2 and learn about the way that humans’ manipulation of seeds and plant varieties has created agrobiodiversity. Agrobiodiversity, along with crop management techniques, make food production systems resilient or vulnerable to shocks and perturbations. In Module 11.2 we take up the theme of food access and food insecurity as a major example of vulnerability and an ongoing challenge for a significant proportion of humanity. Food insecurity also manifests as acute crises that carry the formal designation of famines. We will also study these since they are large-scale failures of the modern food system, which currently produces enough food for every person on earth. Just as health sciences and medicine are ways to improve and guarantee health for all persons, our hope is that by understanding vulnerability and resilience in food systems we can address food insecurity for all people as a facet of sustainable food systems. Addressing food insecurity is a serious consideration that you will contemplate in your capstone project.
Goals and Learning Objectives
Goals and Learning Objectives
Goals
- Describe the concepts of resilience, adaptive capacity, and vulnerability (RACV) in a food system.
- Explain food access and food insecurity as a key challenge to food systems.
- Appraise the value of human seed systems and agrobiodiversity as human system components that incorporate crops as natural components and foster resilience.
- Apply concepts of RACV to understand changes in seed systems and food production in examples.
- Analyze stresses and shocks from climate change and food system failure that lead to both gradual changes in food systems and acute crises such as famines.
Learning Objectives
After completing this module, students will be able to:
- Define the concepts of perturbations and shocks, resilience, adaptive capacity, and vulnerability in the context of agri-food systems.
- Define and describe agrobiodiversity within food production systems and changes in this agrobiodiversity over time.
- Define the concepts of food access, food security, food insecurity, malnutrition, and famine.
- Give examples of resilience, adaptive capacity, and vulnerability in food systems.
- Give examples of support systems for biodiversity in land use and food systems.
- Evaluate recent examples in land use and food systems of resilience, adaptive capacity, and vulnerability (RACV).
- Analyze an example of a recent famine and understand how multiple factors of vulnerability and shocks combine to create widespread conditions of food insecurity known as famines.
- Understand scales at which resilience and vulnerability come into play, including farm, community, regional, and international scales.
- Propose principles embodying RACV for incorporation into a proposal/scenario for an example food system (capstone project).
Assignments
Module 11 Roadmap
Please note that some portions of the Summative Assessment may need to be completed prior to class. Detailed instructions for completing the Summative Assessment will be provided in each module.
| Action | Assignment | Location |
|---|---|---|
| To Read |
|
|
| To Do |
|
|
Questions?
If you prefer to use email:
If you have any questions, please send them through Canvas e-mail. We will check daily to respond. If your question is one that is relevant to the entire class, we may respond to the entire class rather than individually.
If you prefer to use the discussion forums:
If you have any questions, please post them to the discussion forum in Canvas. We will check that discussion forum daily to respond. While you are there, feel free to post your own responses if you, too, are able to help out a classmate.
Module 11.1: Resilience, Adaptive Capacity, and Vulnerability (RACV): Agrobiodiversity and Seed Systems
Module 11.1: Resilience, Adaptive Capacity, and Vulnerability (RACV): Agrobiodiversity and Seed Systems
In this module, we consider resilience, adaptive capacity, and vulnerability (RACV) of food systems through the lens of agrobiodiversity and seed systems. We will build on the awareness of human-natural system interactions that was explored in module 10.2. In this module, we examine the way that shocks and perturbations affect human systems and the ways in which human systems have found to cope with these shocks that produce resilience within food systems. You will learn about agrobiodiversity at a crop and varietal level as an important case of adaptive capacity that provides resilience to shocks for food systems within different types of food systems (e.g. smallholder, globalized). You will apply this learning to examining RACV in a case study from the southwestern United States.
Perturbations and Shocks in Agri-Food Systems
Perturbations and Shocks in Agri-Food Systems
Perturbations and shocks are common in food systems and involve both the “natural system” components and the “human system” components in these systems. Throughout modules 11.1 and 11.2, we will use the word shocks and perturbations fairly interchangeably to refer to these negative events that challenge food systems and their proper function, although the word "shock" denotes a perturbation that is more sudden and potentially disastrous. Perturbations and shocks in “natural” components include dramatic changes in climate factors such as rainfall, as well as changes brought on by biological components such as disease and pest outbreaks that affect plants and livestock. Similarly, perturbations can occur within the “human system” components of a system. For instance, food prices are rarely entirely constant and farmers and consumers are said to face "price shocks" in the purchasing of food.
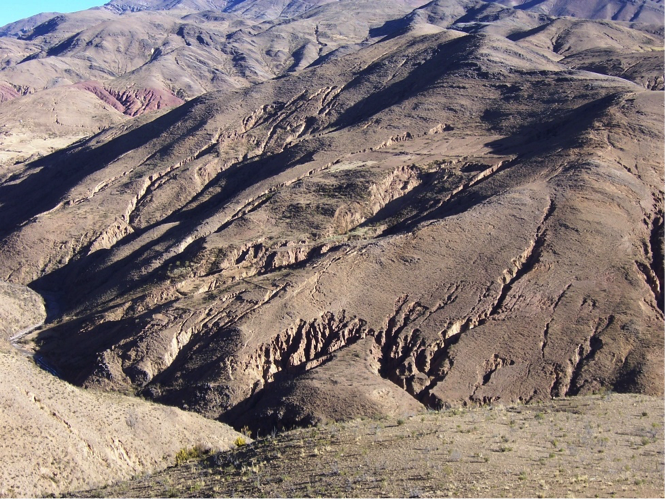
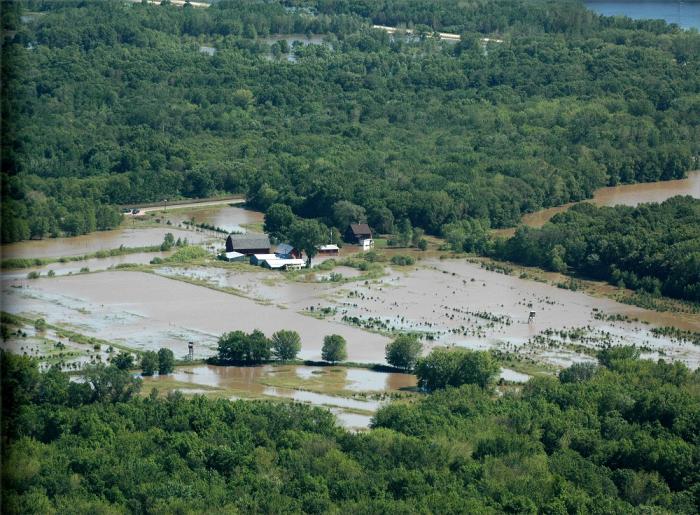
Extreme conditions can result in major perturbations and shocks in agri-food systems. Major climate variation, such as severe or prolonged drought, is a common example with regard to major changes emanating from the natural system (see figure 11.1.1). Gary Paul Nabhan, the author of the required reading in this module, uses the example of the extreme "Dust Bowl" drought in the United States in the 1930s. Since it is already a region that receives little rainfall, the agri-food systems in the U.S. Southwest were considerably threatened by this drought. Extreme conditions endangering food-growing and availability can also arise in human systems. Examples include political and military instability as well as market failures and volatility (such as the sharp increase in prices).
The human-environment dynamics of major perturbations and shocks in agri-food systems are shown in figure 11.1.3. This figure uses the already familiar approach of Coupled Natural-Human Systems (CNHS) introduced in Module 1 and applied in module 10 and throughout the course. Here we apply it to interactions of the natural and human systems that result in reduced production and accessibility of food. The human response to perturbations and shocks can be understood by applying the CNHS framework to agri-food systems. Within this diagram, we also want to emphasize that because of the coupling and interactions within and among these systems, the human and natural systems are never just passive recipients of a shock. Both subsystems have mechanisms for responding that can either ameliorate or worsen the "crisis" effects of perturbation. These system properties and responses to shocks are considered through the concepts of resilience, adaptive capacity, and vulnerability (RACV), defined on the next page. In the next module (11.2) we will use the RACV and human-natural systems framework to understand shocks and system responses that result in famine and severe malnutrition.
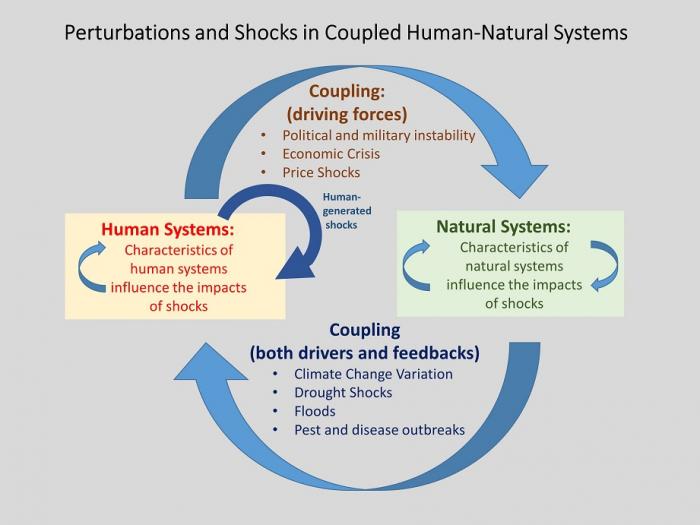
Defining Resilience, Adaptive Capacity, and Vulnerability
Defining Resilience, Adaptive Capacity, and Vulnerability
Introductory Video and Knowledge Check
Please watch the brief video about resilience and adaptive capacity. The presenter, Terry Chapin of the University of Alaska- Fairbanks, is an ecosystem ecologist who is used to thinking about the stresses that whole systems like ecosystems and food systems confront. Note that he uses the term 'resources' as roughly equivalent to the components of natural systems that support coupled human-natural food systems presented on the previous page. After the video in the knowledge check activity below, we'll ask you to identify the types of resources (i.e. components of natural systems) we've presented as vital to food systems in this course. You should, therefore, think about how the example he presents of Alaskan Native American communities and peoples can extend to many other elements of the food system.
Video: Resilience: The importance of adaptive capacity (2:10)
Knowledge Check Activity
Based on your learning in the course so far:
Question 1 - Short Answer
Try to quickly think of two important resources for food production like the ones described in this video. For each of the three, think of threats that confront these resources in their role of affecting food production.
Click for answer.
- Example 1
Resource: water
Threat: drought, climate change, decreased soil water holding capacity, depletion of aquifers (don't need to have all these, just examples) - Example 2
Resource: Soils and soil nutrients
Threat: soil erosion, too little manure, fertilizer, organic matter, and other soil inputs being returned to soils, urbanization, and loss of agricultural land base - Example 3
Resource: Crop production
Threat: pests, diseases, and weeds
Question 2 - Short Answer
Can you guess some examples of "adaptive capacity" by human systems within food systems we've seen so far?
Click for answer.
Policies to regulate water use and water pollution, breeding of resistant crops, measures to maintain soil health, creation of irrigation systems, crop insurance
Definitions of Resilience, Adaptive Capacity, and Vulnerability
Resilience, adaptive capacity, and vulnerability (RACV) are three concepts used to explain how human and natural systems respond to perturbations and shocks. We can use these concepts to understand the responses of agri-food systems to such factors as drought or the occurrence of market shocks or political crises. Here are some definitions of the RACV concepts, understood within a Coupled Natural-Human System Framework.
Resilience
Resilience is a system property which denotes the degree of shock or change that can be tolerated while the system maintains its structure, basic functioning, and organization. Talking about resilience usually implies thinking about the resilience “OF what TO what”. That is, we need to understand the resilience of a system (what system or process?; e.g. crop production; food distribution; farming or culinary knowledge) TO a threat or shock (what kind?; e.g. drought, war, plant disease). A recent report from a United Kingdom scientific commission states that resilience is “the capacity to absorb, utilize or even benefit from perturbations, shocks and stresses” which includes the idea that resilient systems, provided they are sufficiently robust, can even benefit from perturbations.
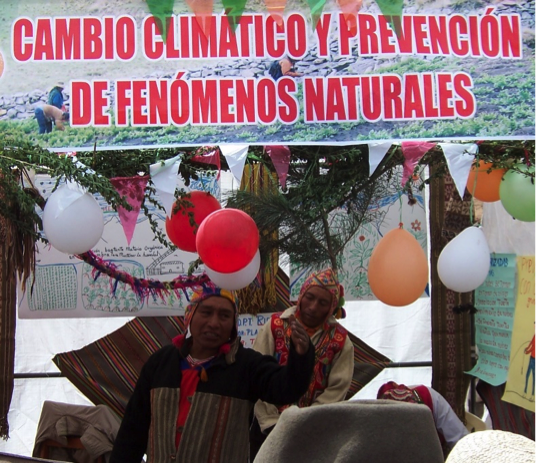
Adaptive Capacity
Adaptive capacities are the social and technical skills and strategies of individuals and groups that are directed towards responding to environmental and socioeconomic changes. In the context of food systems, adaptive capacity is usually exhibited or deployed to maintain livelihoods, food production, or food access. In the context of climate change, it is important to distinguish between adaptive capacity vs. mitigation: Adaptive capacity is deployed to adapt to perturbations in growing or living conditions or shocks brought on by climate change. Mitigation involves actively reducing the threat of climate change, rather than adapting to its effects: for example reducing emissions, reducing meat consumption among high-meat consuming populations, or geoengineering of the atmosphere to reduce CO2 concentrations.
Adaptive capacity is the second important property that refers to the responsiveness of agri-food systems when faced with extreme conditions. Human systems might, for example, have the capacity to switch to alternative land use within the agri-food systems. In these cases, people would be able to adapt to change since they have the capacity to shift their use of land and other resources. Adaptive capacity in the case of natural systems is exemplified by drought-tolerant crops (figure 11.1.5). Such crops may have more developed root systems or biological adaptations for conserving moisture.

Vulnerability
Vulnerability is the exposure and difficulty of individuals, families, communities, and countries in coping with shocks, risk, and other contingencies. This can be thought of as the opposite of adaptive capacity, with a continuum of mixed adaptation/vulnerability in between the two extremes of adaptive capacity and vulnerability. Farmers and consumers in extremely poor and isolated circumstances (whether in urban or remote areas) can be considered highly vulnerable because they lack their own ability to adapt to threats, and may be cut off or marginalized from external resources (family, government assistance etc.) that allows them to adapt to changes.
Now we can apply the concepts of resilience, adaptive capacity, and vulnerability to agriculture and food, using a Coupled Natural-Human System (CNHS) framework (Figure 11.1.6)
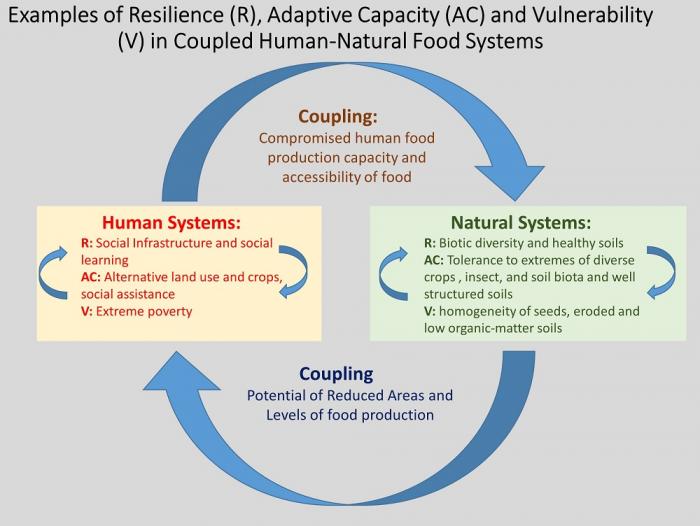
Examples of Resilience (R), Adaptive Capacity (AC), and Vulnerability (V) in Human systems and natural systems
Human Systems:
R: Social infrastructure and social learning
AC: Alternative land use and crops, social assistance
V: Extreme poverty
Natural Systems:
R: Biotic diversity and healthy soils
AC: Tolerance to extremes of diverse crops, insect, and soil biota and well structured soils
V: homogeneity of seeds, eroded and low organic-matter soils
As shown in Figure 11.1.6, resilience can be found in both the natural and human subsystems of food systems. You may recognize that many of the examples of natural system adaptive capacity refer to the "best practices" that we have advocated for water, soils, crops, and pest management in sections II and III of this course. These would include examples such as reducing the water footprint of food production, managing soils in a system framework for greater "soil health", and managing pests with ecological practices that seek to avoid pest and weed resistance to our management approaches (Modules 4, 5, 7, and 8 respectively). These approaches are not only important in increasing productivity under average conditions, but also help a food production system to adapt to shocks and perturbations.
Meanwhile, the human component of coupled human-natural food systems also is a vital part of resilience and adaptive capacity. Resilience is higher where there are higher levels of social infrastructure that enable people to share learning and resources in response to shocks and perturbations, such as extreme drought. Social infrastructure, shown in Fig. 11.1.6, includes mutual assistance within families and communities or among regions in a country, coordinated by governments to assist in the case of shocks that affect food production. Social learning is vitally important since it’s one of the main ways that people would learning new techniques based on the conditions prevailing in their area. For example, farmers could use social learning to acquire the skills and knowledge to lessen water use, and thereby lessen the degree of agricultural production decline and reduced food access. Biological diversity is a major example of higher resilience functioning in the natural components of coupled agri-food systems. Food production systems with more biological diversity---a property referred to as agrobiodiversity and covered on the next pages---typically have the capacity for greater levels of resilience. This greater level of resilience may result from a mixture of crops and varieties combining vulnerable and resistant type of crop, for any given stress, so that even if some crops fail, others will do well. Different crops and land uses may also produce positive or facilitating interactions in which one crop type or wild plant species, for example, provides benefits to another (e.g. nitrogen fixation and better soils or screening from an important pest; see module 6 on crops and the previous section on systems approaches for management for additional examples).
Resilience vs. Adaptive Capacity: What's the Difference?
On the surface, resilience and adaptive capacity in systems may seem very similar, and it is true that as defined here they are very aligned. One way to remember the difference is that resilience is a broader system property that may have to do with the interplay of human and natural systems, or one or the other of these subsystems. We can say that a region's food system is quite resilient to drought (a more general statement) if we think for a number of reasons that its food supply would be able to continue mostly without issues during a drought. Adaptive capacity meanwhile is more narrowly focused on the specific skills and mechanisms that are deployed by human systems to contribute to resilience. In other words, we might identify that the system or component thereof is resilient (like the region mentioned above), and then identify sources or mechanisms of resilience in terms of particular knowledge, practices, land uses, or biological properties that are functioning in a food production system, referring to these as adaptive capacity. We turn next to agrobiodiversity as an example of adaptive capacity that can contribute to food system resilience (can you see the difference between the two words in this last sentence?).
Agrobiodiversity: Biological Diversity and Associated Human Capacity in Agri-food Systems
Agrobiodiversity: Biological Diversity and Associated Human Capacity in Agri-food Systems
One major way of increasing the resilience and adaptive capacity of agri-food systems in response to perturbations and shocks is to be certain they contain components with high levels of agrobiodiversity.
Here is a standard definition of agrobiodiversity:
This definition is taken from Gary Nabhan’s book Where Our Food Comes From and is based on work of the United Nation’s Food and Agriculture Organization (FAO)
Agricultural biodiversity…includes the cornucopia of crop seeds and livestock breeds that have been largely domesticated by indigenous stewards to meet their nutritional and cultural needs, as well as the many wild species that interact with them in food-producing habitats. Such domesticated resources cannot be divorced from their caretakers. These caretakers have also cultivated traditional knowledge about how to grow and process foods.. (which) is the legacy of countless generations of farming, herding and gardening cultures.
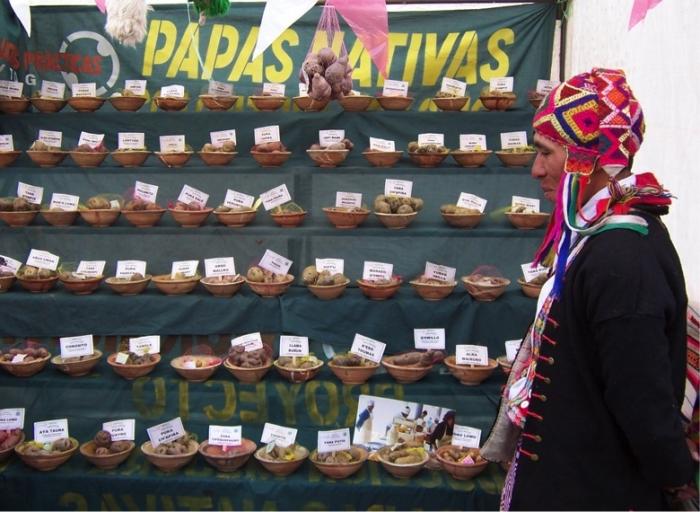
There are two important points to note about this definition:
- First, and most importantly, the biological diversity of agri-food systems includes vital coupling to the human system, most directly the people who are growers and their skills, knowledge, and other factors. These growers are “caretakers” in Nabhan’s definition; see Fig. 11.1.7 for potato varieties and a representative "caretaker" - a local farmer with working knowledge of these varieties. Agrobiodiversity exists squarely at the intersection of human and natural systems conceptualized in this course.
- Second, it encompasses both our cultivated species of plants and animals, which are crops and livestock chosen and evolved for production, as well as their still living wild relatives and the biodiversity of the ecosystems associated with this production (both the agroecosystem itself and the surrounding uncultivated ecosystem). Agrobiodiversity production in the natural system must be sufficient to offer positive feedbacks into the human system in order to offer the incentive for continued production.
The above-mentioned points in the definition of agrobiodiversity are illustrated in figure 9.6, which depicts agrobiodiversity as a Coupled Human-Natural System (CNHS).
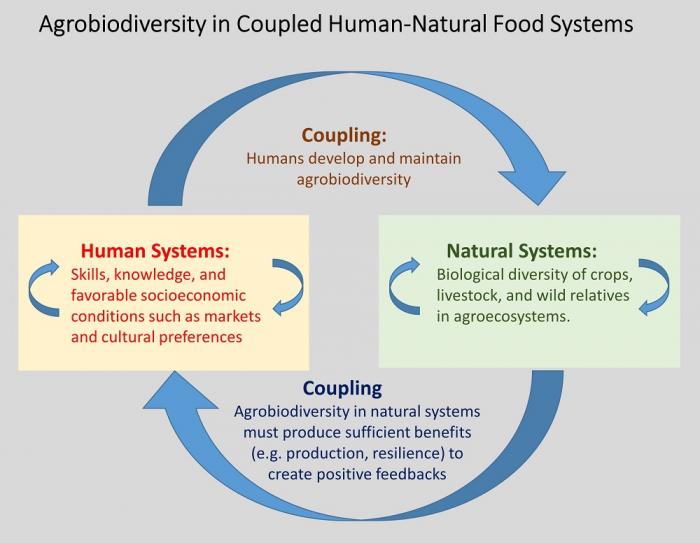
The growers of agrobiodiversity range widely around the world. They include the people of traditional and indigenous cultures who often live in more remote locations. Many of these people live in mountainous regions and hill lands of the tropics and sub-tropics. Their use of agrobiodiversity in agri-food systems is reflected in certain global centers of diversity, as shown in the map that we presented in Module 2 regarding the sites of crop domestication in the early history of food systems. Such centers are sometimes called “Vavilov Centers” in recognition of the pioneering contribution of the scientist Nikolay Vavilov in the 1920s.
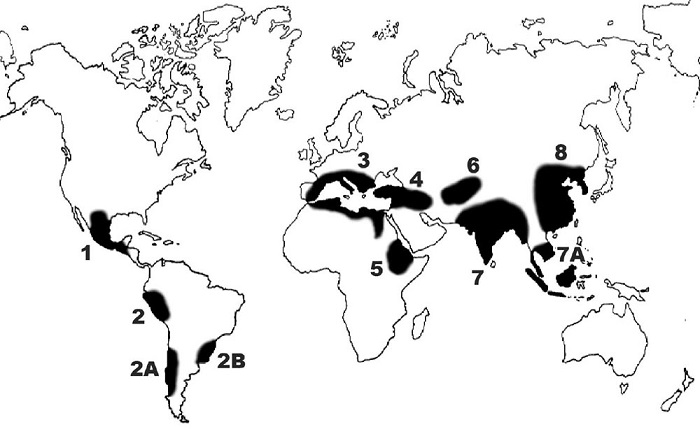
Increasingly it’s recognized that significant agrobiodiversity also occurs outside the Vavilov Centers. For example, many urban and peri-urban dwellers grow small fields and gardens as part of local, small-scale agri-food systems. Producers of diversified production for local markets in North America and Europe are still another important group of agrobiodiversity-growers.
The extent of agrobiodiversity, in terms of crops and livestock, may vary from only a few types in a field or farm to many dozens. Agri-food systems with only a few types are quite important since they can confer significant resilience to perturbations and stressors. For example, cultivation of only a few types of barley, wheat, or maize (“corn” in the U.S.) among neighboring farms and communities can offer a much higher degree of resilience than the monoculture of a single type.
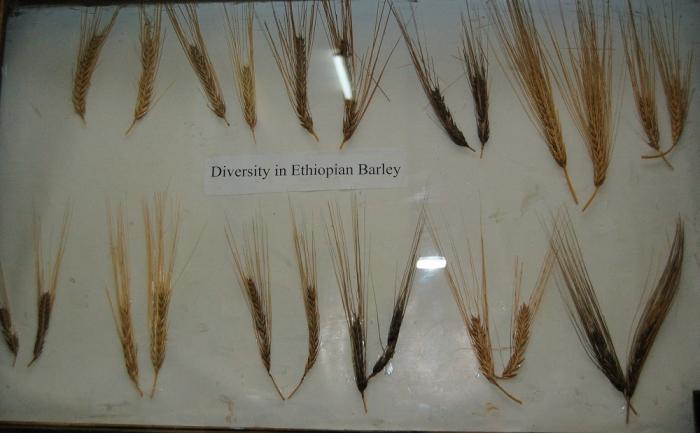
Equally important is the case of the megadiverse agri-food systems. In the potato fields of the Andes Mountains of western South America, for example, a farmer may grow as many as 20-30 major types of potatoes in a single field. (Figure 11.1.11). Here, in tha global “Vavilov Center” of the Andes mountains, high levels of agrobiodiversity are integral to the agri-food system as a result of factors in the human system (skills, knowledge, labor-time, cultural and culinary preferences) and the natural system (highly varied climate and soil conditions characteristic of tropical mountains).
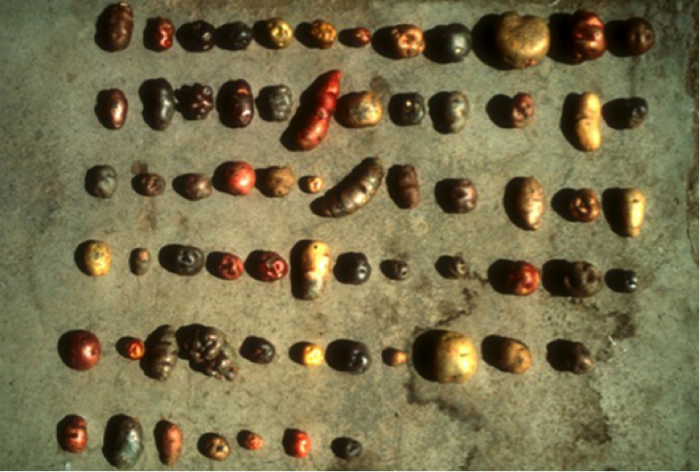
Activate Your Learning: Agrobiodiversity and Resilience
Assigned Reading:
Please read the brief "introduction to the reading" below and then the following pages from Gary Nabhan's book "Where Our Food Comes From":
Nabhan, G.P. "Rediscovering America and Surviving the Dust Bowl: The U. S. Southwest ", p. 129-138, part of Chapter 9, Where Our Food Comes From: Retracing Nikolay Vavilov's Quest to End Famine. Washington: Island Press.
Introduction to the reading: The reading describes part of a much longer account of travels by Vavilov (for whom the Vavilov centers of agrobiodiversity are named, see the previous page in the book, and module 2.1 in this course) from 1929 to 1934 in North America. During this trip, the Russian crop researcher met with U.S. researchers as well as "keepers" of U.S. native agrobiodiversity. This chapter describes Vavilov's trip to the Hopi Indians in 1930, in which he and the U.S. scientists were able to observe firsthand the seed systems and their resilience to the drought that was currently going on in the United States. The author of the book, Gary Nabhan, relates this account of the visit and then compares it to similar visits he made to the Hopi in the more recent past. This compiled history of seed systems and their relation to both human and natural system changes in the U.S. Southwest is a sort of case study, from which the assessment worksheet will ask you to draw conclusions.
Download Worksheet [29]
Activate Your Learning
This exercise requires you to fill in some of the blanks in the worksheet [29] based on the reading.
- Two of the shocks that the Hopi food system has been exposed to have already been filled in on the worksheet, the main one being periodic drought. Within the human system box, fill in some of the agricultural methods (ways of growing food) described by Nabhan that represent adaptive capacity to drought shocks.
Click for answer.Deep planting of crops to capture moisture, spring-fed terraces, stream-side fields to capture flood moisture. - In the natural system box, fill in how agrobiodiversity and their seed systems also represented adaptive capacity of the Hopi against drought.
Click for answer.Diverse crops adapted to local conditions, local seed saving so that seeds were not lost, tree crops and edible wild plant gathering to supplement diet. - During the more recent drought, Nabhan states that an additional climatic factor related to climate change tended to worsen the effects of drought. What was this? Place it in the additional shock box at the lower edge of the diagram.
Click for answer.Hotter summer temperatures due to climate change. - A shock that emerged from the human system was the pumping of groundwater for coal mining and coal slurry transport in the region. What was the vulnerability to drought in the local natural system that this water extraction created? Fill it in in the “vulnerabilities” box in the natural system part of the diagram.
Click for answer.Pumping of groundwater for coal mining dries out springs and reduces the availability of spring water for irrigated terraces. - In the last part of the chapter, Nabhan notes first a social/cultural vulnerability that has emerged in recent times. What is this social vulnerability? Note it in the vulnerability space of the Human System rectangle.
Click for answer.Shift toward salaried work in cities by young people within the community. - Nabhan also notes a new social adaptive capacity that has arisen to challenge this vulnerability. What is this newest change that gives Nabhan hope about the fate of Hopi seed and agricultural systems?
Click for answer.Hopi organizations that seek to revitalize farming traditions and the Hopi food system. - Of the three shocks now documented in the diagram, to which one would the Hopi knowledge system and adaptive capacity been most exposed to over recent centuries? Answer in one sentence.
Click for answer.Likely, drought would have been a recurrent shock with which Hopi knowledge systems and adaptive capacity would have been familiar. - Compare the level of success the Hopi food system had in adapting to the older, better-known shock you chose in (7), in comparison to the other two shocks, at least during the last thirty years. (3-4 sentences, this may make the page run over to the next).
Click for answer.It was more challenging to adapt to these later shocks – their effects may have been unfamiliar based on long experience, and also they tend to affect not just production but the very means of existing adaptive capacity, for example limiting the effectiveness of known farming strategies (e.g. spring-fed terraces) or the entire knowledge system from which the Hopi drew their adaptive capacity. (some version of the above is acceptable as an answer: explain that it is more challenging and some reference to why that was so)
Module 11.2: Food Access and Food Insecurity
Module 11.2: Food Access and Food Insecurity
In this module, we will introduce the concepts surrounding the global challenge of food access and insecurity and the vulnerability of agri-food systems and particular populations to market and climate shocks. The concepts used in this unit build on the ideas of shocks and perturbations, resilience, adaptive capacity, and vulnerability of agri-food systems that were covered in unit 11.1. The unit, therefore, illustrates an urgent aspect of the analysis of the agri-food system as a coupled natural-human system.
Introduction to Food Access, Food Security, and Food-Insecure Conditions
Introduction to Food Access, Food Security, and Food-Insecure Conditions
Food access is a variable condition of human consumers, and it affects all of us each and every day. If you have ever traveled through an isolated area of the country or the world and encountered difficulty in encountering food that is customary or nutritious to eat, or within reach of your travel budget, you have an inkling of what it means to have issues with food access. For those with little capacity for food self-provisioning from farms or gardens, food access is determined by factors influencing the spatial accessibility, affordability, and quality of food sellers. The consistent dependability of adequate food access helps to enable food security whereby a person’s dietary needs and food preferences are met at levels needed to main a healthy and active life. Famines are conditions of extreme food shortage defined by specific characteristics (see below). Food-insecure conditions, such as acute and chronic hunger, are important conditions that affect many people both in the United States and in other countries.
Definitions:
Food Access:
Determined among consumers by the spatial accessibility and affordability of food retailers---specifically such factors as travel time to shopping, availability of healthy foods, and food prices---relative to the access to transportation and socioeconomic resources of food buyers. You examined both of these in the Module 3 nutrition activity that used the United States Atlas of Food Access. Some people and places, especially those with low-income, may face greater barriers in accessing healthy and affordable food retailers, which may negatively affect diet and food security. Food access among growers of food, whether full-time farmers or part-time farmers (including many smallholders), is influenced through the ability of e.g. farmers to produce and store enough food to complement purchased food or food themselves entirely, referred to as self-provisioning capacity.
Food Security:
“when all people at all times have access to sufficient, safe, nutritious food to maintain a healthy and active life. Commonly, the concept of food security is defined as including both physical and economic access to food that meets people's dietary needs as well as their food preferences” (World Health Organization)
Components of food security: Some food programs, such as the Food and Nutrition Technical Assistance (FANTA) unit of the U.S. Agency for International Development (USAID), have found it helpful to analyze food security as composed of:
- food availability (production and/or markets that deliver sufficient amounts of food)
- food access (see above definition)
- food utilization: the ability to exercise cultural food preferences and the effective use of food within households and communities to guarantee equitable nutrition.
Famine:
Famine is generally understood as acute (versus chronic) food shortages at crisis levels across a wide area, with disastrous health and mortality outcomes. While there are various formal definitions of famine, many experts say that there must be evidence of three specific outcomes before a famine can be declared:
- At least 20 percent of households face extreme food shortages with limited ability to cope; Note the explicit linkage to reduced adaptive capacity of famine victims (see module 11.1)
- The prevalence of acute malnutrition across the famine region, in a generalized way, must exceed 30 percent.
- Death rates from hunger must exceed 2 deaths per 10,000 people per day.
(World Food Program definition, from Zero Hunger [30]).
Food-insecure conditions: acute vs. chronic hunger and malnutrition:
The definitions above imply concepts of acute and chronic that are broadly analagous to their definitions in the medical field. An acute food shortage is one that occurs suddenly, while chronic conditions go on month after month or year after year. Most climate and price shocks provoke acute impacts or crises; while chronic malnutrition of vulnerable or poor populations within countries can go on year after year, provoking long-term negative health and livelihood impacts. Both are considered failures of food systems. Acute food insecurity is rare in wealthier countries, but chronic under-nutrition and poor nutrition can be common especially among the poor, and is one of the current crises faced in the United States.
Smallholders:
You may already be familiar with this term and absorbed some of the characteristics of smallholder farmers through our focus on the food systems that these farmers occupy around the world (Module 10.1). In formal terms, smallholders are food producers whose households typically own less than 2-3 hectares (approximately 7 acres) of farmland. Demographically, smallholders number approximately 2.0-2.5 billion people worldwide, which makes them a major stakeholder group and "target population" for global food and agricultural policy. The socioeconomic characteristics of smallholders vary widely. Some smallholders, including ones in the U.S. and Europe, may include locally well-to-do “hobby farmers” while the majority of smallholders are relatively poor, both in these countries and in the far more numerous populations of smallholders in countries such as China, India, and Brazil, and well as many other less developed and developing nations. The food access of smallholders typically combines some self-provisioning along with significant reliance on food acquisitions at stores and markets for staple foods such as grains, noodles, sugar, and oils.
Global Overview of Food Insecurity: Food Deficit Map and Required Readings
Global Overview of Food Insecurity: Food Deficit Map and Required Readings
A global overview of food insecurity can be obtained by mapping the average daily calorie supply per person for each country (see Figure 11.2.1). Mapped values are shown as ranging from less than 2,000 calories per person (e.g., in Ethiopia and Tanzania) to the range of 2,000-2,500 calories per person, which covers several countries in Africa as well as India and other countries in Asia in addition to Latin America and the Caribbean. Calories are a reasonable way to begin to understand large-scale patterns related to the lack of food access around the world. Nevertheless just looking at calories hides other aspects of human nutrition, such as the need for a diverse diet that satisfies human requirements for vitamins, minerals, and dietary fiber, which were described in module 3.
Required Readings
The following brief readings are good ways to appreciate the analyses and debates surrounding food insecurity and the challenges of "feeding the world", especially in the emerging scenario of climate change impacts on food production. They form part of the required reading for this module and will help you to better understand the materials and the summative assessment.
- Bittman, Mark. "Don't Ask How to Feed the 9 Billion [32]" NYT, Nov 12, 2014. (Note: The link is available only for users with Penn State accounts.)
- Deering, K. 2014. Stepping up to the challenge – Six issues facing global climate change and food security [26], CCAFS (Climate Change and Food Security Program)-UN (United Nations), 2014. Read the page headings on each challenge and the brief description of the response below.
Food Shortages, Chronic Malnutrition, and Famine: Coupled Human-Natural Systems Aspects
Food Shortages, Chronic Malnutrition, and Famine: Coupled Human-Natural Systems Aspects
Food Crises and Interacting Elements of the Natural and Human Systems
This section employs the framework of Coupled Natural-Human Systems (CHNS) in order to illustrate the interacting elements of natural and human systems that can combine to produce severe food shortages, chronic malnutrition, and famine food systems around the world. These CHNS concepts build on the diagrams and concepts in modules 10 and 11.1. You will also apply these concepts in the summative assessment on the next page.
As you read this brief description consult figure 11.2.2 below. It depicts that interacting conditions within the human and natural systems, combined with driving forces and feedbacks, are at the core of many cases of severe food shortages, chronic malnutrition, and famine in agri-food systems.
The best place to begin interpreting Figure 11.2.2 is by focusing on the driving forces emanating out of both the human and natural systems. Human system drivers often involve political and military instability and/or market failures and volatility (such as prices). Most cases of famine, as well as many instances of severe food shortages and chronic malnutrition, involve these human drivers. In addition, human drivers not only drive vulnerability in natural systems but may act first and foremost on human systems, reducing the adaptive capacity of consumers and producers, for example by reducing the purchasing power of poor populations during price spikes.
Figure 11.2.2 also shows that drivers emanate from the natural system. Climate change and variation, such as drought and flooding, often contribute to cases of famine, as well as severe food shortages and chronic malnutrition.
These drivers, however, are only PART of the causal linkages of severe food shortages, chronic malnutrition, and famine. Similarly important are the conditions of poor resilience (potentially arising as result of weak social infrastructure), low levels of adaptive capacity and poverty. Poverty is tragically involved as a cause of nearly all cases of severe food shortages, chronic malnutrition, and famine. For Mark Bittman, the author of the required reading on the previous page, the link between poverty and failures of food systems, rather than a failure of any other human or natural factors such as food production, food distribution, or overpopulation, is the central thesis he advances in his short opinion piece. You may want to glance again at this reading in order to remind yourself of why poverty is so deeply implicated in the failures of agri-food systems.
Weak or inadequate resilience (R) and adaptive capacity (AC), along with vulnerability (V), are also symptomatic of natural systems prone to severe food shortages, chronic malnutrition, and famine. For example, cropping and livestock systems unable to tolerate extreme conditions illustrate a low level of adaptive capacity (AC) that can contribute significantly to the failure of agri-food systems.
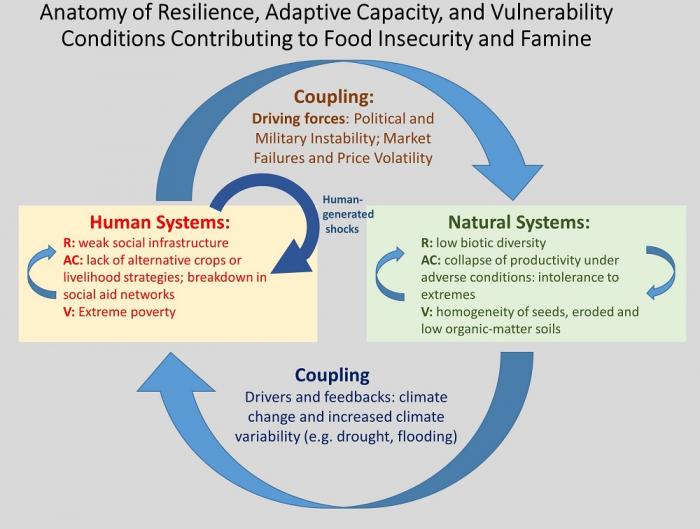
Summative Assessment: Anatomy of a Somali Famine (2010 - 2012)
Summative Assessment: Anatomy of a Somali Famine (2010 - 2012)
Instructions
Download the worksheet and follow the detailed instructions provided.
Files to Download
SEE WORKSHEET ON NEXT PAGE
Anatomy of a Famine: multifactorial failures of adaptive capacity to climate and social shocks.
This worksheet relies heavily on the data resources presented by the Food Security and Nutrition Analysis Unit – Somalia [33]and the Famine Early Warning System Network [34] (FEWS Net).
This worksheet uses maps, tables, and graphs to guide you in analyzing a tragic famine in Somalia between 2010 and 2012 as a case of adaptive capacity and vulnerability (see Module 9.2 for the definition of a famine). As many as 260,000 people died in this famine, half of them children under five years old (optional: see Somalia famine 'killed 260,000 people' [35], May 2, 2013). You should read carefully through the case study presented in the worksheet (download above) and answer the question in each section, e.g. “Question A1” and the two summary questions at the end.
Submitting Your Assignment
You do not need to submit your worksheet; it will instead act as a guide for you to complete the summative assessment quiz.
Summary and Final Tasks
Summary
Module 11 analyzes the way in which food production and food systems are vulnerable to shocks and perturbations, such as extreme weather, a changing climate, and economic and political crises like those caused by wars. However, food producers like farmers, and food systems generally, don't merely absorb or suffer these shocks. Rather, farmers and other participants in food system exhibit adaptive capacity or capacities, part of a more general system property called resilience, which allows them to respond to and partially blunt the impacts of perturbations. In addition to forms of adaptive capacity such as migration, wage labor, and irrigated crops, which allow farmers to access food in difficult conditions, a major form of adaptive capacity we have examined in module 11.1 is that of agrobiodiversity: the different crops and crop varieties possessed by a community or society. This range of crops help these communities and a whole food system to respond over time to new and different conditions for food production and even escape extreme conditions.
However, as module 11.2 and the summative assessment indicate, there are situations where farmers become extremely vulnerable to shocks and economic marginalization. This may take the form of food insecurity and consequent malnutrition, a topic that was first introduced in module 3. There are also situations, such as the Somali famine of 2012, and earlier famines, in which a combination of climatic and political conditions become so extreme that widespread hunger and mortality occurs. Knowing about the principles of adaptive capacity and vulnerability, and the terrible consequences of vulnerability in famines may help you to act constructively to help global society to end acute hunger, as well as more chronic food insecurity around the world.
Reminder - Complete all of the Module 11 tasks!
You have reached the end of Module 11! Double-check the to-do list on the Module 11 Roadmap [36] to make sure you have completed all of the activities listed there before you begin module 12 where you will finalize your capstone project.
References and Further Reading
Chambers, R. (1989). Editorial introduction: vulnerability, coping and policy. IDS Bulletin, 20(2), 1-7.
Folke, C., Colding, J., & Berkes, F. (2003). Synthesis: building resilience and adaptive capacity in social-ecological systems. Navigating social-ecological systems: Building resilience for complexity and change, 352-387.
Gillis, Justin. A Warming Planet Struggles to Feed Itself [37], New York Times. June 4, 2011. This article provides an insight into the efforts to adapt to climate change with more resilient crops, and maintain or increase production of crops in the next decades.
Hajjar, Reem, Devra I. Jarvis, and Barbara Gemmill-Herren. "The utility of crop genetic diversity in maintaining ecosystem services." Agriculture, Ecosystems & Environment 123.4 (2008): 261-270.
Nabhan, G.P. "Melting Glaciers and Waves of Grain: The Pamirs", p. 45-64, Chapter 3 in Where Our Food Comes From: Retracing Nikolay Vavilov's Quest to End Famine. Washington: Island Press.
Capstone Project Stage 4 Assignment
Capstone Project Stage 4 Assignment
Strategies for Sustainability
(Modules 10 and 11)
You’ve now completed the content modules for the Future of Food course. In Stage 4 of the capstone project, you’ll gather a bit more data about your region. In Stage 5, you will put together your final web page which will present your assessment of the current status of your assigned regional food system, projections for future scenarios of increased human population growth and increased temperatures in your region, and your proposed strategies to enhance the resilience and sustainability of your region’s food systems.
In Stage 4, you will gather data related to what you’ve learned in Modules 10 and 11. Also, you will explore population projections for your assigned region, so you can begin to assess the potential future resilience of the food systems of your assigned region.

Capstone Stage 4 (food systems and sustainability)
describe regional food systems
assess using life-cycle concepts
discuss agrobiodiversity using RACV
discuss food insecurity/security
research population growth projections
propose strategies for sustainability
What to do for Stage 4?
- Download and complete the Capstone Project Stage 4 worksheet [38] that contains a table summarizing the data you need to collect to complete this stage. Remember, you need to think deeply about each response and write responses that reflect the depth of your thought as informed by your research.
- Add questions and continue to research the questions in your worksheet files.
- Keep track of all of the resources and references you use.
- Add relevant data, maps, and figures to your PowerPoint file.
- Revise your CHNS diagram and/or create a new one incorporating topics from Modules 10 and 11.
Module 12: Capstone Project Stage 5
Module 12: Capstone Project Stage 5
Future Food Scenarios
Stage 5 is the final stage of the semester-long capstone project. There are two parts to this assignment.
- You will submit a rough draft of your final Capstone Paper to be peer-reviewed. You will submit 700-1000 words, or roughly half of your final paper. Once the deadline for this submission passes, you will be able to access the paper of a peer's to review. When reviewing someone else's paper, consider the following:
- What are aspects of this paper do you enjoy the most? (3-5 sentences)
- What three aspects of this paper do you think could be improved? (3-5 sentences)
- To improve this paper, what two things would you change? (3-5 sentences)
- You will write a 1500-2000 word paper (approximately 6-8 pages double-spaced) as your final project. For this paper, you will use the data you've been gathering in the previous capstone stages throughout the semester to write a paper. Your paper will summarize the data and information you’ve gathered in stages 1, 2, 3, and 4 about the food systems of your assigned region. You may incorporate images, maps, and/or charts in your final paper, but keep in mind that these do not go toward your final count. You must include proper citations and references in your paper for any work (ideas, quoted material, maps/charts/images) that is not your own. If at any time you have a doubt about needing a citation, you should go ahead and include one or reach out to your instructor for assistance.
You will follow the instructions from your teacher to write and submit the paper. Your paper must include the following information:
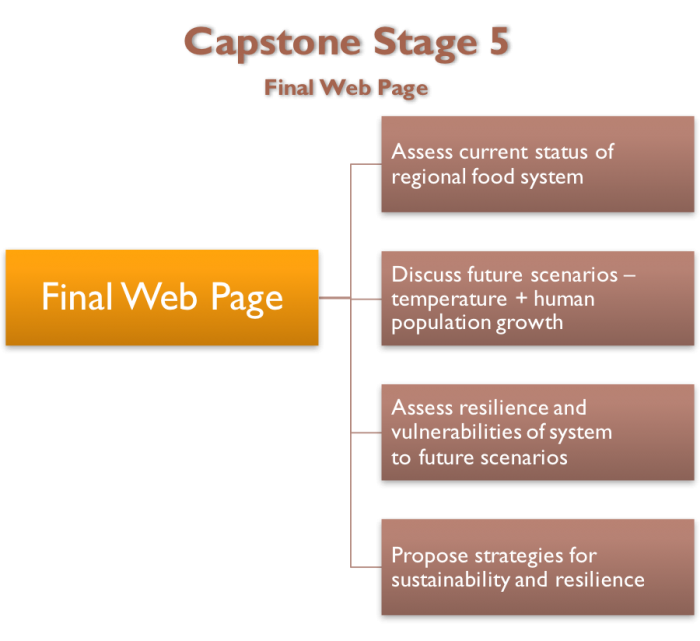
- Assess current status of regional food system
- Discuss future scenarios - temperature + human population growth
- Assess resilience and vulnerabilities of system to future scenarios
- Propose strategies for sustainability and resilience
What to do for Stage 5?
- Download the Capstone Project Stage 5: Final Paper Project [39]
- Follow the instructions from your instructor to write the paper.
- Turn in via Canvas:
- Your final paper draft for peer-review
- Your final paper
Grading Information and Rubric for Final Capstone Paper:
| Criteria | 9 | 6 | 3 | 1 |
|---|---|---|---|---|
| Completeness of paper & all supporting documents: Conforms to all instructions and guidelines | All specific instructions are met and exceeded; no components are omitted. | Most instructions are met with only 1 to 2 minor omissions | Some components are present with the omission of several key elements | Missing most components of the project, minimal conformity to guidelines. |
| Identification of the key food systems of the region | Clearly and thoroughly identifies the regional food systems with a clear application of material from Modules 1, 2, & 10 | Satisfactory identification of the regional food systems some mention of material from modules 1, 2, & 10 | Minimal identification of the regional food systems some mention of material from modules 1, 2, & 10 | Little to no identification of the regional food systems some mention of material from modules 1, 2, & 10 |
| Assessment of the regional food system and the physical environment of the region (water resources, soils, crops, climate) | Thoroughly articulates specified elements with in-depth & accurate application of key concepts from Modules 4, 5, 6 & 9 | Satisfactory articulation of specified elements with some application of key concepts from Modules 4, 5, 6 & 9 | Minimal articulation of specified elements with little application of key concepts from Modules 4, 5, 6 & 9 | Little to no articulation and application of key concepts from Modules 4, 5, 6 & 9 |
| Analysis of the resilience of the regional food system based on data and facts | Thoughtful and thorough consideration of potential vulnerabilities using concepts from Module 11 | Satisfactory consideration of potential vulnerabilities using concepts from Module 11 | Minimal consideration of potential vulnerabilities with little use of concepts from Module 11 | Little to no consideration of potential vulnerabilities with little use of concepts from Module 11 |
| Proposes reasonable strategies for sustainability and resilience based on data and facts | Clearly develops viable & insightful strategies with well‐ supported data & research | Develops viable strategies supported by some data and research | Develops minimal strategies supported with limited data and research | Little to no strategies provided or not supported by data and research |
| Criteria | 5 | 3 | 2 | 1 |
| Overall professionalism and timing | Advanced ‐ no typos, or grammatical concerns, attention to detail with superior effort demonstrated | A solid effort with few typos, or grammatical concerns, attention to detail evident with some effort demonstrated | Minimal effort with numerous typos, or grammatical concerns, little attention to detail minimal effort demonstrated | Little to no effort demonstrated with extensive typos, or grammatical concerns, little to no to attention to detail |
| Total Points (out of 50) |
- Summary of Current Regional Food System
- Summarize the data and information that you’ve gathered throughout the semester about your assigned regional food system(s) and the interaction between those food systems and the environment, as well as any relevant socioeconomic, cultural and policy factors.
- Provide an overview of the current status of your assigned regional food system(s). Summarize the data and information that you acquired in the previous modules to present the current status of your regional food system. Details are provided in the Stage 5 worksheet document.
- Discussion of future scenarios
- What are projections for regional human population growth in your assigned region?
- What are the projections for temperature increases in your assigned region?
- Analysis of the resilience of future food system
- Provide a discussion of the resilience of your food system given the potential of increasing human population growth and increasing temperatures.
- Consider possible impacts of climate change and human population growth on the regional food system and the resilience and/or vulnerability of the food system to those changes.
- Proposed strategies for sustainability enhanced resilience
- Propose strategies that contribute to the increased resilience of your assigned regional food systems in the face of human population growth and rising temperatures and evaporation rates.
Files to Download (if you haven't already done so)
Capstone Project Stage 1
Capstone Project Stage 1
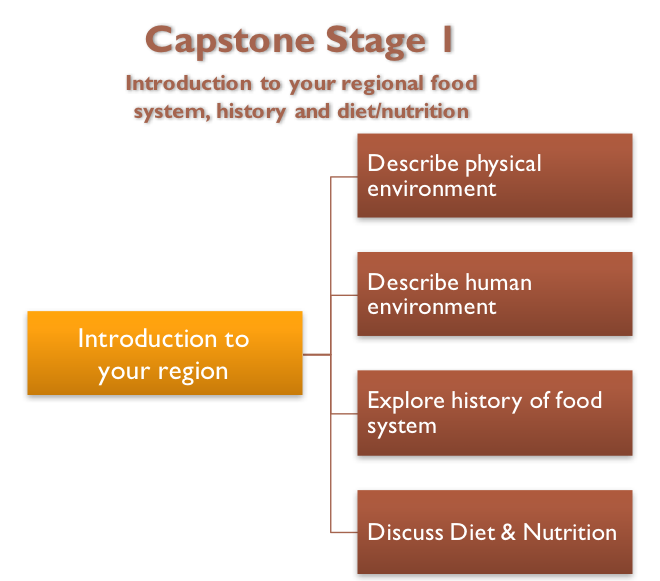
Capstone Stage I - Introduction to your regional food system, history and diet/nutrition
- Describe physical environment
- Describe human environment
- Explore history of the food system
- Discuss diet and nutrition
Instructions
- Confirm with your instructor which region you will be studying and introduce yourself to your group members.
- Download and complete the CapstoneProject_Stage1.docx worksheet that contains a table summarizing the data you’ll need to collect to complete this stage. You need to think deeply about each response and write responses that reflect the depth of your thought as informed by your research. Do not just write one-word answers.
- Create a powerpoint file that you’ll use to store maps, data, graphs, photos, etc. that you collect related to your assigned region. For every piece of information that you put in your powerpoint file, you MUST include a citation that clearly explains where that piece of information came from.
- Create a Word document to list questions that you have about your region related to the key course topics covered so far. Include in this document a record or your efforts to answer the questions so far.
Capstone Project Stage 2
Capstone Project Stage 2
Water, crops, and climate
The diagram below summarizes the topics you will explore in Stage 2 for your assigned region.
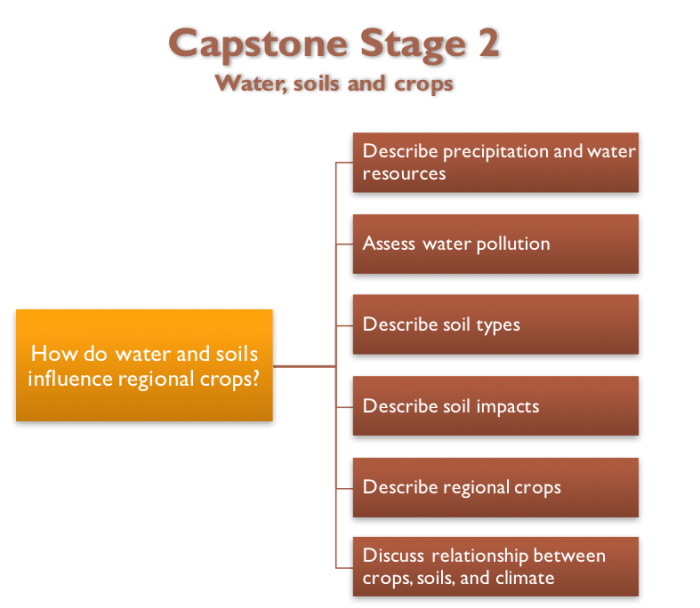
Capstone Stage 2 - Water, soils, and crops
How do water and soils influence regional crops?
- Describe precipitation and water resources
- Assess water pollution
- Describe soil types
- Describe soil impacts
- Describe regional crops
- Discuss the relationship between crops, soils, and climate
What to do for Stage 2?
- Download and complete the CapstoneProject_Stage2.docx worksheet that contains a table summarizing the data you’ll need to collect to complete this stage. Remember, you need to think deeply about each response and write responses that reflect the depth of your thought as informed by your research.
- Add relevant data to your PowerPoint file.
- Add questions and continue to research the questions in your word file.
- Capstone Project Overview: Where do you stand?
- At this stage, you should have started to investigate your assigned region and have added information, maps, and data to your worksheets and PowerPoint file for Stages 1 and 2.
Upon completion of stage 2, you should have at this point:
- Confirmed which region you will study for your capstone project and identified the members of your group.
- Initiated research and data compilation in the Stages 1 and 2 sections of the Future Food Scenarios table.
- a. Stage 1: Regional food setting, history of regional food systems, soil types
- b. Stage 2: Water resources, c, ops, and climate
- Created a PowerPoint file to hold the data that you are collecting about the food system of your assigned region. The information you may have:
- a. Labeled map of your region
- b. Soil map of your region
- c. Precipitation and temperature map of your region
- d. Major crops and crop families grown in your region
- Compiled an initial list of questions you have about your region related to key course topics and initiated significant efforts to answer.
Capstone Project Stage 3
Capstone Project Stage 3
Vulnerability and Resilience
At this stage, you should have collected quite a bit of data related to the physical environment of your region (water, soils, and climate) as well as related to the regional food system, including the history of the regional food system and which crops are grown in your region. You may also have discovered some impacts that the regional food system is having on soil and water resources in the region.
In stage 3, you will explore the vulnerabilities in your regional food system and the potential resilience of the system. The diagram below summarizes what you will cover in Stage 3.
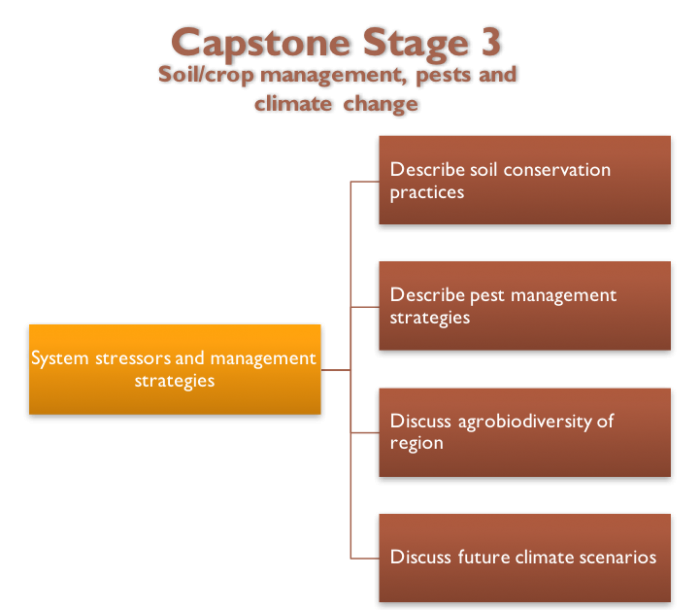
Capstone Stage 3 (soil/crop management, pests, and climate change)
- System stressors and management strategies:
- describe soil conservation practices
- describe pest management strategies
- discuss agrobiodiversity of region
- discuss future climate scenarios
What to do for Stage 3?
- Download and complete the CapstoneProject_Stage3.docx worksheet that contains a table summarizing the data you’ll need to collect to complete this stage. Remember, you need to think deeply about each response and write responses that reflect the depth of your thought as informed by your research.
- Add questions and continue to research the questions in your word file.
- Keep track of all of the resources and references you use.
- Add relevant data, maps, and figures to your PowerPoint file.
Capstone Project Stage 4
Capstone Project Stage 4
Strategies for Sustainability
Stage 4 is the last piece of data gathering and research that you need to do.
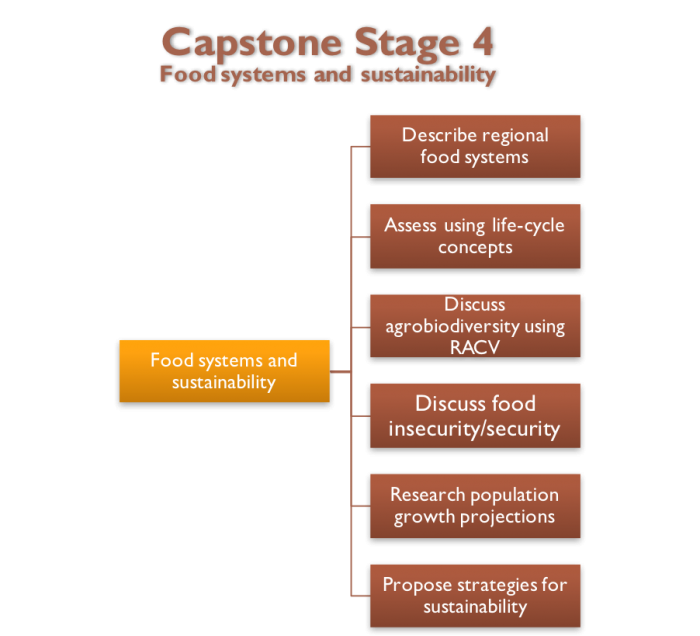
- describe regional food systems
- assess using the life-cycle concepts
- discuss agrobiodiversity using RACV
- discuss food insecurity/security
- research population growth projections
- propose strategies for sustainability
What to do for Stage 4?
- Download and complete the CapstoneProject_Stage4a.docx worksheet that contains a table summarizing the data you need to collect to complete this stage. Remember, you need to think deeply about each response and write responses that reflect the depth of your thought as informed by your research.
- Add questions and continue to research the questions in your word file.
- Keep track of all of the resources and references you use.
- Add relevant data, maps, and figures to your PowerPoint file