Lessons
This is the course outline.
Section 1: Introduction
Section 1: Introduction
The first section of the course presents an introduction to the course content as well as some fundamental ideas that help you to understand food systems, their impacts on earth surface processes, their history, and their emergence as one of the dominant interactions between humanity and the environment. Module 1 introduces the food system concept and the nature of coupling between human society and natural systems in food production and consumption. We also emphasize the multiple disciplines of natural and social sciences needed to understand food systems. Then, Module 2 addresses the history and emergence of food systems, in examples such as the domestication of crops, a step in human history which is quintessentially both human and natural. Module 3 introduces the important subject of human nutrition with a food systems background, and in this final module of the section, you will learn the basic requirements for healthy nutrition, as well as current and emerging challenges for human nutrition in food systems.
Modules
- Module 1: Introduction
- Capstone Project Overview
- Module 2: History of Food Systems
- Module 3: Diet and Nutrition
- Capstone Project Stage 1
Section Goals
Upon completion of Section 1 students will be able to:
- Identify natural and human subsystem components within a food systems framework.
- Describe the concept of the Anthropocene and the history of human-natural food systems and explain several examples of the impacts of humans on the earth system as part of food systems.
- Employ a coupled-human natural systems framework to assemble and diagram basic relationships within examples of coupled natural-human food systems components.
- Combine the above abilities to initiate an original, group-authored analysis of a food system within a world region to evaluate linkages, critique the sustainability, and propose solutions for this food system and its components (the course capstone project).
- Describe the basic elements of a healthy diet from a scientific standpoint.
- Describe current major nutrition challenges and their immediate causes, such as nutrient deficiencies and calorie over-consumption.
- Relate current major nutrition challenges to social factors such as food access and changing diets in modern food systems.
Section Objectives
In order to reach these goals, we have established the following objectives for student learning. Upon completion of the modules within Section 1, you will be able to:
- Construct a concept map representing an example food system.
- Identify human and natural component parts of food systems.
- Apply systems thinking strategies in analyzing food systems at an elementary level, including assessing relationships between natural and human system factors that display key functions and characteristics of food systems.
- Identify sustainable and unsustainable characteristics of food systems.
- Identify component parts of food systems that embody natural vs. human subsystems, and production, transportation, and consumption function of food systems.
- Describe the major features of hunter-gatherers’ use of food and the environment.
- Define and describe the domestication of plants and animals in early agriculture.
- Define and give examples of spatial diffusion, adaptation, niche construction, and carrying capacity in environment-food systems.
- Define and describe each of the four (4) principal historical-geographic periods of environment-food systems.
- Give examples of early domesticated plants and animals and their region of domestication.
- Within a Coupled Human-Natural Systems framework, relate fundamental drivers and feedbacks in natural and human systems over prehistoric and historical time to the development and spread of agriculture and other changes in food systems over time.
- Relate the origins and current dominance of agriculture to the concept of the Anthropocene period presented in module one.
- Describe the basic categories of nutrients and how these contribute to human function and health.
- Describe the major changes taking place in diet/nutrition in rich and poor countries, respectively.
- Define the concept of food access and the term "food desert" as contrasted to the broader concepts of food security and food insecurity.
- Understand changes in thinking around healthy nutrition and basic principles that have remained.
- Use an online nutrition tool to analyze and compare diets and areas in which they are deficient or excessive in nutrients.
- Analyze why food access is an issue in modern food systems.
- Use a mapping tool to analyze and compare the situation of food access in cities.
Module 1: Introduction
Module 1: Introduction
In the two introductory modules (1.1 and 1.2) of the course, we will introduce the main theme of the course: learning about food systems as systems that combine human social systems, with the natural earth system and earth surface processes, to fulfill the food needs of human societies. The objective is to prepare you to tackle learning about sub-components of these systems (e.g. water resources, soil management, adaptive capacity of food systems to climate change) in an integrated rather than a piecemeal way, which is essential to understanding the current function of food systems as well as proposing future solutions for these systems. During this introductory unit, you will also embark on the course capstone project that asks you to structure your learning about food systems of a particular world region. These introductory modules will also present the systems concept as a general way of thinking that applies especially well to food systems.
Goals and Learning Objectives
Goals and Learning Objectives
Goals
- Identify connections between human and natural components of food systems.
- Understand and apply systems thinking principles to food systems.
Learning Objectives
After completing this module, students will be able to:
- Construct a concept map representing two food systems.
- Identify human and natural component parts of food systems.
- Apply systems thinking strategies in analyzing food systems at an elementary level, including assessing relationships between natural and human system factors that display key functions and characteristics of food systems.
- Identify sustainable and unsustainable characteristics of food systems.
Assignments
Module 1 Roadmap
Detailed instructions for completing the Summative Assessment will be provided in each module.
| Action | Assignment | Location |
|---|---|---|
| To Read |
|
|
| To Do |
|
|
Questions?
If you prefer to use email:
If you have any questions, please send them through Canvas e-mail. We will check daily to respond. If your question is one that is relevant to the entire class, we may respond to the entire class rather than individually.
If you prefer to use the discussion forums:
If you have any questions, please post them to the discussion forum in Canvas. We will check that discussion forum daily to respond. While you are there, feel free to post your own responses if you, too, are able to help out a classmate.
Module 1.1: The Future of Food: Course Overview
Module 1.1: The Future of Food: Course Overview
This course, The Future of Food, provides introductory-level learning perspectives on human and environmental systems of food and resource use, in order to understand challenges and opportunities. The goal of the course is to understand and be able to apply an integrated perspective on the environmental and human dimensions of environmental issues related to food production and consumption. The content of the course addresses both environmental and human systems of food and resource use to an equal extent. In the case of the first (environmental systems), you will learn about the geosystems and agroecology of soil, nutrients, crops, water, and climate that form the fundamental basics of food-growing environmental systems. In the case of the second (human systems) you will learn about factors such as population and the roles of culture, social interactions, economics, and politics. These multiple perspectives are integrated into the framework of "Coupled Natural-Human Systems" (the CNHS is used beginning in 1.2 (also called Coupled Human-Natural Systems or CHN). We will focus on current environment-food systems, while also including the past trajectories and future trends of food systems. The course also blends information and analysis of local-scale environment and food systems with a focus on the regional, national, and global scales, and asks you as a learner to apply this knowledge in a Capstone Project that you assemble over the course of the semester in collaboration with other students. The course features active learning in both online and classroom settings and a wide variety of learning materials and methods.
Food, Society, and the Environment: Coupled Human-Natural Systems
Food, Society, and the Environment: Coupled Human-Natural Systems
“We are what we eat.” We’ve all heard this common expression and may think of it in nutritional and biological terms: for example the way that the chicken or beans we consume are turned into muscle tissues. However, this simple phrase has a deeper meaning: Food production, food culture, and organization of food transport and consumption loom very largely in the way that our society "is". These food-related activities also strongly impact the earth's fundamental surface processes and ecosystems. So, we are what we eat, but in a societal as well as an individual sense. This wider vision of food as a driving presence within society is increasingly relevant as groups and individuals like you become more interested in the ramifications of their food for themselves and for the environment. This course is designed to provide you with the tools to understand the combined environmental and human dimensions of food production and consumption. To do so we must start with some simple questions and reflect a bit on how we can address them.

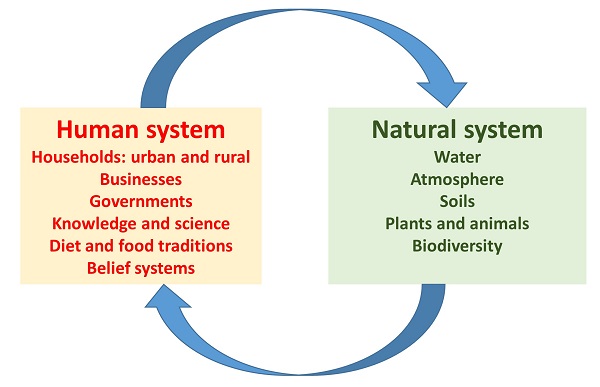
Where does our food come from? And, how can we make our food supply more sustainable? These two questions may seem simple, but they lead us to a range of considerations that are covered through the remainder of this course. As we consider these questions in each module, we'll explore a model of food systems as human systems in interaction with natural systems, or coupled human-natural systems (Fig. 1.1.2). As the name suggests, the concept of Coupled Human-Natural Systems (CHNS) tries to describe two major components that are involved in the production and consumption of food. The first component is the natural world and a set of interacting natural factors. Some of you may know the term ecosystem, and ecosystems developed from interacting natural components such as water, soils, plants, and animals (e.g. Fig. 1.2.1 in module 1.2) are the context for most food production. Throughout the course, we may also refer to the elements and processes of ecosystems as the earth system and earth system processes, or simply as the environment. These natural systems are a basic foundation of the food supply that we will learn more about in modules four through six (Environmental Dynamics and Drivers). The continued productivity of natural systems is evaluated as being crucial to sustainability, as you will see in the short reading below.
On the other hand, the two questions posed above involve the role of people, both as individuals in groups such as communities, institutions (including colleges and universities, farm and food processing businesses, and farmer organizations, for example) and political units such as countries. To introduce this dimension we often refer to this globally as the "human system" within a coupled human-natural system (Fig. 1.1.2.; a complete definition of human and natural systems are given in Module 1.2). Within the human system, factors such as styles of farming and food choices, tastes, economic inequality, and farmer and scientific knowledge that inform humans' management of ecosystem emerge from human cultural, social, economic, and political influences.
The end result of these interactions between human and natural systems are what we call a food system, which has has also been called an "environment-food system" (see the introductory reading on the next page) with "environment" pointing to the natural components and the "food system" pointing to the human organization needed to produce, transport, and deliver food to consumers, along with a host of cultural, regulatory, and other aspects of human society that relate to food. In terms of geography, the interactions of environment-food systems exhibit a huge range of variation across the world. As we all know this variation exists between countries, so that food and farming types can be associated with “Chinese food,” “French food,” “Peruvian food”, or scores of other examples. Farming and food also vary a great deal among regions within a country and sometimes even among local places, as we know if we compare a large dairy or grain farm with a fresh vegetable farm serving local markets here in the United States. Understanding the geographic variations of environment-food interactions is key to recognizing their increased relevance and importance to people and places.
Guided Introductory Reading: Why Environment and Food?
Guided Introductory Reading: Why Environment and Food?
Introductory Reading Assignment:
- Read the brief section (pp 1-7) of Colin Sage's book "Environment and Food", entitled "Why Environment and Food? [1]" (see the assignments page). The author explains why we are interested in considering food's relationship to the environment (the latter is what we are also calling "natural systems"). He presents a provocative and critical account of our relation to food in modern societies (human systems) and the need to think about food production and consumption patterns in relation to the environment.
- As you read, try to identify three to five main points of the reading, which is always a good practice when you read in this course and other courses.
- After reading the assignment, continue reading below and see whether your perceptions of this author's analysis agree with the main arguments we have noted below. You may have noted similar points, or additional ones not noted here.
Consult AFTER Reading:
First, consider the list below of some of the main ideas in the reading. Do these roughly agree with your list of main points? You may have identified additional points in the reading.
- The essential need of humans to eat has defined the relation of all societies to food production and the environment through history.
- Transformation of food production systems in the last 100 years has dramatically changed diets and societies' impact on the environment:
- Yields have increased with industrial methods and food for many in the world has become more available.
- However, diets have worsened in many cases so that human nutrition has suffered.
- Inequality in access to food based on wealth and poverty of consumers has continued.
- Negative impacts on the environment have multiplied, which is expressed in the large amounts of water needed to produce food, the strong dependence of food production on fossil fuels, and the contribution of food production to CO2 methane, and other greenhouse gas emissions that cause climate change.
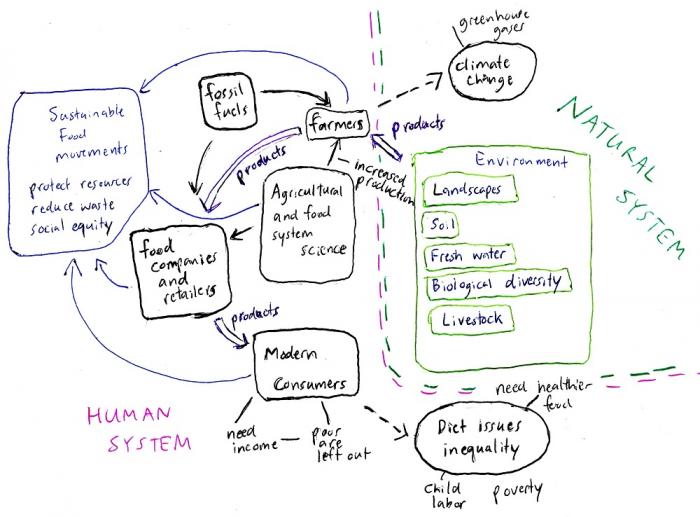
- A sustainable food system, which is increasingly the vision promoted by some food producers and consumers, involves reducing fossil fuel use in food production, cutting waste of food in transport and consumption, and increasing the just distribution of food to consumers at all levels of wealth.
We can also think of the way that these main points fit into a diagram, sometimes called a concept map, like the one that is drawn here. As part of the final assignment or summative assessment for module 1, and in the capstone assignment for the entire course, you will be drawing concept maps of a food system example. This diagram may get you started on visualizing human and natural components of food systems and their interaction. You'll note that a concept map can start from a very preliminary drawing or rough draft (like this one), and gradually be reorganized as you learn more about a topic use an organizational principle like the coupled human-natural systems concept we present in this course.
Drastic Impacts of Food Production on Planet Earth: The Anthropocene
Drastic Impacts of Food Production on Planet Earth: The Anthropocene
After reading Colin Sage's brief introduction to the modern-day issues surrounding environment and food, you should be aware of the fact that food production by human societies has transformed the earth's natural systems. In fact, it is very difficult to understate the enormous impact that food production to support human societies has had on the surface of our planet as the earth's population has grown. Here are some of them:
- Humans have replaced permanent forests and wild grasslands with farm fields that allow much higher rates of soil erosion where the soil is not covered year-round. This has led to trillions of tons of soil being washed into rivers, lakes, and oceans, where it is unavailable as a key resource for food production.
- The expansion of farming and grazing has contributed to the reduction and elimination of wild forest and grassland species of plants and animals: the loss of earth's biodiversity.
- In some cases, previously unproductive dryland areas have been made highly productive through the movement of irrigation water into desert areas, allowing the expansion of human settlements.
- In other cases, elimination of forest in favor of farmland has contributed to the expansion of desert areas and worsening droughts.
- Humans have intensively fertilized cropland to make it more productive with manures and chemical fertilizers, leading to excesses of nutrients and pollution in many of the world's waterways.
- Farming and the other human activities that support modern food systems are major contributors to changes in earth's climate linked to increasing greenhouse gas concentrations in the atmosphere.
One term that is used to summarize these human impacts within the history of the earth is the Anthropocene, from Anthropos (human) and cene, a suffix used within the geologic timescale to denote the recent past. The Anthropocene has been proposed as a new geologic epoch because of the profound and unprecedented human alteration of earth's natural systems that we point to above. Scientists researching the Anthropocene tend to agree that it was the beginnings of agriculture that probably marked the onset of the Anthropocene. We will introduce you to the history of agriculture in Module 2. The concept of sustainable food systems that Colin Sage points to in the introductory reading are currently a major topic of debate and discussion in human societies and are a consequence of the sustainability issues that are a key feature of the Anthropocene. The idea of sustainable food systems is also a major topic of this course, and you will be asked to contribute to this discussion in your capstone project. The term Anthropocene helps us to appreciate the epochal change of the extent and degree of these changes. Yet these changes do not suggest or imply that all is lost, or that all cropping and livestock-raising are pervasively damaging to the environment. As you’ll see throughout this course there are already well-developed options worth considering and pursuing in order to expand sustainable environment-food systems.
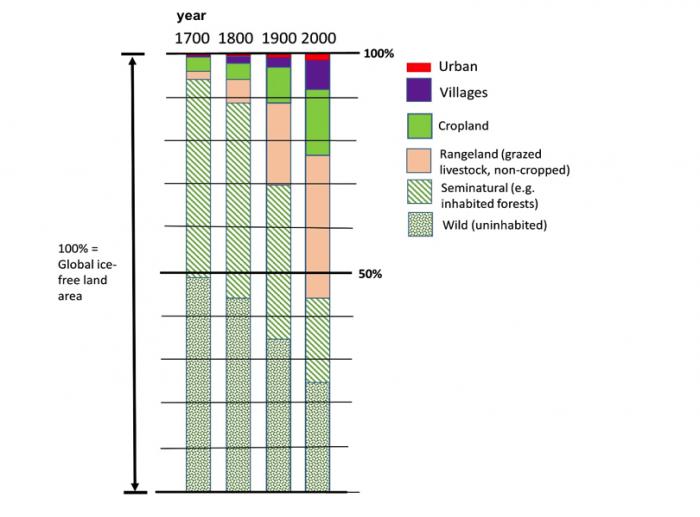
Studies of the changes in the type of ecosystems that cover different areas of the earth or land cover (e.g. crop fields versus forest versus desert) allow us to appreciate the impact on earth during the Anthropocene (Fig. 1.1.4 below). We can see in the bar chart reflecting changes over time in land cover that farmed and grazed areas involved in food production for rising populations have expanded from less than 10% of earth's usable (ice-free) surface in the 1700s to over 50% in 2000, a stupendous change considering the size of earth's land area (similar expansion of human influence in food production in earth's ocean fisheries has also occurred).
(Approximate estimate of the percentages of global allocation in ice-free land area)
Year 1700:
- Wild (uninhabited) ≈ 49%
- Seminatural (e.g. inhabited forests) ≈ 45%
- Rangeland (grazed livestock, non-cropped) ≈ 1.5%
- Cropland ≈ 3%
- Villages ≈ 0.25
- Urban ≈ 0.25%
Year 1800:
- Wild (uninhabited) ≈ 45%
- Seminatural (e.g. inhabited forests) ≈ 45%
- Rangeland (grazed livestock, non-cropped) ≈ 5%
- Cropland ≈ 3%
- Villages ≈ 1.5%
- Urban ≈ 0.5%
Year 1900:
- Wild (uninhabited) ≈ 35%
- Seminatural (e.g. inhabited forests) ≈ 35%
- Rangeland (grazed livestock, non-cropped) ≈ 19.5%
- Cropland ≈ 8%
- Villages ≈ 1.75%
- Urban ≈ 0.75%
Year 2000:
- Wild (uninhabited) ≈ 24.5%
- Seminatural (e.g. inhabited forests) ≈ 20%
- Rangeland (grazed livestock, non-cropped) ≈ 32%
- Cropland ≈ 14%
- Villages ≈ 8.5%
- Urban ≈ 1%
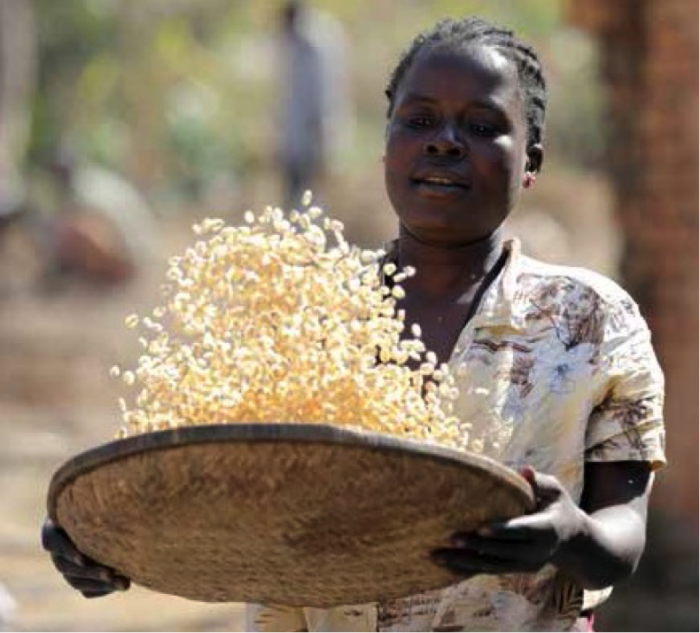
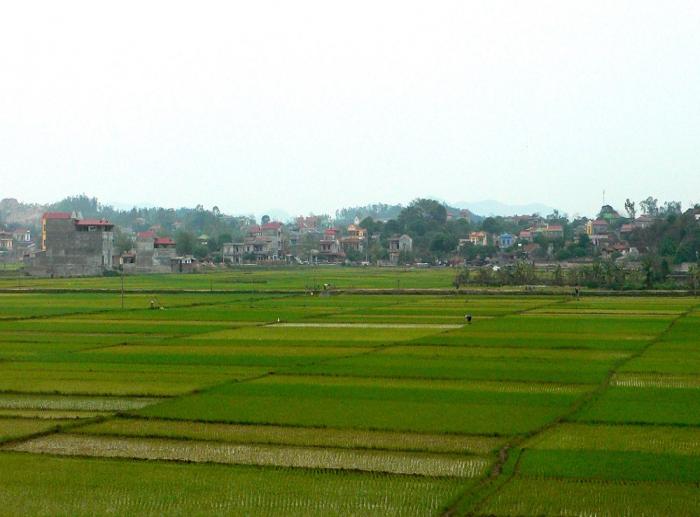
Similarly important is that the Anthropocene, or the "human recent history of the earth" if we translate the word slightly, brings to our attention to not only the changes in natural systems or the environment but also the significant alterations of the human dimension of human-natural systems related to food. It’s safe to say that for nearly all of us this human dimension is significantly different than it was for our grandparents or even our parents. Some basic examples can be used to illustrate this trend. In the United States, for example, the population of farmers has continued to shrink. It is now less than 4 percent of the national population. At present this fraction, though generally declining worldwide, is somewhat higher in European countries and much higher in Asia and Africa. The continued importance of food-growing agriculture among large sectors of the populations in Africa and Asia, for example, creates different patterns of livelihoods (Fig 1.1.5a) and landscapes (Fig. 1.1.5b).
One important point: familiarity with environment-food systems through immediate experience among human populations, including you and your fellow learners in this course, is presumably at an all-time low. It’s also an interesting reflection on the human dimension of the Anthropocene. Other statistics could be quoted to show related trends. For example, the average amount of time being spent on food preparation is roughly one-quarter the standard allocation of time devoted to this activity 40-50 years ago. This course takes these statistics as a challenge and opportunity since environment-food interactions are both less-known than previously and, at the same time, have a very high level of importance to the environment and society.
Sustainability: Environments, Communities, and Economics
Sustainability: Environments, Communities, and Economics
The guided reading in this module on concerns around "Environment and Food" and our consideration of the Anthropocene as an era defined by the dramatic expansion of food production on earth's surface lead us naturally to the concept of sustainability, which is a common term in much of our discourse in the present day, in many different settings from the coffee shop and classroom, to dinner tables and company boardrooms, to government offices. As we think about the increasingly obvious impacts of our food system on the global environment and on the social dynamics of global society, we are concerned that this food system needs to (a) be part of society and communities with adequate opportunities for all and just relationships among people and (b) not compromise the future productivity and health of earth's many different environments. As part of the introductory work of this first module, we ought to consider a definition of sustainability that is broad enough to encompass both human and natural systems, and geographic scales from communities to single farming communities to the worldwide reach of food production and transport in the modern global food system. We present below in figure 1.1.6 one relatively common definition of sustainability as a "three-legged stool" (we will return to this concept later in Module 10 when we return to food systems).

In the model of the three-legged stool, environmental sustainability reflects protecting the future functioning, biodiversity, and overall health of earth's managed and wild ecosystems. Community and social sustainability reflect the maintenance or improvement of personal and community well-being into the future, versus relations of violence and injustice within and among communities. In the case of food systems, this reflects especially the just distribution of food and food security among all sectors of society, the just treatment of food producers and the rights of consumers to healthy food, and the expression of cultural food preferences. Economic sustainability within food systems has often been conceptualized as relationships of financial and supply chains that support sufficient prosperity for food producers and the economic access of consumers to food at affordable prices.
Dividing the concepts of sustainability into three parts of an integrated whole allows us to think about food production practices or food distribution networks, for example, are sustainable in different aspects. Excessive water use or fossil fuel consumption, for example, are aspects of environmental sustainability challenges in food systems considered further on in this course. Meanwhile, issues of food access, poverty, and displacement from war, and their impacts on human communities and their food security are issues that combine social and economic sustainability, which will also be considered by this course. The three-legged stool is a simple, if sometimes imperfect, way to combine the considerations of sustainability into a unified whole. As you consider the sustainability challenges at the end of module one and in your capstone project, you may be able to use these three different concepts along with the concepts in the guided reading to describe the sustainability challenges of some food system examples. You may want to ask yourself, is this practice or situation environmentally sustainable? socially sustainable? economically sustainable?
Increasing Interest in Food Systems and Sustainability
Increasing Interest in Food Systems and Sustainability
Individuals, Communities, and Organizations Taking Action on Sustainability: Information Resources on Real-World Efforts
The interest in the sustainability of environment-food systems, as we've just defined them -- see the "three-legged stool" on the previous page -- has skyrocketed in recent years. A brief sampling of these issues involves the following:
- Health and Nutrition concerns over the nutritional quality and nutrient content of food and food-producing environmental systems
- Food security among approximately 1.1 billion persons around the world with low income and other limitations that do not allow them to access sufficient food.
- The need to design food and agricultural systems that can respond successfully to climate change.
We aim that this course will allow you as a learner to this rapidly expanding suite of interests while it offers background and the capacity to understand better and more fully these issues. You will pursue this aim through the readings and evaluations in this course, and also in completing a capstone project on the food system of a particular region.
One way to begin learning about this expanding interest is to consider the activities of individuals, communities, and governments as well as organizations ranging from nonprofits to international and global groups. In the case of individuals and communities, much interest is being generated by local food initiatives, such as farmers’ markets, and other local groups of producers and consumers seeking to improve environment-food systems. A variety of government agencies in the United States and other countries have also become increasingly involved in environment-food issues.
The United States Department of Agriculture [8], for example, now offers a focus on environment-food issues such as responses to climate change and dietary guidelines in its range of research and science activities. The USDA website also includes the compilation of data through its different research services that you will use in this course.
The United Nation’s Food and Agriculture Organization (FAO) [9], which is based in Rome, Italy, is one of a number of international organizations focused on environment-food issues. It addresses nearly all the topics raised in the course, as well as many others. The statistical branch of the FAO, known as FAOSTATS, is an important source of information on the international dimension of issues involving food and the environment.
Numerous non-profit organizations are involved in environment-food issues in the United States and in other countries. One of these organizations in the U.S., which is called Food Tank [10], periodically provides the lists of other organizations that it considers leaders in environment-food issues. In 2014, for example, Food Tank named the "101 Organizations to Watch in 2014 [11]”. This interesting list, complete with brief descriptions, includes a number of both well-known and lesser-known groups active in environment-food issues. Other organizations have greatly expanded their environment-food focus. National Geographic, for example, now has a major focus on environment-food issues. Its website includes an important section on food and water within the organization’s initiative on EarthPulse: A Visual Guide to Global Trends. This section includes a number of excellent global maps of environmental and food conditions, challenges, and potential solutions.
These resources may be a help to you as you consider not just the learning resources we present in this text, but the real efforts to promote environmental, social, and economic sustainability in food systems, which you will address in the final section of the course and in your capstone project.
Formative Assessment: Environment and Food Issues
Formative Assessment: Environment and Food Issues
Instructions
Look over Food Tank's "101 organizations to Watch in 2014 [11]".
Choose one organization from this website that treats the combination of environment-and-food issues. You'll need to be selective since some of the organizations specialize in food-related issues but have little emphasis on environmental one. Also, read the assignment from Colin Sage, pp. 1-8 on "Introduction: Why environment and food? [1]" in Environment and Development that is one of the required readings for this module (see the assignments page)
Then,
- Write a brief overview description of the organization you chose from the Foodtank [12] [12]website, its summary goals in relation to the environment and food issues - distinct from the more detailed description of issues and factors below, funding source or sources, location and scope (local, national, and/or global), longevity (including when it was founded), and what you perceive as its intended audience and/or client or target population.
- After addressing these overview questions for the organization, continue and address briefly the following two questions where you can draw on the assigned reading from C. Sage:
- What factors or issues of importance to environment-food systems does it address - a more complete elaboration of its summary goals in the previous overview? (1 paragraph)
- How is sustainability defined and addressed by this organization? (1 paragraph)
Your writing should be between one and one and a half pages long, and no longer than two pages. When appropriate, you can relate the work of this organization to the other material in this introductory module regarding multidisciplinary approaches or the concept of the Anthropocene. Be sure to describe what types of environmental and food issues are being addressed by this organization, as well as the wider factors and sustainability questions.
Submitting Your Assignment
Please submit your assignment in Module 1 Formative Assessment in Canvas.
Grading Information and Rubric
Your assignment will be evaluated based on the following rubric. The maximum grade for the assignment is 25 points.
| Criteria | Score of 5 | Score 3 | Score 1 |
|---|---|---|---|
| Answer adequately addresses the organization's relationship to the environmental AND food issues as well as its understanding of sustainability and sustainability goals. | A clear description of both environment and food issues and sustainability and how the organization interprets the linkages between. | Some mention of both environmental and food issues addressed by the organization, and how sustainability is understood. | Little mention of any element or one of the elements missing. |
| Answer addresses summary details of the organization as requested in the assignment (e.g. food/environment goals, longevity, target audience or client group, etc.) | Complete mention of all elements clearly explained. | Mentions most elements | Mentions less than half of the elements. |
| The answer is legible, correct, and clearly written. | Clearly structured writing organized into themes, easily readable, with very few grammatical errors. | Some gaps in clarity or grammar errors, but significant effort is indicated, easily readable. | Difficult to read or many grammatical errors. |
| The answer relates the organization description to course content and reading. | Shows an understanding of environment and food issues as addressed by course materials, as well as relating these to other material in the module – multidisciplinarity or the Anthropocene. | Shows an understanding of environment and food issues as addressed by course materials | Shows incomplete understanding of environment and food issues as described in the course materials. |
| Length | Writing is sufficiently long and provides an adequate and interesting level of detail about the organization | Insufficient length to fully engage the topic. | Writing is only 1-2 sentences on all topics or relies on quick, outline-style response. |
Module 1.2: Food Systems Combine Natural and Human Systems
Module 1.2: Food Systems Combine Natural and Human Systems
Introduction
Module 1.2 continues the goal of the introductory module, which is to introduce the course themes of integrated perspectives on the environmental and human systems that are related to food production and consumption. In the case of the first (environmental systems), the course places emphasis on the Geosystems and agroecology of soil, nutrients, crops, water, and climate that form the fundamental basics of food-growing environmental systems. In the case of the second (human systems) the course emphasizes factors such as population and the roles of culture, social interactions, economics, and politics. Module 1.2 builds on the concepts of multidisciplinarity introduced in Module 1.1 by introducing the Coupled Natural-Human systems framework as a conceptual tool where multiple natural and social disciplines are used to understand food systems. Building from simple examples of home gardens and hunting/fishing considered as natural/human systems, Module 1.2 provides an introductory description of food systems both as integrated production/transport/production chains and as interacting natural and human subsystems. Both of these themes will be deepened in Module 8, but the purpose here is to introduce them in basic form so that the subsequent modules on domestication, water, soils, and agroecology can utilize the framework and place even emphasis on both human and natural factors. Module 1.2 also advances the thesis (and key geosciences concept) that the global food system is a major area in which humans are transforming earth surface properties and processes during the Anthropocene. In Module 1.2 students are asked to complete a formative assessment in identifying introductory concepts in real examples of food systems which span local to global scales, and which take place both within and outside of the United States. The module concludes with a summative assessment that applies systems thinking and asks students to map a food system example and explore how relationships between parts of a food system are as important as knowledge about each part.
The Systems Concept
The Systems Concept
What defines a system?
In this course, we will refer to the term "system" repeatedly, so it is worthwhile to think about how systems are defined. A basic definition of a system is "a set of components and their relationships". Rather than dwelling on this definition in the abstract, it's probably best to immediately think of how the definition applies to real examples from this course. An ecosystem is a type of system you may have heard of, in which the components are living things like plants, animals, and microbes plus a habitat formed of natural, urban, and agricultural environments, and all the relationships among these component parts, with an emphasis on the interactions between the living parts of the system and their interactions, for example, food webs in which plants feed herbivores and herbivores feed carnivores. A food system, as we have just begun to see so far, consists of food production components like farms, farm fields, and orchards, along with livestock; food distribution chains including shipping companies and supermarkets, and consumers like you and your classmates, with myriad other components like regulatory agencies, weather and climate, and soils. In the case of food systems we have already pointed out how these can be considered as human-natural (alternatively, human-environment) systems, where it can help to see the system as composed of interacting human components (societies, companies, households, farm families) and natural components like water, soils, crop varieties, livestock, and agricultural ecosystems.
Behavior of Complex Systems
Systems that contain a large number of components interacting in multiple ways (like an ecosystem, above, or the human-natural food systems elsewhere in this text) are often said to be complex. The word "complex" may have an obvious and general meaning from daily use (you may be thinking "of course it is complex! there are lots of components and relationships!") but geoscientists, ecologists, and social scientists mean something specific here: they are referring to ways that different complex systems, from ocean food webs to the global climate system, to the ecosystem of a dairy farm, display common types of behavior related to their complexity. Here are some of these types of behaviors:
- Positive and negative feedback: the change in a property of the system results in an amplification (positive feedback) or dampening (negative feedback) of that change. A recently considered example of positive feedback would be that as the arctic ocean loses sea ice with global warming, the ocean begins to absorb more sunlight due to its darker color, which accelerates the rate of sea ice melting.
- Many strongly interdependent variables: this property results in multiple causes leading to observed outputs, with unobserved properties of the system sometimes having larger impacts than we might expect.
- Resilience: Resilience will be discussed later in the course, but you can think of it here as a sort of self-regulation of complex systems in which they often tend to resist changes in a self-organized way, like the way your body attempts to always maintain a temperature of 37 C. Sometimes complex systems maintain themselves until they are pushed beyond a breaking point, after which they may change rapidly to another type of behavior.
- Unexpected and "emergent" behavior: one consequence of the above three properties is that complex systems can display unexpected outcomes, driven by positive feedbacks and unexpected relationships or unobserved variables. Sometimes this is referred to as "emergent" behavior when we sense that it would have been impossible to predict the behavior of the system even if we knew the "rules" that govern each component part.
To these more formal definitions of complex systems, we should add one more feature that we will reinforce throughout the course in describing food systems that combine human and natural systems, which is that drivers and impacts often cross the boundary between human or social systems and environmental or natural systems (recall Fig. 1.1.2). Our policies, traditions, and culture have impacts on earth's natural systems, and the earth's natural systems affect the types of human systems that develop, while changes in natural systems can cause changes in policies, traditions, and culture.
For more information on complex systems properties with further examples, see Developing Student Understanding of Complex Systems in Geosciences [13], from the "On the Cutting Edge" [14] program.
On the next page, we'll see an interesting example of complex system behavior related to the food system in India.
Complex Systems Behavior: An Example from India
Complex Systems Behavior: An Example from India
The Indian Vulture Crisis: An Example of Complex Systems Behavior
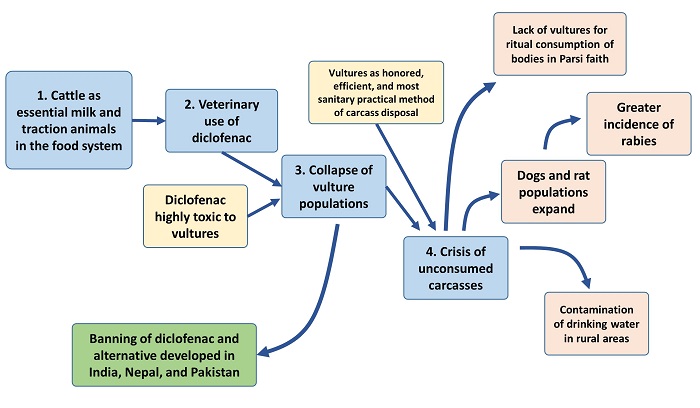
The "Indian Vulture Crisis" may or not be a familiar term to you, but it is important enough to the history of modern India that it has involved dozens of research experts as well as major changes in wildlife, human health, and government policies, and now has its own Wikipedia page (Indian vulture crisis [15]) that you can browse. It is also an interesting example of complex systems behavior that involves food systems and unintended consequences of veterinary care for animals. The main causal links are outlined below in figure 1.2.2, and the narrative of the crisis goes as follows:
Beef cattle are hugely important to Indian food systems even though they are usually not consumed by adherents of the majority Hindu religion (however, Indian Christians and Muslims, for example, do consume beef). Cattle are also widely used as dairy animals (think: yogurt and clarified butter as important parts of Indian cuisine) and are even more important as traction animals (oxen) to till soil for all-important food crops by small-scale farmers across India. Because of their importance and to treat inflammation and fevers in cattle, in the 1990s the drug diclofenac was put into widespread use across India. However, timed with the release of this medication, a precipitous drop in the population of Indian vultures began, which became the fastest collapse of a bird population ever recorded. Vultures are not valued in many parts of the world, but scavenging by vultures was the main way that dead animal carcasses were cleared from Indian communities, especially in the case of beef cattle where the meat is not consumed. It was not until the 2000s that the cause of vulture population collapse was discovered to be the diclofenac medicine administered to cattle, which is extremely toxic to vultures eating dead carcasses. However, the consequences of this population collapse did not end with the solving of the mystery of the vulture population collapse, which was already a tragic and unforeseen consequence. Rather, the fact that vultures are a key part of a complex system resulted in further unforeseen consequences in both human and natural parts of the Indian food system. A few of these are shown in figure 1.2.2 below: first, since vultures are in fact an ideal scavenger that creates a "dead end" for human pathogens in rotting carcasses, and since they were no longer present, water supplies suffered greater contamination from carcasses that took months instead of weeks to rot, leading to greater human illness. Second, populations of rats and dogs, which are less effective carcass scavengers, expanded in response to these carcasses and the lack of competition from vultures, which resulted in dramatic increases in rabies (and other diseases) due to larger dog and rat populations and human contact with wild dogs. This is significant since more than half of the world's human rabies deaths occur in India. Finally, the vulture crisis even had implications for religious rituals in India: people of the Parsi faith, who practice an open-air "sky burial" of their dead where the body is consumed by vultures, were forced to abandon the practice because of hygiene concerns when human bodies took months instead of weeks to decompose. A final consequence of these problems was that the drug diclofenac was banned from use in India, Nepal, and Pakistan in hopes of helping vulture populations to revive. This final turn of events is an example of the human system responding to the unforeseen consequences. Additionally, alternatives to these drugs have been developed for veterinary use that have no toxicity to vultures.
Note the properties of complex systems and human-natural systems exhibited by this example. Farmers sought mainly to protect their cattle from inflammation and speed healing in service of the food system, while pharmaceutical companies sought to profit from a widespread market for an effective medication. The additional, cascading effects of the human invention diclofenac, however, were dramatic, far-ranging, and in some cases unexpected, because of the many interacting parts in the food systems and ecosystems of Indian rural areas: cattle, groundwater, wild dogs, and human pathogens like rabies. The crisis eventually provoked responses from the human system, with impacts on human burial practices among the Parsi, laws banning diclofenac, and development of alternative medications. The search for sustainability in food systems, like those you will think about for your capstone regions, involves designing and choosing adequate human responses to complex system behavior.
Complex Systems and Interdisciplinarity
One final note on this example is to point out that to fully understand the Indian vulture crisis a large number of different disciplines were brought to bear: we need cultural knowledge about the beliefs and practical usefulness of both cattle and vultures in India. We also need biological knowledge about drug toxicity to wildlife, pathogens, groundwater contamination by microbes, and rat and dog populations. We also need policy expertise to think about transitioning food systems to less toxic alternatives to current practices. And all of these disciplines needed to be brought together in an integrated whole to assemble the diagram shown in figure 1.2.2. The purpose of this text and this course on food systems is to help you to develop some of the skills needed for this sort of interdisciplinary analysis of human-environment or human-natural systems.
Food Systems as Human-Natural Systems
Food Systems as Human-Natural Systems
Food System Examples from Household Gardens to Communities and Global Food Systems
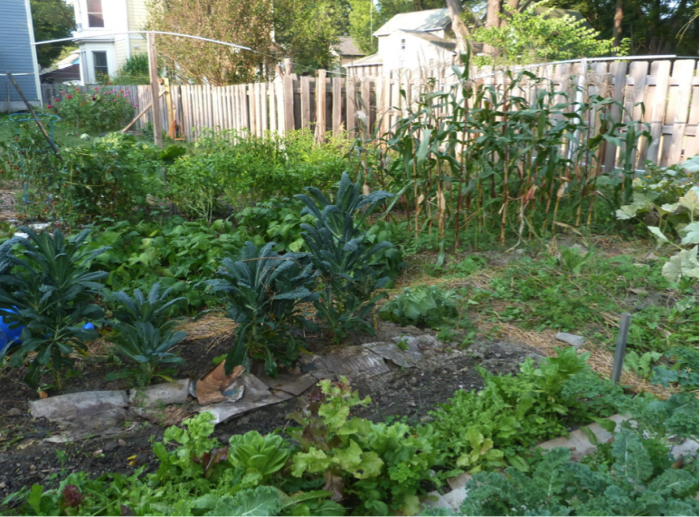
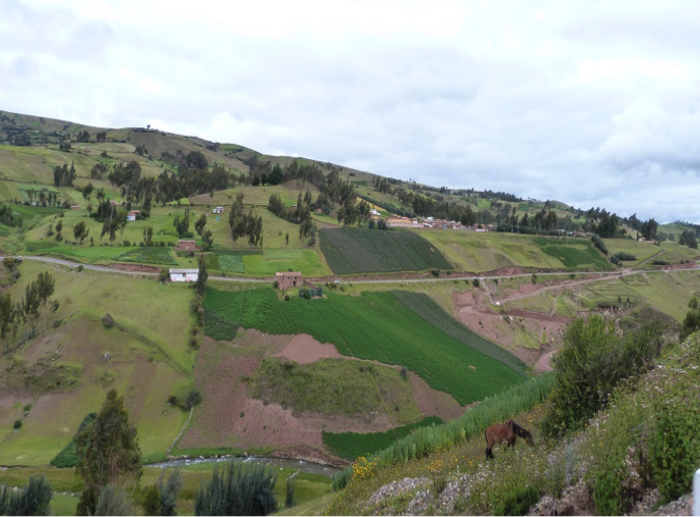
Some of you in this course, perhaps even many of you, have had the experience of growing herbs or vegetables (Fig. 1.2.3) or keeping chickens for eggs or animals for meat. Although dwarfed by the enormous dimensions of the global food system, home food production is still a significant part of the food consumed by billions of earth's inhabitants. In other cases, small-scale fishing and hunting provide highly nutrient-dense foods, and coexist with modernized and industrial food systems, as any fishers and hunters in the class may be able to attest. These experiences of food production for personal or family consumption show natural-human interactions in a very simple way. To grow vegetables or hunt or raise animals means bringing together natural factors (seed, animal breeds, soil, water, fishing and hunting ranges, etc.) and also human factors (e.g. knowledge of plants, livestock, or wild animals, government policies) to gain access to food, as well as food storage and preparation, markets for tools and seeds, or human-built infrastructures like a garden fence or a chicken coop. This same interaction between natural and human factors is evident at a larger scale in the photo in Figure 1.2.4, which shows a landscape that has been transformed by a human community for food production.
Beyond these experiences of auto-sufficient food production and consumption, however, most of humanity also currently depends on global and local versions of the food system which features a web of suppliers, producers, transporters, and marketers that supply all of us as food consumers. Compared to gardening, catching trout, or keeping chickens, these food systems together form a far more complex version of the interactions between natural and human factors that produce and transport the food that we then consume as part of global and local food systems.
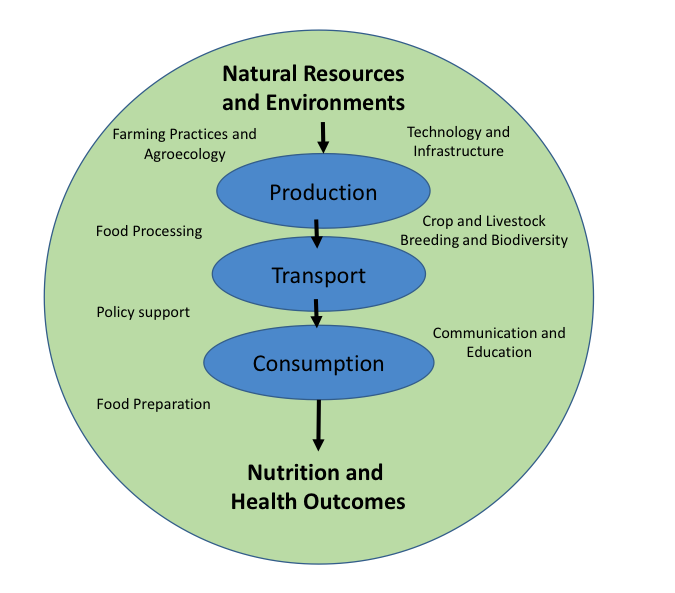
One way of viewing these regional and global food systems is that they can be divided by the type of activity in relation to food, and dividing them into components of food production, food transport, and food consumption (Fig. 1.2.5). Like other diagrams we've seen so far, this diagram can be considered a concept map showing relationships between the different components of a food system. The main arrows show the flow of food through the system from the managed natural environments used to produce food and the end result of nutrition and health outcomes. There are some unseen or implicit relationships here as well, like the way that farming practices, technology, communication and education, and other attributes of human societies support the functioning of a food system, and are included in the outer system boundary.
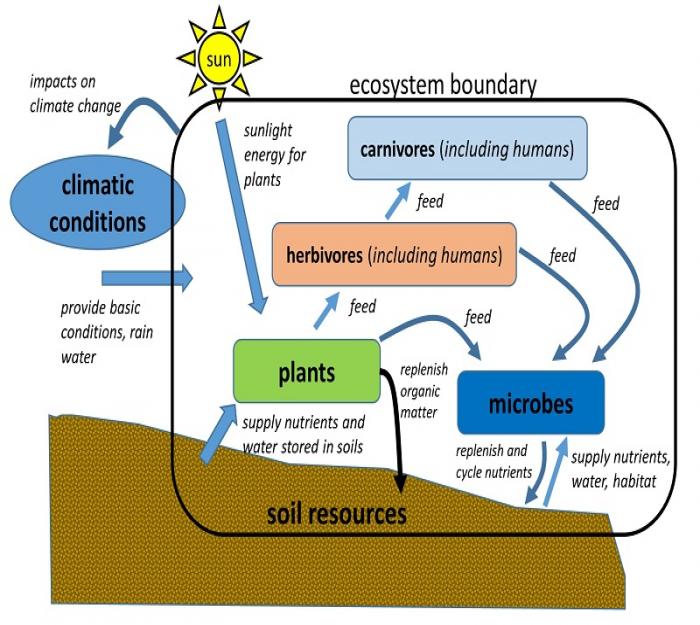
In addition to this more linear or "conveyer belt" portrayal of food systems delivering nutrition from natural resources, we may also be interested in thinking about the dramatic impacts humans have made on earth systems during the Anthropocene, discussed in module 1.1. In that light, we know that these natural systems may either be sustained or degraded by management, an important response that either maintains or undermines the entire food system. For this purpose, we may be interested in a food system diagram that makes the interactions among human and natural systems very explicit. Below in figure 1.2.6 is a version of a Coupled Human-Natural Systems diagram -- again, a concept map of sorts -- developed by an interdisciplinary group of social and environmental scientists (Liu et al. 2007) to represent the human-environment interactions in food systems.
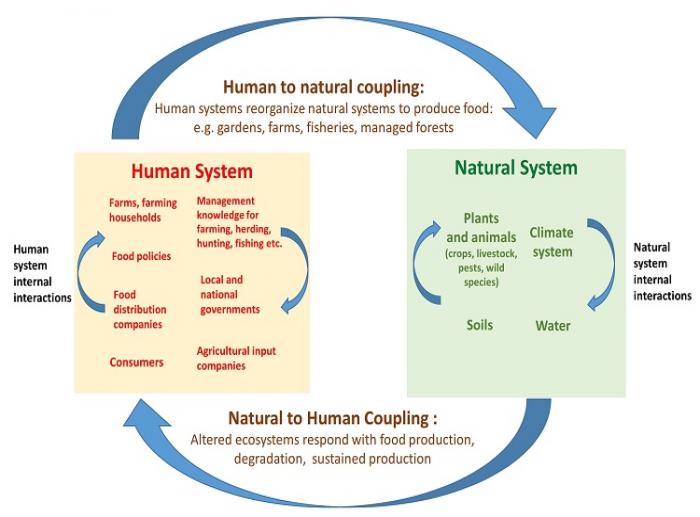
This diagram highlights internal interactions within both the natural and human components of the food system. The natural components of food systems shown here are those we will tackle first in the first part of the course, while the latter half of the course will address the human system aspects of food systems and human-environment interactions shown as the large arrows connecting these two major components. As we saw in comparing home garden production, smallholder production landscapes and global food production chains above, food systems and their components are highly varied. However many similarities apply across the different components, actors, and environments of the food system:
- Food systems modify the natural environment and capture the productivity of the earth’s natural systems to supply food to human populations. Globally they create huge changes in the earth’s surface and its natural populations and processes.
- As portrayed in Figure 1.2.6, despite their complexity, food systems often involve coupling between human management and the response of natural systems. As pointed out by author Colin Sage in Module 1.1, the response of natural systems to human management can create sustainability challenges in food systems.
- Food systems involve the production, transportation, distribution, and consumption of food (Figure 1.2.5). The scale of these three processes can differ among food systems, which can be local, regional, and global.
- Food systems are examples of complex systems: they involve many interacting human and natural components, as well as important variability, for example, droughts, soil erosion, population changes, and migration, and changing policies. All of these affect the natural and human systems and can disrupt simple cause and effect relationships, in spite of the large-scale drivers and feedbacks shown in figure 1.2.6.
Knowledge Check
Module 1 Summative Assessment Overview
Module 1 Summative Assessment Overview
Summative Assessment: Concept Mapping and Assessment of Food Systems
First, download the worksheet [16] to understand and complete the assessment. This assignment will require you to draw on your reading of this online text from module one, as well as several options for case studies where we have provided brief descriptions and audiovisual resources (radio clips, videos, photos) that describe these systems. You will accomplish two parts of an assignment that will not only evaluate the learning objectives for module one but will also give you practice in skills you will need to complete your capstone project. These two parts are:
- Draw a concept map of the system that distinguishes between human and natural components or sections of the system (an example is given below)
- Fill in a table that identifies some key components, relationships, and sustainability concerns for this system.
You will complete this assignment for your choice of two food system examples, as described in the detailed instructions below. You will first read, then draw a concept map, and then fill in a table with short responses.
Instructions
- Choose ONE national to global food system example and ONE local to regional food system example from the options that follow this assignment page in the text (see links in outline view at right, or the link to the next page at the bottom of this page). National to global food system examples are Pennsylvania Dairy, Colorado Beef Production, and Peruvian Asparagus, while local to regional examples are the Peruvian smallholder production and New York City greenmarkets examples. Read the descriptions of the system, which may include photos, videos, audio clips, or visiting other websites. Completely read through the description of the two systems you have chosen (one national/global and one local/regional), including these external links before continuing on to the following steps (though you may certainly return to the descriptions as needed). You are welcome to consult other resources online regarding the system you have chosen since that is a skill that will be helpful when embarking on data gathering for your capstone project.
- Using a sheet of paper, or composing in PowerPoint, develop a concept map of only ONE of the systems you chose, subject to the following guidelines:
- Title your concept map with the name of the system you are describing (among the five described on the following pages) and put your name on the diagram.
- Before you begin your concept map, draw a vertical line in your diagram to distinguish between Human and Natural components of the system to right and left, drawing on Fig. 1.2.6, 1.2.7 below, and 1.1.3 (the last one is the concept map example from the guided introductory reading by Colin Sage). However, you do not need to make your diagram look like the highly schematic diagrams in the text of the previous pages (see rather Fig. 1.2.7 below) -- you should include components that are discussed in the examples on the following pages, and connect them in the way that makes sense to you.
- Your concept map should be legible, but it does not need to be extremely neat since it reflects a first attempt to characterize a system. Additional components and relationships will occur to you as you draw, and you may need to squeeze them in. Therefore, leave space as you begin your diagram. If you feel your map becoming too hard to understand, please do compose a second "clean" copy.
- Remember that systems are defined as components and the relationships between them. If you are having trouble thinking of what to draw, think what the components are in the system (these can be boxes or ovals), and then how they are related (these may be labeled arrows)
- Below in Fig. 1.2.7 is an example of a concept map drawn from a food production system producing field crops (wheat, oats, barley, soybeans) and hogs for pork in Western France. Material for this concept map is drawn from Billen et al., 2012, "Localising the nitrogen footprint of the Paris food supply"1
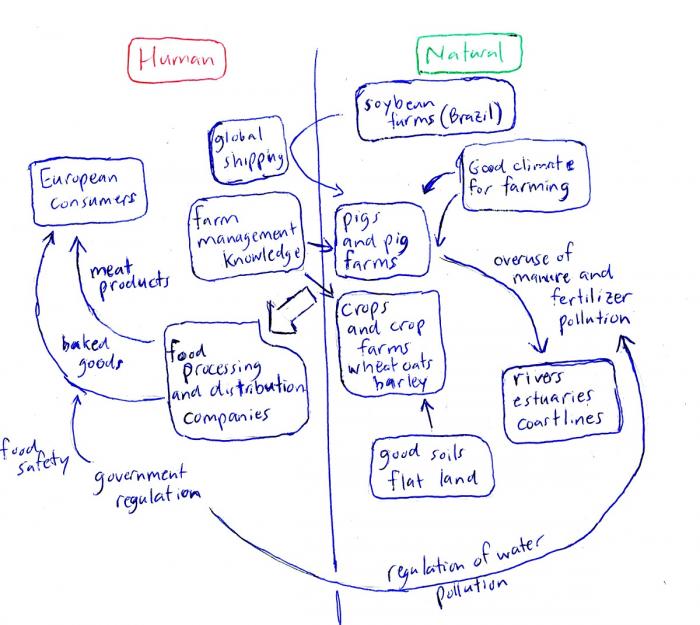 Fig 1.2.7. Example concept map of a food production system, divided into human and natural components.Credit: Sketch by Steven Vanek
- Fill in the table on the worksheet [16] with short answer responses regarding the two food systems you have chosen. The worksheet asks for responses in the following areas:
- Identify two natural components of the food system.
- Identify three human components of the food system.
- Tell how products from the system are transported to markets or to households for consumption.
- Name one sustainability challenge for the system, and state whether it represents a challenge in the area of environmental, social, or economic sustainability.
Once complete, use the worksheet as a guide to complete the Summative Assessment quiz.
National to Global Scale Option 1: Pennsylvania Dairy Sector
National to Global Scale Option 1: Pennsylvania Dairy Sector
Overview
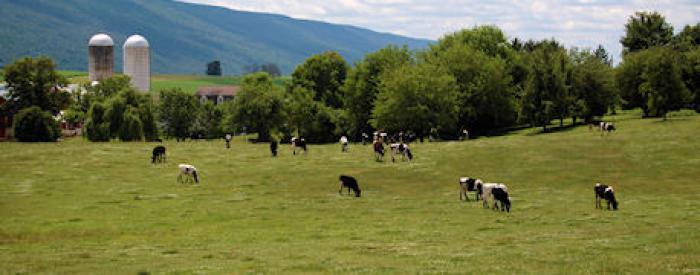
Pennsylvania is the fourth largest state in the nation for milk production, after California, Wisconsin, and New York. Cows produce about 1.3 billion gallons of milk every year in Pennsylvania. Interestingly, 99% of Pennsylvania’s dairy farms are family-owned, which is in contrast to states such as California where large industrial dairies dominate production. On most conventional Pennsylvania dairy farms cows are fed forage crops that are grown on farms such as fermented chopped maize plants (silage) and alfalfa. These on-farm forages are mixed with other feed components that are imported to the farm to optimize milk production. There is also an expanding organic dairy sector in Pennsylvania that uses grazing whenever possible to satisfy the U.S. National Organic Program's regulations and organic philosophies of animal management (e.g. Fig. 1.2.8). Pennsylvania’s relatively good soils, temperate climate, and proximity to Eastern U.S. markets have helped to make dairy farms a dominant presence in Pennsylvania agriculture. Farms generally are on flat to hilly topography in what was originally forest, and patches of forest are still very common on steeper terrain throughout Pennsylvania. Manure produced by dairy cows is recycled into the soil to provide crops with nutrients. Farmers have to manage the application of manure and other fertilizers so that nutrients are best used by the crop and do not pollute waterways, which has been a major issue for water quality in the Chesapeake Bay downstream of Pennsylvania farms. Milk produced on these dairy farms is gathered into central processing plants and is then distributed to stores for purchase for consumers, or bought by other dairy industry manufacturers such as yogurt and cheese plants.
Be sure to also explore the following website to gain more insight on Pennsylvania’s dairy sector as part of the food system in order to successfully build your concept map and fill in the table items in the assignment:
National to Global Scale Option 2: Colorado Feedlot Beef Production
National to Global Scale Option 2: Colorado Feedlot Beef Production
Overview
Colorado Beef Production: A Tale of Two Feedlots
Beef production on Colorado’s high plains. Few topics arouse as much debate in conversations around the current trends, sustainability, and alternatives in food systems as meat consumption, and especially feedlot beef consumption which requires relatively large amounts of water and energy to grow the feed necessary for cattle production using feedlots. This remarkable if somewhat older video presents in a matter-of-fact way the practices, infrastructure, and modification of nature involved in beef production at small and very large scales on the high plains of Colorado (Warning: this video shows brief scenes from a slaughterhouse, e.g. cutting of carcasses). Watch for details about the use of water in a dryland environment, how feed is acquired in both systems to fatten animals, the use of technology to maximize the weight gain of animals, and the details of transport to market.
Video: Colorado Beef Production 1990 (FWU) - English(14:53)
Auctioneer voice.
Narrator: An auction in Greeley, a small town north of Denver, and the cattle raising center of Colorado.
Auctioneer voice.
Narrator: The calves have been bred in the pastures of the surrounding ranches. Now they come to be fattened up in the feedlots. This is Jim Park, the owner of a small family farm near Greeley, who raises cattle. And Carl Montega, a buyer for Monfort, the biggest meat producer in the area. Monfort of Colorado, a beef producing company with its own feedlots, slaughterhouses, and car parks. 85,000 animals can be fattened at the same time, 200,000 per year in this feedlot alone. And Monfort operates another two facilities of the same size in this region. Located on a high plateau, the climate on the plains is ideal for the animals. It is dry in summer and cold and dry in winter. This makes the cattle resistant to germs and infection. Monfort buys calves from all over the United States and sends them to Greeley to be fattened. They will be fed here for about 110 days until they have reached a suitable weight for slaughter. The new arrivals are sorted by age and size and then vaccinated. They are given a sedative against the stress of this new unfamiliar environment. Each animal is given a computer number and a hormone capsule is implanted. The hormones cause the animals to gain weight more quickly. Then an antiseptic bath to kill off bacteria. Cattle owners fear nothing more than an outbreak of infection in feedlots. Nevertheless, 1% of the livestock, that's about 2,000 cattle a year, will die from dust and stress before they reach the slaughterhouse. Jim Park’s family farm is only about a five-minute drive from Montfort. Jim Park owns about 250 acres of irrigated land; on which he grows fodder for his beef stock. He fattens 1,100 animals per year in a feedlot. Only two men run the farm, Jim himself and another farmhand. The business is fully mechanized with its own feed mill and all necessary equipment. Jim Park sells his cattle to the highest bidder among the US meat producers, including Monfort of Colorado.
Jim Park: Oh, we've been in the business of feeding cattle probably about 20 years. Before that, we used to milk cows here. The old red barn behind us here, that's where we used to milk cows. But we've kind of got out of that business and basically just feedlot, feeding cattle right now. We raise most of our own alfalfa and corn, silage (the roughage part of it). I do have to buy some shelled corn, but the biggest majority of the feed we raise right here on the place and feed it to the cattle. I don't sell any corn or alfalfa off the place it all goes through the cattle.
Male voice (not visible): When Monfort is big business and is so close to you, is a family farm able to survive?
Jim Park: Well I think so. Big, of course, is maybe more efficient. But I think I think one of the disadvantages of being so big is everything is hired labor. At least here I own the cattle myself and I do have one man that's here year-round that works with me. And we just take more of a caring role, I think. If you're working for a big company, a lot of times you maybe don't care so much whether one sick or whether they're eating the way they should be or things like this. So I think we can probably compete just about as well.
Male voice (not visible): How did this farm start here?
Jim Park: Well my great granddad, fella by the name of Frederick Niemeyer, and Fritz was kind of his nickname. Fritz came to this country in the mid-1800s and he came from Germany over here to the United States and he homesteaded this place. It's been in the family since about 1888, so we've been here a little over 100 years.
Narrator: Like Fritz Niemeyer, many Germans settled in Colorado at that time. The land was well suited for growing sugar beets, something they were very good at. But the water shortage in Colorado meant hardship for the farmers. The drought of 1927-35, worse than any before, turned fertile land into desert. The farms were buried by sandstorms. The land could no longer feed the people and most of the farmers had to leave their homes. In 1935 the Colorado government started work on a gigantic irrigation project. The Rocky Mountains formal watershed, the farms and arable land on the Great Plains, seventy miles to the east, are only sparingly supplied with meltwater from the mountains. This is because most of the snow falls on the western side of the Rockies. Large water reservoirs were built west of the mountain range. From there a tunnel was drilled straight through the mountain and a pipeline was laid. When the rivers begin to dry up in summer, the stored water is pumped from west to east. It flows through pipelines down the slopes of the Rocky Mountains to the plains below, and can also be used to generate hydroelectric power. The water then flows through two canal systems north into the Cache la Poudre and south into the South Platte River. Many ditches carry it from the river to the fields and farms. In addition to wheat, corn, and alfalfa, corn for silage has become the main crop in Colorado. Under contract from Montfort, many farmers plant crops which are then harvested by Monfort using its own equipment and workforce. The corn is chopped right in the fields to form silage. It is then stored in silos in Monfort’s feedlot. Montfort buys corn wherever the price is right. In the feed mill, the grain is heated and ground in flakers, to form corn flakes. The fodder is mixed by compute. Cornflakes, silage, proteins, and vitamins are blended together for each group of cattle according to their age and weight. They are fed twice a day. The fodder is heated so that the animals waste no energy bringing it to body temperature. The aim - a weight gain of three pounds per day.
Woman’s voice (operator): Please feed pen 134 for 15 head, 604 for 20 head, and 542 for 1 head.
Narrator: Twenty farms are connected to this irrigation canal. The next-to-the-last is Jim's. A co-op, formed by the farmers, manages and supervises the just distribution of water. When water is short, some farmers even lock their gates to prevent water from being stolen. Some water rights date back to the previous century. These oldest rights are also the most valuable because they are the last to have their water restricted.
Male voice (not visible): What would your land be worth without the water right?
Jim Park: Oh a couple hundred dollars an acre and with the water probably two thousand. So it's about a tenfold increase by having the water and being able to raise the crops. Fifteen minutes away from the feedlot, on the outskirts of Greeley, lies Montfort’s slaughterhouse. 5,000 animals are killed here per day in two shifts. The Monfort slaughterhouse in Greeley is considered one of the most modern in the world. And Monfort operates five other slaughterhouses in the US, and itself is only a small part of the gigantic food corporation, Conagra. After being refrigerated for 24 hours the carcasses are halved and sorted according to cut. Except for the tip of the tail, every part of the animal is put to good use. 2,500 people work here. A major part of the meat is processed into ground beef and prepared as hamburgers right here in the slaughterhouse, for a large restaurant chain. Premium meat is then put in boxes for delivery. Boxed beef is a Monfort specialty. There are no butchers needed in supermarkets. In addition, the freezer trucks can carry four times as much box meat as carcasses. Montfort has thus become one of the three market leaders and supplies the entire United States, in particular, the big cities along the East Coast. It used to make no difference how large cattle grew to be. Nowadays, however, a uniform size is essential for modern meatpacking plants because, otherwise, the cattle won't fit into the box.
National to Global Scale Option 3: Asparagus Production in Peru
National to Global Scale Option 3: Asparagus Production in Peru
Overview
International Production of Asparagus in Peru for the Global Food System
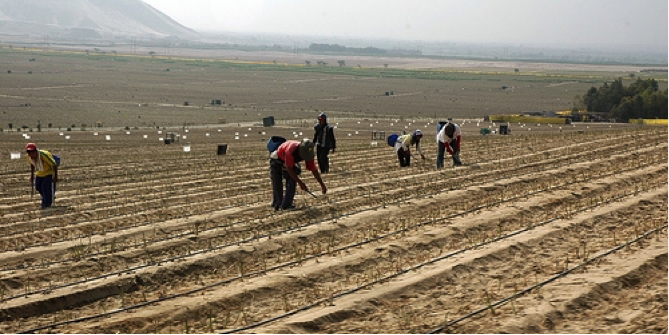
Starting from modest beginnings and export of asparagus from Peru to Denmark in the 1950s, the industrial-scale asparagus sector in Peru’s dry coastal valleys (especially around the city of Ica, Peru) grew rapidly in the 1990s into one of the premier examples of a globalized export vegetable sector (Fig. 1.2.9), able to occupy a large percentage of the world’s off-season market in asparagus when producers in the northern hemisphere are not producing asparagus (FAO 2007). The asparagus sector in Peru takes advantage of the extremely dry climate to make asparagus plants go dormant in the same way that winters in the northern hemisphere make the perennial asparagus plants die back so that they create new edible shoots in the spring. When a field of Peruvian asparagus is ready to go into production, irrigation from rivers and river-fed water tables in coastal valleys is turned on, and a flush of asparagus shoots grows, is harvested using labor that is relatively cheap on a global scale, and immediately flown in refrigerated containers to markets in the rest of the world, chiefly Europe. Asparagus is also notable for being a delicacy among U.S. and European consumers, with a sort of star status among gourmet eaters (see e.g. Peruvian Asparagus [18]) Industrial-scale asparagus producers in Peru were able to achieve this scale of production and access to the global market via support from the Peruvian government, the help of the United States Agency for International Development (USAID), and their own resources and investment, based on earlier successes in the production of cotton in irrigated valleys (FAO, 2007). Interestingly, Ica asparagus growers organized several international tours to learn industrial methods of production in Europe and the U.S. and adapt them to their own region. However, the large scale of production and amounts of water needed are straining water supplies in the Ica region and have prompted objections regarding water supplies for other uses and the environment. Further, expansion of irrigation in Ica has been based on dam-building in upriver sites which alters ecosystems and water rights for other farmers in these valleys. The abundant supply of migrant labor from the Peruvian highlands and the economic power of the growers has also led to labor relations that are often quite unfavorable to workers.
Readings
Before drawing your concept map and filling in the table information for this assignment make sure to read the following news piece about Peruvian Asparagus from to learn more about the Peruvian asparagus industry and concerns about fresh water supply: Peru water wars threaten export boom [19].
You may also want to consult this brief from an industry news site covering the global fresh fruit and vegetable trade, detailing how asparagus is the most common Peruvian product shipped by air: Peru: [20]Asparagus is the most exported product by air [21]
Optional Reading
Diaz, Luz Rios. 2007. Agro-industries characterization and appraisal: Asparagus in Peru [22]. Rome: FAO, 56 p.
Local to Regional Scale Option 1: New York City Green Markets
Local to Regional Scale Option 1: New York City Green Markets
Overview
A Regional Food-shed Direct Marketing of Local and Small Scale Farm Production: The New York City Green Markets
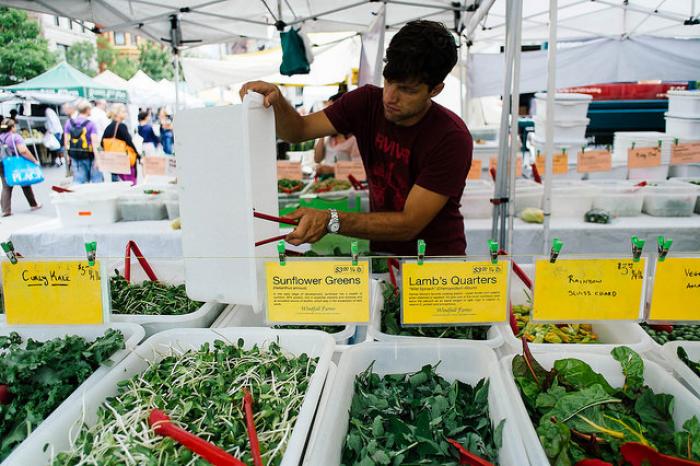
Many in the class will be familiar with the recent growth of farmers' markets and other forms of direct marketing in which farmers sell more directly to consumers to capture a greater percentage of the final purchase price. This includes mail-order grass-fed beef from South Dakota, organic farms, and other small farms selling at open-air markets in any given small and medium city, and medium to large scale farms that produce for multiple restaurant accounts in large cities. The New York City greenmarkets (Fig. 1.2.10) are an excellent and long-standing example of this trend, starting with a few street corner vegetable markets and growing into an important hub of the Grow NYC sustainability movement in New York. The Grow NYC website Greenmarket Farmers Markets [23] documents that over 30,000 acres of farmland as well as small fishing operations near New York City form a ‘foodshed (analogous to a watershed feeding to a larger water body) that has made important inroads towards greater access to locally or regionally produced food with more sustainable practices, including participation in food assistance programs that strive to provide greater access to lower-income New Yorkers. Greenmarkets thus provide a growing, if small, proportion of New York City’s food supply.
Vegetable and livestock producers that participate in New York City greenmarkets are in many ways sustaining and building on the legacy of small truck farms that for generations utilized fertile farmland surrounding many eastern cities (think of the sometimes mysterious identity of New Jersey as the ‘Garden State’). Today these farms generally have land sizes of 5 to 50 acres, much smaller than the farm sizes of Midwestern grain farms or California industrial vegetable production. They are comparatively diverse farms in terms of combining many different products (including eggs and meat) that can be sold for relatively advantageous prices together in a farmers market. Farms like those in the Hudson Valley North of New York City utilize flat, deep soils adjacent to river floodplains that are excellent for long-term production of crops if they are well cared for. These farms are also able to recycle relatively abundant urban wastes from dense urban and suburban populations (e.g. green wastes, manure from neighboring small livestock farms, city and county composting programs) that are used to keep soils extremely productive by global terms. In fact, some of these farms may face some of the same problems of nutrient excesses presented in the case above on Pennsylvania dairy farming systems. They also are able to grow crops for the sole purpose of adding organic matter to the soil and covering the soil in the winter (cover crops) that help to keep soil quality high. Produce and animal products are trucked directly to green market sites in New York City or to pick-up points for subscription-based Community-supported agriculture programs.
Local to Regional Scale Option 2: Diversified Smallholder Production in the Peruvian Andes
Local to Regional Scale Option 2: Diversified Smallholder Production in the Peruvian Andes
Overview
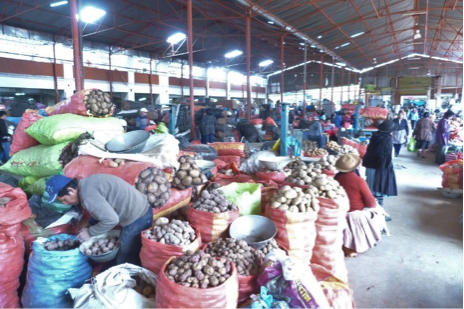
In contrast to the highly specialized and industrialized production of Peruvian asparagus for the global market (above), smallholders in the Andean Mountains of Peru integrate a wide variety of livestock and crop types on their farms, from llamas to sheep to dairy cattle, and from native potato varieties to maize as well as legume grains and forages and vegetables. They also place a high priority on self-sufficiency in many food crops, balanced with sales to local (e.g. within community barter and purchase on community market days) and regional (e.g. wholesale to regional intermediary buyers and markets, Fig. 1.2.11). The variety of crops, livestock, and production is partly explained by the varied elevation and soil types found in the mountainous Andean environment. A high diversity of products, production strategies, and market versus consumption destinations for agricultural production has thus emerged in modern Andean societies as a way to adapt to both the natural risks of a mountain environment (e.g. drought, frost, hail) and the opportunities and challenges of a complex and fluctuating market that very often does not favor the farmer’s interests.
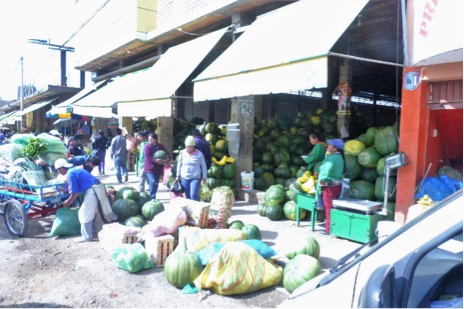
The integration of small livestock herds in these systems is very important and allows farmers higher value products such as wool and meat that can be used for short-term cash needs. Grazing livestock also allows them to “harvest” manure nutrients via grazing on high-altitude grasslands. When animals are penned into night-time corral areas they produce manure that is stored for use in fertilizing crop fields. Farmers also apply limited amounts of modern chemical fertilizers to their crops, especially those destined for regional markets. Increasingly, farm communities are banding together using strong and complex community government schemes to win government funding for and build community-wide irrigation schemes that are fed by mountain stream systems. These irrigation systems, some very extensive, are used for adaptation to drought years, expansion of cultivated land or irrigation of fodder crops to feed animals year-round in small intensified dairy schemes. The expansion of small dairy enterprises has been driven by increases in the price of milk in Andean countries from growing urban populations. Because of the preponderance of sloped land in these mountain systems, soil productivity for these Andean smallholders is very vulnerable to erosion during the intense rainy season of the Central Andes. Climate change has also tended to accentuate the severity of climate risks in these systems.
Summary and Final Tasks
Summary and Final Tasks
Summary
In the following modules, you will be learning about aspects of natural systems within human-natural food systems that support food production. As you pursue your learning about these natural systems, keep in mind that natural systems (freshwater resources, soil, the oceans, and the atmosphere) within food systems are always interacting with human systems components (knowledge, management, and policies for example).
Reminder - Complete all of the Module 1 tasks!
You have reached the end of Module 1! Double-check the to-do list on the Module Roadmap [25] to make sure you have completed all of the activities listed there before you begin Module 2.
References
Diaz, Luz Rios. 2007. Agro-industries characterization and appraisal: Asparagus in Peru. Rome: FAO. 56 p. Accessible at: http://www.fao.org/docrep/016/ap297e/ap297e.pdf [22].
Further Reading
- Liu, J., Dietz, T., Carpenter, S. R., Folke, C., Alberti, M., Redman, C. L., et al. (2007). Coupled human and natural systems. Ambio(8), 639–649. doi:10.1579/0044-7447
- Pinstrup-Andersen, P et al. Towards a Dynamic Global Food System. Ch. 1 In Food Policy for Developing Countries, pp. 1-25
- United Nations Food and Agriculture Organization (FAO). 1997. “The food system and household food security”, Chapter 3 in Agriculture food and nutrition for Africa [26]- A resource book for teachers of agriculture.
Capstone Project Overview
Capstone Project Overview
Future of Food Capstone Assignment: Analysis of Regional Future Food Scenarios
Course-level Learning Goals
- Describe and assess the soil, biological, and water resources and climatic conditions that support food production systems.
- Analyze how human food systems significantly alter earth's ecosystems, specifically the biological, soil, and water resources.
- Evaluate the resilience of food production systems in the context of future climate, human population growth, and socio-economic factors.
Summary of Capstone Assignment
At the beginning of the semester, you will select a food region. Throughout the semester, you will study different aspects of the food systems of your assigned region. By the end of the semester, you will have prepared a paper about your assigned food region that explores and analyzes the current status and the future resilience and sustainability of the food systems in your assigned region.
Capstone Overview
In order to assess your understanding of the interdisciplinary topics covered in this course, The Future of Food, you will need to demonstrate your mastery of the course learning objectives via the completion of a capstone project. The capstone project requires that you assess the current status of the food systems in an assigned region, and consider the food systems in your assigned region for future scenarios of human population growth and increased temperatures.
The capstone assignment is broken down into five stages that allow you to develop your assessment of the current status of the regional food system gradually as you progress through the course material. At the end of every third module, you will complete an assignment (or stage) designed to help you gather and organize the information you will need to assess future food scenarios. Each stage has an associated worksheet, which includes a table containing questions and suggestions for where to go to gather information or data.
During week 2, you will decide on a capstone region and gain instructor approval. In deciding this please consider a region with (a) significant agricultural production, (b) clearly defined boundaries of interest, (c) enough information published in reputable sources to collect enough information related to course content, and (d) are not too big of an area. To clarify the last point, usually, people choose a selection of small states or provinces that around about 100 miles in diameter.
Outline of capstone stages
You will find a worksheet associated with each stage that outlines in detail the data and information you should be gathering at that stage. The final Stage 5 document provides details regarding what should be included in your final paper or on your final web page. The stages will progress through the semester as outlined in the diagram below (please ignore parts about individual assessments and websites, as these have been removed from the course):
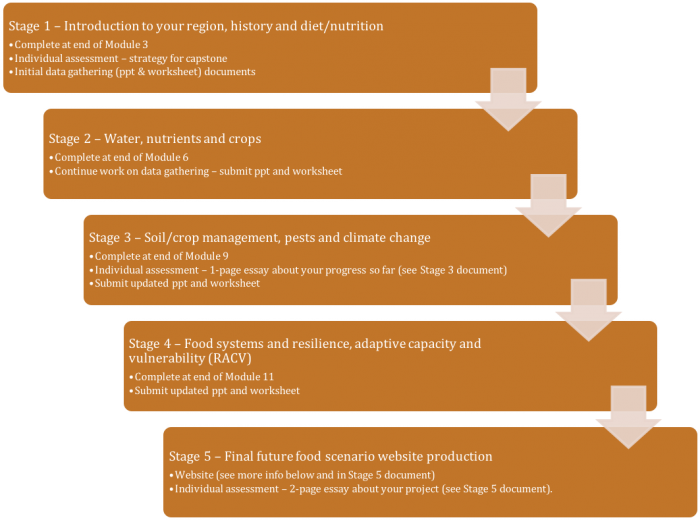
This image is an outline of the Capstone Project as follows:
Stage 1: Introduction to your region, history and diet/nutrition.
- Complete at the end of Module 3
- Initial data gathering (ppt & worksheet) documents
State 2: Water, nutrients, and crops
- Complete at the end of Module 6
- Continue work on data gathering -submit ppt and worksheet
State 3: Soil/crop management, pests, and climate change
- Complete at the end of Module 9
- Submit updated ppt and worksheet
State 4: Food systems and resilience, adaptive capacity and vulnerability (RACV)
- Complete at the end of Module 11
- Submit updated ppt and worksheet
State 5: Final future food scenario website production
- Submit a rough draft for peer review
- Submit your final Capstone Paper
Capstone Grading
At the end of the semester, you will create a paper or website about your region. More details are provided in the Stage 5 worksheet. Your paper will include the following information:
The Final Capstone Assignment (Stage 5) - Paper on your region's future food scenario
Grading Information and Rubric for Final Capstone Paper:
| Criteria | 9 | 6 | 3 | 1 |
|---|---|---|---|---|
| Completeness of paper & all supporting documents: Conforms to all instructions and guidelines | All specific instructions are met and exceeded; no components are omitted. | Most instructions are met with only 1 to 2 minor omissions | Some components are present with the omission of several key elements | Missing most components of the project, minimal conformity to guidelines. |
| Identification of the key food systems of the region | Clearly and thoroughly identifies the regional food systems with a clear application of material from Modules 1, 2, & 10 | Satisfactory identification of the regional food systems some mention of material from modules 1, 2, & 10 | Minimal identification of the regional food systems some mention of material from modules 1, 2, & 10 | Little to no identification of the regional food systems some mention of material from modules 1, 2, & 10 |
| Assessment of the regional food system and the physical environment of the region (water resources, soils, crops, climate) | Thoroughly articulates specified elements with in-depth & accurate application of key concepts from Modules 4, 5, 6 & 9 | Satisfactory articulation of specified elements with some application of key concepts from Modules 4, 5, 6 & 9 | Minimal articulation of specified elements with little application of key concepts from Modules 4, 5, 6 & 9 | Little to no articulation and application of key concepts from Modules 4, 5, 6 & 9 |
| Analysis of the resilience of the regional food system based on data and facts | Thoughtful and thorough consideration of potential vulnerabilities using concepts from Module 11 | Satisfactory consideration of potential vulnerabilities using concepts from Module 11 | Minimal consideration of potential vulnerabilities with little use of concepts from Module 11 | Little to no consideration of potential vulnerabilities with little use of concepts from Module 11 |
| Proposes reasonable strategies for sustainability and resilience based on data and facts | Clearly develops viable & insightful strategies with well‐ supported data & research | Develops viable strategies supported by some data and research | Develops minimal strategies supported with limited data and research | Little to no strategies provided or not supported by data and research |
| Criteria | 5 | 3 | 2 | 1 |
| Overall professionalism and timing | Advanced ‐ no typos, or grammatical concerns, attention to detail with superior effort demonstrated | A solid effort with few typos, or grammatical concerns, attention to detail evident with some effort demonstrated | Minimal effort with numerous typos, or grammatical concerns, little attention to detail minimal effort demonstrated | Little to no effort demonstrated with extensive typos, or grammatical concerns, little to no to attention to detail |
| Total Points (out of 50) |
- Summary of Current Regional Food System
- Summarize the data and information that you’ve gathered throughout the semester about your assigned regional food system(s) and the interaction between those food systems and the environment, as well as any relevant socioeconomic, cultural and policy factors.
- Provide an overview of the current status of your assigned regional food system(s). Summarize the data and information that you acquired in the previous modules to present the current status of your regional food system. Details are provided in the Stage 5 worksheet document.
- Discussion of future scenarios
- What are projections for regional human population growth in your assigned region?
- What are the projections for temperature increases in your assigned region?
- Analysis of the resilience of future food system
- Provide a discussion of the resilience of your food system given the potential of increasing human population growth and increasing temperatures.
- Consider possible impacts of climate change and human population growth on the regional food system and the resilience and/or vulnerability of the food system to those changes.
- Proposed strategies for sustainability enhanced resilience
- Propose strategies that contribute to the increased resilience of your assigned regional food systems in the face of human population growth and rising temperatures and evaporation rates.
Module 2: Geographic and Historical Context
Module 2: Geographic and Historical Context
Introduction
This second module in the Future of Food course provides a historical overview of the emergence and development of food systems until the present. Module 2.1, the first half of this module, describes the transition from hunting and gathering to the domestication of crop plants in human prehistory, including the origin of major food crop plants and the locations and processes of domestication, e.g. the emergence of wheat in the eastern Mediterranean or the potato in the Andean region. These processes are seen through the lens of the coupled human-natural systems framework that is introduced in Module 1 and used throughout the course. As part of this historical overview, concepts surrounding human interaction with crop plants and wild relatives are introduced such as the global regions supporting domestication or centers of diversity; or the concept of niche construction as a clear example of human-natural systems interaction. In the second half, module 2.2, we describe the history of food systems as four successive stages during which human innovation responded to both human and natural drivers and feedbacks. These stages span from early domestication activities to the most recent transitions of agriculture and food production towards more globalized trade networks, along with facing the challenges of sustainability.
Goals and Learning Objectives
Goals and Learning Objectives
Goals
- Describe food systems as coupled human-natural systems.
- Define and describe different phases in the history and development of food systems within human history.
- Describe key interactions (e.g. drivers, feedback) that exist within coupled human-natural systems (CHNS).
- Explain key human and natural system factors that explain the emergence of food system phases in human history, using a CHNS framework.
- Start researching and choose a capstone region.
Learning Objectives
After completing this module, students will be able to:
- Describe the major features of hunter-gatherers’ use of food and the environment.
- Define and describe the domestication of plants and animals in early agriculture.
- Define and give examples of spatial diffusion, adaptation, niche construction, and carrying capacity in environment-food systems.
- Define and describe each of the four (4) principal historical-geographic periods of environment-food systems.
- Give examples of early domesticated plants and animals and their region of domestication.
- Within a Coupled Human-Natural Systems framework, relate fundamental drivers and feedbacks in natural and human systems over prehistoric and historical time to the development and spread of agriculture and other changes in food systems over time.
- Relate the origins and current dominance of agriculture to the concept of the Anthropocene period presented in module one.
Assignments
Module 2 Roadmap
Detailed instructions for completing the Summative Assessment will be provided in each module.
| Action | Assignment | Location |
|---|---|---|
| To Read |
|
|
| To Do |
|
|
Questions?
If you prefer to use email:
If you have any questions, please send them through Canvas e-mail. We will check daily to respond. If your question is one that is relevant to the entire class, we may respond to the entire class rather than individually.
If you prefer to use the discussion forums:
If you have any questions, please post them to the discussion forum in Canvas. We will check that discussion forum daily to respond. While you are there, feel free to post your own responses if you, too, are able to help out a classmate.
Module 2.1: Origin of Farming as Coevolution and Coupled Human-Nature Interactions
Module 2.1: Origin of Farming as Coevolution and Coupled Human-Nature Interactions
Introduction
As we presented in module one, agriculture is currently the predominant environment-food system, including the production of both crops and livestock for human consumption. But it was not always this way and other environment-food systems continue to exist, as exemplified by the world's wild-caught ocean fisheries. Module 2.1 first examines the human-natural systems of hunter-gatherers, and then the human-natural systems of early agriculture. The domestication of plants and animals, together with the origins of agriculture, resulted in some of the most profound transformations of environments and human societies, and are a key part of the Anthropocene or "human recent past" presented in the first module. Module 2.2 then describes more recent environment-food systems and those of today.
Early Hunter-Gatherer Modifications of Environment for Food
Early Hunter-Gatherer Modifications of Environment for Food
Hunting and gathering activities were the primary way for humans to feed themselves from their natural environments for over 90% of human history. Gathering plant products, such as seeds, nuts, and leaves, is considered to have been the primary activity in these early human-natural food systems, with hunting mostly secondary. The mix of hunting-gathering activities and the tools used varied according to the environment. Among many hunter-gatherer groups worldwide fire was one of the most important tools and was used widely. Fire was used by these human social systems to transform natural systems in habitats ranging from grasslands and open forests, such as those of Africa, Asia, Europe, and North America, to those of denser forests that included the Amazon rain forest of South America. One importance of fire was that it helped enable hunter-gatherers to “domesticate the landscape” so that it yielded more of the desired plants through gathering and the sought-after animals through hunting.
Fire also was and is crucial in enabling humans to cook food. Cooking rendered animals and many plants into forms that humans were significantly more able to digest. The capacity to cook foods through the use of fire----which was obtained through gathering and hunting---may have arisen as long ago as 1.8 – 1.9 million years ago at about the same general time as the emergence of our ancestral species Homo erectus on the continent of Africa. (Homo erectus subsequently evolved to Homo sapiens, our own species, about 200,000 years ago). These early humans were able to extract significantly more energy from food as a result of cooking. In short, cooking enabled through the use of fire, produced chemical compounds in food that were more digestible and energy-dense. While the changes and challenges of human diets and nutrition continued to evolve---they are a focus of Module 3 —this early shift to cooking through the use of fire was one of the most influential in our history.
Hunter-gatherer peoples are assumed to have used thousands of different types of plant species and, at the least, hundreds of different animal species. In many cases, the impact on the environment or natural systems was only slight or moderate, since population densities were low and their use of the environment was dispersed. Populations were relatively small and technology was fairly rudimentary. In a few cases, environmental impacts were significant, such as the use of fire as discussed above. Hunting pressure also could have led to significant environmental impacts. It is hypothesized that hunting by groups in North America contributed to the extinction of approximately two-thirds of large mammal species at the end of the last Ice Age around 10,000-12,000 years ago. The human role in this extinction episode, referred to as the Pleistocene Overkill Hypothesis, was combined with the effects of other changes. Climate and vegetation changes in particular also impacted the populations of these large mammals and made them more vulnerable to hunting pressure.
We know less about the societies and social structure (human systems) of these groups. However, work with recent and present-day hunter-gatherers suggests they had high levels of egalitarianism since livelihood responsibilities are widely shared and not easily controlled by single individuals or small groups within these groups. One thing we do now know is that hunter-gatherers have been related to agricultural peoples in a number of ways. A first and obvious way is that in the history of human groups and food systems, "we" were all hunter-gatherers once, and across a wide range of environments agriculturalists emerged from hunting and gathering in their origin. Another is that hunter-gatherers sometimes coexist with agriculturalists and may even have conducted rudimentary trade. Last, there are even cases of hunting and gathering emerging from agricultural groups. In Africa and South America, for example, the Bantu or Bushmen (in southern Africa) and the Gi (in present-day Brazil) are thought to have been agriculturalists prior to assuming hunter-gatherer lifestyles. These changes presumably owed to lessening population densities and the opportunity for more feasible livelihoods through hunting and gathering given the circumstances these peoples faced. This re-emergence of hunting and gathering is an excellent example of the sort of human natural-coupling we consider in this module and apply to the history of food systems: the social factor of lessening population densities, and perhaps something the re-emergence of more wild ecosystems in natural landscapes, allowed these agriculturalists to re-adopt hunting and gathering, with consequent changes in the natural systems.
The Nature and Timing of Agricultural Domestication: Global Patterns
The Nature and Timing of Agricultural Domestication: Global Patterns
The origins of agriculture as the predominant mode of food production were dependent on the domestication of plants and animals. Domestication refers to the evolution of plants and animals into types that humans cultivate or raise; conversely domesticated types can no longer exist in the wild. Domestication and the social and environmental transformation that accompanied them are closely related to the Anthropocene and represent one of the most pivotal experiences ever, both of earth’s environments and in our history and evolution as a species. Domestication has been and is widely studied by interdisciplinary environmental and agricultural fields as well as various disciplines such as archaeology, biology, geography, genetics, and agronomy.
A couple of common definitions of domestication will help to underscore the importance of this concept. In a 1995 book on The Emergence of Agriculture, the archaeologist Bruce Smith defines domestication as “the human creation of a new form of plant or animal---one that is definitely different from its wild relatives and extant wild relatives”. In 2002 in the scientific journal Nature the geographer, Jared Diamond writes that an animal or plant domesticate is “bred in captivity [or in a field] and thereby modified from its wild ancestors in ways making it more valuable to humans its reproduction and food supply [nutrients in the case of plant domesticates]” (page 700). In other words, plant and animal domesticates have lost most or all the capacity to reproduce long-term populations in the wild---thus making domesticated populations of plants or animals different than ones that have been simply tamed or brought into cultivation on a one-time basis as single organisms. Expanding beyond these definitions, you can read more about domestication at National Geographic: domestication [30].
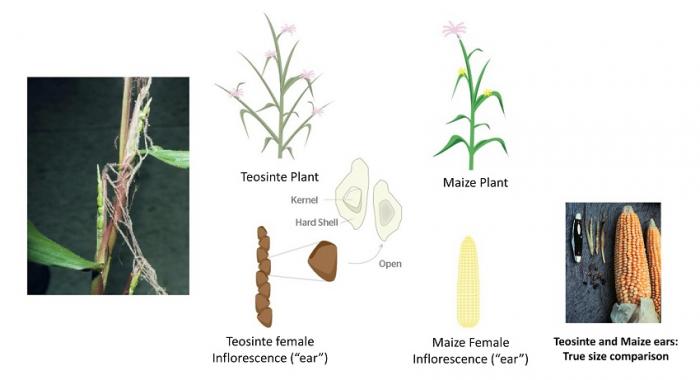
A great deal is now known about the nature of domestication and its timing, in addition to the place of origin of many domesticated crops and animals (covered on the next page). Illustrating the multiple disciplines needed to understand the history of food systems, this information owes to evidence and analysis in archaeology; biology, ecology, and agronomy; geography; anthropology; and genetics. For one, the domesticates in general, and our most important domesticated crops and animals in particular---such as wheat, rice, corn (maize), barley, potatoes, sorghum, cattle, pigs, and sheep, are recognized to have evolved from wild plants and animals that were selected, gathered, and brought back to camp by hunter-gatherers. Second, while a broad spectrum of wild plant and animal foods were being gathered and hunted prior to domestication the origins of agriculture represented a bottleneck. The effect of this bottleneck was that the number of major domesticates that became available to humans numbered in the several dozens, but not the thousands. Third, well-established demonstration of the actual dates of domestication varied from 8,000 - 10,000 years ago in the Near East (the Fertile Crescent of present-day Iraq, Turkey, Iran, and Syria) and China to the broad window of 4,000-8,000 years ago in several of the other world regions discussed next.
Domestication of plants and animals has been framed by many experts in terms of a " domestication syndrome" which refers to a set of traits or "syndrome" that are common to domesticates. Syndrome traits are ones that should be easy to remember because these traits confer usefulness to humans. In plants, for example, wild relatives may have shattering seed pods, where a seed is dropped on the ground as it ripens, while domesticates generally keep their seed on the plant to give humans greater convenience in harvesting. There are also dramatic increases in seed and inflorescence size in many plant domesticates in relation to wild relatives (e.g.. Fig. 2.1.1), as well as decreases in bitter or toxic substances that make food crops generally more appealing and nutritious to humans (and sometimes to wild herbivores as well, which then become pests!). Plant domesticates are generally less sensitive to day length as a requirement for flowering and reproduction, which means they complete their life cycles and produce grain and other products in a more predictable way for humans, and tend to have greater vigor as seedlings than wild relatives, which also follows from their larger seeds. In animals, the greater docility of animal pets and livestock, and traits such as floppy ears and general juvenile-type behavior of domesticated dogs are oft-cited examples of domestication syndrome. See if you can identify examples of these traits in the website presentation of domestication cited in the text above.
Geographical Sites and Ecological Components of Agricultural Domestication
Geographical Sites and Ecological Components of Agricultural Domestication
Just as for the dates and historical processes that led to domestication, the sites of plant and animal domestication are known from a similar interdisciplinary mix of perspectives, from archaeology to genetics. The map in Figure 2.1.2 and Table 1 show current knowledge of seven important areas of early agriculture where the world’s major crops and animals were domesticated. The question of crop and livestock origins and movements presented in this module is still an active and interesting area of research and more remains to be discovered. Most important of these areas was the Fertile Crescent of the Tigris-Euphrates river system and surrounding uplands in Southwest Asia---present-day Turkey, Iran, Iraq, and Syria. This region was responsible for the domestication of several major crops (wheat, barley, oats) and almost all the major domesticated animals (cattle, sheep, goats, pigs) that are incorporated today into major food systems worldwide (for the definition of food system see module 1.2). Like other areas it also included domesticated plants in particular that were significant components of local food systems and diets---such as bitter vetch and chickpeas—that did not become major global staples. China, which we identify as a single geographic area, was responsible for the domestication of rice, soybeans, millet, and several other domesticates that included tree crops such as the peach. Pigs were domesticated independently in China, meaning the pig population there that evolved to domesticated forms was separate from that of the Fertile Crescent. It is likely that China contained two separate areas of major importance in our global overview: the Yangtze River basin and the Wei (Yellow) River valley.
Four other major world regions were also vitally important as sites of early agriculture and in the domestication of major crops and animals. Southeast Asia including New Guinea and the Pacific Islands is an expansive geographic area where staples such as various species of yam, citrus, bananas, and sugar cane were domesticated (see Table 1). A significant size region of sub-Saharan Africa was also quite important, contributing crops such as sorghum, coffee, and species of millet other than the ones domesticated in East Asia (see Table 1). Geographically this area of sub-Saharan Africa includes the savanna areas of West Africa as well as the highlands of Ethiopia and Kenya. Locally within this region, such domesticates as teff and fonio, a pair of grain crops, became highly regarded foodstuffs.
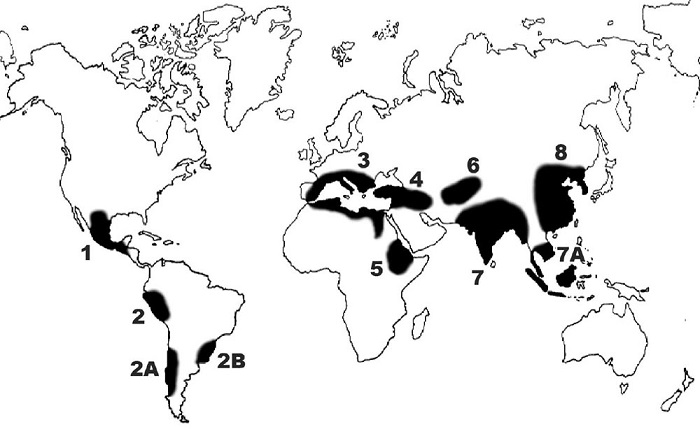
In South America, the combination of the Andes mountains and the Amazon basin was an important area of early agriculture and domestication that included potatoes, sweet potatoes, peanuts, and manioc (or cassava). The Andes and Amazon also included many locally important domesticates such as quinoa and acai (the fruit of the acai palm) that recently have gained popularity as elements of global food systems. The area of Mexico (extending to the U.S. Southwest and southern Arizona in particular) and Central America is also important. This area’s contributions included corn (also known as maize) and domesticated species of bean, chili pepper, and squash in addition to the turkey. Eastern North America was also an important area of early agriculture though most domesticates there did not become familiar items in major contemporary food systems. Sunflower did though become relatively important and some of the domesticated plants of the northern parts of North America, such as cranberry and so-called Indian rice, did become moderately important foods.
| Geographic World Region | Early Domesticated Crops Included | Early Domesticated Animals Included |
|---|---|---|
| East Asia (and Central and South Asia) | Rice; Buckwheat; Millets; Soybean; Peach; Nectarine; Apple (Central Asia); Apricot (South Asia) | Pigs |
| Southeast Asia and Pacific Islands | Taro; Yam; Arrowroot; Banana; Sugar Cane; Coconut; Breadfruit; Orange; Lemon; Lime; Jack Bean; Winged Bean | Pigs, Chicken |
| Near East | Wheats; Barley; Rye; Oat; Pea; Chickpea; Lentil; Vetch; Cherry; Almond | Pigs, Sheep, Goats, Cattle |
| Sub-Saharan Africa: the East African Highlands and Sahelian Savanna | Sorghum; Pearl and Finger Millet; Teff; Ensete; Coffee; Yam; Pigeon Pea; Cowpea; Fonio | Cattle |
| South America, principally the Andes mountains and the lowlands of Pacific Coast and Amazonia | Potatoes; Quinoa; Peanut; Lima Bean; Manioc (Cassava); Pineapple; Sweet Potato | Llama, Alpaca, Guinea Pig |
| Mexico and Central America, mountain ranges and adjoining foothills and lowlands | Maize, Mesoamerican Common Bean (Kidney Bean) and Chile Pepper; Squash | Turkey |
| Eastern North America | Sunflower, Sumpweed, Marsh Elder, Goosefoot or Lamb’s Quarter |
At this juncture, it’s important to note some important points for understanding the environment-food interactions that arise from our discussion thus far of hunting-gathering, domestication, and early agriculture. This geographic and historical context highlights the importance of the independent establishment of early agriculture through domestication in multiple geographic areas across diverse world regions. Our description of current knowledge emphasizes the importance of seven world geographic areas, but other variants of this accounting are possible. Crop origin areas could potentially be more numerous, for example, if we counted additional distinct sub-areas of China, Sub-Saharan Africa, and South America. It is interesting that the major modern population centers, the Eastern United States and Northern Europe, seem to have been less important than other world regions in the domestication of the major staple grains and vegetables. As noted above, the question of crop origins and the relations of humans to crops via domestication, breeding, and knowledge of how to cultivate crops remains an active and fascinating area of research.
Our description also highlights the domestication of a handful of specific species of major crops (approximately 100 species) and major animal domesticates (14 species). These domesticated species are the same ones we still recognize today as the most valuable cornerstones of our current food systems as well as being central elements in their environmental impacts. When local crops and livestock are added the numbers of these domesticates is significantly higher (upwards of 500 species). Still, the number of species in this new agricultural biota paled in comparison to the thousands of species that have been the basis of human livelihoods in hunter-gatherer systems. In other words, early agriculture meant that humans narrowed their focus on a select group of species in the biotic world, namely the ones that were most productive and could be most feasibly and effectively produced and consumed. In doing so, humans intensified the level of interaction, knowledge, and cultural importance of these crop species as a fundamental human-natural relationship at the base of food systems from prehistory to the present day.
In a variety of subsequent units of this course, we will be considering the diversity of crops and animals in agriculture as we explore the agroecology and geosystems of food production (Section II) and the role of human-environment interactions amid such challenges as climate change, food security, human health, and environmental sustainability (Section III). In this module, we keep our focus on early agriculture and domestication. Our present focus will also require that we use the model of Coupled Natural-Human Systems (CNHS) through the remainder of Module 2.1 followed by continuation and expansion of this focus in the next module (Module 2.2) where we discuss a few of the major historical transformations leading to the world’s current situation with regard to the environment and food (Module 2.2).
Explaining Domestication using Coupled Human-Natural Systems (CHNS)
Explaining Domestication using Coupled Human-Natural Systems (CHNS)
The Coupled Natural-Human Systems, which we introduced in Module one, can be used as a framework to explain domestication events and early agriculture in the history of food systems. This framework is sometimes used to think about the "why" question of domestication, for example, "why did human and natural systems come together at a particular time in different parts of the world, including the middle east, so that plants were domesticated and agriculture started?; Why not earlier, and why not later?". The framework can also be used to explore the history of food systems after domestication, which is the subject of module 2.2.
Review and Definitions: Drivers, Feedbacks, and Coevolution
You probably recall from module 1.2 that systems are assemblages of components and the relations between them. Two basic relations that can occur within systems, and that you likely included in your concept map of a food system example (summative evaluation 1.2) were those of a driver and a feedback relation. As you may already suspect, drivers are those processes or changes that can be said to impel or cause changes in other parts of a system, somewhat like a volume knob that causes the volume of music to increase in a room. In the example of the Pleistocene overkill hypothesis from module 2.1, for example, human hunting is thought of (hypothesized) as a dominant human system driver that eliminates the possibility of hunter-gatherers to easily find food, so that they may have been forced to develop early forms of agriculture. Excessive hunting is the driver, and collapsing prey animal populations, and eventually, domestication are responses. Meanwhile, feedback processes are those that can be said to be self-strengthening or self-damping (see module 1.2), and in the case of domestication, also may involve multi-driver processes where a response to a driver is another process that serves to strengthen both processes (positive feedback) or diminish the change (negative feedback). For example, as you will see in the next module, a common dynamic around the emergence of agriculture could be the coming together of excessive hunting, changing climate with worsening conditions for both wild game and crops, and the expansion of human settlements that may have also degraded the land. This combination of human and natural drivers could all tend to drive increased areas under cultivation to deal with the lack of food from hunting, and later the lack of food from soil degradation. A positive feedback emerges when the expansion of agriculture itself begins to change the climate, further eliminate prey, or reduce food availability from soil degradation. These processes would be thus said to interact as a positive feedback on domestication and the emergence and continuing expansion of agriculture. The diagram below (fig. 2.1.3) shows these potential drivers and feedback processes. the basic-level illustration shows the coupling of these two systems.
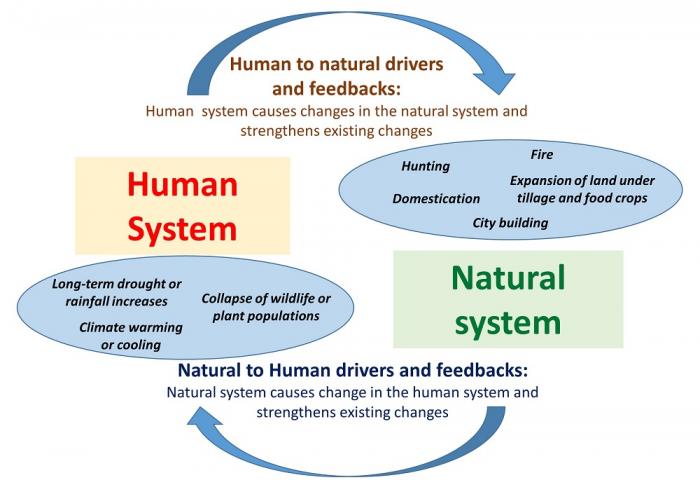
In Figure 2.1.3, then, the human factors that can change the environment we will refer to as “Human Drivers” or “Human Responses” of the CNHS model. The environmental factors that influence humans are referred to as “Environmental Drivers” or “Environmental Feedbacks.” As illustrated below with examples, the CNHS model describes the combined, interlocked changes of human behaviors and societies, on the one hand, and environmental systems including the plants and animals under domestication, on the other hand. This model is also referred to as a coevolutionary model since the drivers and feedbacks, including intentional and unintentional changes, influence subsequent states and the resulting development of the human-environment food system.
An initial, specific example: Why did agriculture emerge at the end of the ice age?
Before using these diagrams in Module 2.2 to explain the history of food systems (including the summative assessment which asks you to diagram some of these relationships yourselves), we'll illustrate the concept of drivers, feedbacks, and the coevolutionary emergence of food systems using a very specific diagram about the emergence of agriculture in Fig. 2.
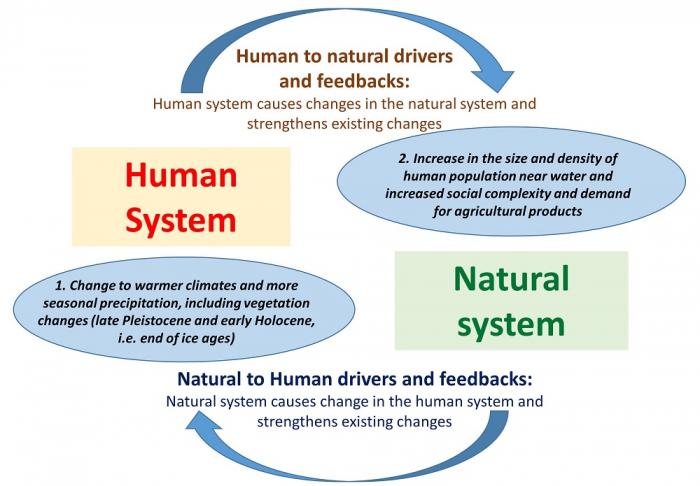
The "story" of this diagram is as follows: First, climate change is one of the main environmental drivers that influenced early agriculture and domestication. At the end of the Pleistocene, the geologic epoch that ended with the last Ice Age, there was a worldwide shift toward warmer, drier, and less predictable climates relative to the preceding glacial period (Fig. 2.1.4, oval (1)). This climate shift that began in the Late Pleistocene resulted from entirely natural factors. Hunter-gatherer populations are documented to have been significantly influenced by this climate change. For example, many hunter-gatherer populations responded to this climate change by increasing the size and density of human populations near water sources such as river channels and oases (Figure 2.1.4, oval (2)). This climate change also led to the evolution of larger seed size within plants themselves (especially those plants known as annuals that grow each year from seed), which are summarized as part of the vegetation changes noted in Fig. 2.1.4. It may have also selected for annual plants being more apparent parts of natural environments in dry climates these humans inhabited, since surviving only one season as an annual plant, and setting seed that survives a dry period is one evolutionary response in plants to dry climates (see module 6 for the concept of annual and perennial life cycles). The driving factor of climate change thus led to responses in plants and human societies that are hypothesized to have acted as drivers for domestication and early agriculture. The driver of climate change is also thought to have concentrated the populations of the ancestors of domesticated animals. Their concentrated populations would have better-enabled humans to take the first steps toward animal domestication. Recognizing the importance of climate change we single it out as the main driver in Figure 2.1.4, though doubtless there were other interacting drivers.
Influential Human Drivers included such factors as population (demographic) pressure and socioeconomic demands for food and organization of food distribution were also highly important in contributing to the domestication of plants and animals and the rise of early agriculture (Figure 2.1.4, oval (2)). This pair of factors is also referred to as human to natural drivers, as shown in the diagram. The influence of human demographic pressure was felt through the fact that settlements were becoming more permanently established and densely populated toward the end of the Pleistocene. People in these settlements would have been inclined to bring wild plants with good harvest and eating qualities into closer proximity, and thus take the first steps toward agriculture.
Socioeconomic factors are also considered important as Human Drivers in early agriculture and domestication. As hunter-gatherer groups became more permanently settled in the Late Pleistocene they evolved into more socially and economically complex groups. Socioeconomic complexity is generally associated with the demands for more agricultural production in order to support a non-agricultural segment of the population as well as for the use of the ruling groups within these societies. The emergence of this social organization, and higher population density, combined with the ability to feed larger populations with newly domesticated grains, are plausible as a powerful positive feedback that served to continue and strengthen the course of domestication and agriculture. Continued climate change associated with the expansion of farmed areas, and potentially soil degradation from farming that necessitated even larger land areas and/or more productive domesticated crops (see module 5), would have been additional feedback forces that strengthened the emergence of agriculture. Therefore, drivers and feedbacks are one way to answer the "when and why" questions around the start of agriculture, as a coevolution of human society with changing climate and vegetation. The concepts of drivers, feedbacks and coevolution will be further explored in module 2.2, to explain other stages and transitions in the history of food systems.
Module 2.2: Historical Development and Change in Food Systems
Module 2.2: Historical Development and Change in Food Systems
Introduction
The environment-food systems characterized by agriculture have exerted transformative effects on environmental and social systems. This unit offers an overview by distinguishing four principal historical-geographic periods of environment-food systems that begin with early agriculture between 10,000 and 4,000 BC. It also introduces modern industrial agriculture and ecological modernization and alternative-food networks (such as organic and local environment-food systems) as a pair of generally distinct types that are currently predominant and actively evolving. The model of Coupled Natural-Human Systems (CNHS) is used to characterize each historical-geographic period. CNHS definitions of drivers, feedbacks, positive feedback, and negative feedback are utilized. To understand the spread of agriculture and its transformation of environments and societies basic concepts such as spatial diffusion and adaptation are used.
From the Origins of Agriculture to Challenges and Opportunities for the Future of Food
From the Origins of Agriculture to Challenges and Opportunities for the Future of Food
Introduction
The development of agriculture as part of food systems in the Anthropocene began with domestication and has continued across millennia among diverse peoples inhabiting a wide variety of the earth’s environments (e.g. the Mediterranean region, the Indus River Valley; southern South America; the Congo River basin; the Island now called Sumatra, and many other highly varied landscapes). The history of agriculture also includes the present: domesticated plants and animals, as well as agricultural management, continues to change. In module 2.2 we will divide an overview of this complex history into four general periods:
- Domestication/Early farming (10,000 BP-4,000 BP);
- Independent States, Small Groups, World Trade, and Global Colonial Empires (4,000 BP – 1800/1900 CE);
- Modern Industrial Agriculture (1800/1900 CE – Present);
- Recent Quasi-Parallel Agricultural Types and Possible Next Phase (2000 – Present): Agroecological Modernization (e.g., Organic) and Local Environment-Food Systems.
Each of these categories lumps together a lot of variation with regard to the specifics of agriculture and coupled human-natural food systems, and if you have the chance to read in more detail about these phases of the Anthropocene, you'll find a significant and interesting amount of variation among different places and time periods (see the additional readings at the end of the unit).
To continue describing the environment-food systems of each of these four periods, we recall that in module 2.1 we described the long period of hunter-gatherer activities and environment-food systems, which comprised well over 90% of the history of humans as a cultural species. We also looked at plausible drivers and feedbacks in the origins of agriculture and domestication. Here in Module 2.2. We’ll pick up the thread of the environmental and social transformations represented by agricultural origins and domestication. We note that early agriculture, and perhaps a later stage of agricultural development marked the transition to the Anthropocene epoch in which humans became a dominant force in transforming earth's surface and natural systems (see module 1 regarding the Anthropocene).
Key terms and concepts for the history and development of food systems
After its first origins, agriculture spread worldwide through a process known as spatial diffusion. The spatial diffusion of agriculture involved individuals and groups of people gaining access to the ideas, information, and materials of agriculture and other innovations through physical relocation and social interactions. Spatial diffusion can occur through local individual-level human observation and the exchanges of goods and information as well as long-distance trade and organized activities (e.g. group-level decisions to adopt a new planting technology). A brief description and examples of spatial diffusion in early agriculture are given in Table 2.2.1. While agriculture was developed independently in each of the different world geographic areas roughly corresponding to centers of crop domestication (Module 2.1, Figure 2.NN), agriculture then spread widely out of these early centers in a way that was highly influential. Agriculture's diffusion from the Near East to Europe, for example, transformed a wide range of environments and societies. As discussed more below, the spread of crops themselves was often transformative for the environment-food systems to which these domesticates arrived. For example, all the major cuisines we know today rely on food ingredients that were made available as the result of spatial diffusion For example, foods originally from Mexico, such as tomatoes, chili peppers, and maize transformed environment-food systems globally beginning in the 1500s, spreading as far as Africa, India, and China.
The geographic spread of agriculture created both similarities and differences across space and time. On the one hand, sharing the same food crops and sometimes agricultural techniques created commonalities among environment-food systems. The current environment-food system of the country of Peru, for example, is rooted to a large degree in the connections that were forged through spatial diffusion during the Inca Empire that ruled between roughly 1400 and 1532 of the Common Era (CE). On the other hand, differences in environment-food systems also evolved over time as crops and food were subject to the human and natural system influences in each new site to which agriculture spread. One of the main reasons for these differences was the role of people in adapting agriculture to different environments and sociocultural systems.
A few concepts in addition to spatial diffusion are central to understanding the spread of agriculture and its importance, and we introduce them here. These concepts -- adaptation, agrodiversity, and niche construction -- are briefly described with examples in Table 2.2.1, and the term Anthropocene is also reviewed from the standpoint of its relation to early agriculture. The first of these, adaptation, refers broadly to the way in which humans use technical and social skills and strategies to respond to the newness or changes of environmental and/or human systems (e.g. droughts, hillier topography or increased rainfall as crops moved to new areas, climate change). Adaptation and adaptive capacity of human society are a major focus of Module 11.
| Term | Definition | Examples | Synopsis of Significance |
|---|---|---|---|
| Spatial Diffusion | Movements of people, things, ideas, information, and technology through physical relocation and social interaction. | Spread of agriculture from the major areas of early agriculture and domestication (e.g., from Near East to Europe). | Each period of agricultural development covered in Module 2.2 relied on spatial diffusion of environment-food systems |
| Adaptation | Humans use social and technical skills and strategies to respond to the newness or changes of environmental and/or human systems. | Domestication of plants and animals by the early farmers responding to changes in the environment and human systems; changes in a crop variety or farming techniques carried out by human groups as crops moved into new environments with new requirements for successful agriculture. | Adaptation is an ongoing process that has continued through the major periods of agricultural development to the present. (Also covered in Module 9.1) |
| Agrodiversity | Human management of the diversity of environments in agriculture and food-growing; This definition was later expanded to included human organizational diversity in the use of the environment. | Many areas of early agriculture had high environmental diversity, such as tropical and subtropical mountains, humans developed myriad agricultural techniques to master food production in these different environments, e.g. irrigation systems, planting methods, terraced fields, special tools, and implements. | Agrodiversity is a major form of human-environment interaction. It is related to, but different, than agrobiodiversity (Covered in Module 9.2) |
| Niche Construction | Agriculturalists (and hunter-gatherers) shaped food-growing environments (“niches”) through constructing fields and other kinds of activities | Hunter-gatherers shaped heavily used habitats through hunting, gathering, and habitation. These intensively used habitats created the niches that were first occupied by crops in the beginnings of agriculture, with somewhat more disturbed soils, fewer forest plants, and perhaps higher fertility from all sorts of human refuse. Later, farmers actively fertilized and tilled soils to favor domesticated annual crops or created niches within managed forests that favored "forest garden" species. | The concept of niche construction is important since it teaches us that humans are adapting not only to environments but also to environments being shaped through human influence |
| Anthropocene | Distinct geologic epoch representing the present and defined by the significant level of human modifications of the earth’s environmental systems (see module 1) | Two factors commonly mentioned in the definition of the Anthropocene are the global clearing of woodlands (deforestation) in early agriculture and the spread of modern industrial agriculture. | Agriculture-related activities are considered major factors in most though not all definitions of the Anthropocene. |
The use of agrodiversity was also vital to the spread of early agriculture. Agrodiversity is described by the geographer Harold Brookfield and the anthropologist Christine Padoch as human management of the diversity of environments in agriculture and food-growing. Brookfield and Padoch use agrodiversity to describe indigenous farming practices among native peoples, but all knowledgeable farmers actively make use of agrodiversity, even if the technologies may differ greatly. Managing diverse agricultural environments was essential since early farmers produced domesticated plants and animals under new and different conditions. The third concept is that of niche construction, meaning that agriculturalists (and hunter-gatherers) shaped food-growing environments (“niches”) through constructing fields and all kinds of other activities. As a result, adaptation occurring across the wide geographic and historical evolution of environment-food systems involves responses to a range of factors that include both natural ones and those resulting from human activities.
The development of agriculture through the four periods mentioned above has resulted and continues to incur, a wide range of both environmental and social impacts that will be mentioned in the following pages of this module. Environmentally these impacts have altered the biogeophysical systems of our planet, including the land, water, atmosphere, and biodiversity of the earth. As mentioned the idea of the Anthropocene epoch---a distinct geologic epoch defined by drastic human modifications of the earth’s environmental systems---is often tied to agricultural activities. Global environmental sustainability, whether the earth’s systems are operating within limits that will enable long-term functioning, is fundamentally influenced through agriculture, as you’ll see in this module and all the ones to follow.
Period 1: Domestication, Early Farming, and Widespread Impacts (10,000 BP - 4,000 BP)
Period 1: Domestication, Early Farming, and Widespread Impacts (10,000 BP - 4,000 BP)
We will start our historical summary of environment-food systems by describing domestication and early farming (10,000 BP – 4,000 BP). Widespread environmental and social impacts occurred during this period. New agricultural ecosystems were created and spread along with the use of domesticated plants and animals. These agroecosystems contained distinctive species and populations of plants and animals including domesticates, as well as characteristic insects, mammals, soil biota, and uncultivated plants (such as weeds). In many places, agroecosystems were increasingly established in areas that previously had supported tree cover. During this period in the Near East, China, and Europe, for example, clearing for agriculture led to increased deforestation.
Required Reading
Jared Diamond, "The Worst Mistake in the History of the Human Race [28]"
As part of this survey, we ask you to read the short and provocative article by Jared Diamond on the impacts of the diffusion of early agriculture. This should prompt a lot of thinking on your part about the way that the emergence of agriculture affected human societies that we describe further below.
Impacts of domestication and early agriculture were notable not just for natural systems but also on human systems. Both a population explosion and a technology explosion occurred in conjunction with early agriculture. The early farming societies grew in the size of their populations and the use of diverse tools and technologies, including ones that no longer needed to be transported as part of highly mobile hunter-gatherer lifestyles. The growth of population was made possible by the increased productivity of food per unit of land area. Impacts on human health and disease were also notable in this period, though they were not entirely positive. As Jared Diamond points out in the required reading above, there were negative impacts on human health traced to larger settlements and denser human populations (e.g. highly infectious “crowd diseases” such as measles and bubonic plague) and also infectious disease involving transmission from domesticated animals (measles, tuberculosis, influenza). Nutritional stress also ironically increased, with life expectancy actually decreased following domestication and the early development of agriculture.
These negative impacts on humans have led Diamond to refer to agriculture provocatively as “The Worst Mistake in the History of the Human Race”. This title is purposefully provocative, and by way of understanding this "mistake", we should realize that early farmers’ switching to agriculture may have become the most viable option in many places. Agriculture becoming the principal livelihood option would have occurred as local hunted-gathered food sources were overexploited and/or required by population pressure. By the end of this period, the evolution of more complex societies also meant the development of deep class divisions. There the social phenomena of deepened class divisions must also be seen as a product, in part, of the evolution of agriculture. In addition, changing social arrangements from agriculture would tend to create a positive feedback (see the end of module 2.1), along with other factors, in maintaining and deepening the pathway of society towards a greater embrace of an agriculture-based food system.
The model of Coupled Natural-Human Systems (CNHS) can be used to reflect on the above impacts through the integrated perspective of human-environment interactions. Here we can highlight a couple of these interactions. First, widespread deforestation occurred as a result of early agriculture. In addition to changing land cover and ecosystems, it has been postulated that the extent of this deforestation at this time was significant enough to release considerable carbon dioxide (CO2) and thus to define the beginning of the Anthropocene epoch. As mentioned below other scientists argue the Anthropocene was created more recently. This scientific debate about the Anthropocene epoch has been productive in our understanding of human dynamics and impacts with respect to the environment.
Humans are presumed to have responded to deforestation by increasing their reliance on agriculture, since the removal of forest cover would have reduced the productivity of hunting-gathering activities, creating a second positive feedback that would have deepened the transition to agriculture. The second form of human-environment interaction involved the selection of a relatively small fraction of utilizable plants and animals that become the cornerstones of early agriculture. Since these plant and animal domesticates produced well relative to others, they became relied upon by early farmers, also acting as positive feedback towards the adoption of an agricultural lifestyle. The legacy of this initial selection of certain types of plants and animals demonstrates the important role of contingency and positive feedbacks, whereby initial decisions were amplified and exerted a lasting influence on the Coupled Natural-Human Systems of agriculture. The concepts of feedback are considered further in the subsequent pages and in this Module’s Summative Assessment.
Period 2: Independent States, World Trade, and Global Colonial Empires (3,000 BP – 1800/1900 CE)
Period 2: Independent States, World Trade, and Global Colonial Empires (3,000 BP – 1800/1900 CE)
The second period of our rapid historical survey encompasses independent states, societies based on small groups, world trade, and global colonial empires and covers roughly 5,000 years between 3,000 BP and 1800/1900 CE. Both positive and negative environmental and social impacts were associated with this period. We can use the coupled system model to illustrate two examples of this period’s characteristic forms of environment-society interactions. The Inca Empire in the Andes Mountains of western South America (from present-day Colombia to Argentina) offers a good example of an independent state with pronounced environmental and social impacts of its agriculture. Ruling from approximately 1400-1532 the Inca state oversaw the building and maintenance of extensive agricultural field terraces and irrigation canals (Figure 2.2.1). These terraces and canals produced sustainable landscapes in the tropical mountain environments of the Andes.
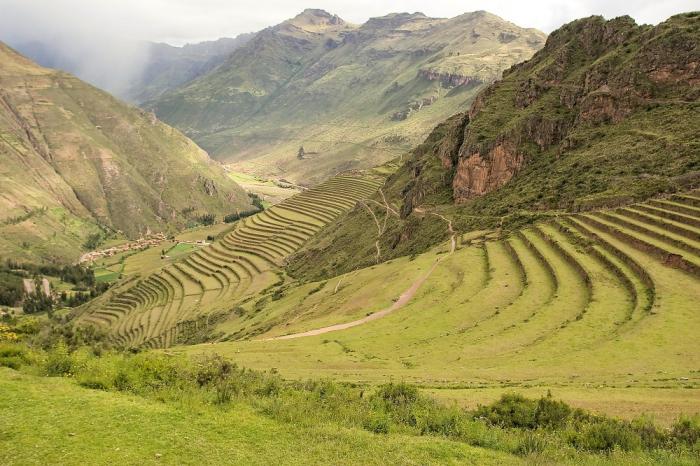
From the perspective of coupled natural-human systems (CNHS), the terraces and canals of the Inca produced sought-after foods and symbolized Inca imperial power, thus contributing further to Inca capacity to extend these sustainability-enhancing earthworks. The Inca state eventually established terraces and other large-scale agricultural and food transportation works (storage facilities, improved riverbank fields, roads, and bridges) that extended over much of the area of their empire. Environmental impacts of these terraces and other earthworks were beneficial since they stabilized mountain agricultural environments and enabled higher levels of food-growing per unit land area without major damage. Still, we need to remind ourselves that early independent states, such as the Inca, also created environmental problems and often were marked by large social inequalities between rulers and commoners. In other words, just as today, the environment-food systems of non-European peoples could and did attain high levels of sophistication while, at the same time, they were often wracked by significant issues with both environmental and social sustainability (see module 1 for definitions from the "three-legged stool" of sustainability. Similarly important for us to note is that some Inca terraces and canals continue to exist and are still used today as they are in Peru so that they still create a sustainable contribution to food systems at a local scale.
A second example of environmental and social impacts resulting from this period of agricultural diffusion and trade in world history comes from the world trade system established by global colonial empires involving major European powers between 1400 and 1800 (such as the Spanish, British, and French colonial empires). A well-known example of social and environmental impacts from this time period is the exporting of crops and livestock, along with related elements of European environment-food systems, on many areas of the world by these empires. Examples included wheat, sugar cane, alfalfa, cattle, and sheep. These crops and livestock had not originated in Europe but had already diffused there during earlier history, and were common in Europe at the time these empires were expanding. These components of new European colonial environment-food systems were mutually reinforcing, since for example the forage crop alfalfa and introduced European grasses were highly conducive to expanding the raising of cattle and sheep and making new sources of animal food products available to human populations. There were thus reinforcing (positive) feedbacks between the way that these crop species such as alfalfa and grasses were able to "remake" environments and make them more hospitable for European livestock. Sugar cane is another crop that is notorious for remaking the landscapes and social relations in the Caribbean, South America, and the United States, through plantation agriculture and slavery. The case of pasture species and livestock is considered further in this module's summative assessment.
Period 3: Modern Industrial Agriculture (1800/1900 CE – Present)
Period 3: Modern Industrial Agriculture (1800/1900 CE – Present)
The third major period in our broad historical summary is modern industrial agriculture, which is the predominant environment-food system today, though it coexists with a significant sector of smallholder agriculture that has incorporated modern industrial techniques to a greater and lesser extent.
Modern agriculture arose in the 1800s and 1900s through a variety of developments in agriculture and in the processing and business of foods. “Industrial” in this description refers to the major role of factory-type processes that are principally large-scale and involve the defining role of technological inputs such as large amounts of freshwater use, chemical fertilizer, pesticides, and “improved” seed that delivers high-yield responses to the other inputs. Industrial is also an appropriate term since this environment-food system has narrowed concentration on a few species of crops and livestock. “Modern” is important in this description since distinct foodways and consumption practices---many based on foods that are highly processed, relatively inexpensive, easy-to-prepare convenience items---that are integral to this environment-food system. Modern is also an important term since it’s estimated this predominant system is based on more changes in the past 100 years than occurred over several hundred and maybe even thousands of years previously.
In much of the world, the advent of the modern environment-food system was provided through the Green Revolution beginning in the 1940s and 1950s. The Green Revolution used science and technology to develop modern crops and agricultural production systems for the countries of Asia, Africa, and Latin America. While it has evolved considerably, the approach of the Green Revolution continues to be used today. The worldwide influence of the Green Revolution suggests one additional term to describe this type of environment-food system, which is “global.” The development of this system, as well as its inputs and impacts, is global in scope. The global characteristics of today’s predominant environment-food system will be evident throughout this module and the others in this course as we place emphasis on the global scale of environmental and social impacts, which relates to the concept of the Anthropocene. In fact, if we consider the bar graphs of the relative areas of wild versus managed land (crops and livestock) globally presented in module 1 (Figure 1.1.4) we can see why some experts prefer to think of modern industrial agriculture, and the related expansion of human populations, as the defining period of the Anthropocene.
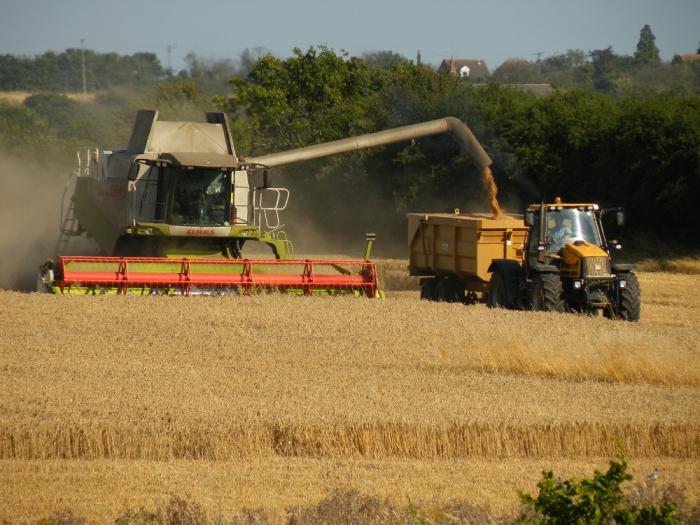
A wide range and mix of environmental and social impacts are associated with modern industrial agriculture. Agricultural mechanization has coincided with a major reduction in the agricultural workforce. In the United States, for example, less than 2% of the population is estimated to be directly employed in agriculture. In the 1870s and 1880s, by contrast, this estimate was 60-80% of the U.S. population. Environmental impacts and human-environment interactions have also been strongly influenced by the widespread use of fossil fuels in modern industrial agriculture.
Fossil fuel use is the foundation for many modern agricultural technologies ranging from tractors and farm machinery (Fig. 2.2.2) to fertilizers and pesticides as well as the energy costs of processing and the large number of “food miles” typically involved in transportation. As the result, energy issues along with greenhouse gas emissions have become a major concern with modern industrial agriculture----as discussed in subsequent modules.
One example of human-environment interaction will suffice in this section since modern industrial agriculture will be examined in detail in many of the modules that follow. (Modules 6, 7, and 8, which focus on agroecology, feature excellent and far more extensive examples.) The widespread use of pesticides and the creation of pesticide-dependent crops and cropping systems are a defining characteristic of this agriculture worldwide. The development of these synthetic products for protecting crops, and potentially the increase in yields associated with solving, if temporarily, a pest problem. Meanwhile, the populations of agricultural pests continue to evolve resistance in response to these applications, an example considered further in module 8. As a result, it is essential that these modern industrial crops and cropping systems (including the use of pesticides) be constantly developed in order to gain a new advantage against the most recently evolved pests.This innovation process in agricultural technology for crops is another example of a positive feedback driving the further industrialization of agriculture.
Period 4: Sustainability Movements Towards the Future of Food: Quasi-Parallel Ecological Modernization and Alternative Food Networks (2000 – Present)
Period 4: Sustainability Movements Towards the Future of Food: Quasi-Parallel Ecological Modernization and Alternative Food Networks (2000 – Present)
In recent history (since 2000) significant new directions have entered the spectrum of existing environment-food systems. The future of food will depend on these newer systems, in addition to modern industrial agriculture that was introduced on the previous page. The new directions---which we refer to here as “ecological modernization” and “alternative community-based food systems”---are a response to concerns over environmental sustainability, human health, and food safety in addition to the attempt to reinvigorate rural society and address social justice issues, a concept we introduced in module 1 as "social sustainability". Each of these new directions also has its own environmental and social impacts. These impacts are introduced here and then taken up again in module 10.1 when we consider them as "global" and "local community" variants of new, alternative food system types. In both these new directions, a major role is taken by ecological methods and techniques replacing to a significant degree the use of synthetic chemicals. Substantial success can be seen in some cases: for example, organically certified lettuce and carrots with reduced use of synthetic pesticides now account for more than 10% of the land producing these crops in the United States.
Social changes---remember we use this term broadly to refer to economic impacts as well---vary widely in the environment-food systems associated with ecological modernization. Large corporations as well as a substantial number of large family-managed farms, for example, predominate in the large-scale sector of organic agriculture and organic food production and distribution, where these companies and large farms occupy a "quasi-parallel" role to their role in supporting modern industrial food production (previous page). We and other authors describe their style of adoption of organic production techniques as ecological modernization because they seek environmentally sustainable methods as relatively interchangeable replacements for synthetic chemical inputs in modern agriculture (previous page). Ecological modernization also retains modern forms of organization, for example, large scale and efficiency of cropping and shipping of food, corporate management, and sales through mass outlets such as supermarkets. Food distribution companies in this system can offer organic foods at lower prices in the case of fresh vegetables and fruits. This advantage is significant since affordability is a major issue among potential consumers of organic food, and such "corporate organic" foods may be more accessible at the present for a larger proportion of the population. Others argue that issues of cost and accessibility resulting from transitions towards organic and other more ecologically-based ways of managing agriculture merely reflect the artificially low financial, environmental, and social costs of comparable products from the modern industrial food system, for example, the carbon dioxide emitted in the manufacture of fertilizers and pesticides (see module 10). In any case, the rules, regulations, and preferences of human systems designed to foster organic agriculture (such as organic certification and labeling) may be effective in improving the natural system, though the feedbacks to human systems may be ones mostly supporting large agribusiness through positive feedback effects introduced in Module 2.1.
Take for example the case of organic produce such as lettuce and carrots where natural conditions in climatically optimum growing areas (e.g., organic vegetable-growing areas in California) favor the capacity of large corporations and family farms able to access the high-quality land, resource systems (such as water), and deal with the regulatory tasks associated with large-scale national markets. The large scale of these corporate actors becomes a positive feedback driver which strengthens the transition towards this "ecological modernization" mode of a new food production system. This case is considered further in this Module’s Summative Assessment.
“Alternative community-based food networks” is a term that is applied to various smaller though increasingly important types of environment-food systems. We use this term to focus on local environment-food systems. Proponents and activists supporting these types of environment-food systems center much of their attention on the process known as re-localization. This process brings food producers into closer contact with consumers. Local farmers' markets, where farmers sell food directly to consumers, are an example of re-localization. Local environment-food systems are seen as an alternative to the concentrated corporate control of environment-food systems. A major goal of re-localization is supporting small- and medium-scale farmers, including the majority of family-owned farms, as a means of reinvigorating rural life among a range of small businesses---not just a larger number of farms but also the corresponding number of small business that support and benefit rural areas. This interest in “alternative food systems” is committed to increasing the percentage of the “food dollar” that goes directly to farmers. This percentage is estimated currently at 8-10% in modern industrial environment-food systems where a large share of the food dollar goes to food processors and farm input suppliers. For this reason, the local food emphasis in alternative food movements is also sometimes referred to as an emphasis on short food supply chains exemplified by farmers' markets or regional sourcing of food in supermarkets and restaurants. These alternative food systems are presented further in Module 10.
Summative Assessment: Drivers and Feedbacks in the Development of Food Systems
Summative Assessment: Drivers and Feedbacks in the Development of Food Systems
Instructions
Download the worksheet [34] to understand and complete the assessment. You will submit the answers from the worksheet to the Module 2 Summative Assessment in Canvas.
The first part of the worksheet presents a more detailed version of the interaction of human and natural systems at the onset of agriculture at the end of the last ice age, presented at the end of Module 2.1. This is to provide you an example in the use of these diagrams to think about changes in food systems over human history, and it is shown below here as well.
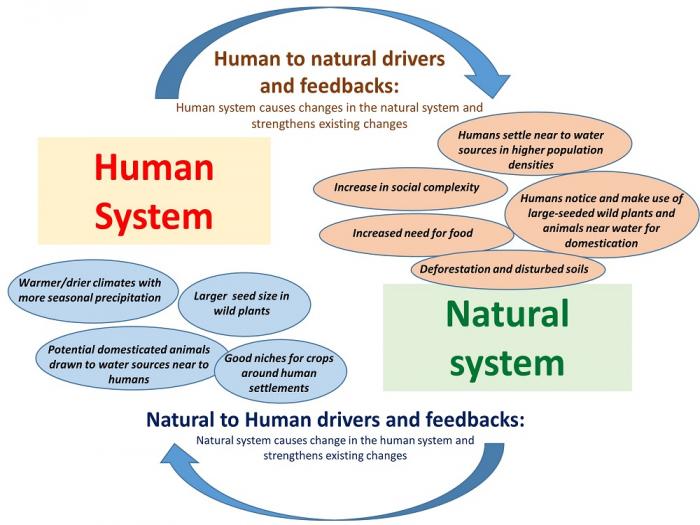
Further instructions for the assignment are given in the worksheet. You will need to fill in four questions on the worksheet, some of which have multiple parts.
Completing Your Assignment
Please use this completed worksheet as a guide for taking the Summative Assessment quiz. You do not need to submit your worksheet.
Summary and Final Tasks
Summary and Final Tasks
Summary
Agriculture is the most widely practiced and influential environment-food system though it is not the only one---either historically or at present. Environment-food systems in general and agriculture, in particular, are a complex coupled system that combines human and natural systems and underlies human life, cultural, and social functions. The distinct human-environment interactions of agriculture, including domestication and the management of diverse habitats for raising plants and animals, have existed for upwards of 10,000 years and were preceded and co-exist with other environment-food systems such as hunting-gathering. Human-environment interactions were as integral to the origins of agriculture as they are to our understandings of modern industrial agriculture and farming alternatives in our current period of history. Human-environment interactions also can help to understand the history of food systems between the onset of agriculture and the present day. Considering human-environment interactions in the context of the historical and geographic parameters mentioned above provides an overview that serves to introduce the following two sections of the course that focus on environmental systems (Modules 4-9) and social systems (Modules 10-11). The systems concepts of drivers and feedbacks in the development and functioning of food systems should also help you to understand the focal region you will examine in your capstone project.
Reminder - Complete all of the Module 2 tasks!
You have reached the end of Module 2! Double-check the to-do list on the Module 2 Roadmap [35] to make sure you have completed all of the activities listed there before moving onto Module 3!
Further Reading
- Brookfield, Harold. Agrodiversity. New York: Colombia University Press, 2002.
- Brookfield, H., Padoch, C., Parsons, H., & Stocking, M. 2004. Cultivating biodiversity: understanding, analyzing and using agricultural diversity.
- Crosby, Alfred, Ecological Imperialism: The biological expansion of Europe, 900-1900. Cambridge University Press, 2nd edition 2004.
- DeLind, Laura. "Transforming organic agriculture into industrial organic products: Reconsidering national organic standards." Human Organization 59(2): 198-208, 2000.
- Diamond, J. Evolution, consequences and future of plant and animal domestication. Nature 418 (6898): 700-707, 2002.
- Dunn, Rob. Never Out of Season: How Having the Food We Want When We Want It Threatens Our Food Supply and Our Future. Little, Brown and Company. 2017.
- Duram, Leslie. Good Growing: Why organic farming works. U of Nebraska Press, 2005.
- Pollan, Michael. The botany of desire: A plant's-eye view of the world. Random House, 2001.
- Smith, Bruce D. The Emergence of Agriculture. New York: Scientific American Library, 1995.
Module 3: Diet and Nutrition
Module 3: Diet and Nutrition
Introduction
Module 3 covers the nutritional needs to which human consumption patterns ideally respond within food systems and some of the nutritional challenges (related to both deficit and excess of diet components) that are currently faced by food systems. Module 3.1 covers some current basic knowledge on human nutritional requirements and features of diets that are health-promoting. Module 3.2 covers current issues within food systems of malnutrition, as well as the challenges and efforts aimed at making diets healthier, both in the United States and around the world. We encourage you as learners to think about how these nutritional principles, and efforts to promote food access and healthier diets, can fit with the analysis of the focal region you will be completing for your capstone region.
Diet, health, food systems, and sustainability
This module addresses issues surrounding diet and nutrition in food systems. This is an aspect that touches all of us very personally – we’ve likely read and absorbed some of the messages about healthy eating that are promoted by government agencies, advocacy groups, and other voices in our society, as well as a substantial dose of messages of all sorts promoting food choices - healthy and otherwise - from food companies within the modern food system. For many of us nutrition goals and principles motivate important decisions that we make on a daily, ongoing basis: can we include a vegetable with our dinner? What makes for a healthy breakfast? How to make snacks healthy rather than an excuse for junk food? Food choices are also wrapped around culture and religious observance for many of us, illustrating how our human systems of culture and ethnic origin feed into food systems, along with our beliefs and principles regarding the supernatural. This echoes the way that food systems and domestication of food-producing plants and livestock were wrapped together with culture and religion in earlier historical and prehistoric periods (see Module 2). Food choices are also wrapped up in social status, as well as linked to environmental sustainability. For example, once we appreciate the dramatically increased use of water to produce beef and the fact that water shortages may be one of the key stresses brought on by climate change (see module 1 food system examples, following modules on water and resilience), we may rethink meat consumption in our society and take a different view of the aspiration of growing wealthy social sectors around the world to consume more beef.
The impact of food choices on the environment is not the only reason to consider diet and nutrition. As a society, our food choices and our ability to access sufficient and healthy food have a dramatic influence on our own health and well-being. This is seen most clearly as two major issues facing societies around the world. The first is a crisis of chronic malnutrition and nutrient deficiencies: the lack of crucial elements of minerals, vitamins, proteins, and high-quality fats around the world have dramatic negative effects, while appropriate diets can prolong life and good health even among people who are materially poor in other ways. The second major issue facing modern and modernizing societies are nutrition-linked disorders such as heart disease and type II diabetes, linked to overconsumption of calories in relation to sedentary lifestyles that translates into increased rates of obesity within both wealthy and poor countries.
Diet and nutrition patterns thus show the potential to either support or harm both the health of the environment and the health of humans within the human systems that live in constant interaction with the environment as main components of food systems.
Goals and Learning Objectives
Goals and Learning Objectives
Goals
- Describe the basic elements of a healthy diet from a scientific standpoint.
- Describe current major nutrition challenges and their immediate causes, such as nutrient deficiencies and calorie overconsumption.
- Relate current major nutrition challenges to social factors such as food access and changing diets in modern food systems.
Learning Objectives
After completing this module, students will be able to:
- Describe the basic categories of nutrients and how these contribute to human function and health.
- Describe the major changes taking place in diet/nutrition in rich and poor countries, respectively.
- Define the concept of food access and the term "food desert" as contrasted to the broader concepts of food security and food insecurity.
- Understand changes in thinking around healthy nutrition and basic principles that have remained.
- Use an online nutrition tool to analyze and compare diets and areas in which they are deficient or excessive in nutrients.
- Analyze why food access is an issue in modern food systems.
- Use a mapping tool to analyze the situation of food access in U.S. cities, and relate these situations of food access to literature describing the history of strategies to guarantee food access in these cities.
Assignments
Module 3 Roadmap
Please note that some portions of the Summative Assessment may need to be completed prior to class. Detailed instructions for completing the Summative Assessment will be provided in each module.
| Action | Assignment | Location |
|---|---|---|
| To Read |
|
|
| To Do |
|
|
Questions?
If you prefer to use email:
If you have any questions, please send them through Canvas e-mail. We will check daily to respond. If your question is one that is relevant to the entire class, we may respond to the entire class rather than individually.
If you prefer to use the discussion forums:
If you have any questions, please post them to the discussion forum in Canvas. We will check that discussion forum daily to respond. While you are there, feel free to post your own responses if you, too, are able to help out a classmate.
Module 3.1: Diet and Nutrition Basics for Global Food Systems
Module 3.1: Diet and Nutrition Basics for Global Food Systems
Introduction
We'll start this module with the basics of nutrition and diet required for basic human functioning as well as good health. Nutrition basics start with the idea of a balanced diet, which should provide the essential nutrients for daily human activities, growth and tissue repair, and overall health, which have been demonstrated by years of research on human nutritional needs. Figure 3.1.1 shows one recent attempt to summarize this scientifically grounded view of a balanced diet in an accessible way as a "healthy eating plate". You'll notice that the sections addressing diet throughout module 3 will refer back to the concept of balanced combinations of nutrients from different food sources that create this balanced diet. It is also important to state that nutritional theories and the concept of the optimal diet have been somewhat changing over decades and centuries, which may give us reason to be careful about the certainty with which we hold to nutrition beliefs. See "High-quality fats and shifting paradigms around fat in diets [38]", further on in this module, on the changing attitudes from researchers towards different fat sources in human diets. Nevertheless, years of nutrition research up to the present have defined the requirements of a healthy diet that have been incorporated into the nutritional guidelines summarized in figure 3.1.1. and also published by the United States Department of Agriculture and other government agencies around the world.
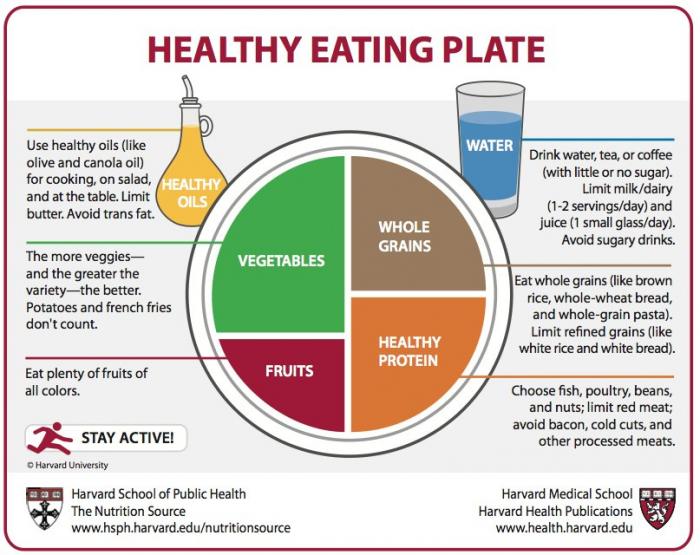
What follows in the rest of module 3.1 is a summarized description of human nutritional requirements, intended to allow you to relate these to food systems as the source of human nutrition. Because of this, we will present both the requirements (e.g. vitamin A versus vitamin C versus amino acids) and also some major issues with particular nutrients that tend towards deficiency in many human populations and their related food systems. At the outset, we can already guide your learning by presenting an exceptionally simplified version of human nutrient needs that you will flesh out in the following pages. To a crude approximation, humans need the following components in their diets: energy, which in practice means carbohydrates, fats, and protein seen in relation to their energetic content; "building blocks" of growth and maintenance, which is generally protein linked to higher-protein foods but occurring within both the protein and whole-grain fraction of the healthy plate above; and promotion of health, proper development, and proper function, closely linked to vitamins and mineral intake. We'll delve into these elements of a balanced diet one by one in the following pages, and add a few details as well. An additional point that deserves mentioning now is the particular importance of proper nutrition for growth, mental development, and health promotion in children. Children are thus particularly vulnerable to nutrient deficiencies, and the consequences of deficiencies can be long-lived in their development into adulthood.
Energy Sources in Foods: Carbohydrates, Fat, and Protein
Energy Sources in Foods: Carbohydrates, Fat, and Protein
Energy: Requirements and Function
Carbohydrates (starches and sugars), fat, and protein within food can all function as sources of energy when they are metabolized to carbon dioxide and water in respiration processes in all of our body’s cells. This energy fuels everything from the production of neurotransmitters in our brains to the muscle contractions required to shoot a basketball or weave a basket. The energy content of food is expressed as “calories” (“calories” are in reality kcal or kilocalories as defined in chemistry; 1 kcal will heat one liter of water one degree C). Energy-dense foods with high caloric content are generally those with high carbohydrate, protein, or fat content - for example, pasta, bread, oatmeal, grits, and other cooked whole grains and porridges consumed around the world as staples; plant oils or animal lard present in cooked foods, or meat and cheese. It is interesting to note that gram for gram, fats contain over twice the energy density of carbohydrates or protein: about 9 kcal per gram for fats versus only about 4 kcal per gram for carbohydrates and protein. We’ll address the further role of high-quality fats as a nutrient, rather than just an energy source on a page further on.
Energy Sources: Diet and Food System Aspects
Current U.S. Department of Agriculture (USDA) and other major nutritional guidelines promote the idea of accessing calories via a predominance of whole grains (e.g.. whole wheat and oats and flours made from these, brown rice) as these whole grains contain a mixture of carbohydrates, proteins, and indigestible fiber, as well as vitamins. These non-caloric contributions to nutrition are also important as discussed in the pages below, and combine well with the caloric content of food to produce better health outcomes. Calories are a fundamental consideration within nutrition because a negative calorie balance (calories consumed minus those expended in human sedentary activities and exercise) along with shortages of other associated food components described below leads to weight loss and faltering growth in children, including childhood stunting and permanent harm to a person’s developmental potential. By contrast, large excesses in a calorie balance over time lead to weight gain that is linked at a population level to increased rates of heart disease and diabetes. These diet-related diseases increasingly afflict populations in industrialized economies and urban populations worldwide with access to abundant, though often less healthy, food choices. Diet-related diseases as part of food systems will be taken up again in module 3.2.
Protein and Amino Acids: Building Blocks
Protein and Amino Acids: Building Blocks
Protein: Requirements and Function
The second main component conceptualized by nutritionists as a key ingredient of a healthy diet is protein, which is used in many different ways to build up and repair human tissues. Proteins are basically chains of component parts called amino acids, and it is these amino acids that are the basic “currency” of protein nutrition. Twenty amino acids are common in foods, and of these nine[1] are essential because humans cannot synthesize them from other nutrient molecules. Meat, fish, and eggs are animal-based and protein-dense foods that contain the complete profile of amino acids, basically because we are eating products that are very similar in composition to our own body tissues. In addition, some grains such as quinoa and buckwheat contain complete protein, while most legumes (peas, beans, soybeans, bean sprouts, products made from these) are high in proteins in a way that complements grains in the diet.
Protein Sources: Diet and Food System Aspects
For people who do not eat meat (a vegetarian diet) or who avoid all animal-based foods (vegan diets), the full complement of amino acids are accessed by eating milk and egg products or by eating a diversity of plant-based foods with proteins such as whole grains, nuts, and legumes. Legumes are particularly protein-dense and important in addressing the lack of amino acids in other plant-based foods. The combination of rice and beans is an oft-cited example of the complementarity of amino acids for a complete amino acid profile. Eating a wide range of plant-based foods is an excellent strategy to access the full complement of essential amino acids, as well as the diversity of mineral, vitamin, and fiber needs discussed on the next pages. Many of the most problematic diets are those that are highly monotonous due to poverty and/or inadequate knowledge about diet, with an excess or a sole dependence on a single starch source without legumes or animal products, or overconsumption of processed foods in comparison to fresh plant and whole-grain foods. Where only a single grain is eaten, deficiencies of certain amino acids can result.
[1] These are phenylalanine, tryptophan, methionine, lysine, leucine, isoleucine, valine, and threonine, which you can find in many introductory nutrition texts or resources online, if further interested. A ninth amino acid, histidine, is important in child growth and may also be vital to tissue repair, while another, arginine is essential for some growth stages and can usually be synthesized by healthy adults.
Vitamins and Minerals: Growth, Illness Prevention, and Proper Function
Vitamins and Minerals: Growth, Illness Prevention, and Proper Function
In addition to the daily requirements for energy and protein, vitamins and minerals are required in relatively small amounts as part of a proper diet to ensure proper functioning and health and are especially important for childhood development. Vitamins and minerals deficiencies can lead to “hidden hunger”, where energy and protein needs are being met but the lack of vitamins and minerals prevents adequate development and health of child rent and saps the productive capacity of adults, for example via iron-deficiency anemia (see below). There are a large number of essential vitamin and mineral components in foods. In this module, we focus on a few that frequently pose major challenges within food systems. If you are interested, full details on the roles of many nutrients can be found in the excellent online text from the Food and Agriculture Organization (FAO) of the United Nations, Human Nutrition in the Developing World [41]. This module's formative assessment may also point to other vitamins and minerals that can become deficient in diets.
Calcium
Although it is important for other functions, calcium is emblematic in its role in proper bone growth and maintenance. It is especially important for women to consume adequate calcium throughout life, and higher intakes of calcium from childhood on are associated with lower rates of osteoporosis and stronger bones later in life. Vitamin D is also essential for the proper absorption of calcium so that a vitamin D deficiency can lead to calcium deficiency. Dairy products and small fish that are consumed whole (so that fine bones are eaten) are highly calcium-dense foods around the world. Grains are low in calcium but are consumed in such volumes that they often contribute substantial calcium to diets. As is true for many other nutrients, women who are breastfeeding a child have an especially high calcium need because they export calcium in their breast milk to help grow the bones of a developing infant.
Iron
Iron is most important as an ingredient in hemoglobin that causes the red color of blood, and the role of red blood cells in carrying oxygen. Iron deficiency thus leads to anemia from a lack of red blood cells, including shortness of breath and overall weakness. Women require more iron than men because of blood loss in menstruation, and pregnant and lactating women require especially high amounts of iron as they expand their blood supply and provide for a growing fetus. During lactation or breastfeeding, mothers pass substantial amounts of iron to their growing infants, so that iron need for women is also high during the period when mothers are nursing their children. When shortage arises during pregnancy or lactation, a woman’s iron stores tend to be sacrificed to the benefit of the child, which can leave a mother who lacks adequate food due to poverty with acute iron deficiency and anemia that greatly complicates other daily activities such as economically important work. The best sources of iron in foods are meat, fish, eggs, green leafy vegetables, and whole grains. Cooking food cast iron utensils is also an easy way to supplement iron in food.
Zinc
Zinc is an essential mineral that is important in a large number of human cellular enzyme processes. It is important for proper tissue growth, cell division, wound healing, and the functioning of the immune system, among other functions. As such it is very important for children’s health, growth, and development. Zinc is an example of a nutrient that is often used to fortify processed foods and is also naturally present in a wide variety of foods such as red meat, poultry, beans, nuts, and whole grains. One goal of plant breeders recently has been to breed or identify traditional varieties of whole grains and potatoes that are high in zinc and iron. This way of enhancing diets by way of the properties of crop plants is called a biofortification strategy. Because these staple foods are usually present even in the most rudimentary diets associated with extreme poverty, biofortification can be an effective strategy to ease access to these important mineral nutrients in the most vulnerable populations.
Vitamin A
Vitamin A or retinol (linked to the word ‘retina’ or part of the eye) is famous for the popularized connection between eating carrots and good eyesight. Vitamin A deficiency is the cause of reduced vision in dim light, called night blindness, as well as a broad correlation to increased infant mortality in children from a variety of causes. True vitamin A is not in fact directly present in carrots and other dark green or pigmented vegetables (collards, squash, sweet potatoes, tomatoes, and even yellow maize) but is readily synthesized in the body from the orange pigment (beta-carotene) that these plant sources contain. True retinol is found in eggs as well as meat and fish products. Like zinc, vitamin A is another crucial nutrient for growth and development that can become deficient in the diets of children and other vulnerable groups (Figure 3.1.2), and has been targeted as a priority for resource-poor populations around the world through the promotion of orange-fleshed sweet potato, other orange vegetables, and yellow maize within smallholder diets and "golden rice" as a genetically engineered innovation in maize varieties that was developed to address vitamin A deficiency. While not all biofortification approaches utilize genetic engineering, golden rice is a further example of a biofortification strategy.
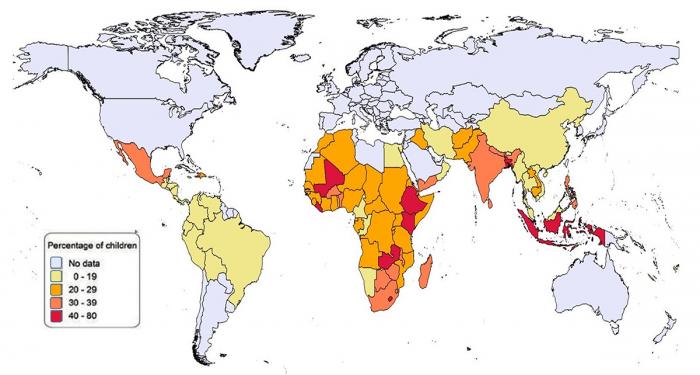
Vitamin C
Vitamin C is not a major deficiency challenge worldwide, though in the 1700s vitamin C deficiency was linked to the disorder scurvy in sailors due to highly monotonous diets. Rather it is presented here because of its iconic association with fresh fruits and vegetables, especially citrus fruit but also potatoes, bananas, spinach, collards, cabbage, and many of the weeds that are consumed around the world as leafy vegetables. True deficiency is thus uncommon in most diets around the world, though vitamin C’s role as an antioxidant and health-promoting vitamin that “cleans up” harmful free radicals in the body has been promoted. Also, vitamin C is an excellent example of a positive interaction between nutrients. Vitamin C promotes iron absorption. Since most plant sources of iron are much less available than so-called heme iron in animal iron sources, fruits and vegetables with vitamin C in the same meal with plant-based sources of iron are an excellent way for people that eat meat-free diets (or just individual meals without meat) to absorb sufficient iron.
A number of other vitamins and minerals are essential, and in general, the way that a food system can work to provide these to human populations is to make a wide variety of plant-based foods as well as a few meat options, available to consumers. As we will see soon, this is in contrast to what certain sectors of the food system often make available to consumers. Some of these important vitamins and minerals are Vitamin C, Vitamin D, the B-complex vitamins, potassium, and magnesium, and you may see these arise as concerns in the formative assessment below.
A complete description of vitamins, minerals, and other diet components in an accessible format can be found in the online book from the FAO, Human Nutrition in the Developing World [41].
High-Quality Fats and Shifting Paradigms Around Fat in Diets
High-Quality Fats and Shifting Paradigms Around Fat in Diets
You may be familiar with the idea that fats are perhaps "delicious yet harmful" for most humans, and to be consumed in moderation (see the balanced plate in figure 3.1.1). Recently there has been increased attention focused on the role that “good fats” play in health and development, in addition to the awareness that most diets in more affluent areas of the world contain excessive fat, especially saturated fats of animal origin. Unsaturated fatty acids of plant origin are generally considered essential healthy nutrients, and there is evidence that fatty acids derived from plant sources and fish are important in promoting better neural development and nerve function. For consumers that tend to face food-insecure conditions, also, fats are a highly concentrated energy (calorie) source and therefore a valuable addition to a diet. Where calories are already in excess such as in many urban diets around the world and particularly in the industrialized first world, the calorie content is not a benefit of high-fat diets. Recently it has been found that excessively processed or hydrogenated fats often included in processed foods (trans-fats) are harmful to health, and so labeling now specifies the trans-fat content of foods. For example, you can find the trans-fat content of diets in the diet tool used with this module's formative assessment.
Fat in foods as a case study of shifting paradigms in nutrition
(this section is adapted from a contribution by Human Geographer Mark Blumler at Binghamton University)
Most of us have probably absorbed the current overall thinking that fat in diets needs to be treated with caution, that it is synonymous with "divine" or "sinful" food in a joking way, or perhaps that there is something suspect about fat. Because of evolving in limited nutrition environments, most humans are primed to take in fats and other high-calorie foods as a nutritional bonanza and store it away in an evolutionarily "thrifty" way to confront future calorie shortage. However, western nutrition scientists’ beliefs regarding different types of fat in diets have undergone drastic fluctuations over the past century (Table 3.1) that may potentially shake our confidence in exactly what is known about "good" and "bad" in nutritional terms. The advice coming out of the nutritional science community, as filtered through government proclamations such as the food pyramid, have also caused enormous changes in the American diet, which have benefited some such as the vegetable oil processing industry, while hurting others such as cattle ranchers and the beef lobby.
To recap this sometimes bewildering history: around the 1960s, scientists discovered a relationship between cholesterol and cardiovascular disease and noticed that saturated fats have more cholesterol than other oils. Consequently, there was a big push to replace butter with margarine and to cut back on the consumption of red meats, lard, and other animal fats. Initially, it was believed that polyunsaturated fats such as safflower oil are most heart-healthy and so there was a major promotion of such oils. Later, interest developed in the “Mediterranean diet” because of the presence of many very old people in Mediterranean Europe, and nutritionists came to believe that monounsaturated fats such as in olive oil were best for us. Polyunsaturated oils, on the other hand, were increasingly shown to be not beneficial. Meanwhile, further research showed that cholesterol in the blood does not correlate with cholesterol in the diet, undermining the assumption that saturated fats are unhealthy. Trans fats, high in margarine and other processed fatty foods, were shown to be very inimical to heart health. Also, fish oils were recognized as being high in omega 3 fatty acids, which are deficient in the typical American diet today. Recently, butter has been officially accepted as “good” fat, reversing a half-century of denigration of its nutritional value. While other saturated fats are not yet accepted, there is nothing to distinguish butter from the others that would explain how it could be “good” and the others “bad”.
| Fat | 1900 | 1960 | 1970 | 1980 | 2000 | 2015 |
|---|---|---|---|---|---|---|
| Butter | Good | Bad | Bad | Bad | Bad | Good |
| Egg Yolks | Good | OK | Bad | Bad | Bad | OK? |
| Lard | Good | bad | Bad | Bad | Bad | Bad? |
| Fish oil | Good | Good | Bad? | OK? | Very Good | Very Good |
| Coconut oil | Good | Good | Bad | OK? | OK? | Good? |
| Olive oil | Good | Good | OK | Best | Best | Good |
| Safflower oil | OK? | Good | Best | Good | OK | ??? |
| Margarine | - | Good | Good | Bad | Bad | Bad |
It is interesting to compare these shifting attitudes against traditional diets: The Japanese have the longest life span of any nation. Within Japan, the longest-lived are Okinawans. On Okinawa the only fat used for cooking is lard (of course, being on an island Okinawans also consume considerable fish oil although they do not cook with it). So, what is going on here? Why can science and scientists not "make up their minds" about fat in diets? Are findings on diet overly influenced by lobbying groups of major food industries, as some have charged for the case of margarine or dairy fats?
The story of fat recommendations illustrates the nature of science, that it proceeds piece by piece, and also seems to have a penchant for identifying single causes that are later shown in the context of a complex system to be overly simplistic. Each research finding, such as that cholesterol is associated with cardiovascular disease, may have been correct. But that gave rise to recommendations that were wrong, because other facts, such as that dietary cholesterol does not correlate with blood cholesterol, were not yet known. Given that many of us would like to eat healthy diets and may also believe that science should guide better nutritional policy, there is a need for principles that emerge from current science to inform dietary recommendations, rather than the confusion that is perhaps caused by this tangled story about the history fats in nutrition. In the summary below, we try to provide some ballpark recommendations regarding fats, other dietary constituents, and lifestyle choices. They summarize many of the same principles from the "balanced plate" at the beginning of this module or the "healthy plate" from the USDA and other nutritional recommendations of government organizations.
Summary: Fat consumption within a healthy diet and lifestyle
- Diets very high in fat in the absence of fiber and sufficient fruits, vegetables, and whole grains are probably not very healthy within the range of choices of modern consumers.
- Eliminating fats in favor of simple (i.e. non-whole grain) carbohydrates to promote "low-fat dieting approaches" was probably a bad idea.
- Plant-based fats and fish oils, on the whole, seem to contain more health-promoting properties than exclusive reliance on animal-based fat. However, some recent large studies have shown little significant correlation between saturated fat consumption (like those found in meats) and chronic diseases like heart disease, although these diseases are definitely thought of as diet-linked.
- Whole grains of many different types are good, as is a preponderance of fruits and vegetables in the diet.
- Much of this seems to be leading us back towards the principles of more traditional unprocessed food diets without a preponderance of meat (which has benefits for the water use related to a diet as well, as you will see next in module 4 regarding water and food).
- Lifestyles should encompass diet and exercise, but this exercise does not need to be high-intensity for it to have a really positive effect on well-being and health.
- Pay attention to upcoming research and advice from research communities regarding diet, but resist taking them to extremes unless there is robust evidence over the long term, and place them in the context of more traditional knowledge and the other principles we've addressed in this module.
Dietary Fiber and Microbes in the Human Gut
Dietary Fiber and Microbes in the Human Gut
The Importance of Fiber Overall and for the Gut Microbiome
In addition to these nutrients that contribute to particular functions within the human body, fiber is the mostly undigestible component of food that moves through the human digestive tract but also provides remarkable benefits. Undigestible cell wall components of plant foods (fruit membranes, bean and grain seed hulls, most of the plant cell wall, etc.) are examples of dietary fiber. In addition to its famous role in avoiding constipation by moving masses of foodstuffs through the digestive tract as a bulking agent, fiber helps to feed beneficial gut bacteria that produce beneficial substances. Over the last few decades fiber consumption associated with the benefits of avoiding certain cancers, heart disease, and diabetes. Emerging knowledge regarding fiber highlights the role played by the gut microbiome --many billions of non-human cells that inhabit our digestive tract in promoting human health and avoiding disease. These cells are more in number than the human cells in our body, due to the small size of bacteria compared to human cells. Much like the other areas of nutrition described here, the importance of fiber links directly to the importance of eating a varied diet with whole grains, legumes, fruits, and vegetables. It is interesting to view fiber and these microbes not as a direct nutrient for human life processes, but as a "helper nutrient" or "catalyst" for human nutrition. Dietary fiber is relatively inert as a source of protein, minerals, or vitamins, but helps our digestive system do its job.
Optional Reading
For more on the role of fiber and nutrition generally in an accessible format, you can see the following page: "Dietary Fibre" [42] from the British Nutrition Foundation.
Formative Assessment: Using a Diet Assessment Tool
Formative Assessment: Using a Diet Assessment Tool
Instructions
In this assessment, you will use an online diet assessment tool to test how different foods contribute to the total nutrients in a daily diet. You will follow along in the instruction sheet, and log the nutrient content (e.g. calories, total fat, vitamin C) for each diet option in an excel spreadsheet, to be able to compare the diets.
Download both the instructions and worksheet [43] (word doc) and the excel spreadsheet [44] for logging the results. The spreadsheet has color-coding of cells to transform the data you log into a color that indicates deficiency or sufficiency, which will help you to interpret the result.
We will use the tool My Food Record [45] for this assessment. Important: you should use the "one-day analysis" under the "analyze" tab so that you do not have to create an account and can just log in as a guest. You should open this online nutrition assessment tool in an adjoining window or a different browser so you can see the instructions for the assessment and the online tool at the same time.
Submitting Your Assignment
Please submit your assignment in Module 3 Formative Assessment in Canvas.
Module 3.2: Food System Issues for Nutrition
Module 3.2: Food System Issues for Nutrition
Introduction
In module 3.2., we will incorporate some of the basic information about healthy diets presented above in module 3.1 with the exploration of food systems that you have made throughout the course. In particular, we want to highlight (1) the challenges of malnutrition and low food access for impoverished populations around the world, which can represent a failure of adaptive capacity of human societies to providing a socially sustainable future; (2) the phenomena of low food access for marginalized areas of the "developed world", which can take the form of what are called ‘food deserts’ without easily accessible healthy foods; (3) The rise of so-called chronic and nutrition-related ‘diseases of affluence’ related to caloric overconsumption (which in fact also affect poor, urban populations worldwide as well). We also will examine the potential food-system responses to these challenges, and how different food system types contribute to these challenges and their solutions.
Malnutrition (Undernutrition) Among Poor and Vulnerable Populations
Malnutrition (Undernutrition) Among Poor and Vulnerable Populations
Food insecurity, or the inability to access sufficient, culturally appropriate food for adequate nutrition, is a major problem for the poorest segments of the world’s population, the 1 billion or so people who live on less than two dollars per day (Food Security and Insecurity are more fully addressed in module 11). These poorest members of society often face chronic malnutrition, which some call undernutrition to distinguish it from nutrition diseases of overconsumption or poor food choices, which are considered malnutrition of a different type. Undernutrition is sometimes coupled with nutrition-related illnesses and long work hours in paid employment or smallholder agriculture on small and/or degraded land bases that often accompany poorer farms in rural areas. Undernutrition represents a failure of human societies and food systems to create access to a minimum standard of diet quality that can allow all human beings to live to their potential. In addition, the difficulty posed by undernutrition may fall disproportionately on the most vulnerable members of society: women, children, and the disabled and elderly. A particular burden is faced by caregivers of children (women, and increasingly grandparents) to both provide adequate care and feeding and take on the role of earning money to farm or buy food.
Organizations who work with these populations have worked to identify barriers to better care and feeding practices because it has been recognized that if the allocation of food within households is not equitable, simply increasing farm production or access to food can sometimes fail to increase consumption of healthy foods by vulnerable groups in households. Increasing the direct involvement and knowledge of parents and other caregivers in nutrition practices, and focusing attention on children under five years of age can help to improve nutrition outcomes and child growth in many poor households. These aspects of care, feeding, nutrition, and harmonization with local culture are important parts of food security referred to as the utilization component (this will be further addressed in module 11.2). As an example of the sort of trade-off that can occur between agricultural and nutrition goals in improving livelihoods, agricultural methods that are introduced to improve soil quality or increase agricultural income can be labor-intensive and must take care not to place undue additional time burdens on caregivers, who may then neglect the care and nutrition needs of children.
The challenges of chronic malnutrition are often linked in rural food-producing households to small land bases and/or degraded soils, which is of concern to us because it is a highly problematic case that links human system factors in the form of poverty, and natural system factors in the form of the degradation of earth's ecosystems. As will be described further in module 10.2, the coupling of malnutrition and soil degradation can form a ‘poverty trap’ for rural households, where unproductive soils demand large amounts of labor for small yields, with limited alternative options for food production or employment because of inequality -- or lack of social sustainability -- in the local and global human system. In this way, degraded soils have particular bearing on malnutrition because of the additional work and expenditure of calories required to coax yields from degraded land, which both deepens issues of food deficit and malnutrition, and can translate to expansion of the land area under degrading practices, or contribute to continued production at the lowest level that soil will allow. These factors can trap households in poverty. Such a situation can also translate into the migration of a smallholder household in search of more lucrative activities, which often means a dramatic change in diet towards more urban and processed foods, even if it changes the overall income possibilities of a family and can be considered as an adaptive response to food shortage and vulnerability.
“Diseases of Affluence”: Not Just for the Affluent
“Diseases of Affluence”: Not Just for the Affluent
A second major issue facing modern food systems is chronic diet-related disease that results from calorie overconsumption, often linked to increasing rates of obesity in societies around the world. The major chronic conditions related to calorie overconsumption are heart disease and type II or “old-age” (later onset) diabetes (see Fig. 3.2.1 for a global map of diabetes incidence). These have been called “diseases of affluence” because they tend to increase in prevalence as countries increase in material wealth, with a combined increase in meat and calorie availability along with more sedentary jobs and lifestyles.
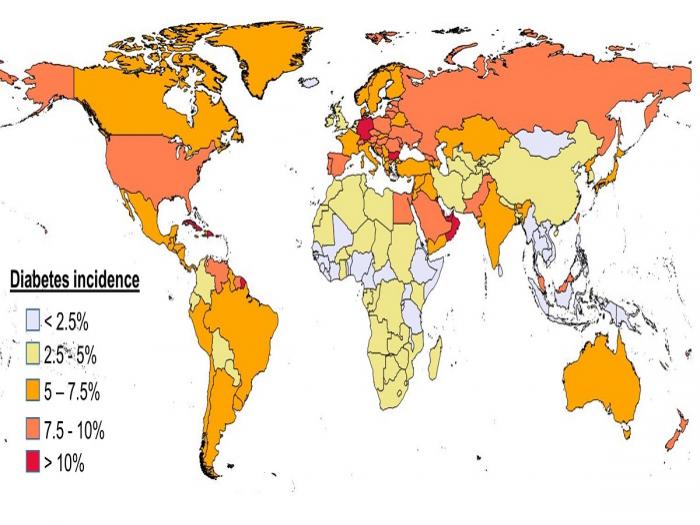
The dominant role of the globalized, corporate food system in these societies (see module 10.1 for the typology of food systems) means that processed foods (e.g. mass-produced “non-food” snacks and sweetened beverages, prepared frozen meals, fast food, pasta) occupy a larger and large part of the diet of typical consumers in these societies. To save cost and maintain demand, processed fats, sugar, and salt, are used as low-cost ingredients in these foods (e.g. corn syrup, oil by-product from the cattle and cotton industries) As has been described by food writers such as Michael Pollan, the prevalence of these diet choices means that consumers eat a large proportion of “empty calories” without fiber, high-quality fats, sufficient vitamins, and minerals, or in some cases adequate protein. Although high-calorie and fatty restaurant foods have been common for generations, at a whole food system level the prevalence of these foods, and the way they have been normalized in such concepts as “the American diet” (which upwardly mobile consumers in many other countries aspire to) are of great concern because they provide a dominant range of food choices that are not consistent with human health. This is especially so as consumers become more urban and many (though not all) expend fewer calories in manual labor related to farming. The increased prevalence of calorie excess has produced increasing rates of obesity in North America and Europe. (Fig. 3.2.2 below)

The “double burden”: chronic diseases in poor economies: Moreover, the term “diseases of affluence” is misleading because it is, in fact, poor people in industrialized countries as well as the developing world that face the greatest impact of these diseases. Empty calories are often very cheap calories for poorer sectors around the world, so the consumption of processed or dominantly carbohydrate diets with insufficient whole grains, fruits, and vegetables is more common among the poor. In addition, poorer households often are less able to pay for the expensive consequences of these diseases in the middle-aged and elderly (e.g. insulin provision for diabetics, the consequences of heart attack and stroke in the elderly). Ironically the same poorer sectors in poorer parts of the world and even within the United States can simultaneously face the issues of “traditional malnutrition” (i.e undernutrition, insufficient consumption of vitamins, iron, zinc, calories), especially among children and women, as well as diseases of overconsumption of empty calories. This ironic pairing of food system dysfunction has been called the “double burden” on developing countries by food policy experts. It also acts, at a national level, to reduce the overall income of a country by impairing the productivity of its human population (Figure 3.2.3, below).
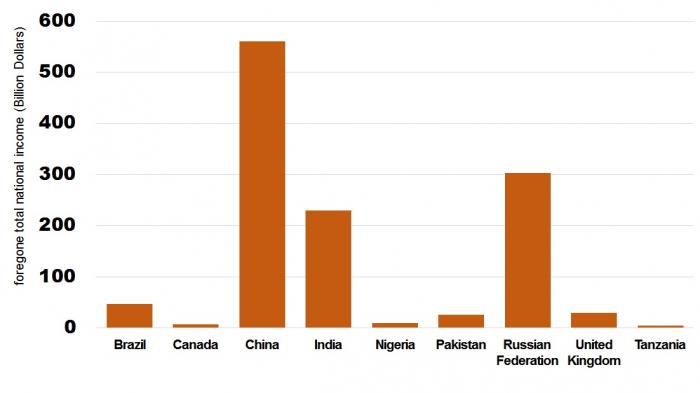
Food deserts: Within industrialized countries, food system analysts have noted that the marketing model of the globalized food system has focused on suburban supermarkets that are able to capture profits from middle and high-income consumers. This model is profitable for food distribution companies but has the effect of not adequately serving either inner-city poor populations and the rural poor, who face difficulties in physically getting to distant supermarkets. Fast food and high-priced, smaller food markets with a preponderance of processed and unhealthy foods are the only food options in many poorer parts of the United States and other industrialized countries. These areas of low food access for healthy, reasonably priced foods are called food deserts. You will explore these more with a mapping tool in the summative assessment for this module.
Optional Reading
For more information on the "double burden" around the world, you can read the online resource from the World Health Organization, " The Economic Impact of Chronic Diseases [46] "
Human System Factors in Nutrition: Challenges in the Globalized Food System
Human System Factors in Nutrition: Challenges in the Globalized Food System
Although the modern globalized food system is highly dynamic and able to move enormous quantities of food and generate economic activity at a huge scale in response to global demand, the issues of poor diets, malnutrition and constrained food access we have described here are sobering issues that human societies need to confront. From the earliest days of civilization, food has been at once (1) a fundamental human requirement and human right; (2)a source of livelihood and a business as well as (3) the common property of cultures and ethnicities. The rise of a globalized food system, however, has brought new patterns into play because food has become an increasingly fiscalized commodity and experience.“Fiscalized” means that the provision of a fast food item, a food service delivery to a restaurant, or a supermarket buying experience (vs. a traditional regional open-air market, for example) are increasingly not only interactions among farmers, truckers, shopkeepers, and consuming households. Instead, the activities of production, distribution, and consumption within food systems become more and more integrated into the trade and investment patterns of the global economy. Food production, trade, and sales have been absorbed into the purview of profit-driven corporations that seek maximum value for stockholders. These stockholders are in turn citizens, organizations, and even governments that also participate by profiting from the functioning of the global system, demonstrating the involvement of common citizens in this system as well. Food activists, policymakers, and advocates of concepts like “agriculture of the middle” (see module 10.1) have argued that this new corporate character of the food system increasingly creates a food system that has an incentive to ignore important values like food access equity, just treatment of producers and workers, healthy diets, and environmental sustainability as the elements of the three "legs" of sustainability (see Module 1). However, reform movements within the globalized food system also demonstrate that it is able to pay attention to human nutrition goals and environmental sustainability.
In fact, the food system is not a completely unfettered capitalist enterprise.& Examining any food packaging shows the degree to which food is subject to regulation and oversight by the government. Food safety scares and health inspections of restaurants show the close attention paid to the acute impact (if not always the chronic impact over time) of unhealthy food. Education efforts promoting healthy choices in diet and exercise are regularly heard from both government organizations and private advocacy organizations: for example, state cooperative extension agencies, universities, and public service announcements. The efforts to label calories on restaurant menus and the movement of food service companies and local restaurants towards healthy options in menus show the growing awareness and movement of food demand towards healthy options. And many supermarket chains are making substantial efforts to include more local and regionally produced foods and promote healthy diets and nutrition as part of the communication to consumers.
In part, these changes show the changing awareness of the problems in the modern “American diet” among the public, brought on by food activists and authors about the food system. And on-the-ground marketing initiatives for values-based value chains such as those promoted by local and regional food system advocates include improving access to healthier foods like whole grains, fruits, and vegetables. For middle- and higher-income consumers with access to the abundance of foods in typical supermarkets and farmer’s markets around the world, this can incentivize better choices about well-rounded diets. In many cases, these healthier diets also include less reliance on meat because of its water footprint and adverse impacts on health when eaten in excess. One essential question, however, is how these efforts to improve food choices and access can expand their reach to poorer consumers and those who live in food deserts, either by improving geographic access, low-cost alternatives, or income opportunities to these consumers. You’ll explore this question of food equity more in the summative assessment for this module, regarding food deserts and examples of organizations in your capstone regions that are promoting healthy food choices and production.
Optional Reading/Video for Capstone Project
The capstone project, which is introduced at this time in the course and requires you to begin thinking about the food system of a particular focus region, is an opportunity to think about food access and nutrition in your example region. As part of this project, you may want to see some examples of how local governments and organizations of citizens are promoting healthier diets. This may help you to propose similar strategies for food systems. One example you may look into is the website for the Toronto Food Strategy [47] (a part of the municipal government of Toronto, Canada) and the way that their activities are coordinated with the Toronto Food Policy Council [48] (a volunteer study/action and advocacy organization). Many states, counties, and cities in the United States have organizations and government efforts similar to these examples.
Local and Alternative/ Organic Foods and Food System Challenges
Local and Alternative/ Organic Foods and Food System Challenges
At the end of module 2, you read about alternative food systems and the relocalization of food production and distribution as one of the emerging future proposals in the history of food. These efforts, which will be revisited in a typology of current food systems in module 10, are an important source of ideas and initiatives to increase sustainable food production methods and equitable relations between consumers and producers. Local and regional food systems and initiatives have been promoted as ways to retain economic benefits and jobs within regional contexts. Organic and sustainable production methods often form a part of these movements and seek to reduce the environmental impacts of food production. Organic food is, in fact, a documented way to reduce exposure to pesticide residues in foods, which is of concern to many consumers. Food such as fruits and vegetables, which is fresher when it is consumed, which can be the case for locally produced food, is also likely to have a greater content of vitamins and other health-promoting components. However, others have pointed out that at a global level, the optimal freshness of produce, or a complete absence of pesticides, can be of smaller benefit to health in the overall food supply than would be, say, orienting diets away from processed fats or towards greater vegetable consumption or plant-based oils. This more incremental approach suggests that it is important to target low-hanging fruit like availability of lower-cost vegetables and higher-fiber diets to more of the worlds' population, rather than just playing up potential benefits from foods that are local or produced with fewer or no pesticides. It is also important to point out that there can be much confusion among consumers on whether all organic food is locally produced (it's not) or whether local food is always organically produced (also not true).
In summary, given the much smaller size of these local and alternative food initiatives in comparison to the global food system, and also the scale of the problems of malnutrition and unhealthy diets, it may be important to put potential benefits of local and/or organically produced foods in the context of the overall challenges of the food system. For example, in the case of an urban food desert where only low dietary quality processed foods are available, increasing the availability of vegetables, fruits, and whole grains consumed using a number of strategies may be a more viable food system strategy to pursue than promoting locally or organically produced foods as a sole strategy. These multiple strategies could, in fact, rely on greater supermarket access and food streams from the globalized food system along with seasonal access to farmers' markets for local produce. Home and community gardens can also complement and reinforce strategies for healthy eating. In addition, organizations of farmers using organic and other more sustainable methods have often acted as important allies in local food system settings for promoting healthier diets. As we will see throughout this course, the nutrition and sustainability outcomes emerging from the interacting parts of the food system are complex, and we can't always go with a single alternative to provide the best outcomes.
Required Video: Putting local alternative food systems in context
Please view this short video from the "Feeding the nine billion" project of Professor Evan Fraser at the University of Guelph. He argues for the importance of local, alternative food systems but also acknowledges the issues of scale that make global food systems an important aspect of diet and nutrition for the foreseeable future. This is not just about nutrition -- he is also reviewing many of the themes of food and sustainability we will be covering in the course and the relationships between human and natural systems as part of feeding humanity.
Video: Feeding Nine Billion Video 5: Local Food Systems by Dr. Evan Fraser (5:19)
Hello, my name is Evan Fraser and I work at the University of Guelph in Ontario, Canada. This video series shows that climate change, population growth, and high energy prices mean that farmers may struggle to produce enough food for all of humanity over the next generation. This video looks at how strong local food systems can help us overcome this problem. Many argue that because modern farms use a lot of energy and cause a lot of pollution, our food systems will prove unable to meet the rising demands of the global population.
These arguments go like this. Today a handful of large corporations control the vast majority of the world's food trade. In doing so, they make a huge amount of money by using farming systems that damage the environment, exploit workers, and displace traditional farmers. By contrast, food systems based on local, diverse, and small farms that use few chemical inputs like pesticides or fertilizers, are more sustainable, equitable, and democratic. This is because when producers and consumers know each other and interact, then the entire community has a say in how food is produced. This should mean that farmers receive a decent income since they will receive a higher percentage of the value of the food they produce. And they should also protect the environment better because consumers will be okay with paying more for food they know isn't covered with polluting sprays. Also, because food is produced and consumed in the same region, the amount of fossil fuels burned for transportation should go down. Goodbye processed cheese and vegetables from the southern hemisphere. And hello locally produced seasonal dishes.
Those of us in the rich parts of the world probably associate these ideas with the 100-mile diet. In the developing world, these ideas are often described as food sovereignty and are promoted by La Via Campesina, an international movement advocating that consumers and small-scale producers work together to take control of their food. Many, however, question whether this vision of alternative food systems can provide a viable food security strategy for humanity's growing population. For instance, while there is a huge disagreement among scientists, many point out that farms using alternative methods tend to have lower yields when compared with conventional farms. This means that many scientists worry that if we're going to feed a growing population using the alternative farming practices promoted by the local food movement, we’ll either need more farmland or we'll have to find ways of cutting down on our consumption and waste.
A second common criticism leveled against the promoters of alternative food systems is that whenever alternative farms try to grow bigger, they end up looking just like conventional farms. But do these criticisms mean alternative local food systems have no place in the 21st Century? I don’t think so. Even if local alternative food systems don’t feed all of us all of the time, it doesn’t mean there is no role for such systems as a component of a secure and resilient food security strategy. Local alternative systems add diversity to our farming landscapes and diversity is very important because alternative farming practices often provide the template to help improve the design of more mainstream systems. Alternative food systems, especially in poor regions of the world, provide a buffer between consumers and the volatility of the international market, while also empowering people by giving them some control over their food.
Finally, having local farms integrated into the fabric of urban life connects city dwellers with their food, making them more aware of the ecosystems on which we all depend. They provide habitat for wildlife, they trap stormwater before it damages people’s homes, and they should be beautiful. Therefore, my own reading of the debate around alternative farming systems tells me that to be sustainable, we must support local food systems that use alternative agricultural practices. We need to do this as consumers, as well as through policy that should foster local food systems by making sure farmers have access to processing facilities and markets. But we must also realize that local and alternative won’t feed us all. We’ll be relying on conventional farming systems that produce huge amounts of food in the world’s breadbaskets for the foreseeable future, albeit with high fossil fuel inputs. So what we need is a balanced approach. Our food security will be enhanced if all of us are able to draw from both global and local systems.
If you’re interested in learning more about this and other topics on feeding 9 billion, you can check out the other videos in this series. Also, my recent book “Empires of Food”, goes into these topics in detail and you can, of course, find me on Facebook and Twitter, where I regularly post news on global food security. Finally, if there’s anything in this video that you want to follow up on, head over to www.feedingninebillion.com [49], where I’ve posted all the scripts I’ve used in these videos, along with background references, and opened up an online discussion where you can weigh in with your own thoughts on anything you’ve just heard.
The “Happy Medium” in Nutrition and Diets
The “Happy Medium” in Nutrition and Diets
By now you may be forming the correct impression that a better diet and nutrition around the world is a matter of finding a “happy medium” for consumers between food shortage on the one hand, and excessive consumption of unhealthy foods on the other hand. That is, consumers in poorer sectors and societies eat too little fruits, vegetables, high-quality fats and proteins and in the worst case even insufficient calories. Meanwhile, wealthier consumers and even some of the urban poor eat excessive quantities of low-quality calories and fats in relation to relatively sedentary lifestyles. The results are serious chronic malnutrition (undernutrition and nutrient deficiencies, specifically) at one end of the diet spectrum and chronic diseases such as heart disease and diabetes at the overconsumption end of the same spectrum. In addition, a high-meat diet and millions of acres in crops to feed beef cattle and pigs creates a water-consuming and polluting food sector of the economy to support these diets, as seen in previous modules. Therefore, increasingly there has been a movement to unite concerns about the environmental impacts of food with the problematic diet and nutrition outcomes from modern high meat and processed food diets. The reading below from food columnist Michael Pollan addresses these principles for a happy medium in diets.
Additional Reading
Michael Pollan, Unhappy Meals [50] New York Times Magazine, January 28, 2007. This reading starts with Pollan's by now somewhat famous recipe for a healthy diet: "Eat food. Not too much. Mostly Plants." and then expands on this principle.
One example of a "happy medium": the demitarian diet concept
In order to address the need for this "happy medium", a number of scientists and activists globally have enunciated the interesting principle of the demitarian diet [51]1, in which consumers commit to reducing their consumption of meat products, short of adopting vegan and vegetarian diets. The prefix demi- comes from French for “half” and reflects the principle that consumers in high-income societies and sectors need to at least halve their consumption of meats, to produce better health and environmental impacts, especially the impacts on nitrogen pollution and greenhouse gases from fossil fuels in agriculture (more on this in the following modules). The demitarian diet and its proponents are primarily focused on the environmental sustainability of first-world diets. Nevertheless, we can extend this concept to the third world to say that populations eating diets of poverty will receive benefit from increasing their intake of legumes, fish, meat, vegetables, and other high-quality nutrient sources. Populations at risk from undernutrition may see dramatic positive effects from even slight increases in consumption of these high-quality foods that are often lacking in circumstances of poverty. This is because even small quantities of meat, eggs, and other animal products along with legumes, fruits, and nuts, can be very high-density sources of protein, Iron, Zinc, Vitamin A, and high-quality fats. Because of this nutrient-density, animal protein (e.g. poultry, fish, eggs) as well as legume crops (e.g. bean, pigeon pea), vegetables (e.g. sweet potato, collards, carrots), and fruits (e.g. papaya, mango, avocado) therefore feature prominently in nutrition interventions of government and other organizations.
1 The Barsac Declaration [52] highlights the demitarian diet concept.
Summative Assessment: Food Access and Food Deserts
Summative Assessment: Food Access and Food Deserts
Food Access and "Food Deserts" in the United States and in Your Capstone Regions
The Food Access Research Atlas has been created as an online mapping tool by the Economic Research Service of the U.S. Department of Agriculture. It is available at USDA Economic Research Center: The Food Access Research Atlas [53]. The atlas has been designed to present a spatial overview of food access indicators for low-income and other census tracts using different measures of supermarket accessibility. We are focusing on food access because the ability to access a full complement of foods at reasonable prices via supermarkets and other more diverse food sales outlets is one of the main impediments to improved diet among poor households in the United States. The atlas presents an online, zoomable map that you can use to understand food access in different districts of the United States (divided by census tracts). Local and regional data can also be downloaded. When it is time to consider food access in capstone regions in Peru (capstone regions outside the United States) we will present some alternative resources below.
Instructions
First, go to Food Access Research Atlas [54] for the description of the food atlas, including the definition of a "food desert".
Please read these first few short sections in this description regarding the food atlas and pay attention to how a food desert is defined:
- Measures of food access
- Additional indicators of food access
- Data availability and updates
- Component layers for mapping tool
Now download the worksheet for the summative assessment [55] where you will see the questions for the assessment. These are also reproduced below to more easily understand the process of the assessment.
Go to the Food Access Research Atlas [53]. Read the brief overview points on the page and then click on "Enter the Map". Then work to answer the questions on the worksheet. The questions are shown here but the spaces to answer are given on the worksheet.
- What is the definition of a food desert that is used by the map (the original definition, before changes made more recently)? That is, what does the phrase “LI and LA at 1 and 10” mean? Answer in question one on the worksheet.
- Before zooming in on the atlas (link above), make sure you have the background set to ‘topo’ (not satellite imagery), and the food desert criteria set to “LI and LA at 1 and 10 (original food desert measure)” – these should be the default settings. Now, look at the food desert map of the whole U.S. Name three regions (which can include parts or all of the multiple states) that seem to have a disproportionately high incidence of food deserts. Answer in question two on the worksheet.
- Zoom in on the Philadelphia, PA metropolitan area (if needed you can use the "find a place" search box). Roughly centering Philadelphia in the view and with Woodbury Heights, NJ in the south and Elkin Park, Pa in the north—it’s ok that some areas are in New Jersey since we are thinking about a metro area and not just Philadelphia proper (see guide image below). Estimate the percentage of neighborhoods in this area with food deserts and write it on the worksheet in worksheet question three.
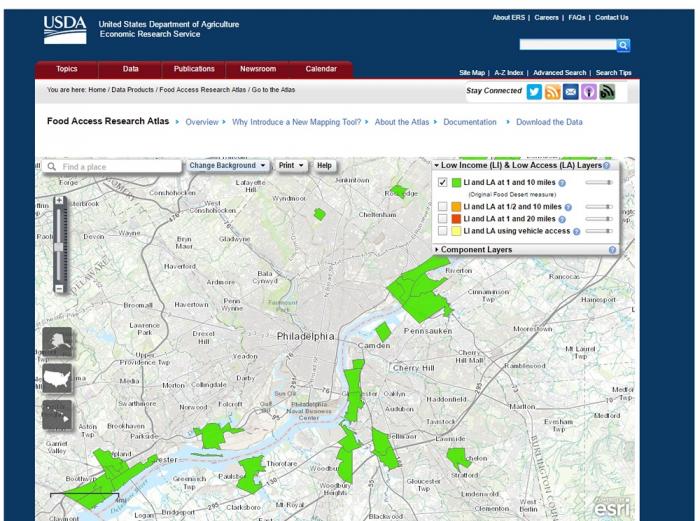 Figure 3.2.4. Map of food desert areas in Philadelphia, Pennsylvania. Note that the green layer (original food desert definition) is checked.Credit: Food Access Research Atlas [53]
 - Now zoom in on the Houston, Texas area in the mapping tool. (hint: it's on the gulf coast, west of New Orleans). Place the view with Houston centered and Spring in the North and Friendswood in the South. Consider the Houston city area at about this diameter (Spring to Friendswood) and estimate the proportion of neighborhoods with food desert status and limited food access and note it in question four on the worksheet. You should also use the slider next to the green checkbox to increase the transparency of the green layer, and then expand the section on "component layers" under the different check boxes, so that you can turn on, one by one, the layers for low access at 1 and 10 miles, and low income. Notice that each of these conditions (LI and LA at 1 and 10) is far more widespread than the green food desert layer, and it is the combination of the two that are needed to create the worst level of food access.
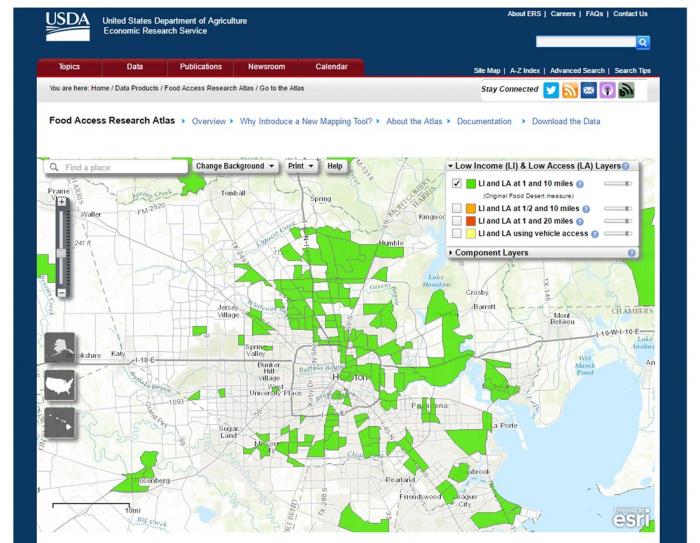 Figure 3.2.5. Map of food desert areas in Houston, Texas, for use in checking the view in the summative assessment.Credit: Food Access Research Atlas [53]
 - Which city has a higher percentage of food deserts? Can you think of some reasons why this would be the case? Answer in question five on the worksheet.
- Now read the short excerpt from pp. 104-106 in "Re-storing America's food deserts [56]", chapter 8 in Winne, M. (2008). Closing the food gap: Resetting the table in the land of plenty, about efforts to “re-store” food deserts in Philadelphia.[1]1 Note this book chapter is an excellent source for information and case studies of other efforts to fight food deserts, and some reflections about what works and doesn’t work in improving food access in the United States. Return to this assessment page to answer the rest of the questions.
- Now pretend you are on a food access advisory panel that is supposed to help develop a policy to improve food deserts in Houston. You are supposed to organize your advice in three to four main points on the problem and some steps to solve it. Your first point can be what you found from the food access atlas above, pretending that you are writing to an audience that knows little about the problem and its effects on diet and nutrition. Then suggest some solutions, based on the example of Philadelphia and the Paul Winne reading. Use the worksheet, question six.
- Listen to the first ten minutes of the following 21-minute radio clip below (this will be played for the whole class if in the hybrid class). Look for additional solution ideas for food deserts in the interview since you will be asked about new strategies additional to those from Philadelphia. "Houston Matters Radio Program: Food Deserts in Houston" [57]
- Did you learn anything more from this radio interview? Note additional strategies and ideas that came from the interview, in question seven on the worksheet.
- Now consider your focus region for the capstone project:
-
For U.S.-based capstone regions: Look at this region in the food access atlas mapping tool, and make notes about whether there are food deserts (e.g. the rough percentage, as above), whether these are in urban or rural areas, and ideas about why these deserts might exist.
- For other global capstone regions (e.g. Peru): read the World Food Program [58], briefly describe two or three factors influencing limiting food access in the smallholder systems of your region. How do challenges to food access differ between the United States and these systems where local on-farm production is so important?
- For Northern Thailand: Go to the FAO's "Food Security and Nutrition Status in Thailand 2005-2011. [59]" Read the forward and introduction and then take a look at Chapter Three. Briefly describe two or three factors influencing food access or food security in the systems of this region. How do challenges to food access differ between the United States and these systems?
-
For other regions not listed or adequately addressed on the WFP site: find one resource that speaks to food access in your region and describe their findings and how you think they come to these conclusions via a methodology.
-
- If you do a google or other web search, can you find examples of efforts to address food deserts or improve food access in your capstone region? Name one and describe it in a few sentences in question 9.
[1] Chapter 6, Re-Storing America’s Food Deserts in Winne, M. (2008). Closing the food gap: Resetting the table in the land of plenty. Beacon Press.
Submitting Your Assignment
Please submit your assignment in Module 3 Summative Assessment in Canvas.
Grading Information and Rubric
Your assignment will be evaluated based on the following rubric. The maximum grade for the assignment is 36 points.
| Criteria | Possible points awarded |
|---|---|
| Short answer questions one through five, correct use of mapper and interpretation of the map | 10 points |
| Assessment of Houston food desert situation and sufficiently detailed suggestions drawn from reading | 10 points |
| Additional learning and new strategies are drawn from Radio Clip "Houston Matters" | 5 points |
| Description of food access in or near the capstone region | 3 points |
| Description of efforts to improve food access in capstone region | 3 points |
| Overall writing style, grammar, spelling | 5 points |
Summary and Final Tasks
Summary
We hope that Module 3 of this course has given you a good grounding in both the basic nutrition needs of human populations, problematic trends in nutrition around the world such as unhealthy diets, and the human system factors that represent major challenges for the social sustainability of food systems. In this learning, we've applied concepts (such as social sustainability and human versus natural systems within food systems) from the first two modules. We also are providing you a grounding for human nutrition to keep in mind as the course dives into the natural system factors (water, soils, crops, climate, agricultural ecosystems) in the second section of the course on Environmental Dynamics and Drivers. And lastly and very importantly, this module is designed to launch your understanding of food systems and food access in a capstone region that you will be analyzing in your capstone project so that you can propose sustainability strategies for these regions.
Reminder - Complete all of the Module 3 tasks!
You have reached the end of Module 3. Double-check the to-do list on the Module 3 Roadmap [60] to make sure you have completed all of the activities listed there before you begin Module 4.
References and Further Reading
- Millstone, E., and T. Lang. 2013. The Atlas of Food. Earthscan Publications.
- Winne, M. (2008). Closing the food gap: Resetting the table in the land of plenty. Beacon Press.
Capstone Project Stage 1 Assignment
Capstone Project Stage 1 Assignment
Modules 1-3
The diagram below summarizes the topics you will explore in Stage 1 for your region based on what we've covered in Modules 1, 2, and 3. For Stage 1, you will do your data collection on your own, and submit a PowerPoint and your completed worksheet electronically via Canvas.
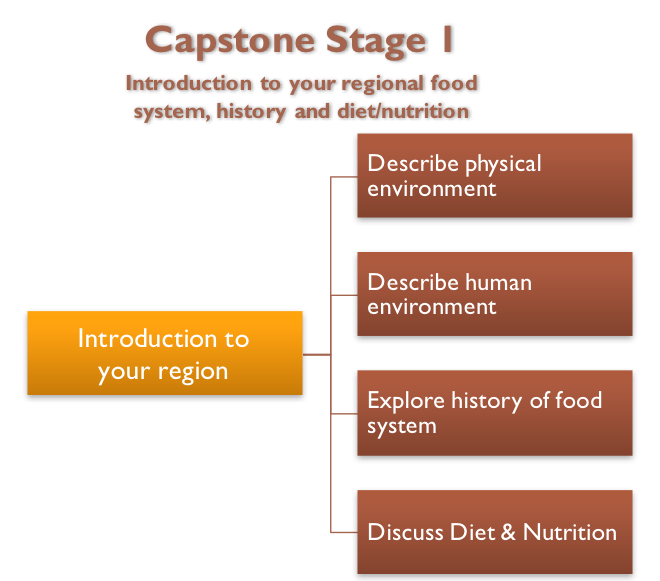
This diagram outlines the requirements for Capstone Stage 1, Introduction to your regional food system, history and diet/nutrition, as follows:
Introduction to your region
- Describe physical environment
- Describe human environment
- Explore the history of food system
- Discuss Diet & Nutrition
What to do for Stage 1?
- Confirm with your instructor which region you will be studying.
- Make a CHNS diagram similar to the one included in this worksheet based on the information you’re gathering about your region. At each capstone stage, you will be able to remake it, add more to it, and/or refine it.
- Complete the worksheet below that contains a table summarizing the data you’ll need to collect to complete this stage. There are questions in the left column, and space to answer them in the right column. It’s very important that you cite the source of each piece of information that you type into the right column with an in-text citation and a list full end citation at the end of the document. Please include at least 3 peer-reviewed academic sources.
- You need to think deeply about each response and write responses that reflect the depth of your thought as informed by your research. Do not just write one-word answers.
- Include questions that you have about your region related to the key course topics covered so far in the Stage 1 worksheet. Be sure to include in this document a record of your efforts to answer the questions so far. Also, there is space at the end to paste in links to any sites you visit that you think might be helpful in the future.
- Create a PowerPoint file that you’ll use to store maps, data, graphs, photos, etc. that you collect related to your assigned region. For every piece of information that you put in your PowerPoint file, you MUST include a citation that clearly explains where that piece of information came from.
- Submit your Stage 1 PowerPoint file and worksheet per the guidance from your instructor. (see rubric below for assessment).
Downloads
Download the worksheet [61] for Capstone Project Stage 1
Capstone Project Overview: Where do you stand?
Upon completion of Stage 1, you should have started to investigate your assigned region and have added information, maps and data to your worksheets and PowerPoint file.
Upon completion of stage 1, you should have at this point:
- Confirmed which region you will study for your capstone project.
- Initiated research and data compilation in the Stages 1 table in the associated Stages 1 worksheets.
- Stage 1: Regional food setting, history of regional food systems, diet/nutrition
- Created a PowerPoint file to hold the data that you are collecting about the food system of your assigned region. Information you may have:
- Labeled map of your region
- Soil map of your region
- Precipitation map of your region
- Keep track of all of the resources and references you use. Remember to include at least 3 peer-reviewed academic sources.
- Compiled an initial list of questions you have about your region related to key course topics and initiated significant efforts to answer.
- Begun to create a CHNS diagram(s) for your region that illustrates the coupled human-natural systems of your food region.
| Criteria | Possible Points |
|---|---|
| Stage 1 worksheet and ppt files for region uploaded to dropbox by deadline | 5 |
| All questions in the Stage 1 worksheet answered thoughtfully with evidence of research into the region | 10 |
| PowerPoint file includes relevant images, graphs, and data for region | 10 |
| Proper citations are included for all items in worksheet and PowerPoint | 5 |
| Total Possible Points | 30 |
Section 2: Environmental Dynamics and Drivers
Section 2: Environmental Dynamics and Drivers
Overview
In the second section of the course, you will begin to explore the interaction between our human food systems and natural earth systems, including soil and water resources, and how those resources influence the selection of which crops a farmer grows. Soil and water are two key ingredients that are critical to growing food. Module 4 explores why water is necessary to grow food, where that water comes from, either precipitation or irrigation, and the impacts that our food production system has on Earth's water resources. Module 5 focuses on the other essential resource for food systems, soil, and the nutrients found in soil. In this module, you will explore how soil resources can be degraded and how soil management can help protect soils and key soil nutrients, nitrogen (N), and phosphorus (P). Module 6 is an introduction to crops. You will explore how climate, including temperature and precipitation, and soil resources influence crop plant selection, how crops are classified, and what other factors influence crop selection.
At the end of this section, you'll explore each of these topics in your capstone region in Stage 2 of the capstone assignment. Your goal at this stage is to identify the water resources available in your capstone region by looking at climate maps, to identify the quality of the soil resources and soil and nutrient management practices in your capstone region, and to explore the types of crops grown in your capstone region.
Modules
- Module 4: Food and Water
- Module 5: Soils as a key resource for food systems
- Module 6: Crops
- Capstone Stage 2
Section Goals
Upon completion of Section 2 students will be able to:
- Identify soil nutrients and soil function as key natural system factor in food production.
- Distinguish between pre-existing aspects of biogeochemical cycling and human-induced processes that affect biogeochemical cycling.
- Attribute different soil fertility outcomes in food systems to the coupled natural and human factors and feedbacks that produce them.
- Analyze the relationship between climate, availability of water resources, irrigation, and agricultural food production.
- Examine their water footprints and the virtual water embedded in agricultural food products.
- Summarize the major impacts of agriculture on both quality and quantity of water resources.
- Describe key features of categories of crop plants and how they are adapted to environmental and ecological factors.
- Explain how soil and climatic features determine what crops can be produced in a location, and how humans may alter an environment for crop production.
- Explain how both environmental and socio-economic factors contribute to crop plant selection (coupled human-nature systems).
- Outline the basic science behind human-induced climate change and the contribution from agriculture.
- Compare various potential impacts of climate change on our global and local food systems.
- Select strategies that enhance the resilience of food systems in the face of a changing climate.
Section Objectives
In order to reach these goals, we have established the following learning objectives for student learning. Upon completion of the modules within Section 2, you will be able to:
- Describe the basic properties of soil that distinguish it from mere "dirt".
- Explain how soil serves as a medium for plant growth.
- Explain how the five soil-forming factors interact to produce soils.
- Explain the term "biogeochemical cycling".
- Explain common limiting factors to plant growth that limit food production around the world.
- Explain how nutrient and carbon depletion from soils and soil erosion create conditions of low food productivity.
- Assess how farming practices affect soil fertility.
- Analyze modern fertilizer use as the emergence of a strong human system impact on and participation in natural biogeochemical cycling that addresses nutrient limitation but can create nutrient pollution.
- Analyze how natural/human system feedbacks operate to limit the actions of poorer food producers around the world.
- Incorporate sustainability challenges related to soil nutrient management into an analysis of food systems.
- Explain the relationships between evapotranspiration (ET), climate, and crop consumptive use.
- Relate the spatial distribution of precipitation and ET rates to where food can be grown with and without irrigation.
- Estimate their water consumption in the food they eat using the concepts of virtual water and water footprints.
- Attribute major water pollutants to appropriate agricultural sources.
- Describe the major impacts of agricultural diversions on the Colorado River.
- Relate nutrient loading from fertilizer use to the dead zone in the Gulf of Mexico.
- Define annual and perennial crops and list some examples of annual and perennial crops.
- Discuss why annual or perennial crops are cultivated in high resource or resource-limited environments.
- Explain some ways that farmers alter the environment to produce annual or perennial crops.
- Explain some of the advantages and disadvantages of producing annual and perennial crops.
- Name some major crop plant families.
- Explain the nutrient significance of legumes.
- Describe some ways that plants are classified into types including plant families, temperature adaptation, and photosynthetic pathways.
- Describe key plant physiological processes and how climate change may influence crop plant growth and yield.
- Describe some of the major agricultural crops and the agroecological (both ecological and socioeconomic) factors that influence what crops farmers produce.
- Describe examples of the conflict of growing food crops for food versus biofuel.
- Identify climate variables that affect agriculture.
- Explain possible climate change impacts on crops.
- Summarize the mechanisms of human-induced climate change.
- Explain the role of food systems in contributing to climate change.
- Discuss how climate change impacts food production and yield.
- Evaluate how farmers adapt to climate change.
- Differentiate impacts of climate change on climate variables in different regions.
Module 4: Food and Water
Module 4: Food and Water
Introduction
Water is an essential element in growing the food we eat. Also, the growing of our food has an effect on Earth's water resources as agricultural runoff contributes to pollution, and diversions for irrigation affect streamflow and deplete aquifers. In this module, we'll look at how water is a critical element in the production of food. We'll also explore some of the impacts that our food systems have on both the quality and quantity of our water resources.
Plants can't grow without water and in this module, we explore how plants use water and where that water comes from. Have you ever considered the fact that you eat a lot of water? All of the food you eat required water to grow, process, and transport. How much water did it take to make grow feed for the cattle that ultimately became the hamburger you had for lunch this week? Or to feed the chicken that laid the egg for your breakfast? Or to grow the coffee beans for your morning latte? Water is an essential component of our food system!
Goals and Learning Objectives
Goals and Learning Objectives
Goals
- Analyze the relationships between climate, availability of water resources, irrigation, and agricultural food production.
- Examine their water footprints and the virtual water embedded in agricultural food products.
- Summarize the major impacts of agriculture on both the quality and quantity of water resources.
Learning Objectives
After completing this module, students will be able to:
- Explain the relationships between evapotranspiration (ET), climate, and crop consumptive use.
- Describe the major impacts of agricultural diversions on the Colorado River.
- Relate the spatial distribution of precipitation and ET rates to where food can be grown with and without irrigation.
- Relate nutrient loading from fertilizer use to the dead zone in the Gulf of Mexico.
- Attribute major water pollutants to appropriate agricultural sources.
- Estimate their water consumption in the food you eat using the concepts of virtual water and water footprints.
Assignments
Module 4 Roadmap
Detailed instructions for completing assessments are provided with each module.
| Action | Assignment | Location |
|---|---|---|
| To Read |
|
|
| To Do |
|
|
Questions?
If you prefer to use email:
If you have any questions, please send them through Canvas e-mail. We will check daily to respond. If your question is one that is relevant to the entire class, we may respond to the entire class rather than individually.
If you prefer to use the discussion forums:
If you have any questions, please post them to the discussion forum in Canvas. We will check that discussion forum daily to respond. While you are there, feel free to post your own responses if you, too, are able to help out a classmate.
Module 4.1: Water Resources and Food Production
Module 4.1: Water Resources and Food Production
Introduction
How much water do you eat? Water is essential for food production. In this unit, you will learn about water as an essential ingredient to grow the food that we eat, including plants and animal products. The concepts of photosynthesis, evapotranspiration, and crop consumptive water use are introduced followed by an overview of the spatial variability of precipitation and the resulting need for irrigation. The final activity will introduce you to virtual water embedded in the food you eat and your water footprint.
The short animated video that follows was produced by the United Nations' Water group for World Water Day and illustrates how much water is embedded in a few different food products. The numbers are given in liters, so it's helpful to remember that there are 3.8 liters per gallon. A liter is a little bigger than a quart. In this module, we'll look at why it takes so much water to produce food and you'll estimate how much water you eat.
Video: All You Eat (0:49)
World water day 2012
Why is water so important to our food security?
Your bread: 650 liters
Your milk: 200 liters
Your eggs: 135 liters
Your steal: 7000 liters
Your vegetables: 13 liters
Your burger: 2400 liters
ALL YOU EAT NEEDS WATER TO GROW
Agriculture accounts for 70% of our total water use
So. Now. You. Know. Why.
By: FaowaterIf you do not see the video above, please go to YouTube [65] to watch it.
Evaporation and Climate
Evaporation and Climate
In order to understand why growing food uses so much water, we need to explore the process of evaporation. Evaporation is a hydrologic process that we're all quite familiar with, even if you aren't aware of it. Think about hanging clothes out to dry on the clothesline, or blow-drying your hair. Both of those involve the movement of water from its liquid form to its vapor or gaseous form that we call water vapor, or in other words, both involve the evaporation of water.
In what weather conditions do your clothes dry faster? A hot, dry, windy day, or a cool, cloudy, rainy day? Why do you use a blow drier to dry your hair? Water evaporates faster if the temperature is higher, the air is dry, and if there's wind. The same is true outside in the natural environment. Evaporation rates are generally higher in hot, dry, and windy climates.
The rate at which water evaporates from any surface, whether from a lake's surface or through the stomata on a plant's leaf, is influenced by climatic and weather conditions, which include the solar radiation, temperature, relative humidity, and wind (and other meteorological factors). Evaporation rates are higher at higher temperatures because as temperature increases, the amount of energy necessary for evaporation decreases. In sunny, warm weather the loss of water by evaporation is greater than in cloudy and cool weather. Humidity, or water vapor content of the air, also has an effect on evaporation. The lower the relative humidity, the drier the air, and the higher the evaporation rate. The more humid the air, the closer the air is to saturation, and less evaporation can occur. Also, warm air can “hold” a higher concentration of water vapor, so you can think of there being more room for more water vapor to be stored in warmer air than in colder air. Wind moving over a water or land surface can also carry away water vapor, essentially drying the air, which leads to increased evaporation rates. So, sunny, hot, dry, windy conditions produce higher evaporation rates. We will see that the same factors - temperature, humidity, and wind - will affect how much water plants use, which contributes to how much water we use to produce our food!
Evaporation requires a lot of energy and that energy is provided by solar radiation. The maps below (Figure 4.1.1) illustrate the spatial patterns of solar radiation and of annual evaporation rates in the United States. Notice how the amount of solar radiation available for evaporation varies across the US. Solar radiation also varies with the season and weather conditions. Note that annual evaporation rates are given in inches per year. For example, Denver, Colorado in the lake evaporation map is right on the line between the 30-40 inches and 40-50 inches per year of lake evaporation, so let's say 40 inches per year. On average, if you had a swimming pool in Denver, and you never added water and it didn't rain into your pool, the water level in your pool would drop by 40 inches in a year. Explore the maps and answer the questions below.

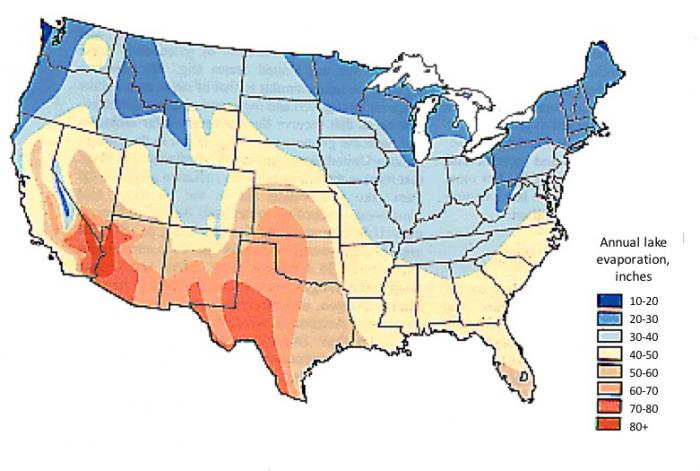
b. Mean annual lake evaporation in the conterminous United States, 1946-55. Data not available for Alaska, Hawaii, and Puerto Rico.
Water is Essential for Food Production
Water is Essential for Food Production
Why do we need so much water for agriculture? Plants use a lot of water!
Plants need water to grow! Plants are about 80-95% water and need water for multiple reasons as they grow including for photosynthesis, for cooling, and to transport minerals and nutrients from the soil and into the plant.
"We can grow food without fossil fuels, but we cannot grow food without water."
Dr. Bruce Bugbee, Utah State University
We can't grow plants, including fruits, vegetables, and grains, without water. Plants provide food for both us and for the animals we eat. So, we also can't grow cows, chickens, or pigs without water. Water is essential to growing corn as well as cows!
Agriculture is the world's greatest consumer of our water resources. Globally about 70% of human water use is for irrigation of crops. In arid regions, irrigation can comprise more than 80% of a region's water consumption.
The movement of water from the soil into a plant's roots and through the plant is driven by an evaporative process called transpiration. Transpiration is just the evaporation of water through tiny holes in a plant's leaves called stomata. Transpiration is a very important process in the growth and development of a plant.
Water is an essential input into the photosynthesis reaction (Figure 4.1.2), which converts sunlight, carbon dioxide, and water into carbohydrates that we and other animals can eat for energy. Also, as the water vapor moves out of the plant's stomata via transpiration (Figure 4.1.2), carbon dioxide can enter the plant. The transpiration of water vapor out of the open stomata allows carbon dioxide (another essential component of photosynthesis) to move into the plant. Transpiration also cools the plant and creates an upward movement of water through the plant. The figure below (Figure 4.1.2) shows the photosynthesis reaction and the movement of water out of the plant's stomata via transpiration.
As water transpires or evaporates through the plant's stomata, water is pumped up from the soil through the roots and into the plant. That water carries with it, minerals and nutrients from the soil that are essential for plant growth. We'll talk quite a bit more about nutrients later in this module and future modules.
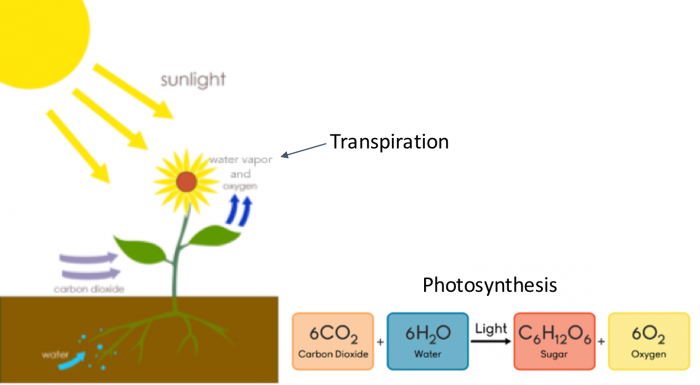
This drawing shows the sunlight shining down on a flower. The roots of the flower are in the soil and there is water in the soil. Carbon dioxide is going into the flower. Water vapor and oxygen are being released from the flower (Transpiration). The chemical formula for photosynthesis is shown as 6 CO2 (Carbon Dioxide) + 6 H2O (Water) an arrow representing light leads to C6H12O6 (Sugar) + 6 O2 (Oxygen).
Evapotranspiration and Crop Water Use
Evapotranspiration and Crop Water Use
How much water does a crop need?
The amount of water that a crop uses includes the water that is transpired by the plant and the water that is stored in the tissue of the plant from the process of photosynthesis. The water stored in the plant's tissue is a tiny fraction (<5%) of the total amount of water used by the plant. So, the water use of a crop is considered to be equal to the water transpired or evaporated by the plant.
Since a majority of the water used by the crop is the water that is transpired by the plant, we measure the water use of a plant or crop as the rate of evapotranspiration or ET, which is the process by which liquid water moves from the soil or plants to vapor form in the atmosphere. ET is comprised of two evaporative processes, as illustrated in figure 4.1.3 below: evaporation of water from soil and transpiration of water from plants' leaves. ET is an important part of the hydrologic cycle as it is the pathway by which water moves from the earth's surface into the atmosphere.
Remember, evaporation rates are affected by solar radiation, temperature, relative humidity, and the wind. ET, which includes evaporation from soils and transpiration from plants, is also evaporative, so the ET rate is also affected by solar radiation, temperature, relative humidity, and the wind. This tells us that crop water use will also be affected by solar radiation, temperature, relative humidity, and the wind! More water evaporates from plants and soils in conditions of higher air temperature, low humidity, strong solar energy, and strong wind speeds.
The transpiration portion of ET gets a little more complicated because the structure, age, and health of the plant, as well as other plant factors, can also affect the rate of transpiration. For example, desert plants are adapted to transpire at slower rates than plants adapted for more humid environments. Some desert plants keep their stomata closed during the day to reduce transpiration during the heat of a dry desert day. Plant adaptations to conserve moisture include wilting to reduce transpiration. Also, small leaves, silvery reflective leaves, and hairy leaves all reduce transpiration by reducing evaporation.
In summary, the amount of water that a crop needs is measured by the ET rate of a crop. The ET rate includes water that is transpired or evaporated through the plant. And, the ET rate varies depending on climatic conditions, plant characteristics, and soil conditions.
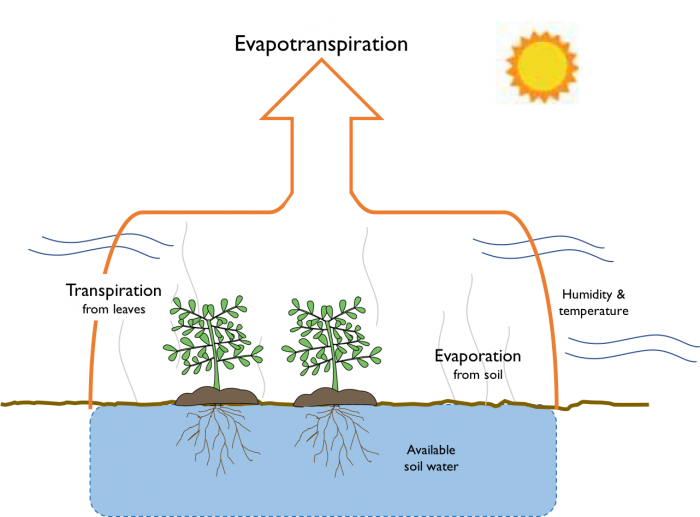
Diagram of Evapotranspiration. At the bottom is soil and below that, available soil water. In the soil are two plants with roots extending into the soil water. There are lines coming up from the soil representing evaporation from the soil. Lines from the plants represent transpiration from leaves. There is a line drawn around all of this, with the sun outside and humidity and temperature flowing in. An arrow from transpiration and evaporation leads to evapotranspiration.
Crop water use varies
If the ET rate of a crop determines the water use of that crop, we could expect water use of a single crop to vary in similar spatial patterns to evaporation rates. For example, if evaporation rates are very high in Arizona because of the hot, dry climate, you would expect ET rates to be higher for a given crop in that climate. ET is measured by the average depth of water that the crop uses, which is a function of the plant and of the weather conditions in the area. In cool, wet conditions, the plant will require less water, but under hot, dry conditions, the same plant will require more water.
Figure 4.1.4 shows a range of typical water use for crops in California. The graph shows how much water needs to be applied as irrigation to grow different crops. Notice how some crops, like alfalfa, almonds, pistachios, rice, and pasture grass can require four feet or more of water application. Other crops, like grapes, beans, and grains only require about one to two feet of water.
If we moved the plants in Figure 4.1.4 to a cooler and more humid climate, the rate of evaporation would be less and the crop water demand would decline as well. In a hot dry climate, you need to apply more water to the plant to keep it healthy and growing because more water is evaporating from both the soil and through the stomata on the plants’ leaves, so the plant is pulling more water out of the soil via its roots to replace the water transpiring from its leaves.
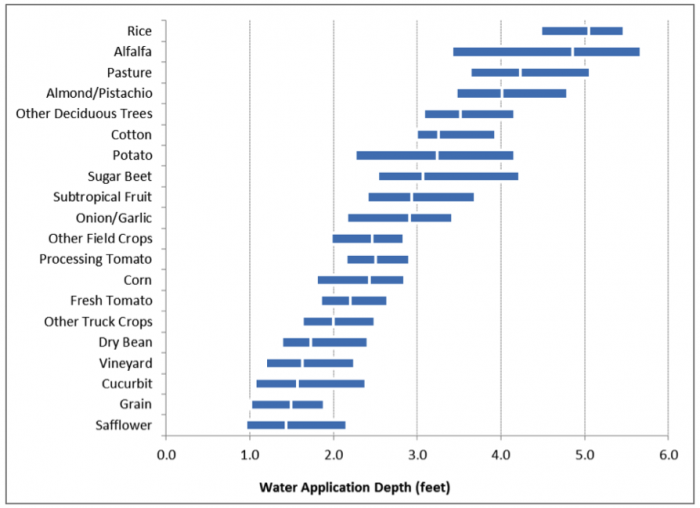
Water Sources for Crops
Water Sources for Crops
Where do plants get their water?
The source of water for most land plants is precipitation that infiltrates or soaks into the soil, but precipitation varies dramatically geographically. For example, we know that Florida gets a lot more precipitation per year than Arizona. Figure 4.1.5 below shows the average annual precipitation across the United States and around the globe. Notice on the map of the U.S. that the dark orange colors represent areas that get less than ten inches of precipitation per year. And, the darkest green to blue regions receive more than 100 inches or more than eight feet of precipitation per year!
Climate, including the temperature of a region and the amount of precipitation, plays an important role in determining what types of plants can grow in a particular area. Think about what types of plants you might see in a high water resource region versus a low water resource region. A low resource region with respect to water receives lower precipitation, so would have desert-like vegetation, whereas a higher resource region for water would have lusher native vegetation, such as the forests of the eastern US.
Regions that receive enough precipitation to grow crops without irrigation (i.e., those areas shaded green on the map below) would be considered high resource areas with respect to water. A high-resource region is more likely to be a more resilient food production region. In contrast, a low resource region with respect to water would be regions on the map below in the orange-shaded colors. In these regions, extra effort is needed to provide enough water for crops, such as through the development of an irrigation system.
Compare the crop water use values in Figure 4.1.6 with the average annual precipitation in Figure 4.1.5 and you'll see that there are parts of the US where there isn't enough precipitation to grow many crops. In fact, there is a rough line running down the center of the US at about the 100th meridian that separates regions that get more than about 20 inches of rain per year from regions that get less than 20 inches of rain per year. On the map in Figure 4.1.5, this line is evident between the orange-colored areas and the green-colored areas. Generally, west of the 100th meridian there is insufficient precipitation to grow many crops. If a crop's consumptive water use or ET is greater than the amount of precipitation, then irrigation of the crop is necessary to achieve high yields.
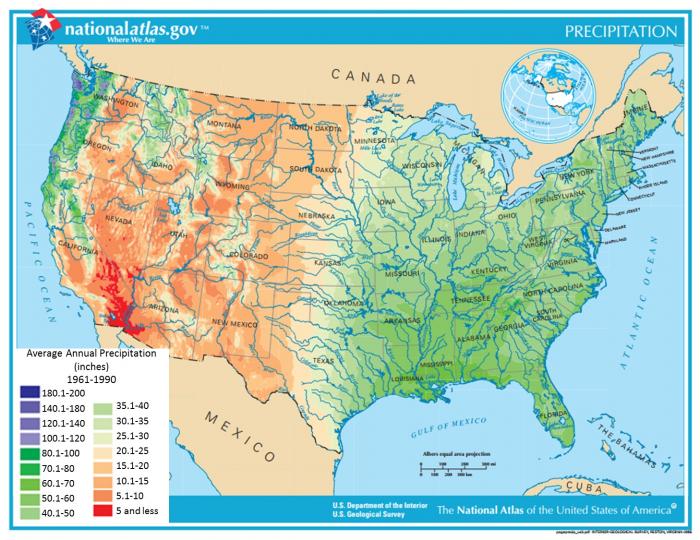
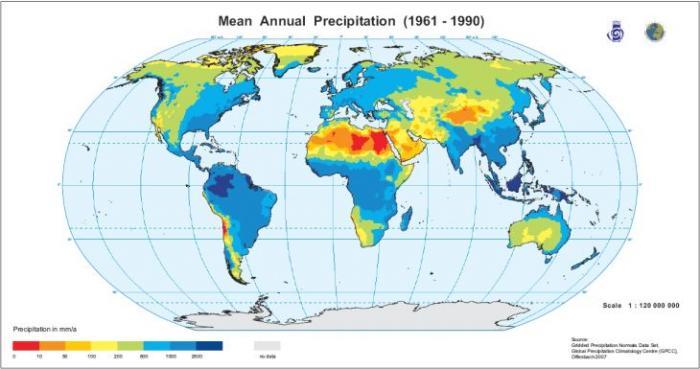
How can we grow crops when there is insufficient precipitation?
In regions where precipitation is insufficient to grow crops, farmers turn to other sources of water to irrigate their crops. Irrigation is the artificial application of water to the soil to assist in the growth of agricultural crops and other vegetation in dry areas and during periods of inadequate rainfall. These sources of water can be from either surface or groundwater. Surface water sources include rivers and lakes, and diversion of water from surface water sources often requires dams and networks of irrigation canals, ditches, and pipelines. These diversions structures and the resulting depletion in river flow can have significant impacts on our river systems, which will be covered in the next part of this module. The pumping of water for irrigation from aquifers also has impacts, which are also discussed in the next part of this module.
Water use for irrigation comprised about 80-90 percent of U.S. consumptive water use in 2005, with about three-quarters of the irrigated acreage being in the western-most contiguous states (from USDA Economic Research Service [71]). For example, in the state of Colorado, irrigation comprised 89% of total water withdrawals in 2010 (Figure 4.1.7). Irrigated agriculture is also very important economically, accounting for 55 percent of the total value of crop sales in the US in 2007 (from USDA Economic Research Service [71]). Globally only about 18 percent of cropland is irrigated, but that land produces 40 percent of the world's food and about 50 percent by value (Jones 2010).
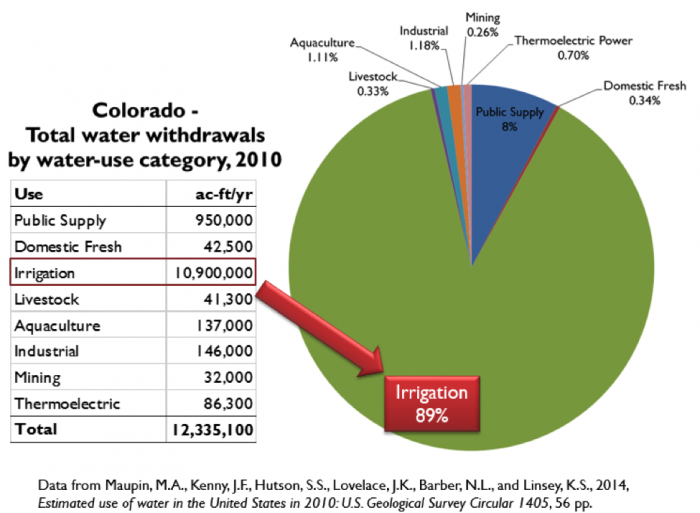
Activate Your Learning
In this activity, you will employ geoscience ways of thinking and skills (spatial thinking and interpretation of the spatial data to characterize specific regions for the geographic facility).
Irrigation Efficiency
Irrigation Efficiency
The amount of water used for irrigation varies depending on the climate and on the crop being grown, and it also depends on the irrigation technique used. Just like in your garden or home landscaping there are more or less efficient sprinklers. In many parts of the world flood or surface, irrigation is still used where water flows across a field and soaks into the soil.
Surface or flood irrigation is the least efficient manner of irrigation. When a field is flooded, more water than is needed by the plant is applied to the field and water evaporates, seeps into the ground, and percolates down to the groundwater, where it can be out of reach of the plant's roots. Another problem with flood irrigation is that the water is not always applied evenly to all plants. Some plants might get too much water, and others get too little. On the other hand, flood irrigation tends to use the least energy of any irrigation system.
Furrow irrigation (Figure 4.1.8) is another type of surface irrigation in which water is directed through gated pipe or siphon tubes into furrows between rows of plants. When using furrow irrigation, water is lost to surface runoff, groundwater, and evaporation, and it can be challenging to get water evenly to an entire field.
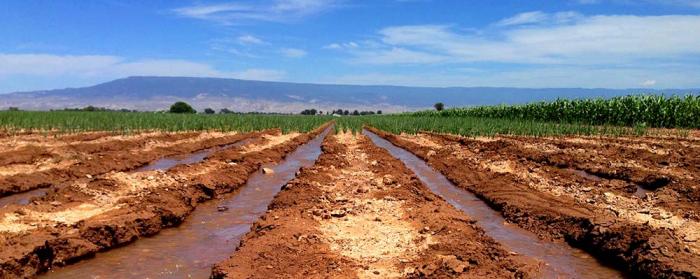
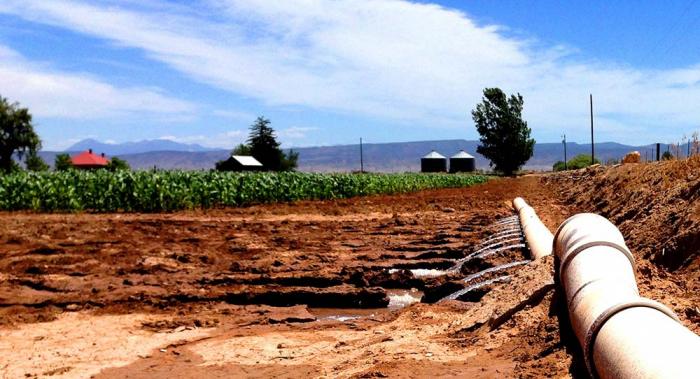
More efficient methods of irrigation include drip irrigation (Figure 4.1.9) sprinklers (such as center pivots, Figure 4.1.10), and micro-spray (Figure 4.1.11) irrigation. All of these methods, while more efficient, also require significant investments in equipment, pipes, infrastructure (e.g., pumps Figure 4.1.9) and energy. In addition to the high cost, some soil types, irrigation networks, field sizes, and crops pose greater challenges to the implementation of more efficient methods of irrigation. For example, in the Grand Valley of western Colorado, the irrigation network is entirely gravity-fed, meaning that farmers can easily flood and furrow irrigate without the use of pumps. In addition, the fields are small and the soils are very clayey, all of which make using center pivots for row crops particularly challenging and expensive. But, in the same valley, the peach orchards have successfully used micro-spray and drip systems. A major advantage of more efficient irrigation in addition to reduced water consumption is that crop yields are often higher because the water can be applied more directly to the plant when water is needed.
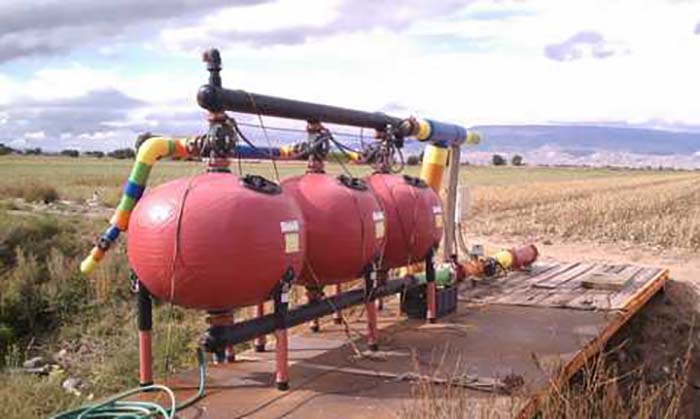


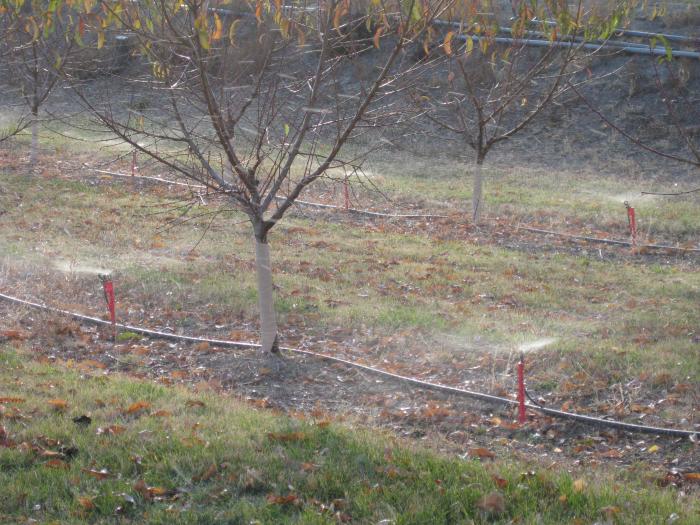
Activate Your Learning
Table 4.1.1 presents data on the top 15 irrigated states in the United States. You can see how many acres of land are irrigated in each state, and how much water is used for irrigation of both surface water and groundwater. Consider the relationship between the amount of irrigated land in a state, the type of irrigation used and the amount of water used.
An acre-foot is a unit of measure for large volumes of water and is the volume of water required to cover one acre of land to a depth of one foot (325,851 gallons). Imagine a football field, including the end zones, one foot deep in water.
| State | Irrigated Land (in thousand acres) by type of irrigation |
Surface Water Withdrawals | Groundwater Withdrawals | Total Irrigation Withdrawals | ||||||
|---|---|---|---|---|---|---|---|---|---|---|
| - | Sprinkler | Micro-irrigation | Surface | Total | Thousand acre-feet per year | % of irrigation water from surface water | Thousand acre-feet per year | % of irrigation water from groundwater | Thousand acre-feet per year | Percent of total water withdrawals used for irrigation |
| California | 1790 | 2890 | 5670 | 10400 | 16100 | 62% | 9740 | 38% | 25840 | 61% |
| Idaho | 2420 | 4.57 | 1180 | 3600 | 11500 | 73% | 4280 | 27% | 15780 | 82% |
| Colorado | 1410 | 0.2 | 1930 | 3340 | 9440 | 87% | 1450 | 13% | 10890 | 88% |
| Arkansas | 518 | 0 | 4150 | 4670 | 1500 | 15% | 8270 | 85% | 9770 | 77% |
| Montana | 753 | 0.64 | 886 | 1640 | 7880 | 98% | 142 | 2% | 8022 | 94% |
| Texas | 3770 | 244 | 1910 | 5920 | 1940 | 25% | 5710 | 75% | 7650 | 27% |
| Nebraska | 6370 | 0.57 | 2360 | 8730 | 1520 | 24% | 4820 | 76% | 6340 | 70% |
| Oregon | 1210 | 97 | 594 | 1900 | 3750 | 64% | 2140 | 36% | 5890 | 78% |
| Arizona | 195 | 28.1 | 770 | 993 | 3220 | 63% | 1900 | 37% | 5120 | 75% |
| Wyoming | 184 | 4.12 | 892 | 1080 | 4410 | 90% | 490 | 10% | 4900 | 93% |
| Utah | 625 | 1.45 | 710 | 1340 | 3060 | 85% | 554 | 15% | 3614 | 72% |
| Washington | 1270 | 86.1 | 221 | 1580 | 2630 | 75% | 894 | 25% | 3524 | 63% |
| Kansas | 2840 | 18.1 | 217 | 3080 | 179 | 5% | 3230 | 95% | 3409 | 76% |
| Florida | 548 | 712 | 731 | 1990 | 1500 | 46% | 1770 | 54% | 3270 | 20% |
| New Mexico | 461 | 19.6 | 397 | 878 | 1640 | 54% | 1390 | 46% | 3030 | 86% |
Virtual Water
Virtual Water
How much water do you eat?
Water is essential to growing food and every bite of food we consume required water to grow, process, and transport. The water necessary to grow, process, and transport food is often referred to as virtual water or embedded water. Virtual water is the entire amount of water required to produce all of the products we use, including our mobile phones and cotton t-shirts. But a global assessment of virtual water reveals that the majority of water that we consume is in the food we eat. If we total up all of the virtual water embedded in everything we use and eat, we can estimate our total water footprint. Water footprints can be used to provide insights into how much water is used every day in all of our activities including producing our food. For example, Figure 4.1.12 shows the amount of water used per person around the globe associated with wheat consumption. When you eat food imported from another region, you are eating the water of that region. The apple from New Zealand, grapes from Chile, and lettuce from California all required water to grow and by consuming those products you’re "eating" that virtual water. The concepts of virtual water and water footprints can be powerful tools for businesses and governments to understand their water-related risks and for planning purposes (water footprint network [73]).
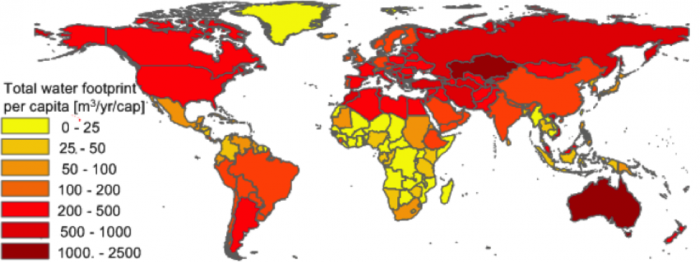
Check Your Understanding
Scroll through this infographic [75] explaining virtual water and then answer the questions below.
Formative Assessment: Turning Water into Food
Formative Assessment: Turning Water into Food
Instructions
Please download the worksheet below for detailed instructions.
- Download Module 4 Formative Assessment Activity Worksheet [76]
You will perform three activities in this assessment:
- Watch the video below, Turning water into food, and answer the questions on the worksheet as you watch the video
- Visit the water footprint calculator [77] website, compare how your water footprint changes with varying levels of meat consumption, and answer questions on the worksheet. This portion of the assessment will be included in the weekly discussion and not included in the assessment quiz.
- Perform a comparison of the virtual water [78] embedded in different food products and answer questions on the worksheet.
Video: Turning water into food, Bruce Bugbee | TEDxUSU (16:32)
This is my globe. I've had this globe for over thirty years to analyze the three-dimensional relationships among the continents and the water and the nations. Political boundaries have changed over the decades, but the fundamental relationships haven't changed. Like many globes like this, my globe has raised mountains. And I always thought those mountains were diminished on my globe so that it would make it easier to manufacture. Till one day, I looked up the height of Mount Everest and the diameter of the earth, and I got out my micrometers to check how much these were diminished. And to my amazement, they were embellished. They're considerably embellished. It was a very disturbing day for me. If the mountains are embellished, the oceans are similarly thin. And it turns out, if you take all the water on our blue planet, roll it up into a sphere, it comes out to the size of a ping-pong ball, a ping-pong ball!
But it doesn't stop there. Even though this is small, ninety-seven and a half percent of the water on our planet is saltwater. We can't drink it, we can't irrigate our crops with it. The two-and-a-half percent that's freshwater is the size of this small blue marble. Now, if I took this marble, I should put it up here on Greenland because 99% of our freshwater is frozen in glaciers, mostly Greenland and Antarctica. The 1% that's left is the size of a mustard seed. This mustard seed recycles and recycles and sustains life on the planet. We use about a gallon of water every day in the water we drink and in the food we eat. We use about another 20 gallons a day in washing things - washing our clothes and domestic use. But we use several hundred gallons of water every day, indirectly, in the food we eat. That amount dwarfs all the other uses.
In the United States, we dedicate 70% of our water resources to agriculture. I have spent much of my professional life studying how to improve water efficiency in agriculture and I'm joined in this effort by hundreds of colleagues around the world. The challenge is enormous. We can grow food without fossil fuels, but we cannot grow food without water. We think about our carbon footprint. We ought to be thinking about our water footprint, and even more importantly, we ought to be thinking about our global food print. The type of food that we eat has a bigger impact on the environment than the cars we drive. Eating a hamburger is equivalent in water use to taking an 80-minute shower.
To understand where water goes, it's useful to review the Earth's water cycle. As you can see from the globe, 70% of the planet surface is oceans, 30% is land. So the water cycle starts with one fundamental thing. The Sun shines on the oceans and water evaporates. This is an amazing process. All the salts are left behind. It’s distilled water coming out of the ocean. Anybody that has boiled a pot of water on their stove to dryness knows it takes an enormous amount of energy to evaporate water. The Sun does this every day for free, no fossil fuels, no fancy apparatus. Here's an amazing fact, more Sun shines on the earth in an hour than all of the people use in a year. So this water vapor from the ocean blows over to the land, falls on the land as rain, and soaks into the ground. It eventually runs back to the oceans in the rivers. We have a few thousand years of experience in ways to reuse this water. We built dams, we drill wells, we pump the water back up to the surface. It's still liquid water. The microbes in the soil have purified it. We drill more wells, we use it again. Eventually, it slips out of our grasp and runs back to the ocean. This is all liquid water. There’s two fates, the second one is shown here.
Now let's plant some seeds. The roots grow from the seeds and the water that used to go into the ocean is short cycled back to the roots of the plants. The Sun is hot. The same energy that falls on the ocean, falls on the plant leaves. To stay cool and hydrated, they evaporate water. It goes into the air, back to the ocean, falls as rain, and become saltwater again. We have far less control over this water vapor than we do over the liquid water that we can reuse. Without a continuous supply of water vapor, the plants dehydrate and food production stops. We irrigate to keep the plants hydrated. We have developed an amazing array of instruments to precisely tell when and how much to irrigate crops. They get just what they need, no more no less. In some older systems, 50% of the water evaporated from the soil surface and didn't get into the plants, went back to the ocean. In some of our modern systems we now have subsurface drip irrigation that can deliver 90% of the water right to the plants.
Every drop is precious. We call these efforts, more crop per drop. Even with our best efforts, we can't keep up, we can't grow the food we need to feed a hungry planet. So we access aquifers deep in the ground. These aquifers are called fossil aquifers because they formed a long time ago, they're difficult to recharge. We drill deep wells and pump that water up to the surface and irrigate the plants. These aquifers are being depleted far more rapidly than our fossil fuel reserves.
So how much crop can we get per drop? Let's take a look at these wheat plants over here. Wheat and rice are the biggest crops for direct human consumption on the planet. These two crops provide the vast majority of our calories. This wheat was developed here at Utah State University. My colleagues and I hybridized tall high yielding wheat with very short wheat to get a short high yielding wheat. We did this with NASA funding because we wanted to work with NASA to develop a life support system for space, that we could grow our own food in space independent of the planet. We've grown this wheat many times on the international space station and some of the astronauts turned out to be amazing photographers. This is a picture of this wheat at harvest on the International Space Station. That picture in the background is not a photo-shopped image of my globe. We grow this wheat hydroponically and if you haven't ever seen hydroponic wheat, here it is, the roots absorbing the water, going up to the tops of the plant. And if you’re a student in the lab, you know how much water this wheat takes every day. We developed this for a fast rate of development. This wheat is only three weeks old from transplanting to this tub. It'll be ready to harvest in five weeks. That's almost twice as fast as wheat in the field. Surprisingly, hydroponic wheat doesn't require any more water than field wheat. In fact, it’s often is less because there's no evaporation from the soil surface, there's no leaks, all the water goes through the plant. Even with perfect efficiency of every input, it still takes a hundred gallons of water to grow enough wheat to make a loaf of bread. A hundred gallons of water.
To emphasize this point, my students built this simulated hundred-gallon tank of water. If we put a faucet on this and dripped it into this tank into a plot big enough to grow that wheat, it would be empty about the time the wheat was ready to harvest. This greatly exceeds all the other household units it uses even when it's perfect. So why is this water use so enormous for plants? Plant physiology is a lot like human physiology. So let's consider breathing. We exhale water vapor to get oxygen. These plants lose water in order to get carbon dioxide. Every square millimeter of the surface of these plants is covered with tiny pores called stomata. The word stomata comes from the Greek word for mouth, so these stomata open to let carbon dioxide in, and they automatically lose water vapor. There's a hundred times more water vapor inside a leaf than there is carbon dioxide in the air and that's why the water use requirement is so enormous. Water has to come out to let the CO2 in. Saving water by closing the stomates is a lot like asking people to save water by stopping breathing. We can't do it. Humans have it easy. There are six hundred times more oxygen in the air than there is carbon dioxide, so that means plants need 600 times more water to grow.
For all the interest in global warming, carbon dioxide is a trace gas, point zero four percent. If we took the air molecules in this auditorium and made them fluorescent, we'd have a hard time finding the carbon dioxide molecules. There is only four carbon dioxide molecules for every 10,000 air molecules. It's one of the great wonders of the world that plants can find those carbon dioxide molecules and make our food, make high-energy food.
To better understand the effect of diet on the environment, let's analyze the land area required to grow the food for one person. So we're joined with this scientist, who has an advanced degree from the Playmobil Institute. And because of our studies with NASA, we've many times analyzed how much land he needs. This green felt represents the land area he needs to grows his own food. It's a small amount of land. If everything's perfect, he grows the food 365 days a year. He can sustain himself on this amount of land. Now we're going to send him into space. After all, we're trying to make a life support system for space. He's got to have some shelter, so we give him a house. But the house covers some of the land. Every photon is precious, so he's got to have a green roof on his house. Now he's ready, growing his own food. But he's going into the vacuum of space. So we're gonna give him a transparent dome, seal it up, recycle every drop of the water, grow the plants at just the right rate so the carbon dioxide and oxygen are in perfect balance, call up Morton Thiokol, put a big rocket under this, off it goes into space. He can go anywhere in the solar system and be self-sustaining, long as he doesn't go too far away from the Sun. What if he gets up one morning and says, “If you please, I would like an egg for breakfast”. He can't do it. We need additional land area to feed this chicken, to give him the egg. What if he says, “I'd like a glass of milk for lunch”? We need even more land area to feed the cow. If he eats the equivalent of 25 percent of his calories from animal products, which is the national average, it more than doubles the land area.
We'll get up each day, my colleagues in animal science, my colleagues in plant science, and work to make water use efficiency in agriculture better, but small changes in our diets can have a much bigger effect than years of our research. Please think about your global food print the next time you think about putting food in the garbage disposal. Please think about that mustard seed and those fossil aquifers, and consider eating less meat. This is the diet for a small planet thank you.
Submitting Your Assignment
Please submit your assignment in Module 4 Formative Assessment in Canvas.
Module 4.2: Impacts of Food Production on Water Resources
Module 4.2: Impacts of Food Production on Water Resources
Introduction
Agricultural food production impacts water resources by depleting quantities of both surface water and groundwater and by polluting surface and groundwater with pesticides and fertilizers. Module 4.2 includes a brief introduction to the impacts of agriculture on water resources, followed by two case studies: the Colorado River (flow depletion and salinity) and the Mississippi River (nutrients, eutrophication, and the hypoxic zone in the Gulf of Mexico).
In completing this module, you will be able to:
- Attribute major water pollutants to appropriate agricultural sources
- Summarize the major impacts of agriculture on water resources
- Relate nutrient loading from fertilizer use to the dead zone in the Gulf of Mexico
Agricultural production has significant impacts on both the quality and quantity of surface and groundwater resources around the globe. In this unit, we'll look at how agricultural activities can contribute to water pollution, and we'll also consider how the diversion of irrigation water from both surface and groundwater resources creates significant impacts on those water resources and the ecosystems they sustain. Some of the critical issues connecting agricultural activities with water resource quality and quantity are:
- Agricultural groundwater removal generally exceeds the natural recharge rate, and groundwater overpumping causes irreversible land settling and loss of aquifer storage capacity.
- Surface water diversion contributes to downstream ecosystem deterioration.
- Agricultural non-point source pollution is an important contributor to water quality degradation.
Impacts of Water Withdrawals
As discussed in the first part of Module 4, in regions where precipitation is insufficient to grow crops, irrigation water is drawn from lakes, rivers, and aquifers to supplement the insufficient or unreliable precipitation. Water diversions for irrigation can have impacts on both surface and groundwater resources.
We saw earlier in this module that the western US receives less precipitation than the eastern US. What does that mean for irrigation needs? The western US withdraws more water from lakes, rivers, and groundwater for irrigation than the eastern US (Figure 4.2.1). These water withdrawals are not without impacts, as we will see throughout the rest of this module. Figure 4.2.1 maps the water withdrawal data we explored in the previous unit. Do you remember the three states in the US that diverted the most water for irrigation in the US? California, Idaho, and Colorado. But Nebraska irrigated more acres than both Idaho and Colorado. In the map in Figure 4.2.1, you can clearly see the states that use the most irrigation water. Next, we'll look at some of the impacts of surface and groundwater withdrawals.
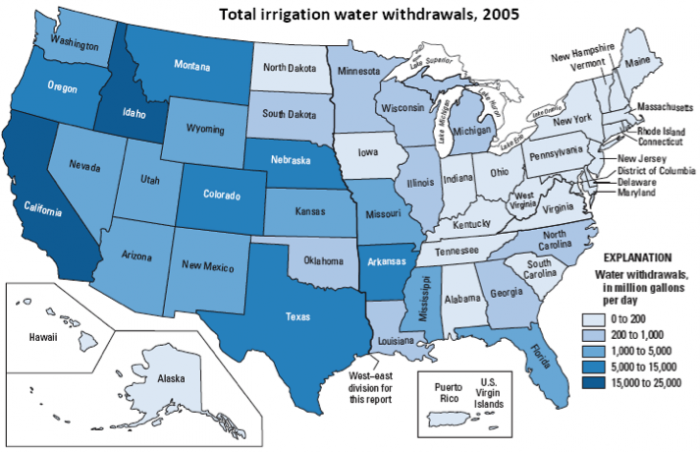
Impacts of Surface Water Withdrawals for Irrigation
Impacts of Surface Water Withdrawals for Irrigation
The storage and redistribution of water by dams, diversions, and canals has been a key element in the development of civilizations. Large-scale water control systems, such as on the Nile in Egypt or the Colorado River in the southwestern U.S. make it possible to support large cities and millions of hectares of agricultural land. As the population grows and water diversions increase, serious questions are being raised about the environmental costs of these large water management systems.
Agricultural water withdrawals are placing significant pressure on water resources in water-scarce regions around the globe (Figure 4.2.2). If more than 20 percent of a region's renewable water resources are withdrawn, the region is in a state of water scarcity and the water resources of the region are under substantial pressure. If the withdrawal rises to 40 percent or more, then the situation is considered critical and evidence of stress on the functions of ecosystems becomes apparent. More than 40% of the world's rural population lives in river basins that are physically water-scarce and some regions, such as parts of the Middle East, Northern Africa, and Central Asia, are already withdrawing water in excess of critical thresholds (FAO 2011).
In order to divert water from rivers, diversion structures or dams are usually constructed and create both positive and negative effects on the diverted river system. Dams can provide a multitude of benefits beyond their contribution to storage and diversion for agricultural uses. Dams can contribute to flood control, produce hydroelectric power, and create recreational opportunities on reservoirs. Negative impacts of dams and agricultural diversions include:
- Habitat fragmentation – blocks fish passage
- Reduction in streamflow downstream, which then results in changes in sediment transport, and in floodplain flooding
- Changes in water temperature downstream from a dam
- Evaporation losses from reservoirs in hot, dry climates
- Dislocation of people
- Sedimentation behind dam fills in reservoirs with sediment and reduces their useful lifespan
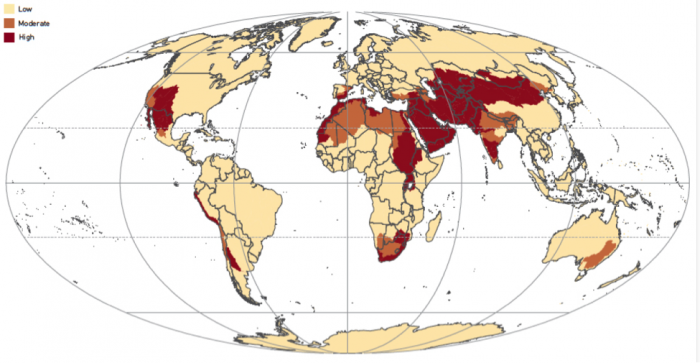
This world map shows that water famine especially high in the Southwestern United States and large areas of Africa, the Middle East, and South Asia.
Impacts of Groundwater Withdrawals for Irrigation
Impacts of Groundwater Withdrawals for Irrigation
Where surface water supplies are insufficient, groundwater is often used for irrigation (Figure 4.2.3). Agriculture uses about 70% of the groundwater pumped for human use globally and about 53% of the groundwater pumped in the US (USGS: Groundwater use in the United States [81]). In some parts of the world, groundwater is pumped at a faster rate than natural processes recharge the stored underground water. Groundwater use where pumping exceeds recharge is non-renewable and unsustainable.
Another problem that may occur in some aquifers with excessive groundwater pumping is a compaction of the aquifer and subsidence of the ground surface. When the water is pumped from the pore spaces in the aquifer, the pore spaces compress. The compression of millions of tiny pore spaces in hundreds of meters of aquifer material manifests on the surface as subsidence. The ground elevation actually decreases. Subsidence from groundwater pumping is irreversible and leaves the aquifer in a condition where it cannot be recharged to previous levels.
Our reliance on and depletion of groundwater resources is becoming a global concern as aquifers are being pumped at unsustainable rates in the US (Figure 4.2.4) and all over the world. Enhanced irrigation efficiencies and conservation measures are being implemented when possible to prolong the life of some aquifers. Unfortunately, groundwater is often the water resource that we turn to in times of drought or when other surface-water resources have been depleted. For example, in California during the recent drought, farmers drilled wells and used groundwater to save their crops when surface water resources were not available.
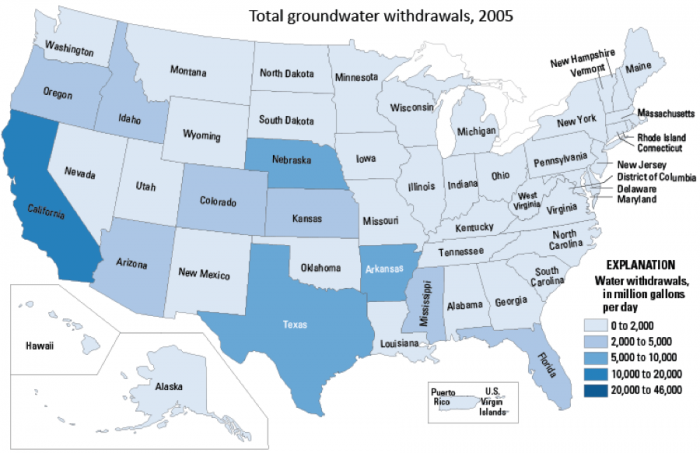
This map of the U.S. shows total groundwater withdraws by state, in millions of gallons per day. California has the highest at 20,000 - 60,000. Nebraska follows at 10,000 - 20,000. Texas and Arkansas are 5,000 - 10,000, Mississippi, Florida, Colorado, Kansas, Arizona, Oregon, and Idaho are each 2,000 - 5,000. The rest of the country is 0 - 2000.
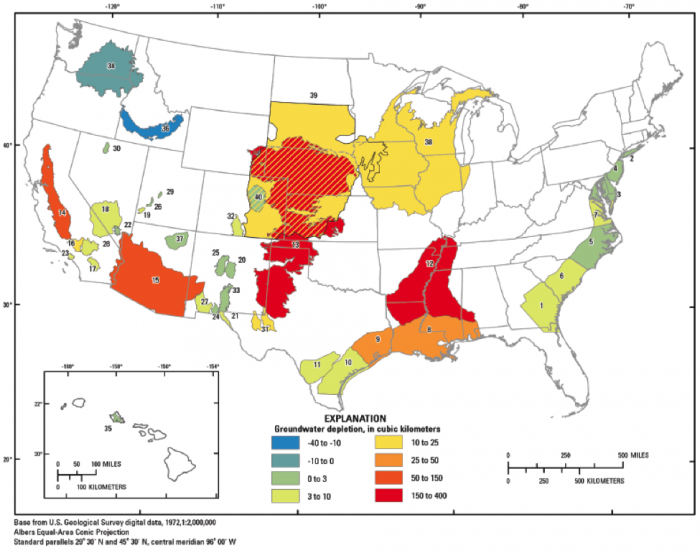
Knowledge Check
Read the following article:
Rosenberg, David M., Patrick McCully, and Catherine M. Pringle. "Global-scale environmental effects of hydrological alterations: introduction. [84]" BioScience 50.9 (2000): 746-751.
Water Quality Impacts
Water Quality Impacts
Runoff from agricultural areas is often not captured in a pipe and discharged into a waterway; rather it reaches streams in a dispersed manner, often via sub-surface pathways, and is referred to as non-point source pollution. In other words, the pollutants do not discharge into a stream or river from a distinct point, such as from a pipe. Agricultural runoff may pick up chemicals or manure that were applied to the crop, carry away exposed soil and the associated organic matter, and leach materials from the soil, such as salts, nutrients or heavy metals like selenium. The application of irrigation water can make some agricultural pollution problems worse. In addition, runoff from animal feeding operations can also contribute to pollution from agricultural activities.
The critical water quality issues linked to agricultural activities include:
- Fertilizers – nutrients (nitrogen and phosphorus)
- Eutrophication – dead zones
- Pesticides
- Soil erosion
- Animal Feeding Operations
- Organic matter
- Nutrients
- Irrigation and return flows
- Salinity
- Selenium
Check Your Understanding
Review the following fact sheet on agricultural impacts on water quality:
Protecting Water Quality from Agricultural Runoff, 2005, EPA Fact Sheet on Agricultural Runoff [85]
Colorado River Case Study
Colorado River Case Study
Flow Depletion and Salinity
The Colorado River in the southwestern U.S. is an excellent case study of a river that is highly utilized for irrigation and agriculture. A majority of the Colorado River’s drainage basin has an arid or semi-arid climate and receives less than 20 inches of rain per year (Figure 4.2.5), and yet the Colorado River provides water for nearly 40 million people (including the cities of Los Angeles, San Diego, Phoenix, Las Vegas, and Denver) and irrigates 2.2 million hectares (5.5 million acres) of farmland, producing 15 percent of U.S. crops and 13 percent of livestock (USBR 2012). Much of the irrigated land is not within the boundaries of the drainage basin, so the water is exported from the basin via canals and tunnels and does not return to the Colorado River (Figure 4.2.6).
The net results of all of these uses of Colorado River water (80 percent of which are agricultural) in both the U.S. and Mexico are that the Colorado River no longer reaches the sea, the delta is a dry mudflat, and the water that flows into Mexico is so salty as a result of agricultural return flows that the U.S. government spends millions of dollars per year to remove salt from the Colorado River.
Many farmers in the Colorado River basin are working to use Colorado River water more efficiently to grow our food and food for the animals that we eat. Watch the video below and answer the questions to learn more about farming in the Colorado River basin.
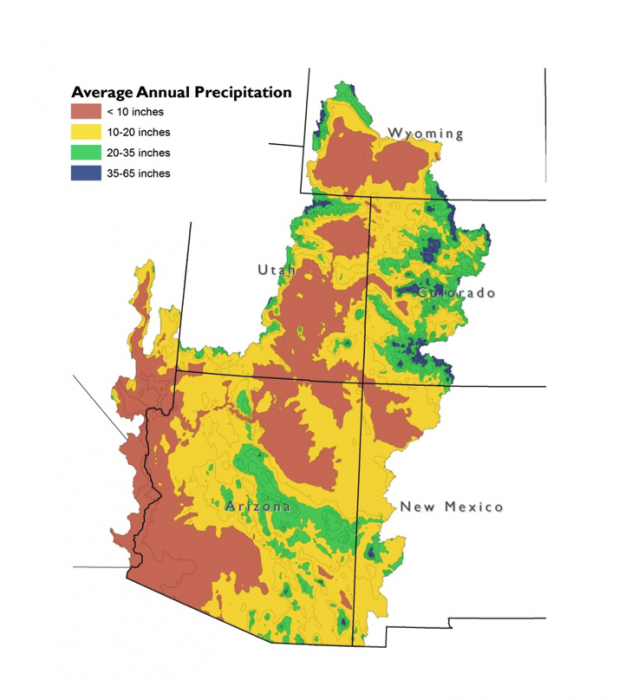
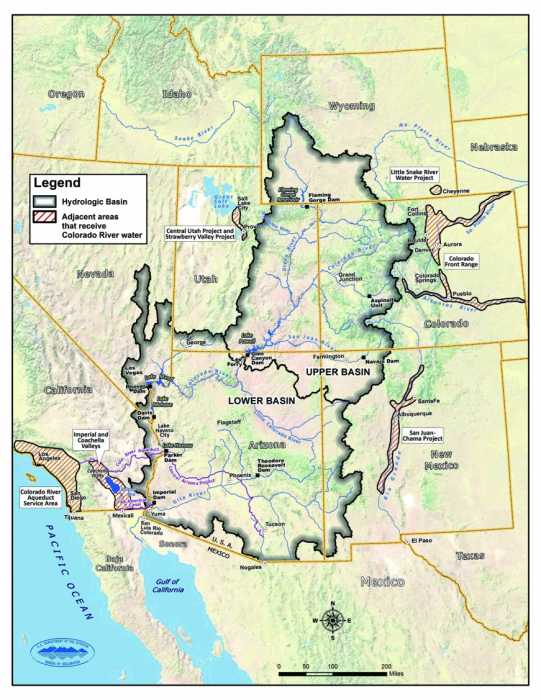
Check your Understanding
Watch the following video then answer the questions below
Video: Resilient: Soil, water and the new stewards of the American West (10:13)
Click for transcript of the Resilient: Soil, water and the new stewards of the American West video
Narrator: A drop of water from a sprinkler on a quiet Los Angeles street. A shower head in a Las Vegas hotel. Agricultural land in California's Imperial Valley. Where does all this water come from? The Colorado River. In 1922, representatives from seven states gathered at Bishop’s Lodge New Mexico to sign the Colorado River Compact, an agreement on how to allocate water in this precious river system. But that River had more water then, than it does today. The Colorado River Basin touches the lives of every American. The river system runs through seven states in the US, and two in Mexico, and supplies water for over 36 million people. It also irrigates over five million acres of cropland and provides eighty percent of our winter produce, all from one river. And agriculture is the first to feel the pressure. At the headwaters of the Colorado River, farmers and ranchers are creating a toolbox of resilience. They save water with efficient technology and by building healthy soil.
Brendon Rockey, Rockey Farms, Center, Colorado: My grandpa always had a philosophy on this farm that you have to take care of the soil before the soil can take care of you, and he just felt like we had gotten away from that. That's the number one thing with everybody. is yield, yield, yield. Everybody wants just big production, you know, so that's why you want to dump on the fertilizer, kill off anything that poses a threat. It's all about production. We put more of an emphasis on quality. And what's really nice is when you put the emphasis on quality, the quantity usually comes along with it.
Narrator: And he also uses less water. How? By managing his soil more efficiently and working with nature instead of against it. Brendon rotates his potato crops with green manure, or cover crops, that enhance soil health while reducing his dependence on pesticides, fertilizers, and water.
Narrator: Unhealthy soil lacks life. Often a crust forms on its surface. When a crop is watered, very little soaks into the soil. Instead, it sits on top and is left to evaporate or run off. This land often has to be watered more frequently to get water to the crops. Healthy soils teem with life and are often built when farmers plant a mix of cover crops that add nutrients to the soil. When these plants die they become organic matter which helps store water in the soil. That means farmers can irrigate less, and have more certainty in times of drought.
Brendon Rockey: The reason we got into cover cropping was a response to a drought. Now that we've brought in more diverse crops, that have diverse root systems, which actually help benefit the water use efficiency as well, we've regenerated the soil to the point now where I'm growing a potato crop on about 12 to 14 inches of irrigation water per year. We're focusing on the soil, we're investing in the soil and we're bringing up for the functionality of the soil back to its optimum range.
Mike Jensen, Homegrown Biodynamic Farm, Bayfield, Colorado: A farm after 20 years should have much better soil than when it started. The best thing I do for my land is cover cropping. It rejuvenates the soil keeps everything happy, gets all the flora and fauna in balance. It's not about production this year, it's about production for the next 30 years.
Mike Nolan, Mountain Roots Produce, Mancos, Colorado: One thing I've learned from a bunch of folks, old-timers I've worked with is, do your best to not ever have any bare ground, nothing open, no open soil. I mean even in nature, even in the desert, technically there are things covering the ground. There's things, fungi and bacteria, that are holding the ground together. So what I did about three weeks ago is I planted out this oats crop. I’m not gonna harvest this for the seed or anything, but what it's going to do, it's going to hold moisture in here.
Cynthia Houseweart, Princess Beef Company, Hotchkiss, Colorado: Right now we're in full bloom, but what I like to see is a variety of plants. I don't want to just see straight alfalfa, I want to see grass and, and clover. I don't want bare ground. If we didn't have irrigation water, we would be a desert. This would be sagebrush, cedar trees. This, the water is what creates our livelihood. We graze during the growing season. So the conventional thing is, you move your cows off your pastures, grow them and cut them for hay. What we do instead of cutting them for hay, we graze them.
Narrator: Cynthia waters, using a center pivot. As it moves across her fields, the cattle follow behind eating fresh grass.
Cynthia: And the things they trample in, and their manure, adds to the soil, feeds the soil. It breaks down, turns into humus. The soil becomes more like a sponge and can suck up water that we put on it and rain, so the soil improves, which means the plants grow better and then our cows look better.
Dan James, James Ranch, Durango, Colorado: When you build topsoil, you increase the capillary action of the soils ability to retain water; and the less frequent you're applying your water, the more those roots have to go after that water, as it recedes into the ground. And so now you have all these roots below the surface, and all of a sudden here comes your cow. She comes in and she clips that off. Now your plant’s this high and the plant sheds the same proportion of roots. Now you're adding organic material and you're growing topsoil.
Strengthening the soil is also a concern of Steve Ela, a fruit grower in Hotchkiss Colorado. With precise tools like micro sprinklers and permanent drip irrigation, Steve can use water precisely when and where he needs it most, and his soil is healthy enough to efficiently deliver that water to his crops.
Steve Ela, Ela Family Farms, Hotchkiss, Colorado: For us on the farm it's the difference between using first furrows and the micro specters and now drip. It’s been a bit of an evolution of thinking. So for me it's been, it's not that really one system is better or worse, but it's an evolution of thinking, of trying to manage our water better, trying to use the system of irrigation management and cover cropping to manage our weeds, and also to just only to grow better fruit and healthier trees. Yes, it's expensive on the upfront cost, but it's a system then we can use for 20 years. It's very efficient. I think it probably saves us that much, you know, in water.
Narrator: It's innovation that saves water and money, while increasing soil fertility. It's also innovation that includes technology. Water data delivered by weather satellites, GPS, and even smart sensors like those used by Randy Meaker, a Colorado wheat and corn grower. He uses cover crops to improve his soil and by monitoring soil moisture, he can more effectively use the center pivots to reduce water use.
Randy Meaker: There are huge efforts going on right now, trying to figure out how we and the western United States can solve the shortages of water due to drought conditions. There's two ways to keep water in a bucket and one is to put more water in at the top, the other one is to take less water out at the spigot. People in the lower Basin States, where the population centers are, they're looking for us to supply them more water. But what we're looking for is a responsible use from them. What good is it for me to be restricted if I realize that we're still irrigating lawns, we're still washing cars.
Narrator: Water is the lifeblood of our Western landscape. Farmers and ranchers are as essential to it as the water itself. The water challenges these farmers face are many, but across the country they gather to share their water knowledge and provide each other with valuable support. They build community and grow good food, while stewarding both their land and their water. They are the water stewards of the Colorado River Basin.
Mississippi River Case Study
Mississippi River Case Study
Dead Zone in the Gulf of Mexico
Agricultural runoff can contribute pollutants to natural waters, such as rivers, lakes, and the ocean, that can have serious ecological and economic impacts, such as the creation of areas with low levels of dissolved oxygen called dead zones caused by pollution from fertilizers. Nutrients, such as nitrogen and phosphorus, are elements that are essential for plant growth and are applied on farmland as fertilizers to increase the productivity of agricultural crops. The runoff of nutrients (nitrogen and phosphorus) from fertilizers and manure applied to farmland contributes to the development of hypoxic zones or dead zones in the receiving waters through the process of eutrophication (Figure 4.2.7).
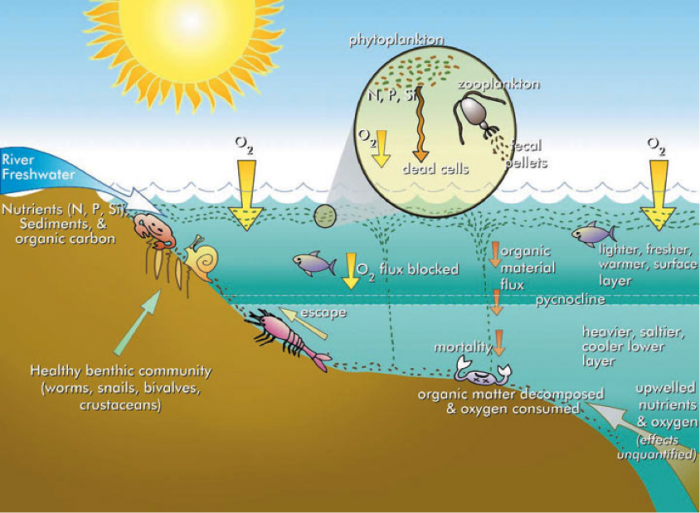
Watch the following videos from NOAA’s National Ocean Service that show how dead zones are formed and explain the dead zone in the Gulf of Mexico:
- Video: Happening Now: Dead Zones in the Gulf 2017 [88] (2:33) (Transcript [89])
- Video: Hypoxia [90] (3:51) (Text description [91] - video has no narration, just on screen text)
The nutrients that make our crops grow better also fertilize phytoplankton in lakes and the ocean. Phytoplankton are microscopic organisms that photosynthesize just like our food crops. With more nitrogen and phosphorus available to them, they grow and multiply. When the phytoplankton dies, decomposers eat them. The decomposers also grow and multiply. As they’re eating all of the abundant phytoplankton, they use up the available oxygen in the water. The lack of oxygen forces mobile organisms to leave the area and kills the organisms that can’t leave and need oxygen. The zone of low oxygen levels is called a hypoxic or dead zone. Streams flowing through watersheds where agriculture is the primary land use exhibit the highest concentrations of nitrogen (Figure 4.2.8).
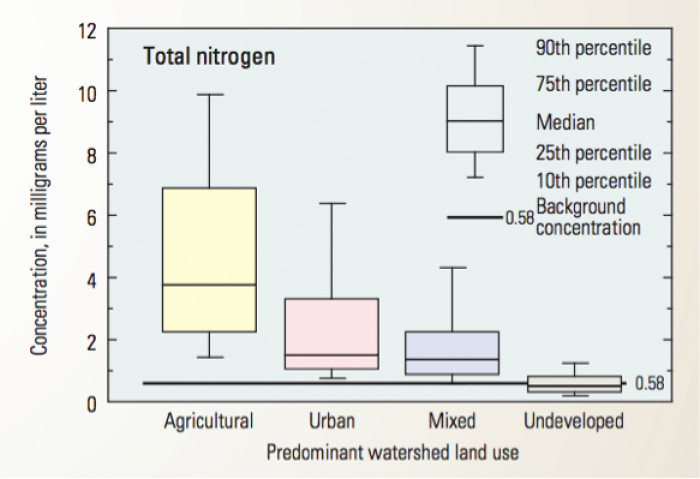
The Mississippi River is the largest river basin in North America (Figure 4.2.9), the third largest in the world, and drains more than 40 percent of the land area of the conterminous U.S., 58 percent of which is very productive farmland (Goolsby and Battaglin, 2000). Nutrient concentrations in the lower Mississippi River have increased markedly since the 1950s along with increased use of nitrogen and phosphorus fertilizers (Figure 4.2.10). When the Mississippi River’s nutrient-laden water reaches the Gulf of Mexico, it fertilizes the marine phytoplankton. These microscopic photosynthesizing organisms reproduce and grow vigorously. When the phytoplankton die, they decompose. The organisms that eat the dead phytoplankton use up much of the oxygen in the Gulf’s water resulting in hypoxic conditions. The resulting region of low oxygen content is referred to as a dead zone or hypoxic zone. The dead zone in the Gulf of Mexico at the mouth of the Mississippi River has grown dramatically and in some years encompasses an area the size of the state of Connecticut (~5,500 square miles) or larger. Hypoxic waters can cause stress and even cause the death of marine organisms, which in turn can affect commercial fishery harvests and the health of ecosystems.
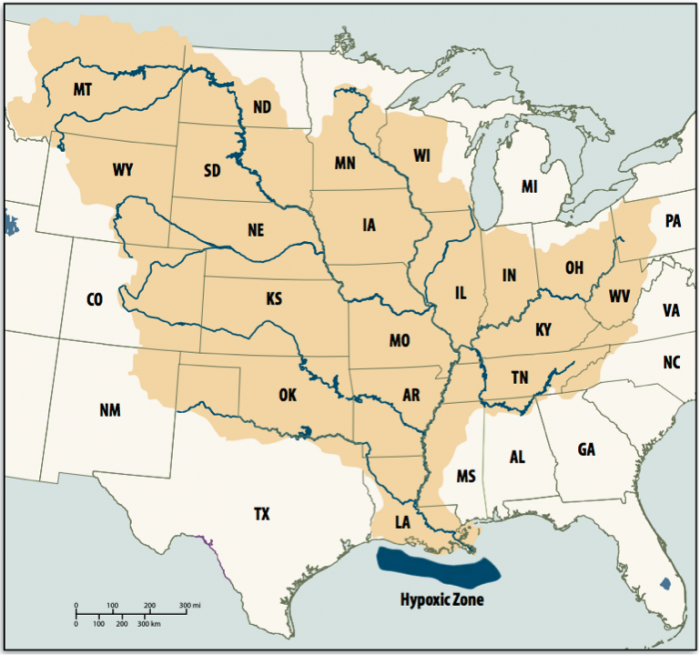
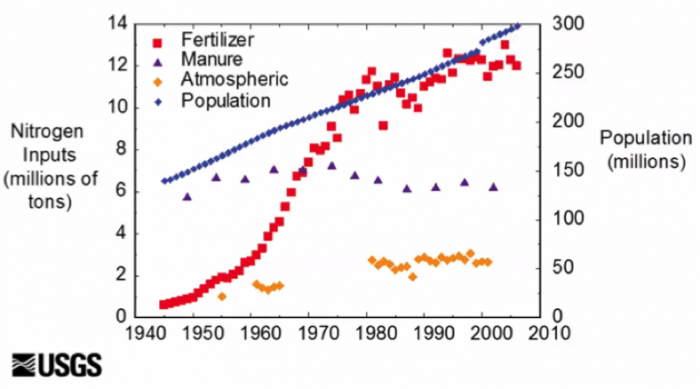
Optional Reading
Additional Resources about the Dead Zone in the Gulf of Mexico
- NOAA sponsored program out of LSU runs the hypoxia net website with great information (Hypoxia In the Gulf of Mexico [95])
- Hypoxia and Eutrophication from the National Centers for Coastal Ocean Science [96] of the NOAA National Ocean Service
- USGS Fact Sheet 105-03, 2003, Nutrients in the Upper Mississippi River: Scientific Information to Support Management Decisions [97]
Managing Runoff to Reduce the Dead Zone
Managing Runoff to Reduce the Dead Zone
What can be done to reduce the size of the dead zone?
The dead zone in the Gulf of Mexico is primarily a result of runoff of nutrients from fertilizers and manure applied to agricultural land in the Mississippi River basin. Runoff from farms carries nutrients with the water as it drains to the Mississippi River, which ultimately flows to the Gulf of Mexico. If a number of nutrients reaching the Gulf of Mexico can be reduced, then the dead zone will begin the shrink.
Since 2008, the Hypoxia Task Force, led by the U.S. Environmental Protection Agency and consisting of five federal agencies and 12 states, has been working to implement policies and regulations with the aim of reducing the size of the dead zone in the Gulf of Mexico. Many of the strategies for reducing nutrient loading target agricultural practices including (USEPA, The [98]Sources [98] and Solutions: Agriculture [98]).
- Nutrient management: The application of fertilizers can vary in amount, timing, and method with varying impacts on water quality. Better management of nutrient application can reduce nutrient runoff to streams.
- Cover Crops: Planting of certain grasses, grains, or clovers, called cover crops can recycle excess nutrients and reduce soil erosion, keeping nutrients out of surface waterways.
- Buffers: Planting trees, shrubs, and grass around fields, especially those that border water bodies, can help by absorbing or filtering out nutrients before they reach a water body.
- Conservation tillage: Reducing how often fields are tilled reduces erosion and soil compaction, builds soil organic matter, and reduces runoff.
- Managing livestock waste: Keeping animals and their waste out of streams, rivers, and lakes keep nitrogen and phosphorus out of the water and restores stream banks.
- Drainage water management: Reducing nutrient loadings that drain from agricultural fields helps prevent degradation of the water in local streams and lakes.
Watch the following video from the US Department of Agriculture about strategies to reduce nutrient loading into the Mississippi River:
Video: Preventing Runoff Into The Mississippi River (1:44)
EPA website about nutrient pollution and some solutions to nutrient pollution: The Sources and Solutions: Agriculture [99]
Activate Your Learning
Review the graphs below and answer the questions that follow. Figure 4.2.11 presents the size of the hypoxic zone in the Gulf of Mexico from 1985 to 2014. The U.S. Environmental Production Agency led a task force in 2008 that identified a goal to reduce the five-year average of the size of the dead zone to less than 2,000 square miles by 2015.
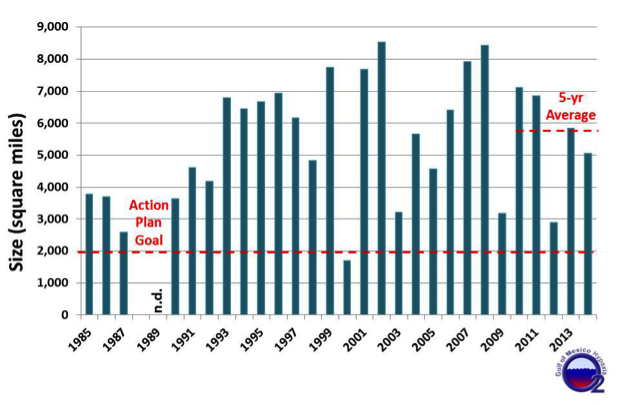
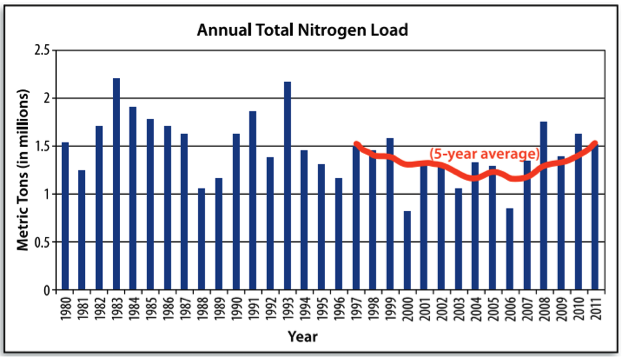
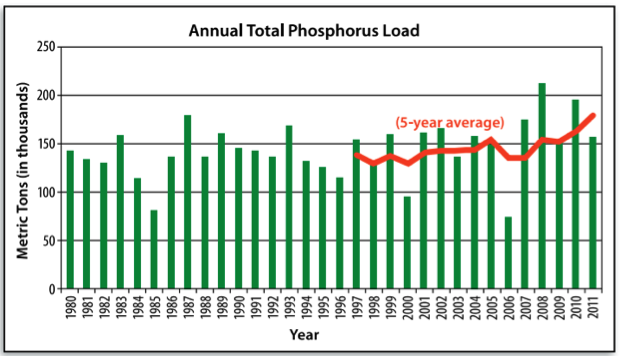
Summative Assessment: Kansas Farm Case Study
Summative Assessment: Kansas Farm Case Study
Water is essential to growing food, and the source of water for food production is either naturally occurring precipitation or irrigation from surface or groundwater. The application of fertilizers and pesticides to crops results in the production of water pollution. We can incorporate water resources into our Coupled Human-Natural System diagram, where the climate of the natural system determines the availability of water for food production. The response in the human system is to develop irrigation systems where necessary and implement conservation and efficiency measures in times of scarcity. Also, the application of fertilizers and pesticides results in water pollution, which impacts the water quality in the natural system.
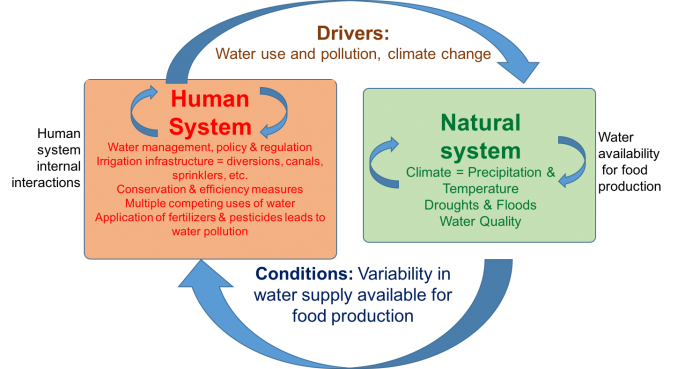
Human/Natural System Diagram
Human System (Human System Internal Interactions)
- Water management, policy, and regulation
- Irrigation infrastructure = diversions, canals, sprinklers, etc.
- Conservation and efficiency measures
- Multiple competing users of water
- Application of fertilizers and pesticides leads to water pollution
*arrow pointing from human system to natural system: drivers: water use and pollution, climate change*
Natural System (Water availability for food production)
- Climate = precipitation and temperature
- Droughts and floods
- Water quality
*arrow pointing from natural system to human system: conditions: variability in water supply available for food production*
Instructions
In the summative assessment for Module 4, you'll apply what you've learned about coupled human and natural water systems to a particular farming scenario in Pawnee County, Kansas. You'll consider the precipitation in Kansas, the crops you could grow with that precipitation and then look at crop yields for different crops using irrigation. Finally, you'll consider the impact on water resources if you were to shift the types of crops grown and irrigation practices on a farm in Pawnee County, KS. The assignment is explained in the worksheet below.
- Download Module 4 Summative Assessment Worksheet:
- Located on next page
- Download the Excel spreadsheet for calculations for Module 4 Summative Assessment
- Located on next page
- Submitting your Assignment
- You will not be submitting your assignment, you will be using the worksheets as a guide for completing the Summative quiz.
Module 4 Summative Assessment (With Rubric)
Module 4 Summative Assessment (With Rubric)
Kansas Farm Case Study
Water is essential to growing food, and the source of water for food production is either naturally occurring precipitation or irrigation from surface or groundwater. The application of fertilizers and pesticides to crops results in the production of water pollution. We can incorporate water resources into our Coupled Human-Natural System diagram, where the climate of the natural system determines the availability of water for food production. The response in the human system is to develop irrigation systems where necessary and implement conservation and efficiency measures in time of scarcity. Also, application of fertilizers and pesticides results in water pollution, which impacts the water quality in the natural system.
Human/Natural System Diagram
Human System (Human System Internal Interactions)
- Water management, policy, and regulation
- Irrigation infrastructure = diversions, canals, sprinklers, etc.
- Conservation and efficiency measures
- Multiple competing users of water
- Application of fertilizers and pesticides leads to water pollution
*arrow pointing from human system to natural system: drivers: water use and pollution, climate change*
Natural System (Water availability for food production)
- Climate = precipitation and temperature
- Droughts and floods
- Water quality
*arrow pointing from natural system to human system: conditions: variability in water supply available for food production*
Instructions
In the summative assessment for Module 4, you'll apply what you've learned about coupled human and natural water systems to a particular farming scenario in Pawnee County, Kansas. You'll consider the precipitation in Kansas, the crops you could grow with that precipitation and then look at crop yields for different crops using irrigation. Finally, you'll consider the impact on water resources if you were to shift the types of crops grown and irrigation practices on a farm in Pawnee County, KS. The assignment is explained in the worksheet below.
- Download Module 4 Summative Assessment Worksheet:
- Download the Excel spreadsheet for calculations for Module 4 Summative Assessment
- The discussion portion of the worksheet is incorporated into the weekly discussion post.
Submitting your Assignment
After completing the worksheet, please complete the Module 4 Summative Assessment in Canvas.
Grading Information and Rubric
Your assignment will be evaluated based on the following rubric. The maximum grade for the assignment is 40 points.
| Criteria | Possible Points |
|---|---|
| Part 1: Precipitation | |
| Precipitation rates from map are correct | 2 |
| Part 2: Crops | |
| List of crops correctly represents crops that could be grown with natural precipitation | 4 |
| Part 3: Irrigation Efficiency and Crop Yield | |
| Scenario table correctly populated with results from the Crop Water Allocator | 14 |
| Part 4: Discussion and Synthesis | |
| Includes correct usage of the concept of water footprints and connection between diet and water consumption. | 5 |
| Clearly explains connections between farming, water scarcity, dead zones, and irrigation efficiency. Also demonstrates clearly the connection between increased water consumption and impacts to water resources, including quality and quantity impacts, such as nutrient pollution and groundwater depletions. | 10 |
| Well-written, proper spelling and grammar, and uses complete and well-crafted sentences. | 2 |
| Logical presentation of topics. Reasonable length. | 3 |
| TOTAL | 40 |
Summary and Final Tasks
Summary
This module has introduced some important concepts that tie our food system to the Earth's water resources. Water resources are essential for food production, and food production also has significant impacts globally on both the quantity surface and groundwater and the quality. Growing crops relies on water from either precipitation or irrigation derived from surface and groundwater. Virtual water is embedded in everything you eat, with the amount of water varying, depending on the crop and the climate in which the crop was grown. Crops grown in hot and dry climates consume more water via transpiration as evaporation rates are higher in those climates. Also, some plants need more water than others, for example, rice uses more water to grow than corn. You explored precipitation rates in different parts of the US compared to evaporation rates and considered how much water might need to be applied to certain crops. Computation of your personal water footprint allowed you to compare your lifestyle and resulting water consumption with average water consumption in the US and globally. Also, these computations along with consideration of virtual water in different food products allowed you to draw conclusions about the impacts of different types of diets on the planet's water resources.
In this unit, we've just touched the surface of the very large issue of how agriculture impacts both the quality and quantity of our water resources. We also looked at a few examples of agricultural practices that help to minimize and reduce these impacts.The Colorado River provided an example of a river on which agricultural diversions have severely impacted the quantity of water in the river. We saw that the Colorado River no longer reaches the sea! The breadbasket of the US, the Midwest, contributes nutrient pollution to the Mississippi River, which has, in turn, created a massive dead zone in the Gulf of Mexico. You explored data on the size of the dead zone and proposed strategies to reduce the nutrient loading and thereby reduce the size of the dead zone in the future.
Reminder - Complete all of the Module 4 tasks!
You have reached the end of Module 4! Double-check the to-do list on the Module 4 Roadmap [105] to make sure you have completed all of the activities listed there before moving on to Module 5!
References and Further Reading
- Dubrovsky, N.M. and P.A. Hamilton, 2010, Nutrients in the Nation’s Streams and Groundwater: National Findings and Implications, USGS Fact Sheet 2010-3078 (http://pubs.usgs.gov/fs/2010/3078/ [106])
- FAO, 2011, The State of the World’s Land and Water Resources for Food and Agriculture (SOLAW) - Managing systems at risk. Food and Agricultural Organization of the United Nations, Rome and Earthscan, London.
- Goolsby, D.A., and Battaglin, W.A., 2000, Nitrogen in the Mississippi Basin--Estimating sources and predicting flux to the Gulf of Mexico: U.S. Geological Survey Fact Sheet 135-00, 6 p.
- Hoekstra, A.Y. and M.M. Mekonnen, 2012. The water footprint of humanity, Proceedings of the National Academy of Science [107], vol. 109, no. 9, pp. 3232-3237.
- Jones, J.A.A., 2010, Water Sustainability: A Global Perspective, Hodder Education, 452 pp.
- Mississippi River Gulf of Mexico Watershed Nutrient Task Force, 2013, Reassessment 2013: Assessing Progress Made Since 2008, Accessed from http://www2.epa.gov/sites/production/files/2015-03/documents/hypoxia_rea... [108]
- U.S. Bureau of Reclamation (USBR), 2012, Colorado River Basin Water Supply and Demand Study, http://www.usbr.gov/lc/region/programs/crbstudy/finalreport/index.html [109]
Additional Resources
- Global annual precipitation map [110]
- FAQ - CROP WATER USE [111], Agricultural Water Conservation Clearinghouse
- Good Virtual Water resource from the Water Footprint Network [112]
Product gallery with virtual water for different agricultural products and citations for all of their data and maps
Videos
- Invisible water, the hidden virtual water market [113]| Seth Darling | TEDxNaperville
- Virtual Water [114]
Video introducing virtual water in liters, used on British news to mark World Water Day 2007 and broadcast on Five and Sky News in the UK) - ALL YOU EAT, [115]UN Water, World Water Day
Short graphical video showing the liters of virtual water in a few food products - Water 101 - #1 Water for Food [116], produced by FAOWATER [117]
Short animation introducing the relationship between food production and water use
Module 5: Soils as a Key Resource for Food Systems
Module 5: Soils as a Key Resource for Food Systems
Introduction
Interactions Between Soil Nutrients, Nutrient Cycling, and Food Production Systems
Along with water, sunlight, and the earth's atmosphere, the soil is one of the key resources underlying food production by humans. In terms of the coupled human-natural systems we use as a way to understand food systems, we can say that human systems organize landscapes and manage soils, along with agricultural biodiversity and other parts of natural systems, to produce food. Soils exert an influence on this coupled system because they vary in terms of properties such as depth and nutrient content, which alters their response to human management. Soils also have great importance as the site of many nutrient and carbon transformations within the biosphere. They are a storehouse of beneficial soil organic matter that benefits the earth system in many ways. Also, by understanding soils and the earth's surface and ecological processes that occur there, human management is able to maintain and improve them, as well as overcome initial limitations or past degradation.
The purpose of this module is to give you as a learner a basic grounding in the nature of soils and soil nutrients. Module 5.1 provides the foundation for understanding soils, soil nutrients, and their connection to food. We will also focus on ways that soils are vulnerable to degradation that impairs their role in food production. In module 5.2 we will deepen our understanding of how soil management can protect soils in their role of supplying nutrients to crops and protecting other valuable resources such as surface water. To accomplish this we will focus on nitrogen (N) and phosphorus (P) as key nutrients for food production in module 5.2.
Goals and Learning Objectives
Goals and Learning Objectives
Goals
- Identify soil nutrients and soil function as key resources in need of protection for food production and food systems.
- Describe spatial and geographic variation in soil resources and soil fertility.
- Distinguish between preexisting aspects of biogeochemical cycling and human-induced processes that affect biogeochemical cycling.
- Attribute different soil fertility outcomes in food systems to the coupled natural and human factors and feedbacks that produce them.
Learning Objectives
After completing this module, students will be able to:
- Describe the basic properties of soil that distinguish it from mere "dirt".
- Explain how soil serves as a medium for plant growth.
- Explain how the five soil-forming factors interact to produce soils.
- Explain the term "biogeochemical cycling".
- Explain common limiting factors to plant growth that limits food production around the world.
- Explain how nutrient and carbon depletion from soils and soil erosion create conditions of low food productivity.
- Assess how farming practices affect soil fertility.
- Analyze modern fertilizer use as the emergence of a strong human system impact on nutrients in soils that replenishes soil nutrients but can create nutrient pollution.
- Analyze how natural/human system feedbacks operate to limit the actions of poorer food producers around the world.
- Incorporate sustainability challenges related to soil nutrient management into an analysis of food systems.
Assignments
Module 5 Assignments Roadmap
Detailed instructions for completing the Summative Assessment will be provided in each module.
| Action | Assignment | Location |
|---|---|---|
| To Read |
|
|
| To Do |
|
|
Questions?
If you prefer to use email:
If you have any questions, please send them through Canvas e-mail. We will check daily to respond. If your question is one that is relevant to the entire class, we may respond to the entire class rather than individually.
If you prefer to use the discussion forums:
If you have any questions, please post them to the discussion forum in Canvas. We will check that discussion forum daily to respond. While you are there, feel free to post your own responses if you, too, are able to help out a classmate.
Module 5.1: Soil Basics
Module 5.1: Soil Basics
Introduction
Overview of soils and nutrients for food production
In this course, we describe food systems as a coupling between human societies and natural earth systems and environments. This coupling is especially clear in the activities of food production that rely on crop and livestock raising. Crops and livestock production (and to a similar extent, fisheries, and aquaculture) require food producers to bring together human management with soil conditions and soil nutrients (this module), water (next module), as well as sunlight for energy and adequate climate conditions (temperature, humidity, adequate growing season). To understand these human-natural interactions across the entire course, and to build your capacity to understand natural factors as part of your capstone projects and other chapters of your education, this module describes basic soil properties and the role of soils in creating adequate conditions for crops to grow, which underlies most aspects of food production. It’s therefore very important that we understand soils as the “living skin of the earth” in their properties and history, the global patterns of soil fertility and soil limitations, and then its role in supplying nutrients to plants, and how soil fertility is regenerated by the human societies and management knowledge that allows them to continue supporting food production. Our goal is not to condense an entire course in soil science, although we hope that many of you will go on to take such a course. Rather, we want to sketch out major factors and determinants of the opportunities and limitations posed by soils to a human food production system.
What is Soil?
What is Soil?
We may be used to referring to soil as “dirt”, as in “my keys fell in the dirt somewhere” or “after planting the garden we had dirt all over our hands” but the way in which soil supports food production far more complex than a smear of clay on our hands. One way to define this difference in perspective is to think about the biological and chemical complexity in soil, and the fact that soils are not just brown, powdery handfuls of dirt but occupy a grand scale in the natural systems that underlie food systems. Soil is the "skin of the earth", layers that ascend from bedrock and supply water and nutrients to the fields and forests that make up the terrestrial biosphere. Soils are ecosystems in their own right, within mineral layers that form part of the earth’s surface. Soils can be as shallow as ten centimeters and as deep as many tens of meters.
An interesting exercise is to think of a single term or concept that describes how soils work and what they are. For example, if we were seeking an acronym to describe soil and market it as the marvelous thing that it is1 —and if we lacked time to think of a catchier name – we might think up the acronym “PaBAMOM” which nevertheless is a pretty good summary of what soil is: a “Porous and Biologically Active Mineral-Organic Matrix”. It’s a good summary because it defines the unique properties of soils (see Figure 5.1.1 below):
- Porous (full of open spaces or pores), at a range of pore sizes from well below a micron (10-6 m or 0.0001 cm) to many centimeters, and therefore able to store water and transmit it to deeper earth layers, and host organisms as diverse as bacteria, plant roots, and prairie dogs. This porosity arises not only from the inherent sizes of particles in soil but is also a result of soil organisms and roots that generate aggregation of the soil from clay and silt particles into crumbs and clods that may be familiar to from typical garden soil. This biologically generated aggregation is sometimes referred to as structure, which is seen in figure 5.1.1 as the overall arrangement of pores and aggregates, and in the notion that soil is a matrix (point five below). The ideas of aggregation and structure will be revisited in this module and in module 7.
- Soil is phenomenally biologically active and biologically diverse, especially in microbes, which makes it able to perform many useful functions. For example, soil microbes are able to "recycle" or decompose materials like wood, wheat straw, and bean roots into energy for themselves and other soil biotas; various other types of microbes also draw or fix nitrogen out of the air to feed plants, detoxify the soil from organic pollutants, or perform myriad other beneficial services -- and other not so beneficial processes such as diseases.
- Soil is mineral, formed from the breakdown and chemical processing of the earth’s rock crust into sand, silt, and clay, each with its own ability to store water based on the size of pores they create and unique chemical roles in further processing and breakdown of soil materials. Usually, the mineral part is most of the solid (non-pore) part of soil (Figure 5.1, top pie chart)
- Soil is also organic, containing bits of organic (carbon-containing) remnants of plants and animals, some of which become stabilized until they last hundreds and even thousands of years as part of the soil. In the current efforts to promote carbon sequestration to alleviate (mitigate) climate change, it is worth noting that the amount of carbon stored in these bits of soil organic matter globally easily exceeds the total carbon stock in all of the planet’s forests.
- Lastly, it is a matrix, which means that at least as important as the particles, aggregates, and pores of the soil are the organisms and processes that occur on and in these particles and pores (Fig. 3.1, bottom). This matrix hosts a highly complex ecosystem that winds its way through the millions of pores, roots, fungal hyphae, insects, and other organisms in soil. And here we are referring to the complex system concept we presented in module one: soil has many interacting parts with overlapping interactions, the ability to produce unexpectedly stable or unstable outcomes, and contains processes that can produce positive and negative feedbacks. One important example of this type of behavior is the range of soil productivity “behavior” of soils over time, including the ability of some soils to sustain moderate to high levels of productivity over years or decades (they resist change through processes of negative feedback), and then collapse in terms of food production as the interlocking, complex systems fueled by organic constituents and biological processes are dismantled (positive feedbacks operate to drive them towards degradation). Soils can then be similarly resilient in terms of remaining unproductive until the complex systems can be rebuilt through soil restoration practices.
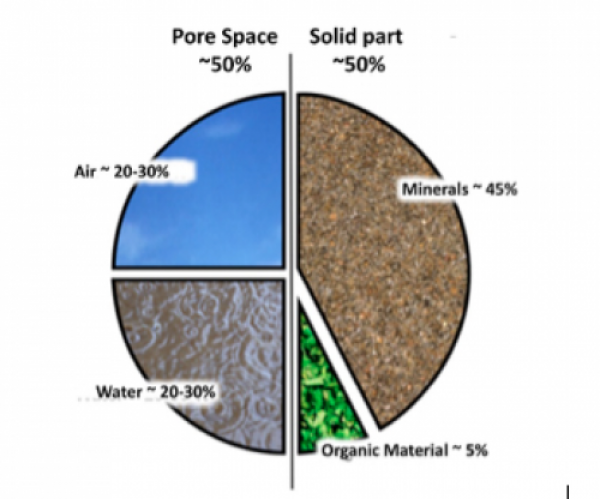
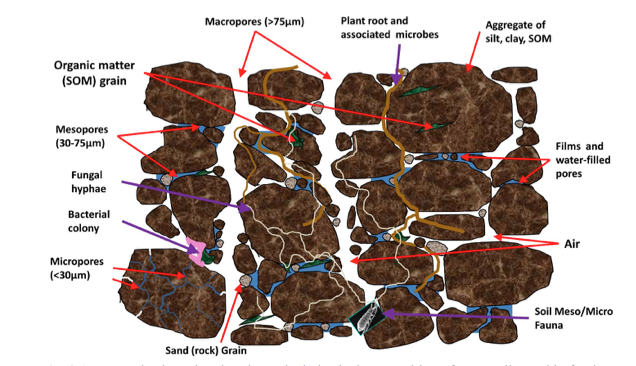
So, soil is not dirt. It is porous and complex, it covers almost every land surface on the planet (ice caps, glaciers, and bare rock are exceptions), and it is a ubiquitous, critical resource that is heavily coupled to human societies for their food production and in need of protection. It’s not dirt, it’s a PaBAMOM!
1. We don’t have to do this marketing job (phew!) because the existence and value of soils are so often taken for granted. Recently, economists have been working on estimating the implicit worth of the services performed for society by a single hectare (100 m x 100 m) of soil, and the amounts can range into tens of thousands of dollars per year depending on soils’ properties and the way they are used.
Soils Support Plant Growth and Food Production
Soils Support Plant Growth and Food Production
Support, Water, and Nutrients
Before examining other basic soil functions, it is helpful and will avoid possible confusion, to understand the basics of how soils support the needs of crops, which in turn support the food needs of humans and their livestock. Firstly, soils provide a physical means of support and attachment for crops – analogous to the foundation of a house. Second, most water used by plants is drawn up through roots from the pores in soils that provide vital buffering of the water supply that arrives at crops either from rainstorms or applied as irrigation by humans. Third, as crops grow and build their many parts by photosynthesizing carbon out of the air (see module 6, next, for more on this) they gain most of the mineral nutrients they need (chemical elements) they need2 from soils, for example by taking up potassium or calcium that started out as part of primary minerals in earth’s crust, or nitrogen in organic matter that came originally from fertilizer or the earth’s atmosphere. The adaptation of crop plants domesticated by human farmers (and other plants) to soils, and the adaptation of the soil ecosystem to plants as their primary source of food mean that soils usually fulfill these roles admirably well.
2 The elements needed by plants other than Carbon (from the air) and Hydrogen/Oxygen (from water) in rough order of concentration are Potassium, Nitrogen, Phosphorus, Calcium, Magnesium, Sulfur, Iron, Manganese, Zinc, Boron, Copper, Molybdenum, and Cobalt (for some plants). Other elements are taken up into plants in a passive way without being essential, such as Sodium, Silicon, or Arsenic.
Soil Formation and Geography
Soil Formation and Geography
How do soils form in different places?
Soil Formation Factors
Soils around the world have different properties that affect their ability to supply nutrients and water to support food production, and these differences result from different factors that vary from place to place. For example, the age of a soil -- the time over which rainfall, plants, and microbes have been able to alter rocks in the earth's crust via weathering-- varies greatly, from just a few years where soil has been recently deposited by glaciers or rivers to millions of years in the Amazon or Congo River Basins. A soil's age plus the type of rock it is made from gives it different properties as a key resource for food systems. Knowing some basics of soil formation helps us to understand the soil resources that farmers use when they engage in food production. Below are some of the most important factors that contribute to creating a soil:
- Climate: climate has a big influence on soils over the long term because water from rain and warm temperatures will promote weathering, which is the dissolution of rock particles and liberating of nutrients that proceed in soils with the help of plant roots and microbes. Weathering requires rainfall and is initially a positive process that replenishes these solubilized nutrients in soils year after year and helps plants to access nutrients. However, over the long run (thousands to millions of years) and in rainy climates, rainwater passing through a soil (leaching) leaves acid-producing elements in the soil like aluminum and hydrogen ions and carries away more of the nutrients that foster a neutral pH (e.g. calcium, magnesium, potassium; see the next page on soil properties for a discussion on soil pH). Old soils in rainy areas, therefore, tend to be more acidic, while dry-region soils tend to be neutral or alkaline in pH. Acid soils can make it difficult for many crops to grow. Meanwhile, dry climate soils retain nutrients gained in weathering of rock -- a good thing -- but may lack plant cover because of dry conditions. A lack of plant cover leaves the soil unprotected from damage by soil erosion and means that dry climate soils often lack dead plant material (residues) to enrich the soil with organic matter. Both dry and wet climate soils have advantages as well as challenges that must be addressed by human knowledge in managing them well so that they are protected as valuable resources.
- Parent material: soils form through the gradual modification of an original raw material like rock, ash, or river sediments. The nature of this raw material is very important. Granite rock (magma that hardened under the earth) versus shale (old, compressed seabed sediments) produce very different soils. An important example of parent material influencing soils with consequences for human food production are soils made from limestone or calcium and magnesium carbonates. These rocks strongly resist the process of acidification by rainfall and leaching described above. Limestone soils maintain their neutral level of acidity (or pH) even after thousands of years of weathering, and thus can better maintain their productivity. An example of this parent material influence is the Great Valley in Pennsylvania, USA, where the Amish reside. These Pennsylvania soils are considered some of the most productive soils in the U.S. even after hundreds of years of farming. Pockets of other limestone soils the world over are similarly productive over the long term. In summary, as part of learning about a food production systems of a region, it can be helpful to consider the types of rock that occur in that region, which you may want to consider for your capstone regions.
- Soil age: the time that a soil has been exposed to weathering processes from climate, and the time over which vegetation has been able to contribute dead organic material, are important influences on a soil. Very young soils are often shallow and have little organic matter. In a rainy climate, young (e.g. 1000 years) to medium aged (e.g. 100,000 years) soils may be inherently very fertile because rainfall and weathering have not yet removed their nutrients. Old soils are usually deep and may be fertile or infertile depending on the parent material and long-term climatic conditions. Soils in previously glaciated regions such as the northern U.S. and Europe are usually thought of as young because glaciers recently (~10,000 years ago) left fresh sediments made from ground up rock materials.
- Soil slopes, relief, and soil depth: Steep slopes in mountains and hilly regions cause soils to be eroded quickly by rainfall unless soils are covered by throughout the year by crops or forest. These hilly and mountain regions may also have young soils, and the combination of young soils and erosion can make for soils that are quite thin. Meanwhile, flat valley areas are where the eroded soil is likely to accumulate, so soils will be deep. Along with the water holding capacity and the nutrient content of a soil, soil depth determines how much soil "space" or soil volume a crop's roots can explore for nutrients and water. Soil depth is an important and often overlooked determinant of crop productivity of soils. Moreover, these large-scale "mountain versus valley" differences can be mirrored within a single field, with small differences in topography creating differences in drainage, depth, and other soil properties that dramatically affect soil productivity within ten to twenty meters distance.
A Summary of Soil Formation: The Global Soils Map
These four factors along with the vegetation, microbes, and animals at a site, create different types of soils the world over. A basic global mapping of these soil types is given below in Fig. 5.1.2 We've attached some soil taxonomic names (for soil orders, categories used by soil taxonomists) to these basic soil types for those who are familiar with some of the terminology of soil classification. We should emphasize that understanding these orders is not essential to your understanding of food production and food systems, as long as you understand how the basic processes of soil formation described above, and the properties of soils described on the next page, contribute to the overall productivity of a soil. You should think about how the soil formation processes affect crop production in your capstone regions of your final project, and you should be able to find resources on how soils were formed in any place in the United States and around the world.
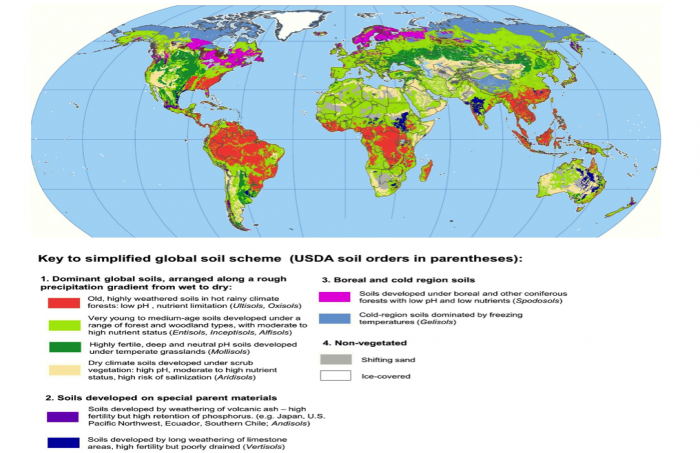
Formation and Management Affect a Soil's Productivity
Another important point is that soil formation processes described above largely determine only the initial state of a soil as this passes into human management as part of a coupled human-natural food system. Human management can have equally large effects as soil formation on productivity, either upgrading productivity or destroying it. The best management protects the soil from erosion, replenishes its nutrients and organic matter, and in some ways continues the process of soil formation in a positive way. We'll describe these best practices as part of a systems approach to soil management in module 7. Inadequate human management can be said to "mine" the soil, only subtracting and never re-adding nutrients, and allowing rainfall and wind to carry away layers of topsoil.
The next page adds to this description of soil formation by focusing in on the basic properties that affect food production on soils, like acidity and pH which is discussed above.
Soil Properties and Human Responses to Boost Food Production
Soil Properties and Human Responses to Boost Food Production
Nutrients, pH, Soil Water, Erosion, and Salinization
In growing crops for food, farmers around the world deal with local soil properties that we started to describe on the previous page. These properties can either be a positive resource for crop production or limitations that are confronted using management methods carried out by farmers. The first of these, a soil's nutrient status, is described in more detail in module 5.2. Regarding nutrients is only important to emphasize here that most nutrients taken up by plants (other than CO2 gas) come to plant roots from the soil, and that the supply of these nutrients often has to do with the amount of dead plant remains, manure, or other organic matter that is returned to the soil by farmers, as well as fertilizers that are put into soils to directly boost crop growth. Here are the other major soil properties that farmers pay attention to in order to sustain the production of food and forage crops:
Soil pH or Acidity: Near Neutral is Best
Most crops prefer soils that have a pH between 5 and 8, mildly acidic to mildly alkaline (to understand these pH figures, remember that water solutions can be either acidic or basic (alkaline), and that pH 7 is neutral, vinegar has a pH of about 2.5, and baking soda in water creates a pH of about 8). As discussed above under the climate and parent material sections describing soil formation, soils in rainy regions tend to become more acidic over time.& Soils with too low a pH will have trouble growing abundant food or feed for animals. Farmers manage soils with low pH by adding ground up limestone (lime) and other basic (that is, acid-neutralizing) materials like wood ash to their soils. As an alternative, farmers sometimes adapt to soil pH by choosing or even creating crops or crop varieties that have adapted to low pH, acidic soils. For example, potatoes do well in high elevation, acidic soils of the Andes and other areas around the world. Alfalfa for livestock does better in neutral and alkaline soils while clovers for animal food grow better in more acidic soils.
Soil Water Holding Capacity and Drainage: Deep, Loamy, and Loose is Best
Module 4 described the importance of water for food production and the way that humans go to great lengths to provide irrigation water to crops in some regions. Soil properties also play a role in the amount of water that can be stored in soils (for days to weeks) that is then available to crops. A soil that holds more water for crops is more valuable to a farmer compared to a soil that runs out of water quickly. Among the properties that create water storage in soils is soil depth or thickness, where a deep soil is basically a larger water tank for plant roots to access than a thin soil. The proportions of fine particles (clay) versus coarse particles (sand) in a soil, called soil texture, also influence the water available to plants: Neither pure clay nor pure sand hold much plant-available water because clay holds the water too tightly in very small pores (less than 1 micron or 0.001 mm, or smaller than most bacteria) while sand drains too rapidly because of its large pores and leaves very little water. Therefore an even mix of sand, clay, and medium-sized silt particles hold the maximum amount of plant-available water. This soil type is known as loamy, which for many farmers is synonymous with “productive”. In addition to these soil properties, farmers try to maintain good soil structure (also called "tilth"), which is the aggregation of soil particles into crumb-like structures, that help to further increase the ability of soils to retain water. Soil aggregation or structure, and its multiple benefits for food production are further described in Module 7 on soil quality.
Clayey soils, and soils that have been compacted by livestock or farm machinery ("tight" vs. "loose" soils), can also have problems allowing enough water to drain through them (poor drainage), which can lead to an oversupply of water and a shortage of air in soil pores (refer back to figure 5.1.1 and the roughly equal proportion of air and water in pores of an agricultural soil). Too much water and too little air in a soil lead to low oxygen in the soil and an inability for roots and soil microbes to function in providing nutrients and water to plants. Part of good tilth, described above, is maintaining a loose structure of the soil.
In the face of these important soil properties for water storage, farmers seek out appropriate soils with sufficient moisture (e.g. deep and loamy, see Figs. 5.1.3 and 5.1.4) but also adequate drainage. Food producers also modify and maintain the moisture conditions of soils, through irrigation but also through maintaining good soil aggregation or tilth (see modules 5.2 and 7), and by avoiding compaction of soils that also leads to poor drainage and soils that are effectively shallower because roots cannot reach down through compacted soils to reach deeper water.
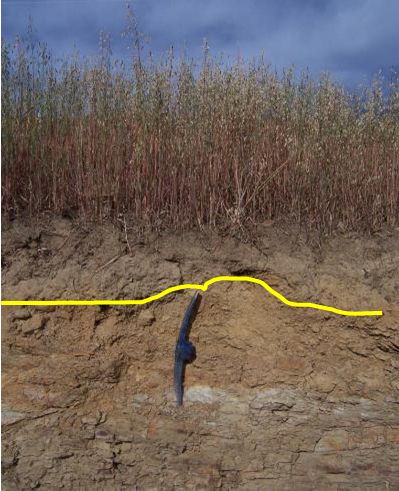
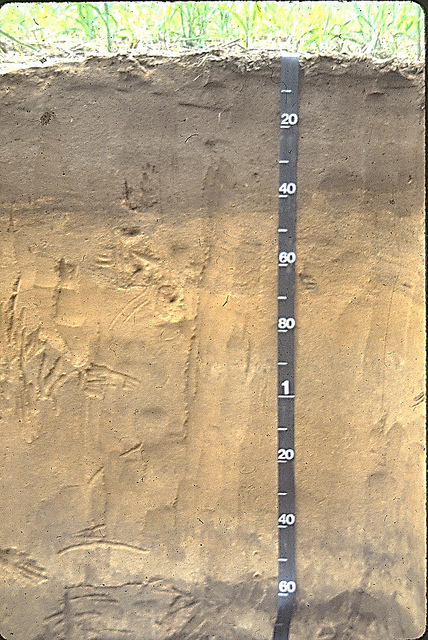
Salinization and Dry Climates: Hold the salt
Dry climate soils have less rainfall to leach them of minerals. They can, therefore, be high in nutrients, but also carry risks of harmful salts building up as rainfall does not carry these away either. Salt-affected soils may either be too salty to farm at all or may carry a risk that if irrigation water is too high in salts or applied in insufficient amounts to continually “re-rinse” the soil of salts, then salts can build up in soils until crops will not grow. The way that arid soils are managed is a key part of the human knowledge of food production in dry regions.
Relief and Erosion: Don't Let Soil Wash Down the Hill
Soil slope and relief are described on the previous page as creating higher risks of erosion (Fig. 5.1.5). To address this limitation food producers have either (a) not farmed vulnerable sloped land with annual crops, leaving them in the forest, tree crops, and year-round grass cover and other vegetation that holds soils on slopes; (b) built terraces and patterned their crops and field divisions along the contours of fields (Fig. 5.1.6). Terracing and terraced landscapes can be seen from Peru to Southeast Asia to Greece and Rwanda. Nevertheless, while sloped soils have been seen as the Achilles heel of environmental sustainability in mountain areas, the extreme elevation differences present in mountain areas can also be seen as a benefit to these food systems. The benefits arise because soils with very different elevation-determined climates and soil properties in close proximity, which allows for the production of a greater variety of crops. The simultaneous production in the same communities of cold- and acid soil tolerant bitter potatoes and heat-loving maize and sugar cane in lower, more neutral soils in the Peruvian Andes is an example of this benefit in high-relief mountain regions.
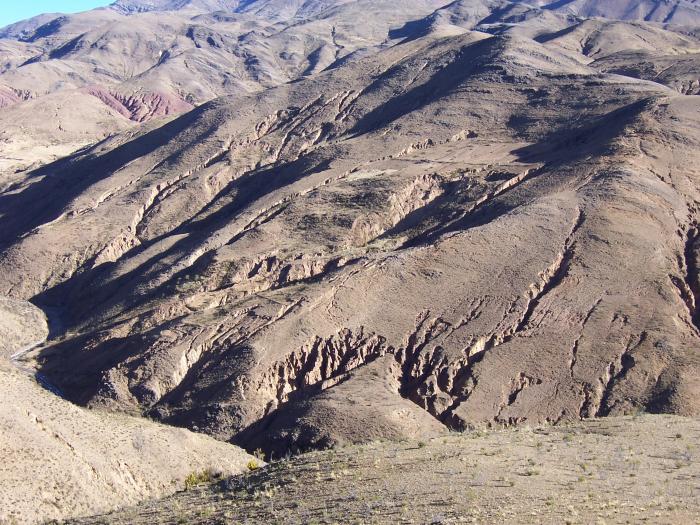
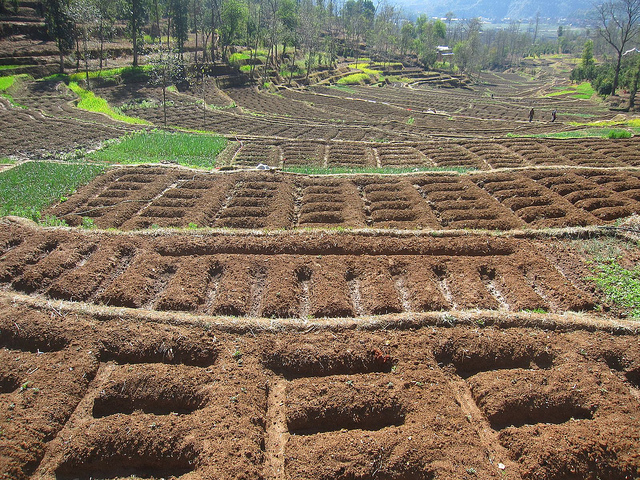
Soil Health: Understanding Soils as an Integrated Whole for Food Production
We hope that you are beginning to appreciate that appropriate management of soils is emphatically about integrating management principles like the ones presented here as human responses, along with an understanding of the basic properties of soils, and also the nutrient flows presented next in module 5.2. Soils are very much a complex system, and managing them for food production and environmental sustainability means that we must understand the multiple components and interactions of this system. The way in which this is accomplished has been summarized as the concept of Soil Health, which involves multiple components that are more fully addressed in module 7. Soil health is an aspiration of effective management and means that management has maintained or promoted properties like nutrient availability, beneficial physical structure, and diversity of functionally important and 'health-promoting' microbes and fauna in soils along with sufficient organic matter to feed the soil ecosystem. These integrated properties then allow production to avoid soil degradation, produce sufficient amount of food and livelihoods, and preserve biodiversity in soils as well as other significant ecosystem services like buffering of river flows and storage of carbon from the atmosphere.
3 This is not always true; Molybdenum, Sulfur, Boron and other micronutrients are sometimes found to limit plants, but the complexity of analyzing these is beyond the scope of this survey course.
Understanding Soil Maps at a Broad Global Level
Understanding Soil Maps at a Broad Global Level
Soil scientists have done an enormous amount of work in mapping the patterns of soil at a global level. The most current and detailed effort comes out of mapping work from the Food and Agriculture Organization of the United Nations, now an independent agency that is known as the International Soil Resource Information Centre (ISRIC), and is based on classifying a set of diagnostic types of topsoil layers that occur in different climates, landscape ages, and vegetation types. The details of this system5 are beyond the scope of this course, however, and to summarize the introduction to global soil fertility in this unit we present a simplified version of the United States Department of Agriculture (USDA) system that is still in wide use by soils practitioners in the United States. The USDA system lines up very well with the ISRIC system at this simplified level and allows understanding of the broad strokes of soil nutrient geography in the way we have presented it (Figure 3.8).
This simplified map is intended to serve as a resource for your other learning in the course on how food systems may respond to the opportunities and limitations of soils, and also summarizes the learning in this module about how soils result from an interaction of parent material, time, climate, vegetation, and other factors. For example, you’ll notice that just four very broad summarized types (See section 1 of the soils key, “Dominant global soils” in Fig. 3.8) cover the vast majority of the earth’s surface, and can be organized into a rough typology of precipitation from wet to dry, along with their age and vegetation types (e.g. tropical and subtropical forests; other forest types; grasslands, and desert vegetation). Soils formed by temperate grasslands have been hugely important in recent history because once humans developed steel plows that were sufficiently strong to til prairie soils, these Mollisols could be farmed and became the breadbaskets of the modern era (e.g. the U.S. and Canadian Great Plains, the Ukraine, the Argentinian pampas). There are also small pockets of soils globally that depend strongly on their original parent material. Andisols or volcanic ash soils are an excellent example of this: although their global extent is minuscule and even invisible on our map (Fig. 3.8) at this scale, they often occur in areas with high population densities such as Ecuador, Japan, and Rwanda. The high densities of population are not an accident but occur exactly because these soils have high fertility potential and have become extremely important in these local food systems. The simplified global soils map is also a way to spatially conceptualize a number of key limiting factors in soils that food producers must face: acidic, P-retaining soils in highly weathered tropical and subtropical soils, P retention in volcanic soils, and the risk of salinization of soil in dry climate soils.
In addition, it is worth noting that the broad swaths of soil of young to moderate age and with moderate to high fertility (light green in our map) may be the dominant type of soil in the world and also includes many areas that are critical in terms of the sustainability outcomes for human-natural systems in relation to soils. Because these tend to be “medium-everything” soils (medium age, medium fertility, medium depth, medium pH, medium moisture, etc.) they do not actively dissuade human systems from occupying them with high population densities or intensity of management and production, especially as the global population increases. However these soils are often easily degraded, and so sustainable methods are especially important to guarantee future food production.
Finding out information on soils using the soil order suffix in the name of the soil according to the USDA soil taxonomy system.
Soil taxonomy is an enormous classification system that can initially be confusing. But knowing the first level of classification can be very useful, just like knowing whether an animal is a whale or a beetle is extremely helpful compared to not knowing anything. To classify soils broadly as to their limitations and productive potential, we can use the soil orders of the USDA system (see the order names in parentheses, in Fig. 3.8).
The key below will help you to use the last few letters of a USDA soil name, along with the ISRIC world soil mapping resource to query what types of soil are present around the world or specifically in your capstone regions. The categories are the same as what is presented in Figure 3.3, and you can use the query function in the ISRIC world soil mapper to find out what USDA soil names are present in each area, and draw conclusions about the potential fertility and properties of the soils at a broad level.
First, see the ISRIC resource is at SoilGrids [123]. This was also used in the formative assessment for Module 3.1.
In the ISRIC mapper you will need to click on layers icon in upper right and set the layer to “Soil Taxonomy: TAXOUSDA” and select the “All TAXOUSDA subclasses” -- when you query the map using a right click of the mouse, you’ll get a percent breakdown of the different soil orders at that location.
| Soil name ending | Meanings | Example |
|---|---|---|
| -Epts -Ents -Alfs |
Entisols : soils of recent deposition, no soil development.
Inceptisols: the beginning of soil formation – medium to high fertility soils Alfisols: broad class of medium age, medium to high fertility soils |
Glossoboric hapludalfs
Orthents |
| -Ols | Mollisols: prairie soils, high organic matter, generally neutral pH, fertile, deep | Dystric haplustolls |
| -Ids | Aridisols – dry region soils, generally high pH | Argids |
| -Ods | Spodosols – coniferous forest soils with acid needle litter leaching features | Orthods |
| -Ults -Oxes |
Ultisols – warm region, old, leached soils
Oxisols – oldest tropical soils formed only of weathering remnants, metal oxides |
Udults |
| -Ands | Andisols- volcanic ash soils | Vitrands |
| -Erts | Vertisols – highly weathered limestone, with shrink-swell clays. | Uderts |
5 Nevertheless, you may peruse this impressive global resource and the soil horizon definitions at ISRIC [124].
Formative Assessment: Mapping Trends in Soil Properties
Formative Assessment: Mapping Trends in Soil Properties
Instructions
You will complete an activity on mapping trends in soil properties using an online soil mapping resource. The emergence of tools such as this to visualize global and national soil data easily and with full public access is revolutionizing information about soils and management constraints in different regions of the world. Please download the worksheet so that you can fill it in (either on paper or preferably just by writing in your responses in MS Word).
The two web resources you will need for this worksheet are placed here so you can access them while you fill in the worksheet.
Mainly you will need the International Soil Resource Information Centre's soil mapping resource of the world, Soil [123]Grids [123]. Click past the intro window that will appear in the center of the screen and then pan the map to the area of interest as identified in the worksheet.
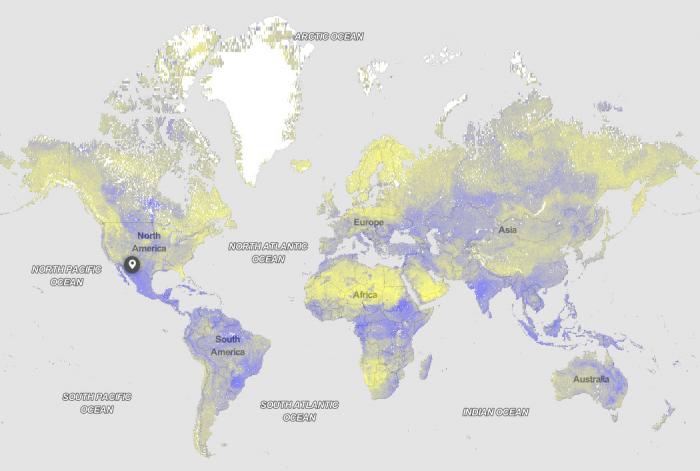
This is a mapping portal that resembles google earth - you have the ability to pan, zoom in, drag the map with the cursor and mouse (Fig. 5.1.7). When you enter you should see a toolbar in the top right corner. More instructions on the portal are given on the formative assessment worksheet.
You will also need briefly, this online map showing global annual total precipitation [125].
Files to Download
Download the Worksheet [126] to complete your assessment.
Submitting your assignment
Please submit your assignment in Module 5 Formative Assessment in Canvas.
Module 5.2: Soil Nitrogen and Phosphorus: Human Management of Key Nutrients
Module 5.2: Soil Nitrogen and Phosphorus: Human Management of Key Nutrients
Introduction
Nutrient Cycling and Nutrient Management for Soils in Food Production
In module 5.2, we present a basic account of nutrient cycling and nutrient management in food production systems. When we talk about nutrients in this context, we are referring to the nutrients that are needed to grow crops which are taken up from soils by the roots of crop plants. These include the important nutrients nitrogen (N) and phosphorus (P) which will form the focus of this module. We refer to N and P as "important" nutrients because they are needed in large quantities, relative to the amounts that are readily available in many soils. In agricultural and ecological terms, we say that crops and food production are especially responsive to N and P abundance: a shortage of N or P causes dramatic declines in production of food, while sufficiency and abundance will raise yields so that N and P supply have been a focus of human management to maintain food production. We will begin by talking about the way that N and P move around in cycles in all ecosystems, including the agroecosystems that are managed by humans to produce food. Human management systems in agriculture thus play a major role in altering the cycles of these nutrients in order to maintain, and in some cases increase the production and supply of food from farmland (farmed soils). This management can also negatively impact water quality in watersheds, as you saw in module four. We will also understand the way that soil organic matter (SOM) relates to these two major nutrients and soil productivity, as well as the general concept of soil depletion and soil regeneration as these relate to strategies of soil management in food production.
What is Nutrient Cycling?
What is Nutrient Cycling?
In module four, and in your education previous to this course, you've learned about the water cycle, in which water evaporates from bodies of water, condenses into clouds, and then is returned as rain to drain again into groundwater, lakes, and oceans. Each of the major crop nutrients, and most chemical elements on the earth's surface, has a similar cycle in which the nutrient is transported and transformed from one place to another, spending time in different 'pools', analogous to the division of water into lakes, rivers, clouds, rain, and the ocean. Just as rainwater and groundwater may be of more immediate use to crop plants than the ocean, different pools of the same nutrient differ in availability to plants. For example, most soils hold a tremendous amount of nitrogen in large organic molecules, but only the smaller soluble pool, and some smaller molecular forms of N, are directly available to plants. The way that soil nutrients move through the earth system, including within food production systems, is called nutrient cycling. The objective of this module is for you to understand the main features of nitrogen (N) and phosphorus (P) cycling in human-managed soils. Earth scientists sometimes use the term "biogeochemical cycling" to emphasize that each nutrient’s cycle represents the geological and atmospheric sources of the nutrients, the biology of organisms that often transform nutrients from one form to another, and the chemical nature and interactions of each element.
As an example of biogeochemical cycling, think of the important element carbon (C). Carbon has a chemical nature that allows it to be a fundamental molecular building block for all living things. In addition, there is an impressive atmospheric pool (a sort of geologic pool) of non-organic carbon dioxide. Interacting with this atmospheric pool, green plants and algae play a fundamental role in turning atmospheric CO2 into biological organic carbon in living things and the remains of living things, such as plants, that fall back into the soil. Scientists refer to this large set of interacting parts with geological, biological, and chemical attributes, earth's system that "processes" and recycles carbon in a certain sense, as the biogeochemical C cycle. Another example is phosphorus (P), which will be described in more detail on the following pages: The earth’s crust is the primary source of all P, which is then weathered by geological and biological processes and also in human fertilizer factories, held or retained strongly by soil clay minerals after application by farmers, and eventually occupies a key role in every living thing as one of the elements within the DNA molecules encoding our genes. It’s essential to realize that humanity and human systems are now major players within these nutrient cycles including C, P, and nitrogen. We can see this in activities such as mining (and eventually threatened depletion) of phosphorus sources for fertilizers or fixing of large amounts of nitrogen for fertilizers with a massive expenditure of energy and emission of carbon dioxide through the use of oil and gas.
Soil Depletion and Regeneration: Human Management of Nutrients in Soils
Soil Depletion and Regeneration: Human Management of Nutrients in Soils
The proper management of soil nutrients in soils for human food production boils down to a simple requirement: the need to replace nutrients that are "subtracted" from soil during production. These subtractions occur as nutrients are taken up by crops from the soil and then exported as food products in crops and livestock. Nutrients can also be lost to soil erosion and in dissolved forms, by drainage of water from the soil (called leaching). The goal of incorporating manure, plant material, and chemical fertilizers by farmers is to add back these subtracted nutrients. In the case of soil erosion, the idea is to avoid such losses completely by protecting soils. Human-managed fields and farms can be compared to nutrient bank accounts, where withdrawals must be balanced by deposits, and where it is better to have a substantial balance than a minuscule balance. Natural systems like forests or prairies lose some nutrients as does a farm field, but to a comparatively minor degree (fig 5.2.1 below). The need for humans to replenish nutrients is much greater in any managed system like a crop field or pasture than in unmanaged forests or grasslands. This is especially true in intensive production systems of crops or animal forages, for example, the corn, vegetable, and hay fields and pastured rangelands that are typical in agriculture of the United States and around the world. In systems where soils are tilled to grow annual crops on hillsides, the combined exported nutrients in food and those lost to erosion can quickly rob a soil of most of its nutrients. Protecting a soil from these losses, and regenerating the nutrients lost by adding crop residues (straw, cornstalks, other stems, and roots), manure, and fertilizer materials (ash, phosphate rock, bone, chemical fertilizers) are therefore important strategies used by food producers to sustain production. We’ll devote more focus to the important role of crop species, crop rotations, tillage, and soil erosion as part of agroecosystems in modules 6 and 7. For now, we want to understand the basics of these principles of soil regeneration.
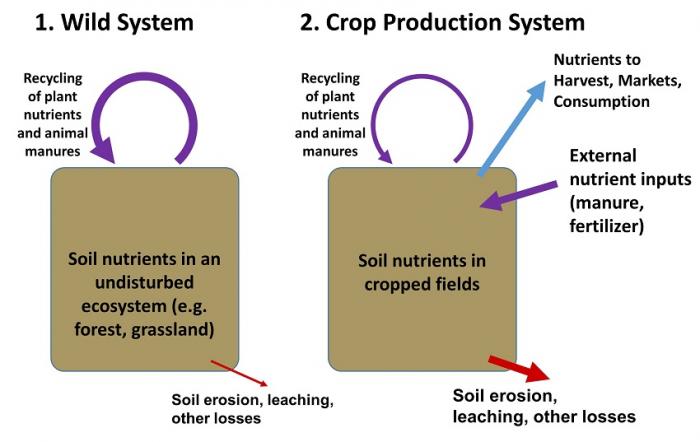
Depletion and Regeneration of Soil Organic Matter
Depletion and Regeneration of Soil Organic Matter
Soil Organic Matter as a Soil "Master Variable"
In addition to individual nutrients like N, P, potassium (K) and calcium, an overarching aspect of soil depletion and regeneration by human food producers is the important role played by soil organic matter (SOM) and the potential to either to deplete or sustain organic matter in soils (recall figure 5.1.1 and the fact that organic material is one of the key solid components of soil). In particular, concerns about soil organic matter (SOM) center on the large amounts of organic carbon in large molecules of SOM. This soil organic carbon (SOC) both feeds microbes in soil, allowing them to perform nutrient cycling functions and also contributes positively to soil properties. SOC is not a plant nutrient that comes from soil. In fact, it actually comes originally from the atmosphere in the form of plant remains that contain carbon fixed by plants (roots, leaves, manure, rotting wood, etc.) and accompanies N, P, and other nutrients that were in the plants. SOC within soil organic matter plays so many important roles in soil function and soil fertility that it should be considered a “master variable” explaining soil productivity, along with soil pH, soil depth, and soil drainage. Among its other functions, SOM promotes soil storage of crop-available water, is a major food source for soil microbes that perform beneficial roles in soil, and fosters the availability of many nutrients by holding them in moderately available form or decomposing to release them in soils. In addition, by far the largest pool of nitrogen in soils is held in N atoms within many types and sizes of soil organic molecules, and also within the bodies of soil microbes.
In many food production systems where the soil is plowed (also called tilling or tillage), SOM is in fact depleted by oxidation (a “slow burn”, like iron rusting) when soils are broken apart by plows, hoes, and other implements. Therefore, an important part of soil regeneration by human food production systems is not just replacing nutrients in a pure chemical form like fertilizers, but also maintaining overall soil function with soil organic matter. Therefore, in most parts of the world farmers have developed ways of reincorporating the roots and stems of plants (crop residues) as well as manure made by animals from the forage crops fed to them. These sources of plant carbon sustain SOM over the long term and feed microbes. These ways of sustaining the nutrients and organic matter of soils are depicted with a coupled human-natural systems diagram below (Fig 5.2.2) as a type of feedback loop in which human systems respond to soil degradation by incorporating organic matter like residues, compost, and manure.
The following brief reading assignment further illustrates the important functions of organic matter.
Reading Assignment
Building Soils for Better Crops, pages 9-17 in Chapter 2: Organic Matter: What It Is and Why It’s So Important. [118] (Free e-book as downloadable PDF). This chapter and book will be used in modules 7 and 9.
Activate Your Learning
The following exercise asks you to use graphical data based on real soils to make conclusions about the important role of SOM in the water-holding capacity of soils. Along with the materials in module 4 on water and food production, and the systems approach to soil management in module 7, these concepts should help you to appreciate the role of SOM in fostering the environmentally sustainable production of food, as well as resilient systems (see module 10) that can deal with drought stress.
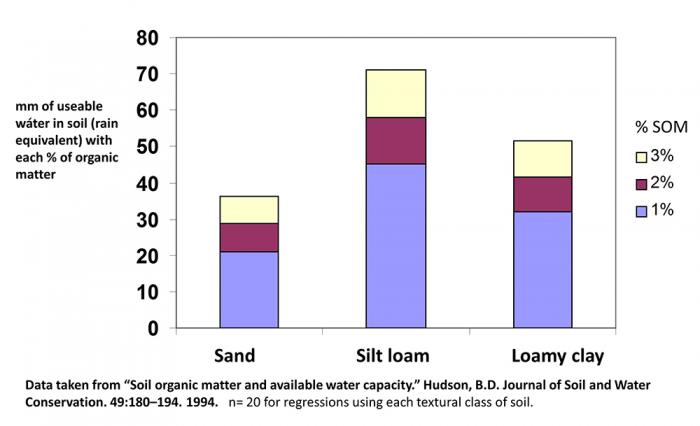
Examine Fig. 5.2.2, which draws on about sixty soils analyzed in a publication that related the water-holding capacity of soils to their organic matter content. The graph summarizes that data as the height of three columns on a bar graph. The height represents the amount of water stored in each soil, imagined as a depth of water in mm covering the soil at its surface (this is also how irrigation managers imagine applying water to soils, as the mm of rainfall they have replaced with irrigation). Each column represents a type of soil, from a coarse-textured sand on the left to a "heavy" or clayey soil on the right. The stacked colors on the graph represent the way that organic matter is able to improve the water-holding capacity of soils. Answer the following questions.
The Nitrogen Cycle and Human Management of Soils
The Nitrogen Cycle and Human Management of Soils
Nitrogen (N) is one of the most important nutrients for plant growth and crop production, along with phosphorus (P) considered on the next page. Nitrogen is important because it is used by plants to create proteins, which include the enzymes and building blocks of their photosynthetic "machinery". In fact, nitrogen in some ways underlies the green color of plants and vegetated areas on the earth's surface, because of the green, N-containing chlorophyll proteins (enzymes) used in photosynthesis (see module 4), which along with the other photosynthetic enzymes is one of the major uses of nitrogen within plants. These plant proteins become animals protein when plants are fed to livestock, or when we eat plants. The ubiquitous nature of nitrogen for the protein needs of the earth's biosphere explains why N is such an important nutrient for plant growth. Nitrogen is, therefore, a key element in the entire food system and interacts very strongly with human management. One indication of nitrogen's importance to the food system is that humans currently expend more energy on creating N fertilizers for food production by taking N2 out of the atmosphere in fertilizer factories (Fig. 5.2.3) than is spent on any other nutrient.
This module focuses on the subject of nutrient cycling, and below in figure 5.2.3, we present a basic diagram of the nitrogen cycle. Your initial impression of the diagram may be its relative complexity compared to the water cycle, for instance. This is true: the N cycle is complex, starting with the fact that it involves gas, solid, and liquid forms: gaseous N in the atmosphere, solid forms of N in soils and plants, and N dissolved in water in the soil and in earth's waterways (you may remember the problem of N pollution in waterways from module 4). To simplify this and take away the key concepts which should be your goal in this module (entire courses can be taught on the N cycle), we will present the basic pathway of N from the atmosphere into plants, soils, and water, which will complement the caption for the N cycling diagram below. Please refer to Figure 5.2.3 throughout this description. First, N exists in an enormous reserve as 78% of the earth's atmosphere (top left of Fig. 5.2.3). Creating usable forms of nitrogen requires that this N2 gas is "fixed" in the same way that plants fix carbon into their carbonaceous stems and leaves. Legume plants like beans, peas, and alfalfa host bacteria in their roots in nodules that are able to fix N2 gas (more on legumes as an important crop family in module 6). Nitrogen then moves directly into legume plants' tissues as proteins. In parallel to this biological fixation of N, humans have designed industrial methods to fix N in factories, using energy from petroleum and natural gas, and creating soluble nitrogen chemicals that are applied to soil, where they dissolve in soil water to become part of the pool of soil soluble N that is available to plants. This pool of soluble N (light green oval within the soil N pool below) is also called inorganic N to contrast it from organic N in proteins, crop residues, and soil organic matter. Inorganic N taken up by plants, plus the N fixed by legumes, is then used to grow crops and eventually produce crop- and livestock-based food products. Meanwhile, organic "waste" products from growing crops like straw, cornstalks, and roots, plus animal manures which are undigested plants, are not "waste" at all but are a hugely important organic source of N and other nutrients that are recycled to soil (brown arrows in Fig. 5.2.3). These organic soil inputs applied by farmers help to maintain soil organic matter (SOM; see previous pages and the assigned reading on soil organic matter) including the largest pool of soil N within SOM and soil microbes. Soil organic matter can be decomposed by microbes, liberating additional amounts of N to the inorganic N pool. µbes also can take up soil inorganic N, reversing the effects of SOM decomposition.
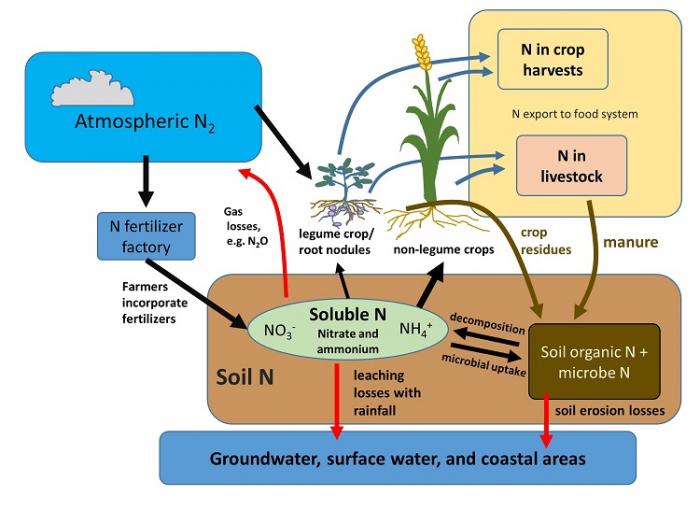
So far the N cycle may appear a relatively neat and ingenious system (albeit quite complex!). However, it is important to highlight the ways that it can become problematic under human management, indicated by the red "loss" arrows in Fig. 5.2.3. First, when the soluble N pool in soil is large, for example after fertilizer or manure is applied, and abundant water moves through the soil, like during a rain event, excessive soil N can move into waterways causing pollution and coastal dead zones (this is covered in some detail in module four, and again in this module's summative assessment). This process is called leaching of soil soluble N. Second, when erosion occurs, soils can also lose large amounts of their N "bank account" through erosion, because solid organic matter particles are rapidly eroded from soils in hilly areas when soil is not protected by plant cover or stabilized by plant roots. Lastly, soils can lose nitrogen back to the atmosphere through the processes of gaseous loss, where dissolved nitrogen becomes N-containing gases that diffuse back to the atmosphere. If you have ever caught a whiff of ammonia from a bottle of ammonia cleaning solution (dissolved ammonium that becomes ammonia gas) you know how N can move from a solution like that in a wet soil into the air. The most serious of these gas loss pathways is nitrous oxide (N2O) which is of concern because it is a potent greenhouse gas that contributes to global warming.
All of these loss pathways create the impetus for farmers and the food systems that support them, to manage nitrogen in an efficient and non-polluting way. The idea that highly productive farming systems with annual crops, manures, and fertilizers can completely eliminate N losses is actually quite challenging. This is because the N cycle has so many participants (humans, plants, microbes, livestock) interacting in complex ways (note: a complex system!), and because nitrogen is inherently "flighty" and "leaky", never staying put and always in transformation, with some forms so easily lost from soils to rivers, lakes, and the atmosphere. Nevertheless, there is much room for improvement that can also serve to save money and energy for food producers, and avoid the pollution costs to downstream ecosystems and food producers (for example, fishing communities affected by dead zones, see module 4). Two of these are (1) increasing the efficiency of timing and amounts of N fertilizer and manures to better match only what is needed by crops and (2) including crops and other plant components on farms that help to recycle soluble N from deeper in the soil and in downslope areas before it reaches waterways. Both of these strategies are addressed in the following modules on crops and systems approaches to soil management (modules 6 and 7). In addition, if N is not replenished in soils after it is exported as food products or suffers these losses, crops can face N insufficiency, which is a major issue for poorer farmers around the world. The summative assessment for this module focuses on these twin issues of nutrient deficiency and excess.
The Phosphorus Cycle and Human Management of Soils
The Phosphorus Cycle and Human Management of Soils
Basics of The Phosphorus Cycle in Food Production
In an analogous way to the nitrogen (N) cycle on the previous page, we will present the basics of the phosphorus (P) cycle related to food production (refer to figure 5.2.4 below in this section) You'll note that the P cycle is a good deal simpler than the N cycle. For example, there is no gaseous form of P as there is for N, so the atmosphere does not participate in the P cycle. Also, leaching of soluble P is not a major issue as it is for soluble soil N. To begin the description of the P cycle, the large reserve of "primary" P that is accessed by plants and fertilizer production for agriculture is not the atmosphere (as it is for N), but rather so-called phosphate rocks (or rock phosphate) in the crust of the earth, which are mined like other minerals. These rocks are ground up and treated in fertilizer factories to make the phosphate (PO4-) in them water-soluble so that phosphate can be directly taken up by plants from the small pool of soluble phosphorus in soils. In addition to this industrial process that supplies P to plant roots, there are small amounts of soluble P that are continually released by weathering (see Module 5.1) of grains of rock phosphate that form a small part of most soils. These plant-available forms of P from fertilizers and weathering are taken up by plants and pass into the food system when crops are harvested for food products or are fed to livestock. Just as for N (figure 5.2.3), crop residues and manures with organic P are recycled to the soil and are an essential way of replenishing soil organic P supplies. Also, decomposition of soil organic P that liberates soluble P, and uptake of P into the bodies of microbes, link the organic P pool in soil organic matter (SOM) with the small amount of soluble P in soils.
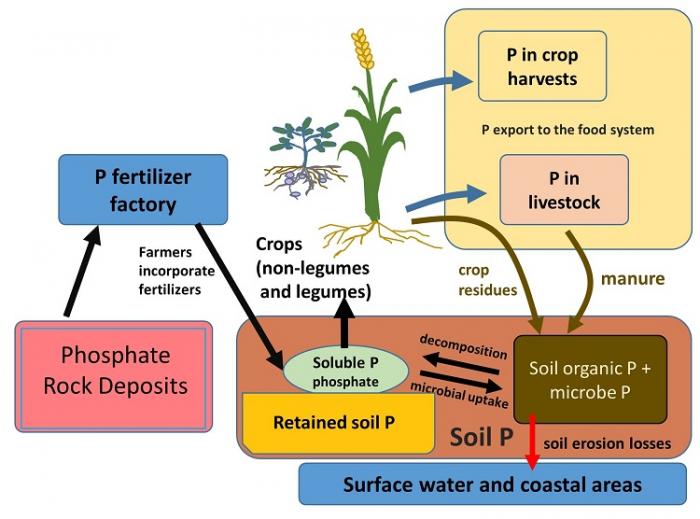
P retention in soils and management responses: "clingy P" versus "flighty N"
One difference between the cycling of P vs. N in soils is the fact that most soils have ways of chemically capturing and holding soluble P in forms that can become very unavailable to plants. The clay mineral fraction of soils is especially active in retaining P, especially so for the clays that occur in tropical soils (you may be familiar with rusty or yellow-colored clays, made from iron oxides, in warmer areas of the United States and the world). This is called soil retention or fixation of P. In a soil that retains P strongly, less than five percent of the P in applied fertilizer, which enters in a soluble form very suited for plant uptake, is ever available for crops. The rest is quickly locked away by reactions with soil clay minerals. Soil scientists call this process P fixation or P retention, and a global map of estimated P retention has been made (Figure 5.2.5) that summarizes how phosphorus can become limiting to food production, which is a serious problem in many tropical soils. One comparison that may be helpful in remembering the way that soil locks away phosphorus is to contrast it to the behavior of soil N. While soil N is "flighty" or "leaky" with multiple forms and loss pathways, soil P tends to be the "clingy" opposite of soil N -- the issue is not that it is held too loosely in soils but rather that it is held too tightly.
To address the challenge of retained P, farmers may resort to continually supplying fertilizers and manures to crops, often in quantities that greatly exceed crop demand. Nevertheless, additions of organic matter also tend to make retained or fixed P more available, combined with the use of crop species that can better take up fixed forms of P, so that P is moved from the retained, unavailable fraction of P to organic forms in crop and microbial biomass that are eventually recycled into available soluble forms. Certain plant-symbiotic soil microbes, especially mycorrhizal fungi, are particularly efficient at helping plants to access these less soluble forms of soil P. In addition to these soil management measures, first farmers, and now formal plant breeders have developed crop varieties that are more efficient in taking up some of retained P that is locked away in soil.
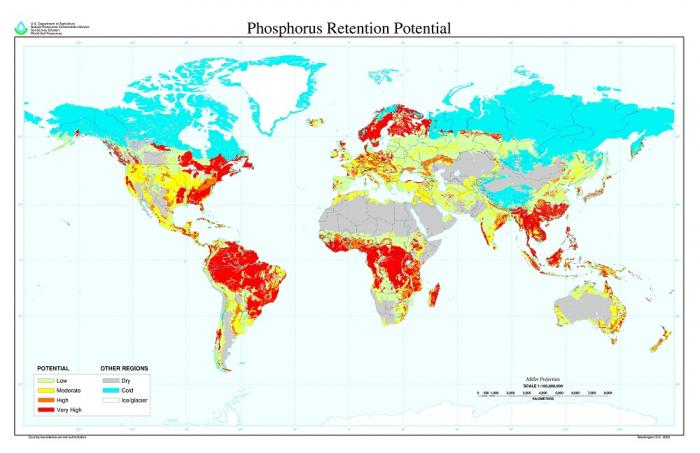
Soil Erosion and P
As can be seen in Fig. 5.2.4, erosion of particles of soil that contain organic and retained P is the major pathway of phosphorus loss from soils (red arrow in Fig. 5.2.4), in contrast to P export for useful purposes in crop- and livestock-based foods. Along with maintaining the availability of soil P with regard to P retention, protecting soils against erosion is an excellent way to protect the ability of soils to supply P for food production. This main message will be taken up in the summative assessment for this module, and again in Module 7.
Activate Your Learning: phosphorus nutrients required for different foods: a per-acre versus per-person approach
One of the important factors in deciding how much P must be added to soils to replenish them is the amount of P that is exported by typical crops and food products. This exercise will guide you in calculating the amounts of P that leave farm fields on a per area basis, and also at the level of a "phosphorus use footprint" for typical products, analogous to a water footprint in module 4. Consider the table below which reports the use of P to produce unit quantities of a few representative foods. The first column (A) reports very approximately how much a single hectare of soil (100 by 100 m area, about 2.5 acres) will support. The second column (B) is the content or concentration of phosphorus in the food, which means that multiplying A x B gives the kg P exported from the soil by the crop or animal product, which is shown in C. Columns D and E take a slightly different approach: in D the amount of the product eaten by an average U.S. person is reported. In column E, that per-person amount is turned into a per-person consumption of phosphorus in grams (per year)
| Food crops |
(A) kg of fresh product or animal weight sustained per hectare (100 m x 100 m) |
(B) Phosphorus content of the fresh food (g P/ kg fresh wt.) | (C) kg P exported from soil, per Ha (100 m x 100 m) | (D) Per person consumption of product in the U.S. (kg per person per year) | (E) Per capita consumption of soil P resources (g P per person per year) |
|---|---|---|---|---|---|
| carrots | 10000 | 0.35 | 3.5 | 3.2 | 1.1 |
| wheat | 3500 | 7.6 | 27 | 61 | 464 |
| beef | 250a | 7 | 1.8 | 50 | 350 |
| milk | 10000b | 3.6 | 36 | 20 | 72 |
Table assembled by the author from publically available data on typical yields and nutrient content of agricultural products. For example for yield data see National Agricultural Statistics Service (NASS) of the USDA [127] for crop nutrient content see National Resource Conservation Service's Crop Nutrient Database [128]. For nutrient values of foods such as beef and milk see the USDA food composition database [129].
aAbout the equivalent weight of half a beef cow/steer
bVery roughly a single production cycle (about 12 months) in liters for a single, lactating cow of a high-production variety
Soil Nutrients: Human Systems Aspects
Soil Nutrients: Human Systems Aspects
Soil Nutrients: The Sustainability Issues of Shortage and Surplus
Both N and P are distinctive in possessing extremes of surplus and shortages across the variety of food production systems around the globe. For poorer small-scale farmers, who number more than two billion globally, the means to effectively replenish the nutrients exported by crops, or detain the nutrients removed by erosion on sloping land can be beyond the reach of their financial means or labor power, or simply not sufficiently part of their knowledge systems. Deficits of nitrogen and phosphorus in soils ensue, complicated by soils that may have a high degree of P retention, and low organic matter levels that decrease the overall soil quality by retaining less water and crusting easily, aspects that will be emphasized in the following modules. Applying the "bank account" analogy of soil nutrients introduced at the beginning of this module, after constant withdrawals the "soil bank account" begins to run such a low balance that overall functioning of soil productivity, and with it the livelihood of a smallholder household, are impaired. This can lead to a downward spiral of soil productivity (see the assigned reading for this module) that links issues of environmental, social, and economic sustainability.
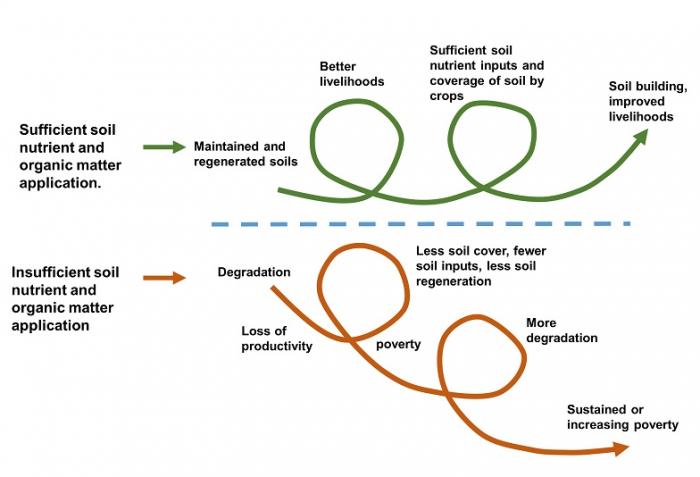
Another feature of human-natural interactions for soil nutrients is the aspect of surplus exhibited by a "leaky" or "flighty" nutrient like nitrogen. This has been compounded by the development of the large-scale human capacity to add surplus nutrients to farm fields for food production. It's important to realize that prior to N fertilizers, bacterial nodules on the roots of legume crops (see Fig. 5.2.3 and the coverage of legumes in module 6) were the major way that N entered soils from the atmosphere, including the soils used for food production. Farmers before about 1900 relied exclusively on legume crops, as well as animal (and human!) manures derived from legumes and other crops as the principal way of regenerating the nitrogen in soil organic matter. These materials incorporated to soils decompose and release N that was used by crops. Since 1913, when N fertilizer production from the atmosphere was developed as a factory process, humanity has deployed greater and greater amounts of fossil fuel energy to fix greater and greater amounts of atmospheric N2 into soluble forms to feed crops. A startling fact is that humans now fix more atmospheric nitrogen than do legumes. This has buoyed the overall productivity of human food systems beyond what might have occurred without such fertilizers and is credited by many with avoiding widespread hunger (or dramatically expanding the population carrying capacity of earth’s human-natural systems, depending slightly on the perspective that is taken).
As has been noted in module 4, there have been unforeseen consequences of this trend towards greater fertilizer use that have become more evident in recent years. First, the share of CO2 greenhouse gas emissions from fertilizer production has become a primary contributor to the overall impact of agriculture on global warming. Another is that fertilizers, in combination with a profit-minded vision of soil fertility that did not incorporate a view of the whole human-environment system, bred a highly “chemical” vision of soils that neglected the important role of soil organic matter and the physical and biological qualities of soil. This resulted in unforeseen negative impacts as farmers over-applied nutrients at a local scale to guarantee the highest yields possible, thereby polluting watersheds, and allowing farmers to lose sight of the important role of soil organic matter outlined in this module. In a more subtle way, there has been an increasing focus in plant breeding and globalized seed systems on varieties that respond well to soluble fertilizers, which many argue have favored the expansion of more industrial modes of food production to the financial detriment of smaller and more sustainable food producers. If you recall the narration of agricultural history in module 2, you will recognize that this is an example of niche construction, in which a modern, chemical-intensive niche has been created for specially bred modern varieties along with fertilizers and other chemical inputs. Nevertheless, many of these problems associated with an exclusive reliance on nitrogen fertilizers and chemical fertilizers are now recognized by researchers and policymakers. Current approaches to soil the world over have placed renewed emphasis on the importance of organic matter and a more economical use of nitrogen fertilizers.
In the summative evaluation for this module, you will explore these “surplus and shortage” issues of sustainability for Nitrogen and Phosphorus, which are emblematic of present-day and future sustainability challenges in the area of nutrients cycling.
Summative Assessment: N and P Balances
Summative Assessment: N and P Balances
Introduction
The last page of module 5.2 mentions the twin issues of deficit and surplus that are principal challenges in the management of soil nutrients. The exercise in this summative assessment requires you to use real data on nutrient inputs and outputs from two systems to create nutrient balances, and then analyze the situation of nutrient balance or surplus. These systems are the Ohio River sub-basin of the Mississippi River basin and measurements of nutrient flow from hillside farming in the Bolivian Andes. You should do this activity with a partner or small group in class, and prepare to discuss your results with the class. You will use data from a table to answer questions on the assessment worksheet (download below).
In analyzing the twin issues of nutrient surplus and nutrient shortage in soils and food production systems, you'll be practicing a geoscience "habit of mind" of systems thinking. In other words, to examine the wider impacts of nutrient management or the causes of soil infertility, we need to expand our focus from a single field to a landscape or river basin and think about a web of linkages between farmers, nutrient supplies, economic factors, and watersheds, among other system components. This allows us to contemplate these challenges in the proper frame and over the right timescale.
Download the worksheet [130]to complete and use for the graded quiz. The worksheet contains information in a table that you will need to complete the assignment.
Submitting your Assessment
You do not need to submit the worksheet; you instead will be using it to complete a summative quiz.
Summary and Final Tasks
Summary
In this module, we have introduced the basics of soil properties and the nature of soil as a key resource for food production, which following modules will build upon to show how soils can be managed sustainably. We hope that you have understood the fundamental composition of soil as minerals, organic matter, water, and air as an essential part of earth's natural systems. We also have tried to illustrate the way in which key properties of soil, like its pH, nutrient content, and retention of water, affect how plants grow and produce food. On the human system side, we also presented the way in which human efforts have managed soil for sustained production of food, including the addition of nitrogen and phosphorus to replenish soil stores that are removed by crop harvests, and the protection of soils from erosion losses. However, a surplus of soil nutrients generated by over-applying N and P is also a problem, as illustrated in the nutrient balances in this module's summative assessment. We will continue to deepen your knowledge of sustainable soil management, as it supports sustainable food systems, during the next modules.
Reminder - Complete all of the Module 5 tasks!
You have reached the end of Module 5! Double-check the to-do list in the Module 5 Roadmap [131] to make sure you have completed all of the activities listed there before moving on to Module 6!
Further Reading
- Brady, N.C. and Weil. R.R. 2016. The Nature and Properties of Soils. Columbus: Pearson. A very readable and visual textbook that gives an extremely comprehensive treatment of soil science.
- Dybas, C.L.,2005 "Dead Zones Spreading in World Oceans [132]" Bioscience 55(7): 552-557 - freely available article in Bioscience journal.
- Scoones, I. (2010). Dynamics and Diversity: soil fertility and farming livelihoods in Africa, case studies from Ethiopia, Mali, and Zimbabwe. Earthscan.
Module 6: Crops
Module 6: Crops
Introduction
Agroecosystems are coupled Human-Nature Systems that are shaped by ecological and human socioeconomic factors.
Agricultural practices that humans use are determined by multiple agroecological factors including climate, soil, native organisms, and human socioeconomic factors. Usually, climate and soil resources are the most significant natural factors that determine the crops and livestock that humans produce. Although in some cases, to overcome climate and soil limitations, humans alter the environment with technology (ex. irrigation or greenhouses) to expand the range of food and fiber crops that they can produce. In this module, we will explore how climate and soil influence crop plant selection; crop plant characteristics and classifications; and some socioeconomic factors that influence the crops that humans chose to grow.
Goals and Learning Objectives
Goals and Learning Objectives
Goals
- Describe key features of categories of crop plants and how they are adapted to environmental and ecological factors.
- Explain how soil and climatic features determine what crops can be produced in a location, and how humans may alter an environment for crop production.
- Classify environments as high or low resource environments and interpret how both environmental and socio-economic factors contribute to crop plant selection (coupled human-nature systems); and the pros and cons of the cultivation of various crop types.
Learning Objectives
After completing this module, students will be able to:
- Define annual and perennial crops and list some examples of annual and perennial crops.
- Distinguish and explain why annual or perennial crops are cultivated in high resource or resource-limited environments.
- Explain some ways that farmers alter the environment to produce annual or perennial crops.
- Name some major crop plant families with some example crops.
- Explain the nutrient significance of legumes.
- Describe key plant physiological processes and how climate change may influence crop plant growth and yield.
- Classify major crop plants into types including plant families, temperature adaptation, and photosynthetic pathways.
- Formulate an explanation of the advantages and disadvantages of producing annual and perennial crops.
- Interpret what environmental, ecological, and socioeconomic factors influence what crops farmers produce.
- Distinguish some environmental, ecological, and socioeconomic advantages and disadvantages of producing types of crops.
Assignments
Module 6 Roadmap
Detailed instructions for completing the Summative Assessment will be provided in each module.
| Action | Assignment | Location |
|---|---|---|
| To Read |
|
|
| To Do |
|
|
Questions?
If you prefer to use email:
If you have any questions, please send them through Canvas e-mail. We will check daily to respond. If your question is one that is relevant to the entire class, we may respond to the entire class rather than individually.
If you prefer to use the discussion forums:
If you have any questions, please post them to the discussion forum in Canvas. We will check that discussion forum daily to respond. While you are there, feel free to post your own responses if you, too, are able to help out a classmate.
Module 6.1: Crop Life Cycles and Environments
Module 6.1: Crop Life Cycles and Environments
Climate, soil resources, and the organisms in the environment influence which food and fiber crop plants humans can produce. To overcome environmental resource limitations, humans also alter the environment to produce food and fiber crops.
Plant Life Histories
Plant Life Histories
Plants need light, water, nutrients, an optimal temperature range, and carbon dioxide for growth. In a natural environment, the availability of plant resources is determined by the:
-
soil fertility, soil depth, and soil drainage
- climate: the seasonal temperature and precipitation distribution
- competition with other plants, herbivory by other organisms, and pathogens
- the frequency of environmental disturbances (for example from fire, floods, and herbivory).
In some environments, nutrients, light, and water, are readily available and temperatures and the length of the growing season are sufficient for most annual crops to complete their lifecycle; we will refer to these as high resource environments for crop production. High resource environments tend to have soils that are fertile, well-drained, deep, and generally level, as well as growing seasons with temperatures and precipitation that are optimal for most plant growth. In general, in environments where competition for resources among plants is low, annual plants with more rapid growth rates tend to dominate (Lambers et al, 1998). Consequently, humans tend to cultivate annual plants with high growth rates in high-resource environments.
By contrast, in low-resource environments plant growth may be limited due to soil features and/or climatic conditions. Soils may be sloped, with limited fertility, depth, and drainage; and/or the growing season may be short due to extended dry seasons and/or long winters (with temperatures at or below freezing). In natural ecosystems, resources can be limited due to competition among plants, such as in a forest or grassland where established plants limit the light, water, and nutrients for new seedlings. And in these environments where resources are limited, plants with slower growth rates and perennial life cycles tend to succeed (Lambers et al, 1998), and perennials are often the primary crops that humans cultivate in resource-limited environments.
Annuals
Annuals
Annual plants grow, produce seeds, and die within one year. In general, annual plants evolved in environments where light, water, and nutrients were available, and they could consistently reproduce in one year or less. Where resource availability is high, plants that can germinate and grow rapidly have a competitive advantage capturing light, nutrients, and water over slower growing plants and are more likely to reproduce. To ensure the survival of their offspring, annuals allocate the majority of their growth to seeds (often contained in fruit); and they tend to produce many seeds.
Human selection of annual crop plants typically further selected for large seeds and/or fruit. Some examples of annual crop plants are corn, wheat, oats, peppers, and beans (see photos). What are some other examples of annual crop plants?
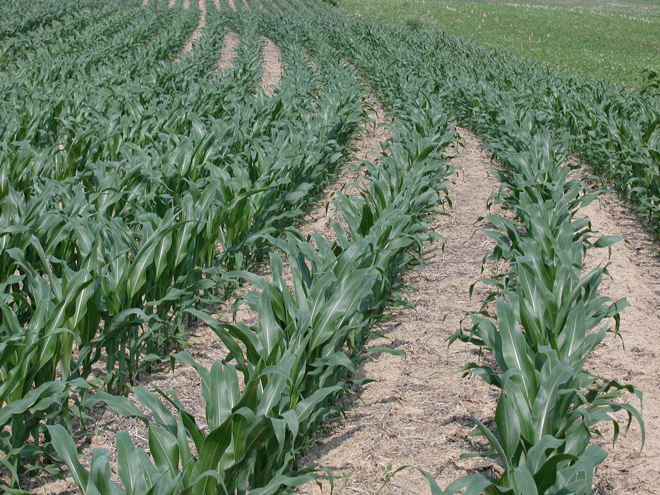
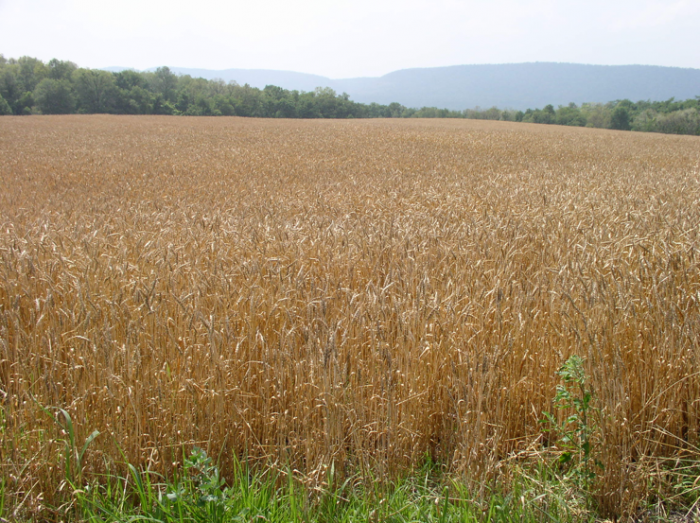
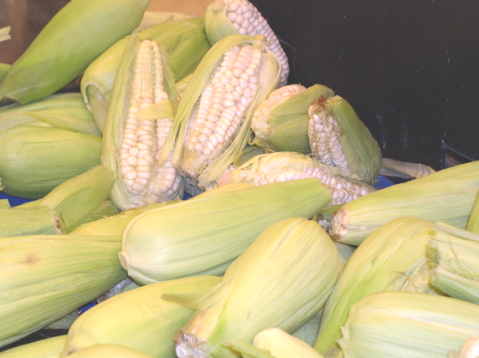
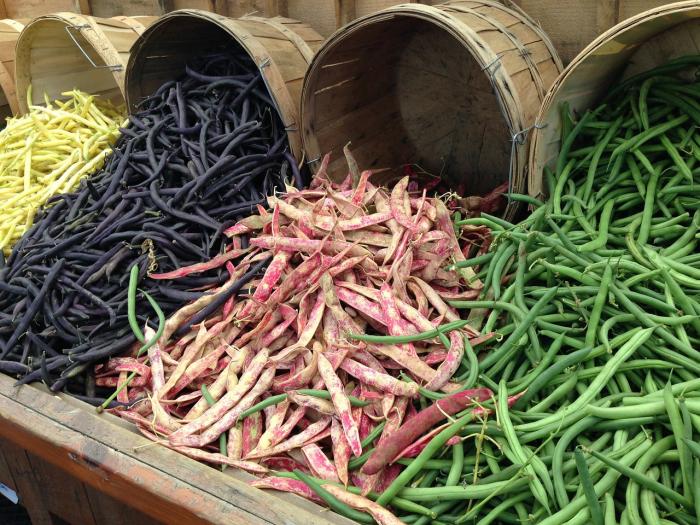
Annual crop plants are generally categorized into one of the three seasons that falls in the middle of their plant growth life cycle: spring, summer, or winter. For instance, summer annuals are generally planted in late spring, grow and develop through summer, and complete their lifecycle by late summer or autumn. Winter annuals are generally planted in early autumn and germinate and grow in autumn. Depending on how cold the winter is where they are cultivated, winter annuals may grow slowly in winter or become dormant until spring. In spring, they grow, flower, and produce seed by early to mid-summer (See Figure 6.1, Annual Crop Types). After an annual crop is harvested, in some regions farmers may be able to plant another crop, such as a winter annual crop after a spring annual crop, this is referred to as double-cropping (cultivating two crops in one year). If only one crop is cultivated in a season, the soil may be left exposed until the next growing season. Leaving crop residue on the soil can reduce erosion, but planting another crop with live plant roots and aboveground vegetation provides better soil protection against water and wind erosion. Alternatively, a cover crop may be planted after the harvested crop to protect the soil from erosion and provide other benefits until the next crop is planted. Cover crops are typically annual crops that can establish quickly; you will learn more about cover crops in Module 7.
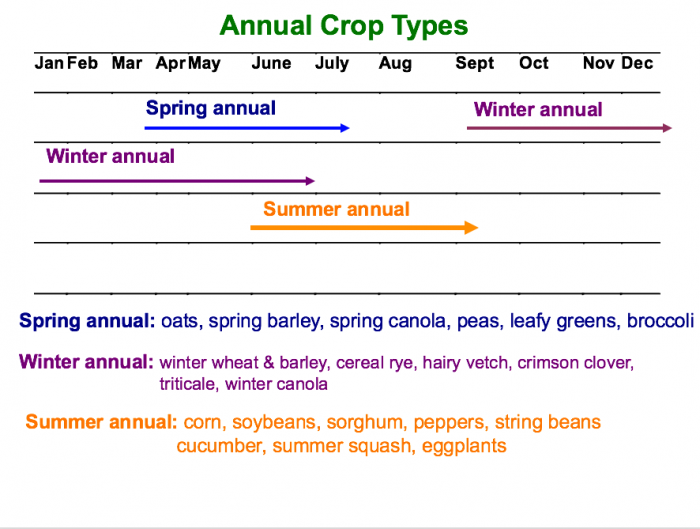
Spring annual (April-July): oats, spring barley, spring canola, peas, leafy greens, broccoli
Winter annual (September-July): winter wheat &barley, cereal rye, hairy vetch, crimson clover, triticale, winter canola
Summer annual (June-October): corn, soybeans, sorghum, peppers, string beans, cucumber, summer squash, eggplants
Perennials
Perennials
Biennials are plants that live and reproduce in two years, and at the other end of the life-cycle spectrum are perennial plants that live for 3 or more years. Perennials evolved in environments where resources were limited often due to competition with other plants and their growth rates tend to be slower than annual plants (Lambers et al, 1998). In these resource-limited environments, often plants cannot germinate from seed and reproduce by seed within one year. Therefore, to increase their opportunities for successful reproduction, perennials evolved ways to grow and survive for multiple years to successfully produce offspring. Perennial crops are typically cultivated in environments that may also have a climatic limitation such as a short growing season or dry climate, or where a plant's ability to access resources may be limited due to frequent disturbance such as grazing.
To survive for multiple years, perennials allocate a high proportion of their growth to vegetative plant parts that enable them to access limited resources and live longer. For instance, they often invest in extensive and deep root systems to access water and nutrients, or in tall and wide-reaching aboveground stems and shoots to compete for light, such as bush and tree trunks and branches. Perennials also store reserves to regrow after growth-limiting conditions such as drought, freezing winters, or disturbance such as grazing. Carbohydrates, fat, and protein are stored in stems and roots, or modified stems such as tubers, bulbs, rhizomes, and stolons. In many plant species, these storage organs can produce root and shoot buds that can grow into independent offspring or clonal plants; this is called vegetative reproduction. Although most perennials reproduce both through seed and vegetative reproduction, in resource-limited environments where plant competition is high, the large storage organs and their reserves offer vegetative offspring plants a competitive advantage over starting from seed.
Perennial Crops
Humans have cultivated and selected perennial crop plants for their vegetative plant parts, storage organs, fruit, and seeds. For instance, the leaves and stems are the primary plant parts harvested from perennial forage crops (crops in which most of the aboveground plant material is grazed or fed to animals). Horticultural perennial crops that are harvested for stems and leaves include asparagus, rhubarb, and herbs. And in some cases, a perennial crop's storage organs are harvested each year, limiting the plant's ability to complete its perennial lifecycle and effectively reducing its cultivated lifecycle to an annual. Examples of such crops perennial crops that are cultivated as annuals include potato, sweet potato, and taro, Tree, shrub, and vine food crops managed as perennial crops are typically cultivated for their fruit and seeds, such as apples, stone fruit (ex. peach, plum), plantains, nuts, berries, and grapes (see photos below).
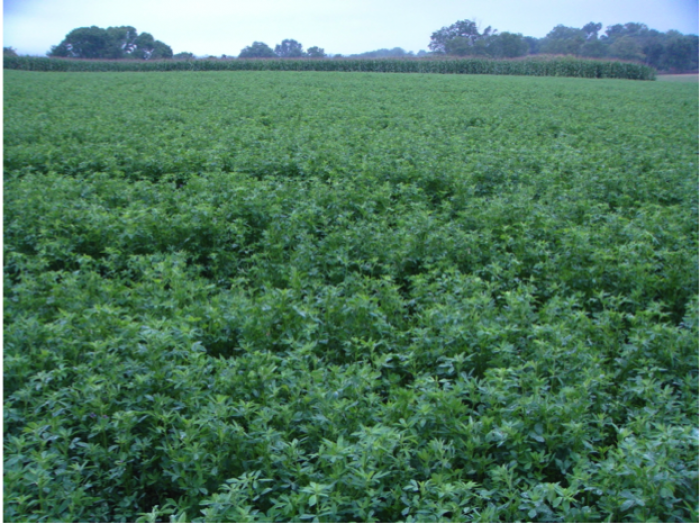
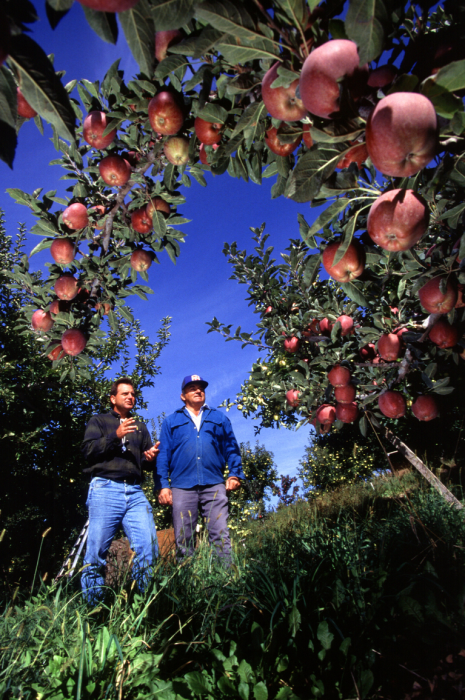
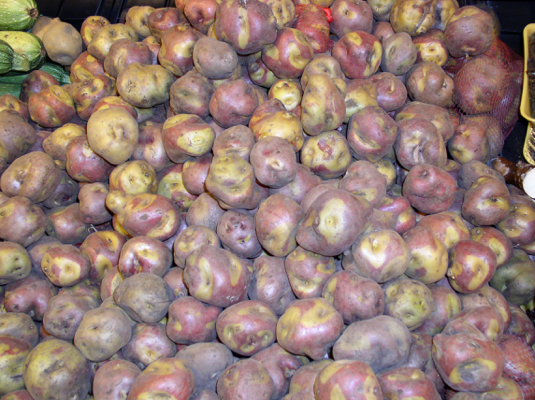
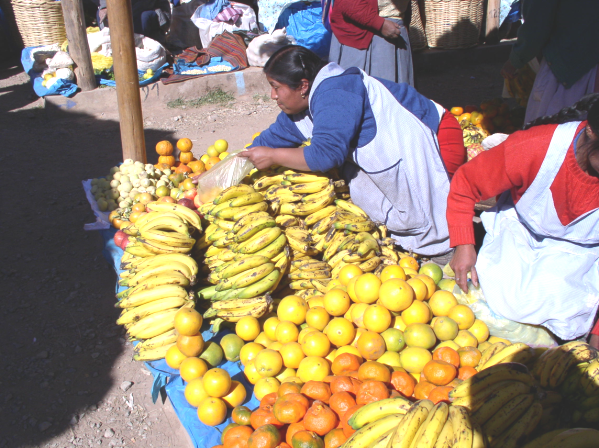
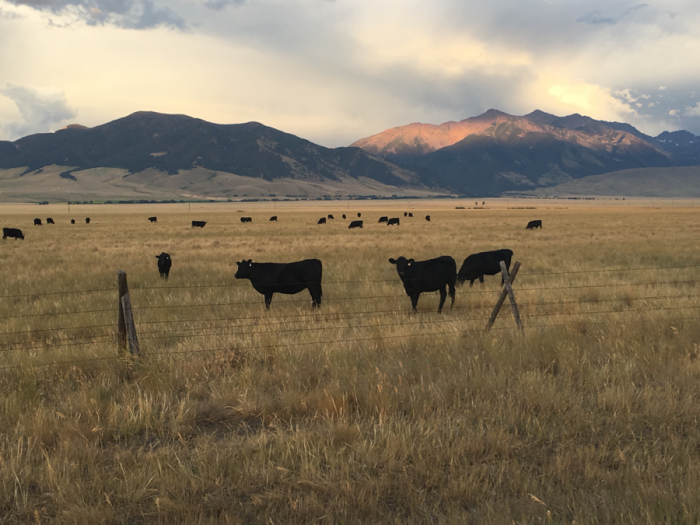
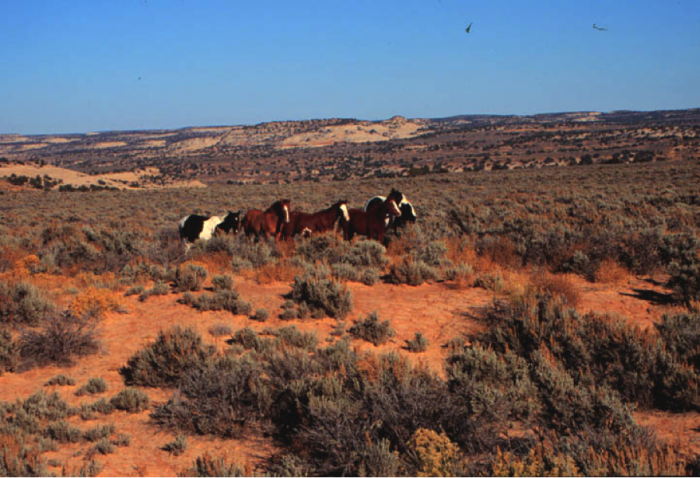
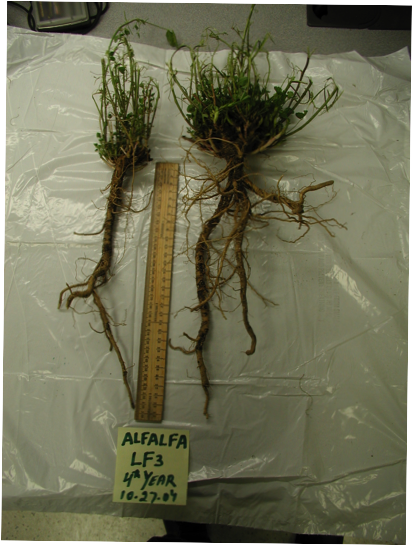
Crop Life Cycles and Environments
Crop Life Cycles and Environments
Annual plants are typically cultivated in high-resource environments and regions with:
-
climates that have sufficient precipitation and temperatures for plants to complete their life cycle each year
- soils that soils tend to be relatively flat and well-drained, and are not prone to erosion when they are tilled or planted to an annual crop each year
- high fertility soil
Annual crops produce grain and fruit crops within one growing season. Grain crops are typically a concentrated source of carbohydrates, protein, and sometimes fat, that can be cost-effectively stored and transported long distances, enhancing their market options and utility. Grain and oilseed annual crops are often processed for multiple uses and markets. For instance, oil is extracted from soybean for industrial and human uses, and the remaining meal is high in protein that is used for both human food products and livestock feed.
If conditions are not ideal for annual crops, farmers sometimes use management practices or technologies to improve conditions for crop growth such as irrigation to compensate for the lack of precipitation or black plastic to warm the soil in environments where temperatures may limit plant growth.
Regions, where perennial crops dominate the landscape, tend to have soil or climatic limitations such as steep or hilly slopes that are prone to erosion, shallow or poorly drained soils, soil nutrient limitations; limited precipitation and soil moisture availability, short growing seasons, or temperatures outside of optimal plant growth temperatures. In these environments, farmers may produce annual crops that are adapted to the environment, such as spring or winter wheat that grow during the cooler season or drought-tolerant annuals such as sorghum and pearl millet. Or farmers may use technologies and management practices, particularly for high-value crops, to improve conditions for crop growth such as tile drains, irrigation or season extension technologies.
See illustration and comparison of plant life cycles, the time and forms of reproduction. Can you name a specific crop plant example for each type of plant life cycle?
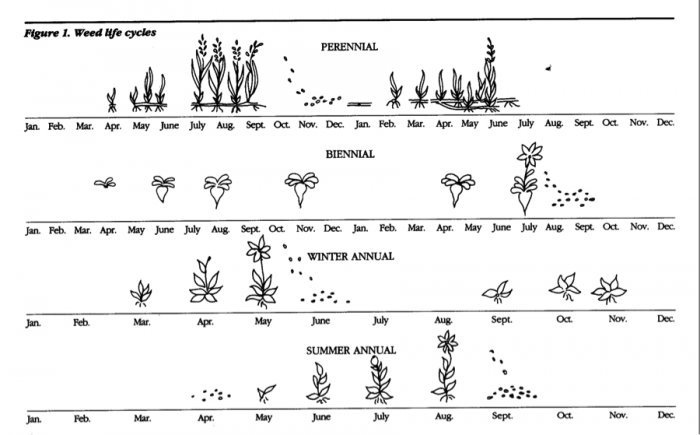
Perennials and Soil Conservation
Perennials and Soil Conservation
Because perennials allocate a high proportion of their growth to vegetative structures and regrow for many years, they can: i. protect soil from erosion; ii. return organic matter (carbon-based materials that originated from living organisms) to the soil, providing multiple soil health benefits; and iii. remove carbon dioxide from the atmosphere, potentially sequestering (storing) carbon in the soil or aboveground plant biomass. Forests, for example, sequester carbon above-ground in trees and in below-ground root systems.
Perennial grasses, in particular, have dense, fibrous roots that protect soil from erosion well and are valuable plants for soil conservation. In addition, over the years, some perennial roots and aboveground plant tissues die when environmental conditions limit growth (ex. drought, winter, grazing), and accumulate organic matter and nutrients in the soil. The majority of the most fertile and deep agricultural soils of the world were formed under natural perennial grasslands, whose deep root systems accumulated organic matter in the soil which contributed many beneficial soil properties, as well as carbon sequestration. Some annual crops can also contribute to conserving soil and add organic matter to the soil if a large portion of the crop residue is left on the soil surface, such as corn stalks left on a field after the grain is harvested.
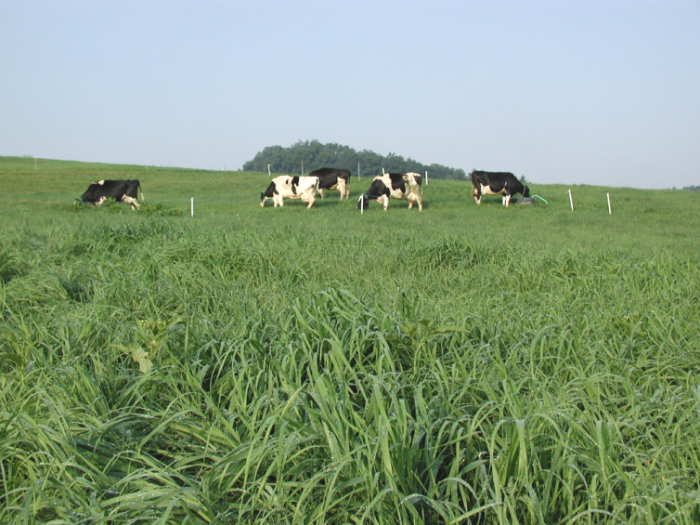
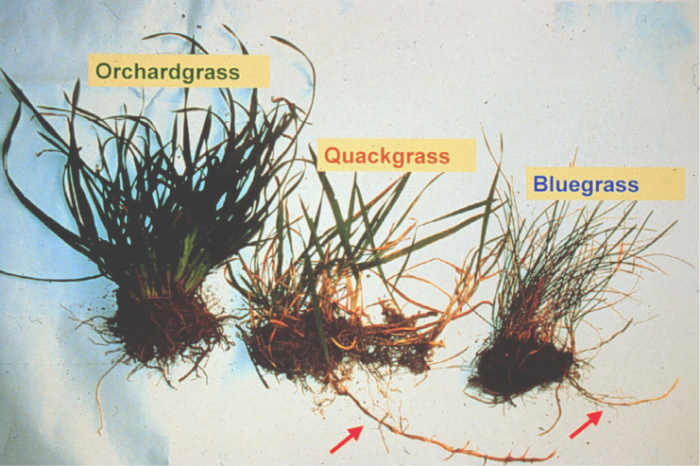
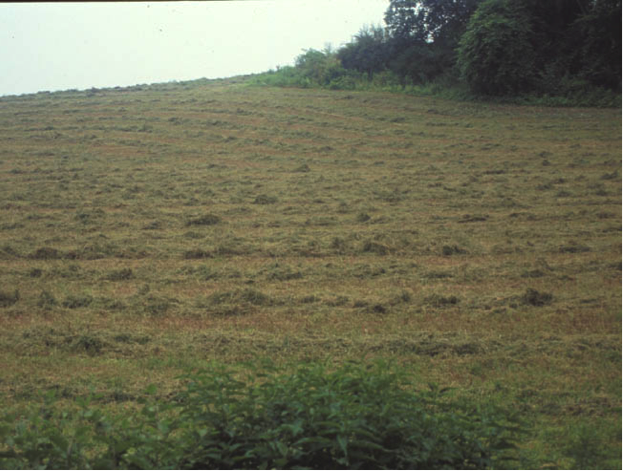
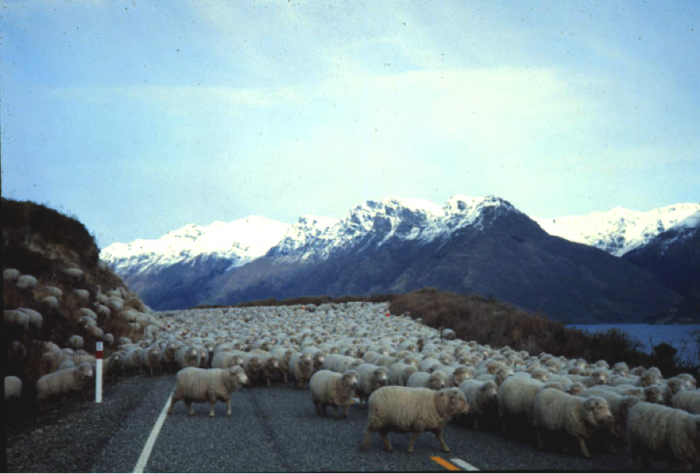
Module 6.2: Crop Plant Characteristic Classification and Climatic Adaptations
Module 6.2: Crop Plant Characteristic Classification and Climatic Adaptations
In addition to their lifecycles, crop plants are characterized and classified in multiple ways that are relevant for crop production and management. Common plant features include similar morphology, growth and reproduction; and environmental and climatic adaptions. This module will help you understand more about how crops are adapted to different environments and diversified to interrupt pest lifecycles.
Plant Families
Plant Families
Plants that have similar flowers, reproductive structures, other characteristics, and are evolutionarily related, are grouped into plant families (See Figure 2). Species in the same plant family tend to have similar growth characteristics, nutrient needs, and often the same pests (pathogens, herbivores). Planting crops from different plant families on a farm and the landscape; and rotating crops of different plant families over time can interrupt the crop pest life cycles, particularly insect pests, and pathogens, and reduce yield losses due to pests. Increasing plant family diversity can also provide other agrobiodiversity benefits including, diverse seasonal growth and adaptation to weather stresses such as frosts, and drought; different soil nutrient needs, as well as producing diverse foods that provide for human nutritional needs.
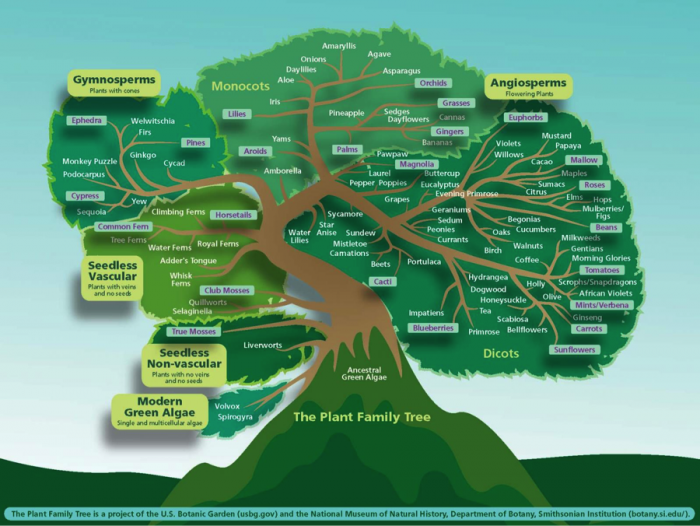
- Ancestral Green Algae
- Modern Green Algae - single and multicellular algae
- Volvox Spirogyra
- Seedless Non-vascular - plants with no veins and no seeds
- Liverworts
- True Mosses
- Seedless Vascular - plants with veins and NO seeds
- Selaginella
- Quillworts
- Club Mosses
- Whisk Ferns
- Adder's Tongue
- Water Ferns
- Royal Ferns
- Horsetails
- Climbing Ferns
- Tree Ferns
- Common Fern
- Gymnosperms - Plants with cones
- Ephedra
- Welwitschia
- Firs
- Pines
- Ginkgo
- Cycad
- Yew
- Sequoia
- Cypress
- Podocarpus
- Monkey Puzzle
- Angiosperms - Flowering Plants
- Dicots
- Euphorbs
- Violets
- Willows
- Mustard
- Papaya
- Cacao
- Mallow
- Maples
- sumacs
- Citrus
- Roses
- Elms
- Hopes
- Mulberries/figs
- Beans
- Begonias
- Cucumbers
- Oaks
- Walnuts
- Birch
- Coffee
- Milkweeds
- Gentians
- Morning Glories
- Tomatoes
- Scrophs/Snapdragons
- African Violets
- Holly
- Olive
- Mints/Verbena
- Ginseng
- Carrots
- Sunflowers
- Pawpaw
- Magnolia
- Laurel
- Pepper
- Poppies
- Grapes
- Buttercup
- Eucalyptus
- Evening Primrose
- Geraniums
- Sedum
- Peonies
- Currants
- Sycamore
- Star Anise
- Water Lilies
- Sundew
- Mistletoe
- Carnations
- Beets
- Cacti
- Portulaca
- Blueberries
- Impatiens
- Monocots
- Amborella
- Aroids
- Yams
- Lilles
- Iris
- Palms
- Pineapple
- Sedges
- Dayflowers
- Bananas
- Gingers
- Cannas
- Grasses
- Orchids
- Asparagus
- Agave
- Amaryllis
- Onions
- Daylillies
- Aloe
- Dicots
- Modern Green Algae - single and multicellular algae
Read this summary of the major world food crop plant families and the value of knowing what family plants are in, The Organic Way - Plant Families [133], then consider these questions.
- What plants are your five favorite foods produced from?
- What plant families are they in?
- Are they annuals or perennials?
The Fabaceae/Leguminosae, commonly called the Legume plant family, is important for soil nitrogen management in agriculture and for soil, human and animal nutrition. Legume plants can form a mutualistic, symbiotic association with Rhizobium bacteria which inhabit legume roots in small growths or nodules in the roots (seed images in the video listed below). The rhizobia bacteria have enzymes that can take up nitrogen from the atmosphere and they share the “fixed nitrogen” with their legume host plant. Nitrogen is an important nutrient for the plants and animals, it is a critical element in amino acids and proteins, genetic material and many other important plant and animal compounds. Legume grains crops, also called pulses are high in protein, such as many species of beans, lentils, peas, and peanuts. Most of their plant nitrogen is harvested in grain, although there is some in crop residues that can increase soil nitrogen content. Perennial legume crops are typically grown as forage crops for their high protein for animals. Because they allocate a large portion of their growth to vegetative plant parts and storage organs, perennial legumes also return a significant quantity of nitrogen to the soil, enhancing soil fertility for non-legumes crops grown in association or in rotation with legumes.
Watch the following NRCS video about legumes and legume research.
Video: The Science of Soil Health: Understanding the Value of Legumes and Nitrogen-Fixing Microbes (2:30)
Plant Classification Systems and Physiological Processes
Plant Classification Systems and Physiological Processes
In addition to characterizing plants by their taxonomic plant family, crop plants are also classified as either cool season or warm season, referring to the range of temperatures that are optimum for their growth. Examples of cool-season agronomic crops include wheat, oats, barley, rye, canola, and many forage grasses are called cool-season grasses, such as perennial ryegrass, timothy, orchardgrass, tall fescue, smooth bromegrass, and the bluegrasses. Warm-season agronomic crops include corn or maize, sorghum, sugarcane, millet, peanut, cotton, soybeans, and switchgrass.
Learn more about the differences in cool and warm season plants and the types of vegetable crops in these categories by reading Season Classification of Vegetables [144].
In addition, plants are classified by the type of photosynthetic pathway that they have.
Plant Photosynthesis, Transpiration, and Response to Changing Climatic Conditions
Plants require light, water, and carbon dioxide (CO2) in their chloroplasts, where they create sugars for energy through photosynthesis. The chemical equation for photosynthesis is:
6 CO2+ 6 H2O → C6H12O6+ 6 O2
Carbon dioxide (CO2) enters plants through stomata, which are openings on the surface of the leaf that are controlled by two guard cells. The guard cells open in response to environmental cues, such as light and the presence of water in the plant.
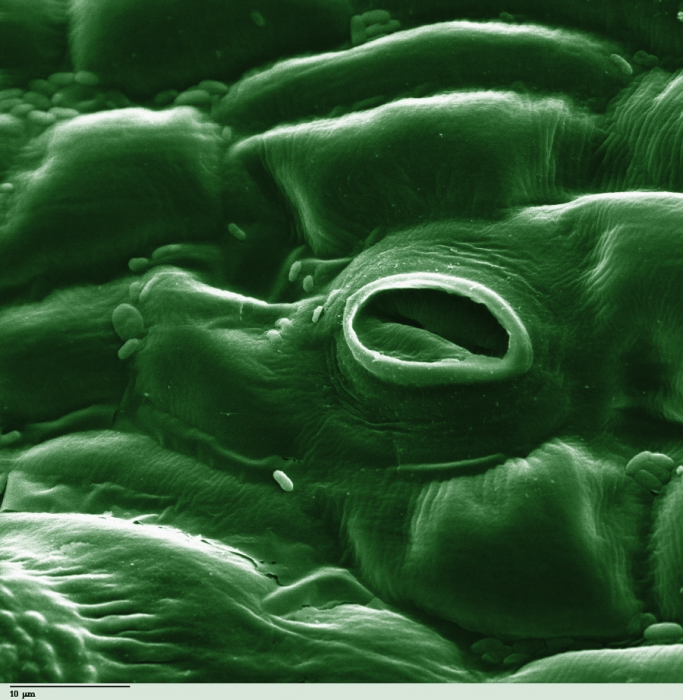
For a brief and helpful review of photosynthesis and plant anatomy such as the plant leaf structures, see Plant Physiology - Internal Functions and Growth [146].
Water (H2O) enters the plant from the soil through the roots bringing with it important plant nutrients in solution.
Transpiration or the evaporation of water from plant contributes to a “negative water potential.” The negative water potential creates a driving force that moves water against the force of gravity, from the roots, through plant tissues in xylem cells to leaves, where it exits through the leaf stomata. Since the concentration of water is typically higher inside the plant than outside the plant, water moves along a diffusion gradient out through the stomata. Transpiration is also an important process for cooling the plant. When water evaporates or liquid water molecules are converted to a gas, energy is required to break the strong hydrogen bonds between water molecules, this absorption of energy cools the plant. This is similar to when your body perspires, the liquid water molecules absorb energy and evaporate, leaving your skin cooler.
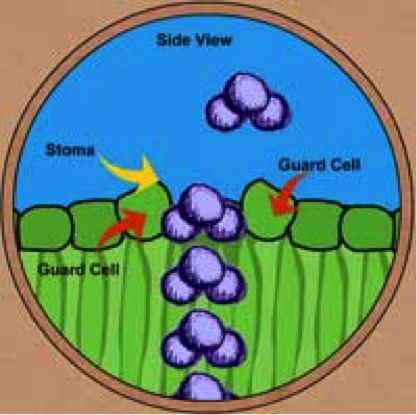
Carbon dioxide (CO2) also diffuses into the plant through the stomata, because the concentration of carbon dioxide is higher outside of the plant than inside the plant, where carbon dioxide concentration is lower due to plant photosynthesis fixing the carbon dioxide into sugars. To conduct photosynthesis, plants must open their leaf stomata to allow carbon dioxide to enter, which also creates the openings for water to exit the plant. If water becomes limited such as in drought conditions, plants generally reduce the degree of stomatal opening (also called “stomatal conductance”) or close their stomata completely; limiting carbon dioxide availability in the plant.
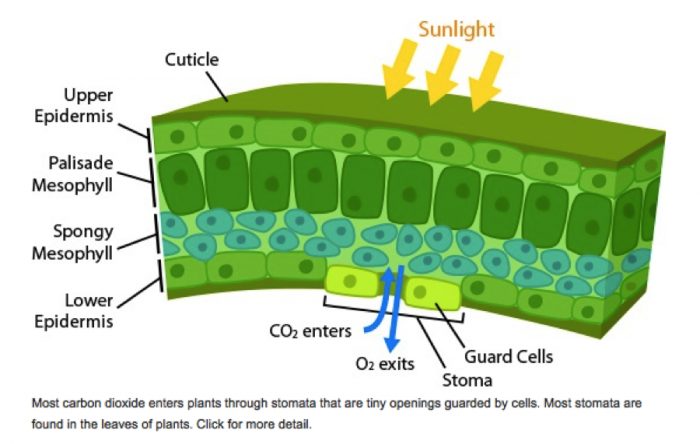
Read more about how water moves through the plant and factors that contribute to water moving into the roots and out of the plant, as well as carbon dioxide movement in Transpiration - Water Movement through Plants [135].
C3 and C4 Photosynthesis
C3 and C4 Photosynthesis
The majority of plants and crop plants are C3 plants, referring to the fact that the first carbon compound produced during photosynthesis contains three carbon atoms. Under high temperature and light, however, oxygen has a high affinity for the photosynthetic enzyme Rubisco. Oxygen can bind to Rubisco instead of carbon dioxide, and through a process called photorespiration, oxygen reduces C3 plant photosynthetic efficiency and water use efficiency. In environments with high temperature and light, that tend to have soil moisture limitations, some plants evolved C4 photosynthesis. A unique leaf anatomy and biochemistry enables C4 plants to bind carbon dioxide when it enters the leaf and produces a 4-carbon compound that transfers and concentrates carbon dioxide in specific cells around the Rubisco enzyme, significantly improving the plant’s photosynthetic and water use efficiency. As a result in high light and temperature environments, C4 plants tend to be more productive than C3 plants. Examples of C4 plants include corn, sorghum, sugarcane, millet, and switchgrass. However, the C4 anatomical and biochemical adaptations require additional plant energy and resources than C3 photosynthesis, and so in cooler environments, C3 plants are typically more photosynthetically efficient and productive.
Since carbon dioxide is the gas that plants need for photosynthesis, researchers have studied how the elevated CO2 concentrations impact C4 and C3 plant growth and crop yields. Although C3 plants are not as adapted to warm temperatures as C4 plants, photosynthesis of C3 plants is limited by carbon dioxide; and as one would expect research has shown that C3 plants have benefitted from increased carbon dioxide concentrations with increased growth and yields (Taub, 2010). By contrast, with their adaptations, C4 plants are not as limited by carbon dioxide, and under elevated carbon dioxide levels, the growth of C4 plants did not increase as much as C3 plants. In field studies with elevated carbon dioxide levels, yields of C4 plants were also not higher (Taub, 2010). In addition, if soil nitrogen was limited, C3 plant response to elevated CO2 concentration was reduced or crop plant nitrogen or protein content was reduced compared to plants grown in high soil N conditions (Taub, 2010). These results suggest that crops will likely require higher soil nutrient availability to benefit from elevated atmospheric carbon dioxide concentrations. For more optional reading information about C3 and C4 plant response to elevated carbon dioxide concentrations, see the following summary of research that is also listed in the additional reading list, Effects of Rising Atmospheric Concentrations of Carbon Dioxide on Plants [150].
Other Drought Tolerant Crop Plant Traits
Some additional plant traits that help plants tolerate drought and heat stress include deep root systems (typical of perennials) and/or thick leaves with waxes that reduce water loss and the rate of transpiration. In addition, some plants roll their leaves to reduce the surface area for solar radiation reception and heating, and some reduce their stomatal conductance more (water loss) more than others.
Temperature
Elevated temperatures projected with climate change can have multiple impacts on plant growing conditions. Climate change may lengthen growing seasons in some regions, although day lengths will not change. As planting dates are altered with longer growing seasons, crops may also be exposed to high temperature, moisture stress, and risk of frost. Elevated temperatures may also increase evaporation of water from the soil, reducing soil water availability. Higher temperatures are not necessarily ideal for yield, even if the temperatures are below a plants’ optimal temperature. At elevated temperatures, plants grow faster which tends to, one, reduce the amount of the time for photosynthesis and growth, resulting in smaller plants, and two, reduce the time for grain fill, reducing yield, particularly if nighttime temperatures are high (Hattfield et al., 2009). High temperatures can also reduce pollen viability, be lethal to pollen. The multiple effects of high temperatures on plant physiological process and soil moisture likely explain why research has found that grain development and yield are often reduced when temperatures are elevated (Hattfield et al., 2009).
Many factors that are projected to change with climate change could influence plant growth. These include carbon dioxide concentration, temperature, precipitation, and soil moisture, and ozone concentrations in the lower atmosphere.
Read the Introduction and Key Message 1 (Increasing Impacts on Agriculture) of the National Climate Assessment [151].
Agricultural Crops Case Studies
Agricultural Crops Case Studies
Socio-economic Factors
In addition to the climate and soil resources for crop production, many socioeconomic factors influence which crops farmers chose to cultivate, including production costs, domestic and international market demand; and government policies that subsidize agricultural producers, and reduce trade barriers or export costs. As discussed in Module 3, the protein, energy, fat, vitamins, and micro-nutrients of crops for human nutrition are one predictor of the market value of a crop. However some food crops are highly valued and cultivated for their cultural and culinary qualities, such as flavor (ex. chilies, vanilla, coffee, wine grapes); and their high economic value often reflects high production and processing costs, as well as market demand for their unique culinary and cultural properties.
Some crops are cultivated for non-human food uses such as livestock feed, biofuel, fiber, industrial oil and starch, and medicinal uses. Crop processing often creates by-products that can be used for other purposes, adding market value. For example, when oil is extracted from oilseeds such as soybean, the soybean meal by-product is high in protein and sold for livestock feed or added to human food products. And for crops that are cultivated on many acres often with support from government policies, the consistent, abundant supply of these commodity crops has contributed to the development of multiple processing technologies, uses, and markets. To better understand factors that contribute to the production of commodity crops, we will now examine two case studies of corn and sugarcane.
Understanding Agricultural Commodities: Two Agricultural Crops Case Studies
In the following two agricultural crop case studies, you will have the opportunity to apply your understanding of crop plant life cycles, classification systems, and crop adaption to climatic conditions to understand how plant ecological features and human socioeconomic factors influence which crops are some of the major crops produced in the world.
Corn (Maize) Case Study
Corn (Maize) Case Study
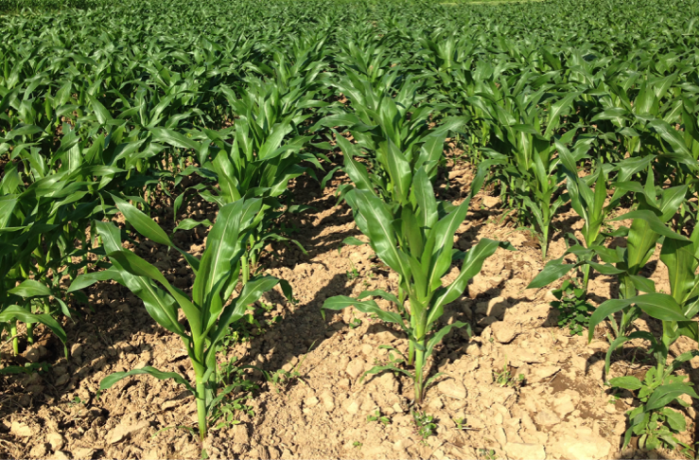
Corn or maize is a summer annual C4 crop in the Poaceae, or grass family that has high nutrient demands. Unless soil conservation practices are used, corn fields do not have live roots protecting the soil from erosion and providing other soil quality benefits after harvest in the fall, winter and spring. The US is the largest corn producer in the world. Soils and climate, particularly in the Midwest, permit high corn yields; and significant investment in agricultural research has produced high-yielding corn hybrids and production technologies, such as fertilizers, pest control practices, farming equipment, and irrigation. Research has also developed diverse uses for the large quantities of corn produced in the US, and the US is also a major exporter of corn.
Read this overview of US corn production and uses from the US Department of Agriculture, Economic Research Service, Corn and Other Feed Grains [152].
Sugarcane Case Study
Sugarcane Case Study
The US consumes the most sweeteners of any country in the world. In the US, high-fructose syrup is made from corn, which has displaced some sugarcane production for sugar for the US market. Sugarcane production, however, has continued to increase in Brazil, the biggest sugarcane producer in the world. Sugarcane is a C4 perennial crop in the grass family and it's not grown just for sugar as a food sweetener.
Watch this United Nations video below, about the factors contributing to increased sugarcane production and some of the consequences. Then answer the questions below.
Video: Brazil: The ethanol revolution (4:55)
If the video does not play, please see Brazil: The ethanol revolution (United Nations) [153].
Summative Assessment: Top 15 World Agricultural Commodities
Summative Assessment: Top 15 World Agricultural Commodities
Instructions
Download the FAO Top 50 Commodity Changes Key Spreadsheet [154] which has the ranking and total production of the top 50 commodities for 2000 and 2013. In a spreadsheet calculate the percentage of change in the production of the most recent year's top 15 commodities then answer the below questions. Analysis and critical thinking about the data are encouraged.
Answer the following questions:
- Describe the crops that are used to produce the top 15 agricultural commodities with the classification systems you have learned in Module 6.
- In what plant families are they?
- Are the top agricultural commodities produced from annual or perennial plants or both?
- Are they cool season, warm season, C3 or C4 plants?
- Which four commodities have increased in production the most in comparison to the other top 11 commodities, which had the greatest percentage of increase in production? By what percentage has the production (in weight, not dollars) of the top four agricultural commodities in the most recent year for which data is available changed since 2000?
- Why has corn production in the US and sugarcane production in Brazil increased recently? What markets, agroecological and socioeconomic factors do the case study readings and FAO video explain have contributed to the increased production of corn in the US and sugarcane in Brazil?
- What might socioeconomic, agricultural, and environmental factors explain the significant increase of the four commodities that increased most since 2000 on a global scale?
- Consider how the increased production of these four commodities likely impacts the soil, nutrient cycling, pest populations, and ecology of an agroecosystem? What are the potential pros and cons of these crops on soil, nutrient cycling, greenhouse gases, other ecological impacts; What are the socio-economic impacts? Distinguish the most significant impacts, and discuss why there are significant advantages or disadvantages of the expansion of these top 4 commodities. The pros and cons may be socioeconomic and/or environmental.
Files to Download
FAO Top 50 Commodity Changes Key Spreadsheet [154]
Download the Module 6 Summative Assessment Worksheet [155]
Submitting Your Assignment
You do not need to submit your worksheets; they will instead act as guides for you to complete the summative assessment quiz.
Summary and Final Tasks
Summary
After completing Module 6, you should now be able to:
- Describe key features of categories of crop plants and how they are adapted to environmental and ecological factors
- Explain how soil and climatic features determine what crops can be produced in a location, and how humans may alter an environment for crop production.
- Describe some plant physiological traits and differences that could influence how plants adapt to climate change.
- Explain how both environmental and socio-economic factors contribute to crop plant selection (coupled human-nature systems).
Reminder - Complete all of the Module 6 tasks!
You have reached the end of Module 6! Double-check the to-do list on the Module 6 Roadmap [156] to make sure you have completed all of the activities listed there before moving on to Module 7.1!
References and Further Reading
Sterling, T. M. Transpiration in the Plant and Soil Sciences ELibrary: https://passel.unl.edu/pages/informationmodule.php?idinformationmodule=1... [135]
Taub, D. 2010. Effects of Rising Atmospheric Concentrations of Carbon Dioxide on Plants. Nature Education Knowledge 3(10):21
Lambers, H. S.Chapin and T. Pons. 1998, Plant Physiological Ecology. 2nd edition. Springer-Verlag New York. pg. 340 and 344.
Capstone Project Stage 2 Assignment
Capstone Project Stage 2 Assignment
Water, soils, and crops
(Modules 4-6)
The diagram below summarizes the topics you will explore in Stage 2 for your assigned region. In Stage 2 of the capstone, you will engage in spatial thinking and geographic facility to interpret spatial data (for example annual precipitation, evapotranspiration and soils data) and interpret how multiple regional factors contribute to determining which crops are produced in your region.

- Describe precipitation and water resources
- Assess water pollution
- Describe soil types
- Describe soil impacts
- Describe regional crops
- Discuss relationship between crops, soils, and climate
What to do for Stage 2?
- Download and complete the Capstone Project State 2 Worksheet [157]that contains a table summarizing the data you’ll need to collect to complete this stage. Remember, you need to think deeply about each response and write responses that reflect the depth of your thought as informed by your research.
- Add relevant visual figures (i.e. maps, tables, graphics, diagrams) to your PowerPoint.
- Add questions and continue to research the questions in your worksheets.
- Continue building a CHNS diagram to illustrate the connections between the natural system and the human food systems of the region. You may decide that you need multiple diagrams.
Capstone Project Overview: Where do you stand?
At this stage, you should have started to investigate your assigned region and have added information, maps, and data to your worksheets and PowerPoint file for Stages 1 and 2.
Upon completion of stage 2, you should have at this point:
- Continued research and data compilation in the Stages 1 and 2 tables in the associated Stages 1 and 2 worksheets.
- Stage 1: Regional food setting, history of regional food systems, diet/nutrition
- Stage 2: Water resources, soils, and crops
- Added to your powerpoint file containing the data that you are collecting about the food system of your assigned region. Information you may have:
- Labeled map of your region
- Soil map of your region
- Precipitation and temperature map of your region
- Major crops and crop families grown in your region
- Continued to record citations for all references and resources you are using in your research. This is a critical step. Every figure, map, piece of data, and bit of information you collect from the web, a book, a person, a journal or any other source must be attributed to the source.
- Added to your list of questions you have about your region related to key course topics and initiated significant efforts to answer.
- Revised your CHNS diagram and/or create a new one incorporating topics from Modules 4, 5, and 6.
Section 3: Systems Approaches to Managing our Food Systems
Section 3: Systems Approaches to Managing our Food Systems
Overview
This is the third section of the course, where you will deepen your understanding of the connections between the natural environment and the human food production system. We already learned how important soil resources, water resources, and climate are in determining which crops we can grow and where we can grow them. In this section, we explore more soil management strategies and start to learn more about pests and climate change, which are two significant stressors for our human food system. Module 7 delves deeper into the management of soils and crops to improve soil quality for agriculture and illustrates more connections between natural systems and human systems. In Module 8, you'll explore types of pests and different methods used to manage pests as well as some of the challenges and opportunities to sustainably manage pests. The last module in this section, Module 9, first introduces the science of global climate change, then examines future projects for key climate variables that influence food production. Finally, the section wraps up with Stage 3 of the capstone, in which you'll explore each of these topics in relation to your capstone region.
Modules
- Module 7: Soils and a Systems Approach to Soil Quality
- Module 8: Pests and Integrated Pest Management
- Module 9: Climate change
- Capstone Stage 3
Section Goals
Upon completion of Section 3 students will be able to:
- Understand the human impact on the environment in food systems and natural system feedbacks.
- Apply broadly the principles of sustainable soil management in proposing solutions for food systems.
- Apply an understanding of vulnerability, food insecurity, and diet quality as human system properties that determine food system sustainability.
- Analyze a wide variety of food system types from the standpoint of human-natural interaction.
- Critique food systems based on an understanding of food system properties related to resilience, adaptive capacity, and vulnerability.
- Incorporate contributions of Food System-oriented movements and their proposals into their food system proposals.
- Propose an integrated plan or scenario for the sustainability of an example food system (capstone project).
- Learn the types and features of major agricultural insect pests, the benefits of insects, challenges associated with pest control.
- Learn how trophic interactions can contribute to pest control, and the scientific basis for IPM to control agricultural pests over the long term.
- Understand weed and pathogen pests.
- Learn how integrated pest and weed management can contribute to long-term successful weed and pest management, and some transgenic pest management technologies and their impact.
Section Objectives
In order to reach these goals, we have established the following learning objectives for student learning. Upon completion of the modules within Section 3, you will be able to:
- Name different food system impacts on earth's natural systems.
- Define and provide an example of sustainable soil management practices including tillage, soil erosion prevention, cover cropping and crop rotational diversity.
- Describe different options for sustainable water use in food systems.
- Describe food systems as coupled natural-human systems.
- Describe the three major types of food systems in the world today.
- Describe a life cycle analysis and what it is used for.
- Describe characteristics of insect pests and factors that make them successful pests, as well as beneficial characteristics of insects.
- Explain some history of agricultural pesticides.
- Describe factors that contribute to pests evolving resistance to pest control strategies.
- Discuss what IPM is and why it is effective.
- Interpret how to apply the pest scouting data and distinguish if pests have reached an economic threshold.
- Analyze IPM management scenarios and interpret the agroecosystem benefits of IPM.
- Describe and compare the characteristics of natural ecosystems and agroecosystems, and explain how trophic level interactions and biodiversity may contribute to pest control.
- Describe characteristics of weed pests and factors that make them successful pests, as well as beneficial characteristics of weeds.
- Describe categories of weed management tactics with example weed control practices.
- Explain what organisms and factors contribute to crop diseases.
- Explain some recent transgenic pest management technologies and analyze and interpret scientific data about transgenic technologies.
- Differentiate pest control approaches that are likely to be effective in the long term based on IPM principles, and generate or formulate IPM approaches to enhance pest control.
- Describe the evolutionary changes in the human history of diets and the current changes in modern globalized diet contexts.
- Define concepts related to food security and resilience in food systems such as adaptive capacity, food access, vulnerability, and malnutrition.
- Distinguish different ways that food systems develop and change because of interacting natural and human factors.
- Discuss how managing crops and soils as a system promotes soil quality and multiple agroecosystem benefits and makes food systems.more productive and sustainable.
- Apply and interpret a life cycle assessment (LCA) to measure and compare system impacts on earth's natural systems.
- Analyze mapping resources related to food access and food insecurity.
- Analyze the causes and historical trajectory of an example of a famine.
- Evaluate and compare different approaches to deal with water scarcity in food systems.
- Propose strategies for improved water use, soil management, system resilience, and diet improvement as part of an integrated strategy for food system sustainability.
Module 7: Soils and a Systems Approach to Soil Quality
Module 7: Soils and a Systems Approach to Soil Quality
Introduction
There are multiple soil conservation practices that can reduce soil erosion and improve soil quality. In this module, you will explore what is meant by soil quality or soil health for agricultural production, as well as how strategic crop selection, crop sequencing, and reduced soil tillage practices in combination are most effective for improving soil quality for agriculture.
Goals and Learning Objectives
Goals and Learning Objectives
Goals
- Describe different types of cropping systems types, soil tillage practices, and indicators of soil quality.
- Interpret the effect of cropping systems and soil tillage approaches on soil conservation and quality.
- Distinguish which crop and soil management practices promote soil health and enhanced agroecosystem performance.
Learning Objectives
After completing this module, students will be able to:
- Define and provide an example of some cropping system practices (ex. monoculture, double crop, rotation, cover crop, intercrops).
- Define soil quality and describe some indicators of soil quality.
- Explain some tillage systems and how tillage practices affect soil quality.
- Interpret how the integration of cropping and tillage systems can promote soil conservation and quality.
- Analyze and prescribe some cropping systems and tillage practices that promote soil quality and other agroecosystem benefits.
Assignments
Module 7 Roadmap
Detailed instructions for completing the Summative Assessment will be provided in each module.
| Action | Assignment | Location |
|---|---|---|
| To Read |
|
|
| To Do |
|
|
Questions?
If you prefer to use email:
If you have any questions, please send them through Canvas e-mail. We will check daily to respond. If your question is one that is relevant to the entire class, we may respond to the entire class rather than individually.
If you prefer to use the discussion forums:
If you have any questions, please post them to the discussion forum in Canvas. We will check that discussion forum daily to respond. While you are there, feel free to post your own responses if you, too, are able to help out a classmate.
Module 7.1: Cropping Systems and Soil Quality
Module 7.1: Cropping Systems and Soil Quality
Introduction
Plants and soil interact; soil provides water and nutrients to plants, and plant roots contribute organic matter to the soil, can promote soil structure, and support soil organisms. Above ground crop residues (non-harvested plant parts such as stems and leaves) can also protect the soil from erosion and return organic matter to the soil. But soil tillage can make soil vulnerable to erosion, alter soil physical properties and soil biological activity. In Module 7.1, you will learn what is meant by soil health for agricultural production and explore how crop types and cropping systems can impact the soil.
Cropping Systems
Cropping Systems
Recall in module 5, we examined how soils, climate, and markets play major roles in determining which crops farmers cultivate. In many cases, farmers cultivate multiple crops of more than one life-cycle because the diversity provides multiple benefits, such as soil conservation, interruption of pest lifecycles, diverse nutritional household requirements, and reduced market risk. In this module, we examine some ways that farmers cultivate crops in sequence and define some of the terms for this crop sequencing.
A sole crop refers to planting one crop in a field at a time. Recall from Module 5, the seasonal crop types (Figure 7.1.1) and note that different seasonal crops could be planted in succession. A monoculture refers to planting the same crop year after year in sequence (See Figure 7.1.2). By contrast in a crop rotation, different crops are planted in sequence within a year or over a number of years, such as shown in Figures 7.1.3a and 7.1.3b. When two crops are planted and harvested in one season or slightly more than one season, the system is referred to as double cropping, as illustrated in Figure 7.1.4. Where growing seasons are long and/or crop life cycles are short (ex. leafy greens), three crops may be planted in sequence within a season, as a triple-crop.
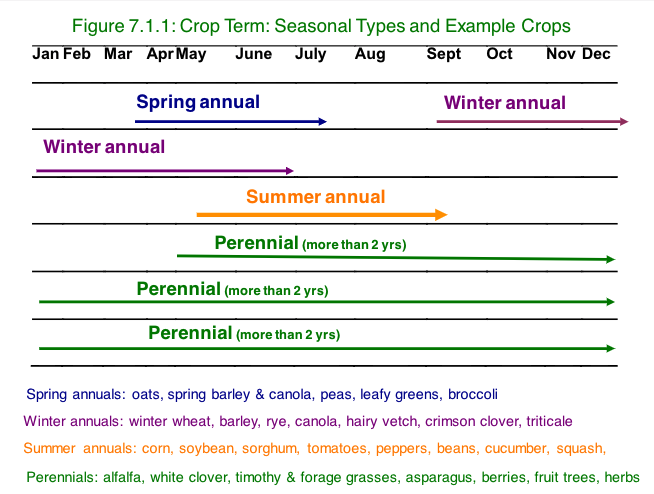
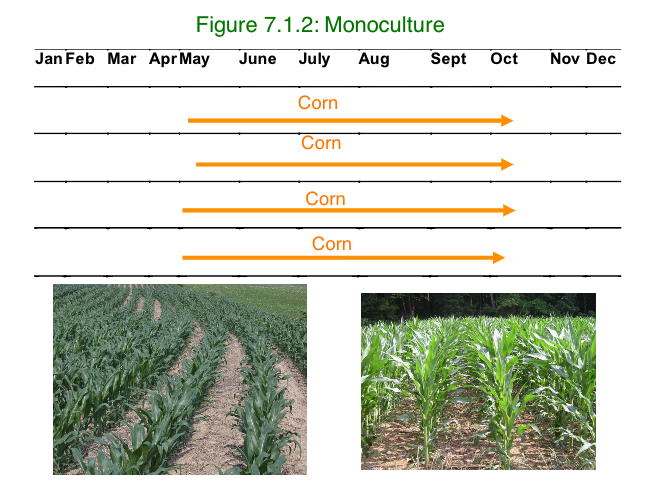
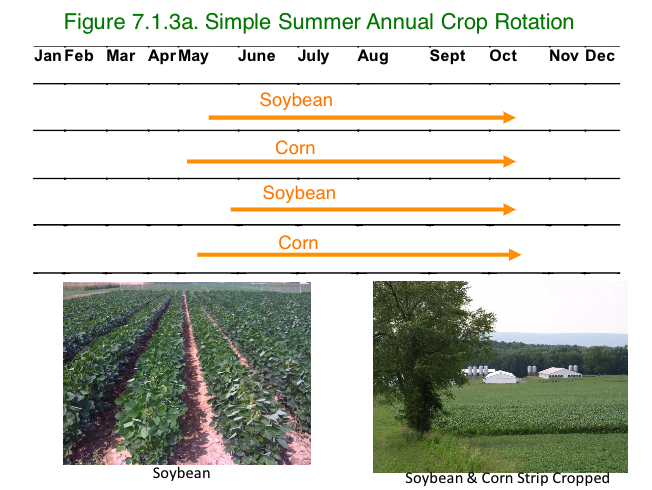
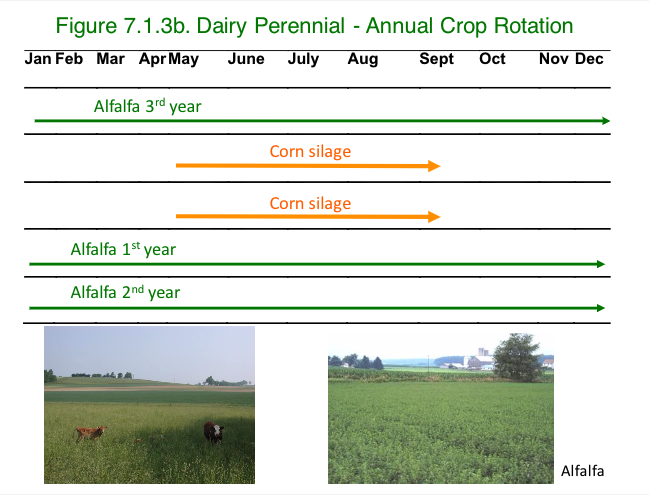
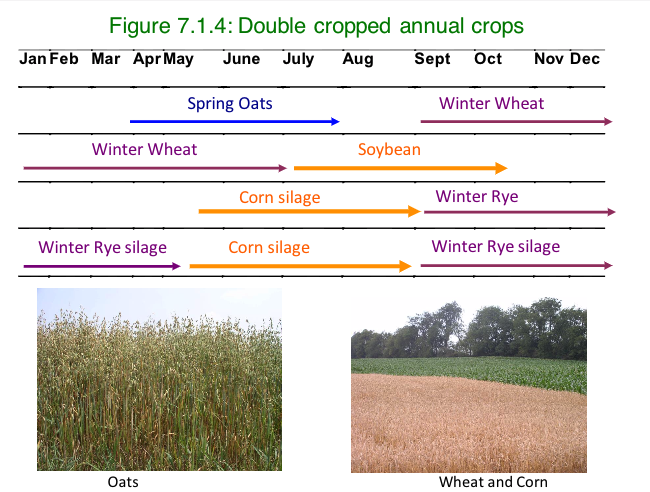
Crop rotations and double cropping can provide many soil conservation and soil health benefits that are discussed in the reading assignment at the end of this page, and in Module 7.2. Crop rotations can provide additional pest control benefits particularly when crops from different plant families are rotated, as different families typically are not hosts of the same insect pest species and crop pathogens. Integrating crops of different seasonal types and life cycles in a crop rotation also interrupts weed life cycles by alternating the time when crops are germinating and vulnerable to weed competition. Rotating annual crops with perennial forage crops that are harvested a couple of times in a growing season also interrupts annual weed life cycles, because most annual weeds don't survive the frequent forage crop harvests.
When all or most of a crop is grazed or harvested for feed for ruminant livestock, such as dairy and beef cattle or sheep, the crop is referred to as a forage crop. Examples of forage crops include hay and pasture crops, as well as silage that can be produced from perennial crops and most grain crops. For instance, silage from alfalfa, perennial grass species, corn, oat, and rye is made when most of the aboveground plant material (leaves, stems and grain in the case of grain crops) is harvested and fermented in a storage structure called a silo or airtight structure. To preserve the silage, air is precluded from the storage structure and microbes on the plant material initially feed on the crop tissues, deplete oxygen in the storage structure, and produce acidic byproducts that decrease the pH of the forage. This acidic environment without oxygen prevents additional micro-organisms from growing, effectively "pickling", and preserving the forage.
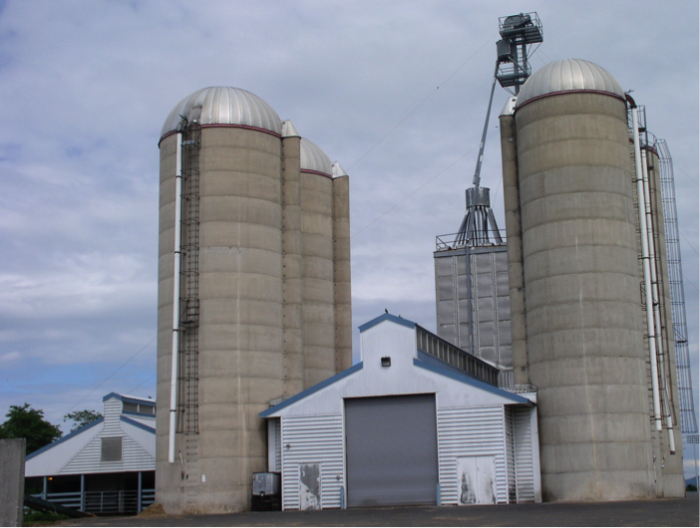
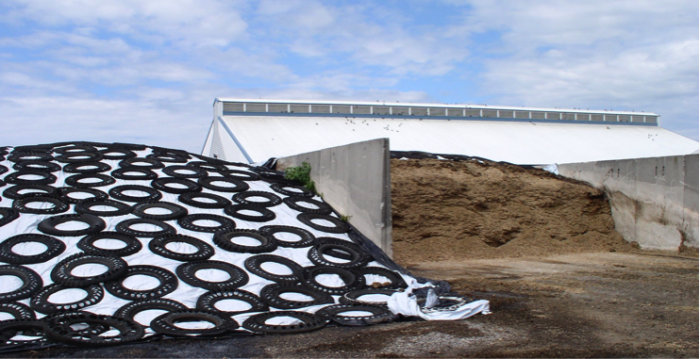
Intercrops and Cover Crops
Intercrops and Cover Crops
Intercrops are two or more crops that are planted together in a field at the same time or to be planted close in time and overlap for some or all of their life cycle. Intercrops may provide a range of benefits including: i. improving soil fertility, ii. increasing crop diversity and iii. reducing pest pressure. The mixtures also often produce higher yield and crop quality. There are multiple types of intercrops that vary in their spatial arrangement.
Strip intercrops are wide strips with multiple rows of one crop, that are alternated on the field with strips of one or more different crop(s). Strip intercrops are typically planted on the field contour with crops of different life cycles that protect soil from erosion throughout the year. For instance, strips of corn may be alternated with strips of perennial forage grasses that can reduce soil erosion across the field when the corn isn't growing. Or, as in the photo below, winter wheat provided live plant coverage on portions of the field in spring, prior to corn and soybean were planted. In mid-summer, corn and soybean provide live coverage after wheat is harvested; and in fall, winter wheat will be growing on some strips after corn and soybean are harvested. Having strips of different crop species can also reduce the spread of insect pests and crop pathogens compared to cultivating one crop on the entire field.
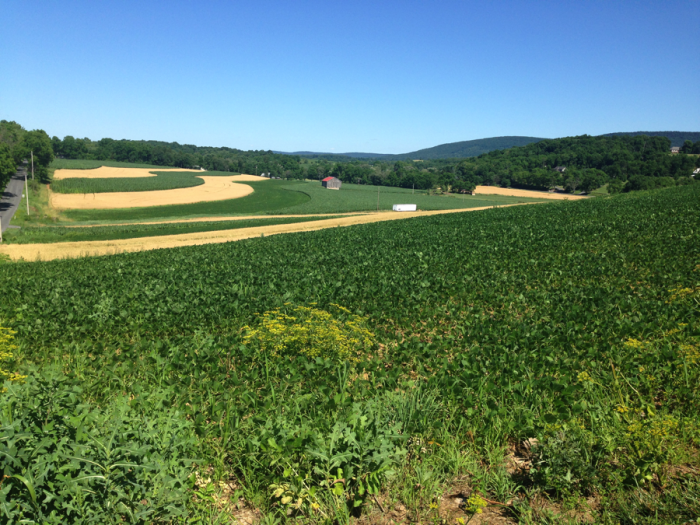
Row intercrops alternate rows of different crop species, usually every other row or every two rows.
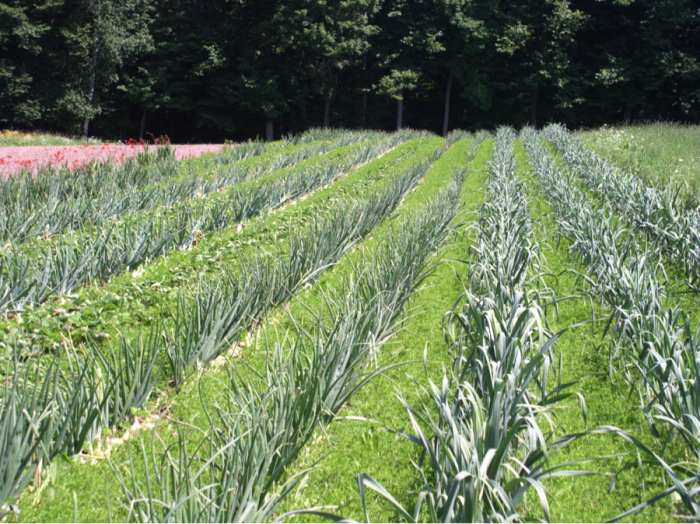
Mixture intercrops tend to be combined randomly when planted; such as grass and legume forage mixtures. Intercrops of different crop species (ex. native tuber mixtures) or different varieties of a crop species (ex. rice) are sometimes planted to reduce pathogen and insect pest infestations. Crop rotation and intercropping increase agrobiodiversity across an agricultural landscape, providing multiple potential agroecosystem benefits, such as i. reducing the risk of crop loss to pests and climatic stresses (ex. frosts, floods, and drought), ii. providing habitat for beneficial organisms such as pollinators and pest predators, and iii. enhancing the diversity of nutritional crops for farmers and markets. Further, integrating crops from the grass family tends to promote soil structure, while legumes enhance soil nitrogen, and integrating perennial crops protects the soil from erosion and builds soil organic matter and soil biological activity because perennials allocate a high proportion of their growth to storage organs. For instance, the photos below illustrate how both intercropping and crop rotation enhance agrobiodiversity in the high Andes of Peru.
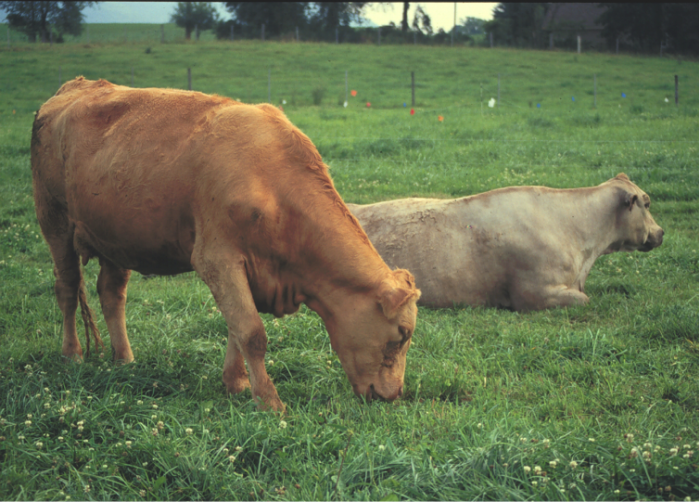
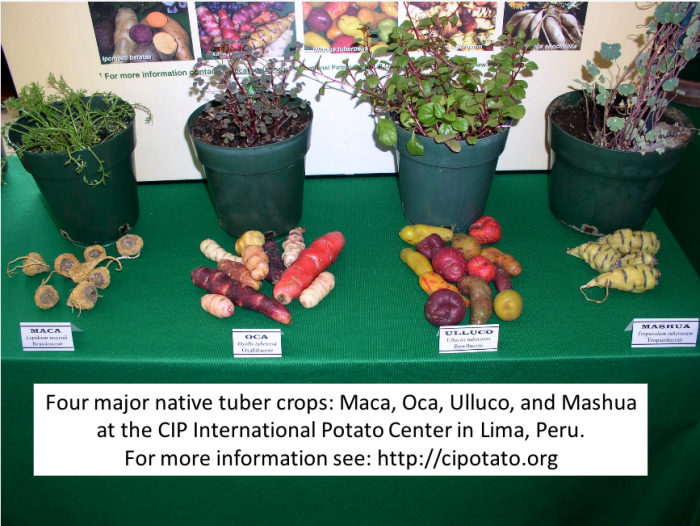
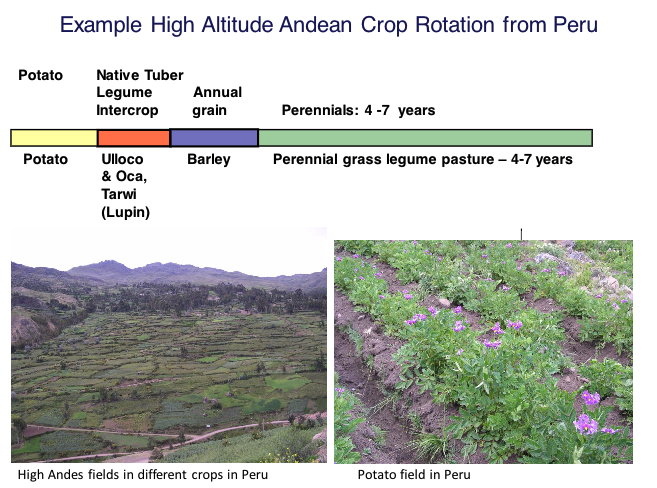
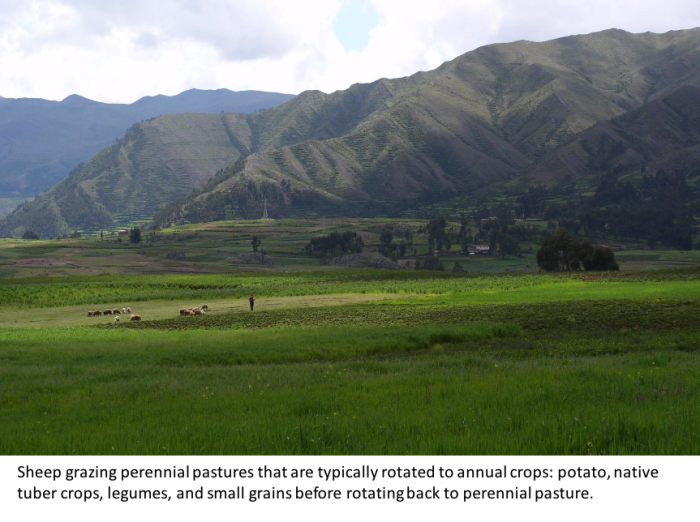
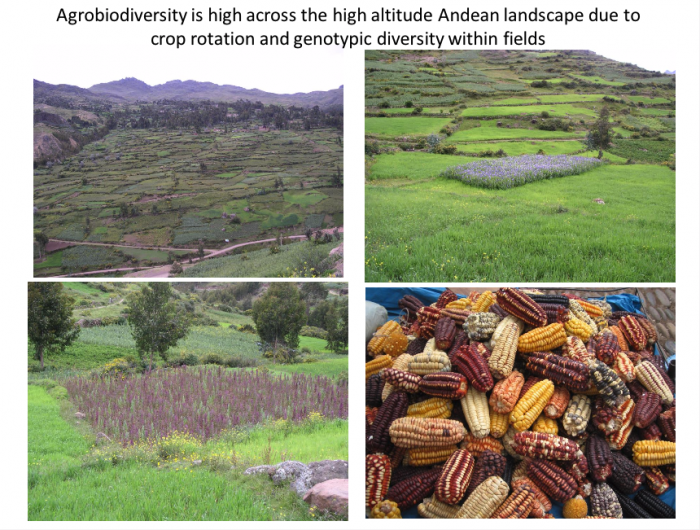
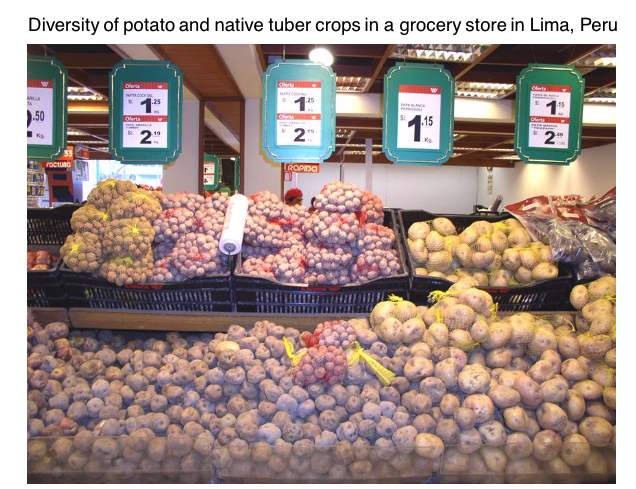
Cover Crop: A cover crop is planted after a crop that is harvested and is terminated before the subsequent crop is planted. Cover crops tend to be annual crops that they can quickly establish after a harvested crop to protect the soil from erosion and provide other benefits including i. to add organic matter to the soil; ii. to scavenge nutrients and prevent nutrients from leaching out of the topsoil (also called a catch crop); iii. to support soil organisms in the root zone, iv. to suppress weeds, and v. to provide habitat for aboveground beneficial organisms, such as insects that predate on crop pests or weed seeds. Leguminous cover crops also add nitrogen to the soil when they are terminated and returned to the soil and are therefore often referred to as green manure crops. Cover crops are also sometimes referred to as "catch crops" because they can take up and retain nitrogen and other nutrients that might otherwise leach out of the rooting zone and be lost to deeper soil profiles, and potentially to groundwater.
Cover Crop Intercrops
Because cover crop species have different plant traits that provide different cropping system benefits, often two or more species of cover crops are planted together as a cover crop intercrop or cover crop mixture. For instance, small grains that scavenge nitrogen well and have fibrous roots that bind soil particles and promote soil structure are often mixed with tap-rooted legumes that fix nitrogen. Some cover crop mixtures combine plant species that establish quickly in the late summer or early fall but don't typically survive the winter, such as oats or deep-rooted radish species. Non-winter hardy species are sometimes combined with winter-hardy species such as hairy vetch, cereal rye or annual ryegrass that survive the winter and provide cover in early spring.
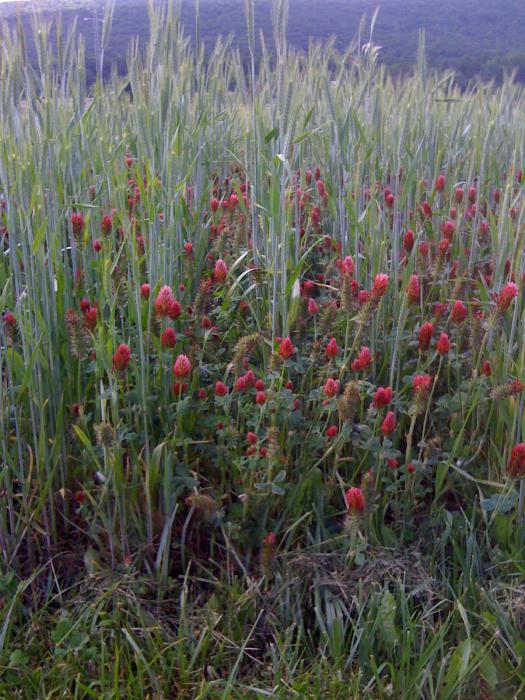
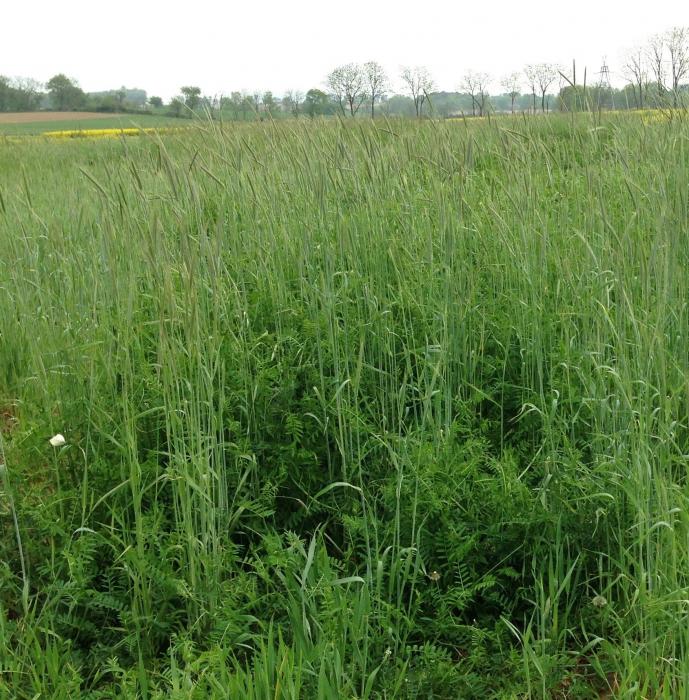
Readings
Download the book Building Soils for Better Crops. Edition 3 [161]. Sustainable Agriculture Network, USDA. Beltsville, MD or read it online, Building Soils for Better Crops. Edition 3 [158].
For this module, you will be assigned to read multiple sections. So, we recommended that you download the book. Then, read more about the benefits of cover crops in Chapter 10: Cover Crops and Chapter 11: Crop Rotations.
Soil Quality, Soil Health
Soil Quality, Soil Health
As discussed in Module 5, soil is a complex matrix of minerals, air, water, organic matter, and living organisms. Historically, the emphasis in agriculture has been on reducing soil erosion. But since the 1990s, soil scientists and conservationists have recognized and described multiple valuable properties and ecosystem functions of soil that are referred to as indicators of soil quality or soil health. In 1997, the Soil Science Society of America's Ad Hoc Committee on Soil Quality (S-581) defined Soil Quality as:
"the capacity of a specific kind of soil to function, within natural or managed ecosystem boundaries, to sustain plant and animal productivity, maintain or enhance water and air quality, and support human health and habitation" (Karlen et al., 1997).
Indicators or measures of soil quality describe a soil's biological, chemical and physical properties. In addition to the soil chemical properties such as nutrient content and pH, additional indicators of soil quality include a soil’s:
- Organic matter content. Organic matter stores carbon can release nutrients, support soil biological activity, buffer soil pH, hold plant nutrients, and increase a soil's water-holding capacity
- Biological activity in the soil. Soil organisms can provide multiple benefits such as nutrient cycling, secreting sticky polysaccharides that help bind together soil particles and increase soil porosity and predation, and suppression of plant pests such as plant pathogens and weed seeds.
- Soil structure and porosity. Soils with good structure and porosity can support water and air infiltration and resist compaction. Water stable aggregates are an important physical indicator of soil health. Water stable aggregates contain soil mineral particles such as sand, silt, and clay that are typically held together by a combination of binding materials including fine root hairs, soil fungal hyphae (fungal filaments), and sticky polysaccharides that are exuded from soil microorganisms. Because they are stable when wet (during or after a precipitation event) they maintain soil pores that can contain and allow air and water to infiltrate the soil, reducing water and soil run-off. Water stable aggregates can also protect organic matter from degradation and soil microorganisms from predatory micro-organisms.

Read
Chapter 1 (Healthy Soil) and Chapter 2 (Organic Matter: What it is and Why it’s so important?) from the book that you downloaded: Building Soils for Better Crops. Edition 3 [158]. Sustainable Agriculture Network, USDA. Beltsville, MD.
Then watch the following video about soil biology and list four kinds of soil organisms and how they influence soil.: The Living Kingdoms Beneath our Feet. (USDA NRCS) [162].
Video: International Year of Soils July: The Living Kingdoms Beneath Our Feet (2:08)
Module 7.2: Conservation Agriculture: A Systems Approach
Module 7.2: Conservation Agriculture: A Systems Approach
Tillage can incorporate soil amendments such as fertilizers; bury weed seeds and crop residues that may harbor diseases and insects; remove residue that insulates the soil and promotes soil warming and crop seed germination and growth. Tillage can also cause soil erosion, disrupt soil organisms and soil structure; and remove residues that slow water run-off and evaporation, conserving soil moisture. Conservation tillage practices can reduce or eliminate the need for tillage, and the integration of perennials and cover crops can also protect soil from erosion and contribute to improving soil quality. In Module 7.2, we explore tillage and cropping practices that farmers can employ and integrate to conserve and improve their soil for long-term farm productivity.
Tillage Impacts on Soil Health
Tillage Impacts on Soil Health
In addition to exposing soil to wind and water erosion, tillage can alter the physical structure, distribution of organic matter, and biological activity of soil. At the depth where the plow impacts the soil, a layer of soil compaction can develop (a plow pan), limiting water infiltration and plant rooting depth. Under tillage, crop residues, roots and root hairs, and their associated fungal hyphae are disturbed and more decomposed in the plow layer. By contrast, when roots, fine roots, and fungal hyphae are not disturbed and decomposed as rapidly, there are more channels that water, air, earthworms, and roots can move through, and soil aggregation is enhanced. Below is a schematic comparing the root zone profile of a conventionally tilled soil to a no-till soil.
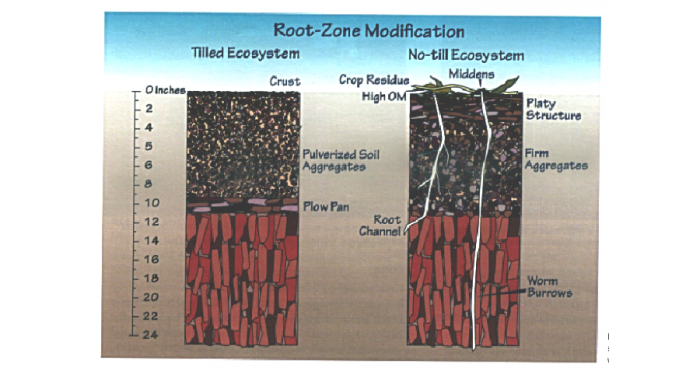
Watch the three videos below, from USDA NRCS about soil tillage and soil health.
-
Video: The Science of Soil Health: What Happens When You Till? USDA NRCS (3:05)
Click for a transcript of the What Happens When You Till video.Interviewer: When we use tillage, the soil ecosystem is disturbed on a massive scale. Purdue's Dr. Eileen Kladivko contrasted natural ecosystems with tilled systems, and what we stand to lose when soils are tilled. Eileen: If you think about natural ecosystems, they don't have a tillage implement running through them once a year or a couple of times a year, but nutrients get recycled and trees grow or grasses grow and what's recycling the nutrients are the organisms. And so, part of what we're saying with a with a no-till system, is that if you don't take an implement through there, and you allow the system to kind of come back, that there will be organisms that will do that job for you. They do it differently, obviously than a piece of metal would do it, but they can be very effective. And besides loosening the soil or making burrows, they do some of these other things, like convert nutrients, ok, recycle nutrients, have pathways where roots can grow and then those pathways stay there. You know, if you think about a tillage implement, any root channel from last year in the topsoil, is going to be totally broken up by a tillage implement the next year. If you have a nightcrawler channel, or even if you have a red worm channel, that's part of the red worm channel, it's there and then the roots can follow that and so you can have channel built upon channel, built upon channel. And the nightcrawler channel, you know, maybe a root, maybe a corn root, maybe a cover crop root, will go down that, and the next year another nightcrawler, and so on. So it builds upon itself. Interviewer: Will you explain to us why organic matter decomposes faster because of tillage? Eileen: A tillage operation does a couple things, number one is it opens up aggregates that were otherwise protected. So you're opening up more surfaces for the bacteria to decompose the organic material faster. That's probably the main reason. Sometimes people say well you're putting oxygen in the soil. It's not really so much that, as by breaking up aggregates, you expose the organic matter in the soil to decomposition. Whereas when it's in an aggregated state in the soil, some of that's protected and the bacteria that decompose that organic matter can't get to it. Interviewer: So the tillage actually favors then, say bacteria, that would live in that environment. And that may be what causes the flush of carbon dioxide and nitrates into the soil as well. Eileen: Oh yes, yes, the flush of carbon dioxide is very much related to the tillage, right. -
Video: The Science of Soil Health: Nightcrawlers and Soil Water Flow. USDA NRCS (3:05)
Click for a transcript of the Nightcrawlers and Soil Water Flow video.Interviewer: When we get to those dry summer months, good soil hydrologic function is critical. We visited with Purdue University's Dr. Eilieen Kladviko to talk about the remarkable effect that nightcrawlers have on aiding water flow into and through soils. Interviewer: Well you’re a soil physicist Eileen, so we better talk about. Eileen: We better talk about water flow. Interviewer: Let’s talk about that water flow, because obviously water is a free resource to the farmer. Eileen: Right, in general our soils are excessively wet in the spring and that's more of our issue and that's why we use tile drainage (yes) and things like that. But what I'm getting at really is that the nightcrawlers, in particular, can be very important for getting infiltration of water into the soil during the growing season. So when we get those quick thunderstorms in the middle of the summer, we usually want all that water to go in, because that's not when we have excess water. So we want the water to go into the soil, but, but especially with soils that are high silt, sometimes you can get crusting (yes). You have less crusting of course, if you're in no-till (yes). But if you have a lot of nightcrawlers, those deep channels that the night crawlers make can really help get water into the soil profile, where you have a chance for your crop to use it, as opposed to having it run off. You know an extra inch or two of water in a lot of our summers makes a big difference (okay) in yield (yes, yes). And I happen to have a few demonstrations of some night crawlers, if you'd like to see, nightcrawler channels, if you'd like to see. Interviewer: I would love to see. Eileen: So this is, my technician a number of years ago, went out and poured the liquid rubber, latex basically, that you use in in biology classes, on an area where there were some nightcrawler middens (yes). And then he came back a couple days later, after it had hardened, and he carefully dug it out. And you can see, these were nightcrawler channels, all in in this one square foot area Interviewer: one square foot, yeah. Eileen: And you can see that basically those channels are going down, they've broken a little bit now in the meantime, but some of these channels were down three feet deep (okay). And just imagine water flowing across the surface and into these channels, how much water can flow down those big and deep channels (right), and they're very vertical. You can see that there, Interviewer: So you’ve got the vertical flow and then they have the chance to flow laterally as well? Eileen: Oh yes, yes, right. Once the water is down in the soil, it's going to move out from those. Interviewer: This is a fantastic illustration and this was taken on a farm field? Eileen: Yes Interviewer: WelI, I love this, it’s great. Eileen: Yeah right, yes, I think it's a great demonstration of nightcrawler channels. -
Video: The Science of Soil Health: Compaction USDA NRCS (4:26)
Click for a transcript of the Compaction USDA NRCS video.Interviewer: You know the plow seems to be symbolic of that can-do spirit that you find in American farmers. And so when you say that there may be better alternatives to tillage for compaction relief, that seems somehow counter-intuitive and almost un-American. I met two guys from Ohio State who use science to put conventional wisdom on its head. Alan Sundermeier: We're trying to tell the farmers that you cannot solve your problems with steel. You know, steel is shiny, you can put your hand on it. You can spend a lot of money on steel. And even with the subsoiler that may have minimal surface disturbance, it's really not solving the problem. You know, we're seeing that soil structure can be better solved by using natural rooting systems to their cover crops or continuous no-till from the cropping systems. And we have some other experiments here that are proving that. We have some compaction plots, comparing subsoil steel versus living cover crops. We're purposely compacting these plots in the fall, under moist soil conditions, by using a grain cart and going back and forth over the plots and forcing that compaction. And then the cover crops are planted, and then we're comparing that to using a subsoiler and our yields are showing better results with the cover crops. And of course, when you get some heavy rains, you can see standing water problems, you know, that show up between the compaction levels of the plots, also that way. And the cover crops are outdoing the steel. Interviewer: So what's the explanation for these rather surprising results? Jim Hoorman: When, when you look at a soil, you have to look at the components. And the major component of most soil is sand, silt, and clay. Now that makes up about 45% of a really good soil. The other part of the soil, what we tend to forget about, is it should be pore space. Almost 50 percent of a really good soil is pore space. But then the most important part of a soil is the organic matter, that's like your head and your brains. That controls most of the chemical reactions and most of the life is with that organic matter. You know when you start to till a soil, what you do is you burn up the organic matter. So in the last 100 to 150 years, through tillage, we've lost probably at least 60% of our organic matter. Some studies say as much as 80 percent of the organic matter is going right up into the atmosphere. And this is a good area because this was the black swamp in in Northwest Ohio. When the first settlers came here, they said our soil was as black as midnight. And when you look at the soil now, you'll see that it's not as black. It's actually kind of a brown. It's lost its color, so it's lost a lot of its organic matter. I like to tell farmers that a lot of times, when you till the soil, you turn it into cement mix, okay, and so the soil gets very hard and dense. And one of the things that we've learned is, that if I was going to drill into cement, I would start with a small drill and then use a bigger drill to go through it. And so that's what we do with the cover crops. The cover crops actually have very fine roots and they form a small hole and then we follow that with corn and soybeans and those corn and soybeans will follow those same channels down through the soil. And they also follow earthworm holes, because earthworms are fairly big and they're also enriched with nutrients. And so those roots just really proliferate around those earthworm holes and that's how we then can actually loosen the soil up. Is it's the roots that loosen the soil up and give that carbon to the soil and also is a storehouse for all the nutrients in the water. Alan Sundermeier: So a lot of innovation is happening It's really an exciting time because farmers are seeing that there's different ways we can improve our soils by adding cover crops, you know, by not going to steel, by reducing our tillage. A lot of good innovative thinking I think has happened.
Tillage Systems
Tillage Systems
Humans have developed many different ways to prepare the soil to plant crops, with the primary goal of achieving good seed to soil contact to keep seeds moist as they germinate and grow. There are some benefits of tillage. For instance, tillage enables the farmer to bury or mix-in crop residues that insulate the soil and keep it moist and cool which can delay crop seed germination in cool environments. By burying the insulating crop residues, solar radiation can warm the soil more quickly. Tillage can also terminate weeds, cover crops or perennials, and bury weed seeds and crop residues that may harbor pathogens and insect seeds; tillage also mixes in soil amendments, such as fertilizer and animal manures.
In conventional tillage systems, primary tillage equipment such as the moldboard plow or a rototiller inverts the soil. A second tillage event or plow is often used afterward to break up large soil clods into smaller particles, with the goal of improving seed to soil contact. See photos below.
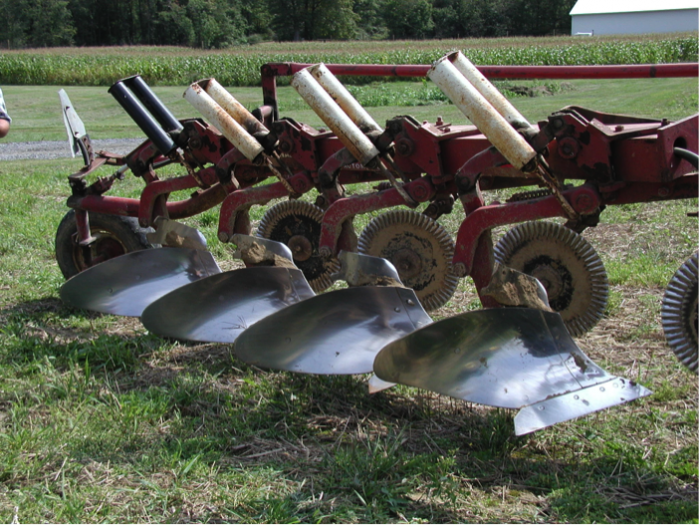
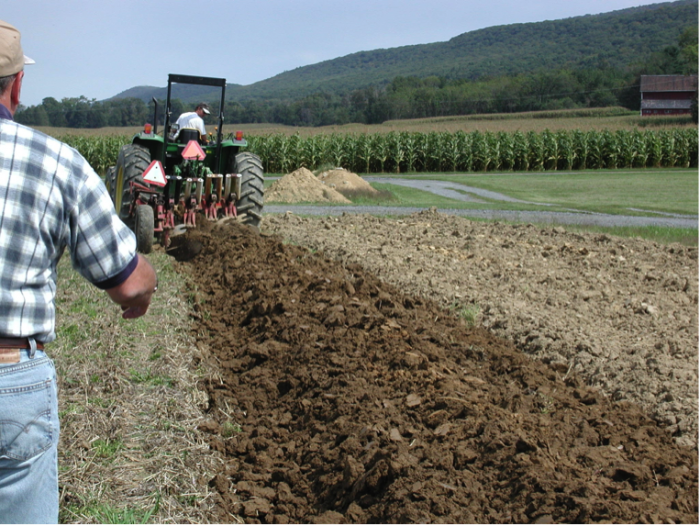
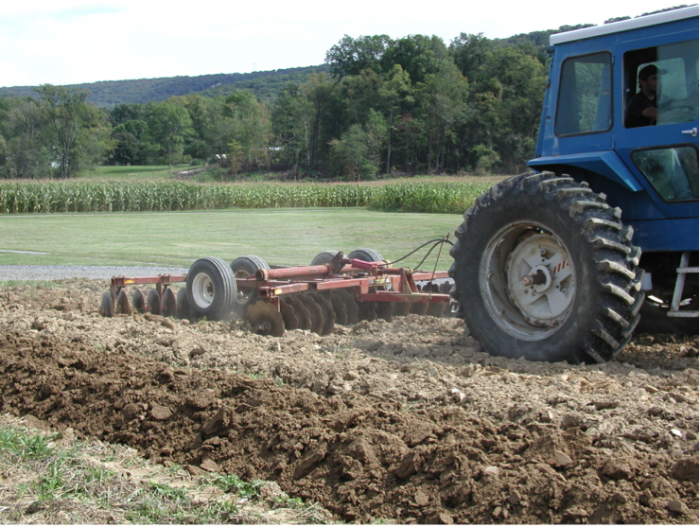
Removing or mixing-in crop residue leaves the soil exposed and prone to wind and water erosion, as well as soil moisture loss. Tilling crop residue into the soil also makes residues more accessible to soil organisms and incorporates oxygen into the soil, increasing the decomposition rate of the residues and decreasing organic matter content at the soil surface and plow layers. Tillage also disrupts soil organisms, particularly mycorrhizal fungi, and soil physical properties such as water stable aggregates.
Conservation tillage or minimum tillage is another soil preparation method designed to reduce soil erosion by reducing disturbance and leaving some plant residue (at least 30%) on the surface. The soil is not inverted, but the surface is disturbed and often a high proportion of crop residues are mixed in with tillage equipment such as a disk plow or a chisel plow.
No-till or Direct-seeding is designed to eliminate tillage, by cutting a slit in the surface and placing the seed in the slit. In addition to minimizing crop residue disturbance, the crop is planted in one pass across the field, thereby reducing erosion, labor, and fuel needed to prepare a field and plant the crop.
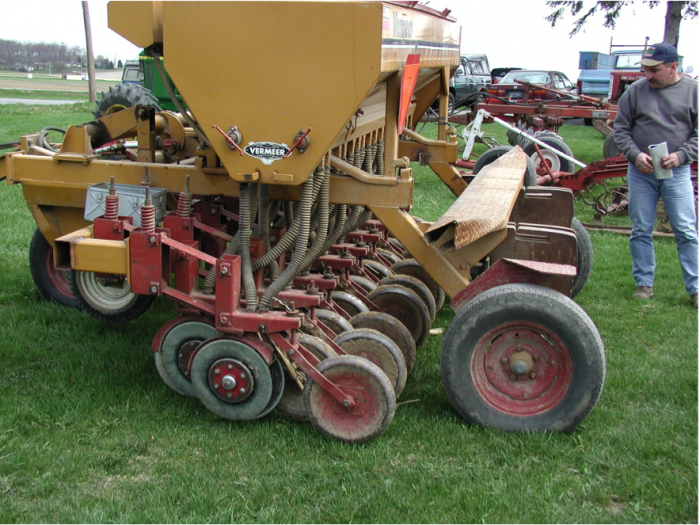
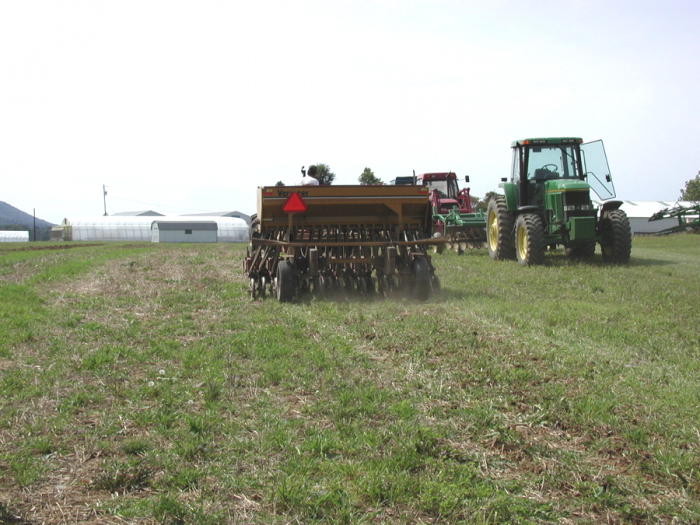
Some hurdles to no-till adoption As discussed earlier, there are a number of reasons that farmers till the soil. For instance, conventional tillage can terminate perennials, cover crops, and weeds prior to planting the subsequent crop. Without conventional tillage, farmers typically use herbicides to terminate the previous perennial or cover crop and control weeds. In cool environments, crop residues can harbor pathogen and insect pests, and insulate soil, which can slow soil warming in spring and delay crop emergence. These factors can reduce crop yield, particularly if farmers don't rotate crops to interrupt pest life cycles. In addition, although farmers typically need less tillage equipment to plant with no-till, there is an initial cost associated with purchasing no-till equipment for farmers who use conventional or conservation tillage equipment. And with new equipment, farmers need to learn how to adjust no-till planters to ensure that seed is planted at the optimal depth. Consequently, no-till planters are typically heavier to cut through crop residues and place seeds at a sufficient depth for good seed to soil contact.
Zone or strip tillage When soils have high crop residue and/or are high in organic matter, or are not well-drained, soils can remain cool and delay seed germination. Zone tillage or strip tillage incorporates the insulating crop residue in a narrow zone or strip of soil where the seed is placed. Residue between the seed planting zones is not disturbed or removed. Removing the soil insulating layer increases the rate of soil drying and warming in close proximity to the seed, promoting earlier seed germination compared to soil with residue left intact.
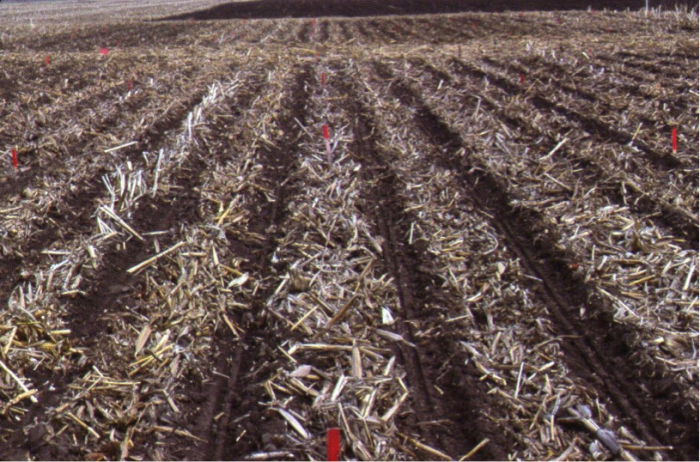
Reading
Read more about tillage and how it impacts soil, in Chapter 16 (Reducing Tillage) of Building Soils for Better Crops [163].
Continuous Cover Through Crop Management
Continuous Cover Through Crop Management
Soil conservation practices are most effective when they reduce soil disturbance or tillage and also maintain live plants in the soil.
As discussed in Module 5, perennials provide year-round live plant cover that protects soil from erosion; and their live and large root systems support rhizosphere activity and return organic matter to the soil all year. To provide continuous live roots for soil conservation and soil health, perennial crops can be rotated with annual crops, and double crops and cover crops can be integrated into annual cropping systems. Recall that in Module 7.1, a dairy crop rotation of corn-alfalfa was shown in Fig. 7.1.3b, and double cropping in Fig.7.1.4. The photos below also illustrate examples of how year-round cropping provides multiple agroecosystem benefits.
In addition, consider how managing crops and soils for soil conservation and health can enhance agricultural resilience and adaption to climate change. For instance, by increasing soil organic matter content, agricultural soil can: i. contribute to carbon sequestration (removing carbon dioxide from the atmosphere and storing it in soil), ii. improve soil structure and porosity and enhance water infiltration and water content in soil, and iii. store and cycle nutrients. Perennial crop production and double-cropping can utilize potentially longer growing seasons; provide more year-round protection of soil from erosion, and planting and harvesting crops at multiple times of the year can reduce the risk of extreme weather events or irregular weather interfering with cropping activities.
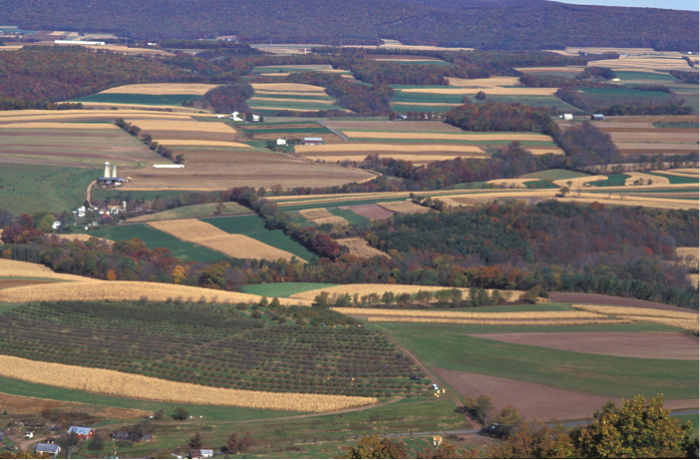
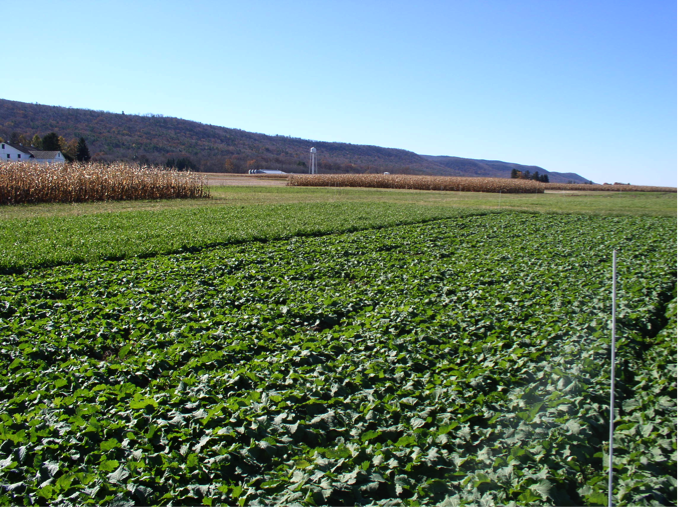
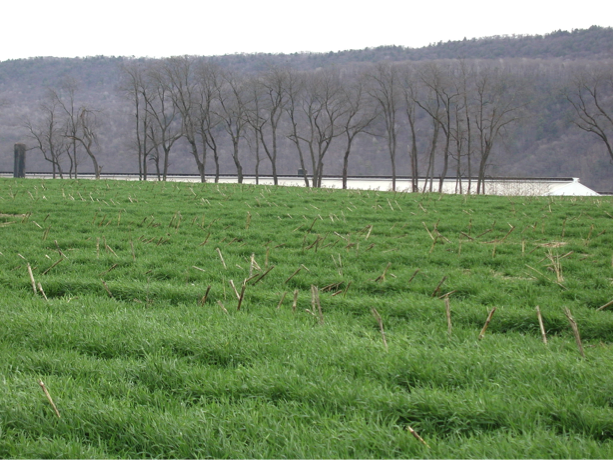
For more discussion of a crop-soil system management approach, watch the three short videos below from NRCS about the benefits of cover crops on soil health.
-
Video: The Science of Soil Health: Using Cover Crops to Soak up Nutrients for the Next Crop USDA NRCS [164] (3:08)
Click for a transcript of the using crops to soak up nutrients video.Interviewer: No farmer wants to lose precious nutrients in the cool season, but this is exactly what happens when a field is left fallow. We've visited with Penn State's Dr. Sjoerd Duiker to talk about how they use cover crops to ensure that those nutrients stay where they belong. Sjoerd: You know in Pennsylvania a special characteristic of our state is that we are very heavily reliant on the dairy sector. And our farms, they spread manure, and they spread it at times when there might not be living vegetation in the field. So the water-soluble portion of the nutrients can easily be lost. And we, being a large part of our state is in the Chesapeake Bay watershed, so we are under scrutiny. There's a lot of concern about nutrient losses to the rivers, to the streams, and eventually to the Chesapeake Bay. There are basically two periods during the year that we lose a lot of nutrients. One is in the fall, there's a little peak. And then most of the, especially nitrogen loss, occurs in the spring. That time, April, May, when we come out of the winter. The soil starts to thaw, the soil is saturated, mineralization is taking place, and now we get leaching through the soil profile. A lot of nitrogen is then lost through groundwater and eventually then, through lateral flow, ends up in the streams. So what we are trying to do is to have living cover crops that take up all those nutrients, the water-soluble nutrients, nitrogen primarily, is made available and is then absorbed by the roots. It's like a sponge, a continuous sponge, that is there. We have evaluated the nutrient uptake and what we can find in the above-ground biomass, depending on growing conditions and the type of cover crop, but it can be even 200 pounds of nitrogen per acre into the above-ground vegetation only. So that makes up typically perhaps 80 percent of the total plant biomass. The rest is underground. All that would otherwise have been liable to loss. So what we are normally considering when we grow a full corn crop, we might assume that that corn crop needs 150 pounds of nitrogen, perhaps 200 pounds of nitrogen per acre. So we are trying to really stimulate that cycling of those nutrients and avoiding them from being lost from the system. We would like to see every acre of corn silage in the state be followed with cover crops, no more fallow after corn silage. -
Video: The Science of Soil Health: Without Carrot or Stick USDA NRCS [165] (2:39)
Click for a transcript of the without carrot or stick video.Interviewer: Planting cover crops enhance the soils ability to function as a nutrient recycler. Penn State's Dr. Sjoerd Duiker talks about how dairy farmers in his state are using cover crops to improve their businesses, without regulations or subsidies. Sjoerd: In my work, I have concentrated on helping farmers adopt no-tillage systems, diversify their crop rotations, and also to fill any fallow periods in the crop rotation with living vegetation. So our principles, our guiding philosophy, is basically to have a living vegetation and living roots systems in the soil 365 days a year. So I have a project that is actually called, without carrot or stick. Because we are trying to stimulate the farmers to adopt cover crops without a carrot of subsidies, without a stick of regulation. Usually, we have 10 dairy farmers all over Pennsylvania, and it is all focused on cover crops after corn silage. There is a good window for planting the cover crops and there is a good also opportunity for using the cover crops for forage. Instead of them buying feed from outside, they are cycling more nutrients on their own farm. It's going through the animal, they’re producing some products, they’re producing manure, the manure goes back on the field. If we can produce more feed on our own farm, and cycle more nutrients on our own farms, it is very beneficial. Interviewer: How's that make you feel? Sjoerd: Yeah, that is very satisfying. We've already seen an enormous increase in the adoption of no-tillage. But now we want to really emphasize, as part of that no-till system, we need to fill all those fallow periods with living crops. And so the cover crops are a big part of that and we see that now our farmers are actually starting to use those practices. So we think it will be very beneficial for soil quality, for nutrient management, the nutrient cycling. And the farmers are intensifying their production, so we hope they can produce more forage on their own farms, cycle more nutrients on their own farm. -
Video: The Science of Soil Health: Cover Crops and Moisture USDA NRCS [166] (3:26)
Click for a transcript of the cover crops and moisture video.No cropping system is drought proof, but there are things that farmers can do to mitigate the effects of a dry year. The road took us to NC State's Dr. Chris Reberg-Horton to discuss how cover crops affect water dynamics. Chris: Water, I think, is going to be real limiting factors over the next several decades and particularly here in the southeast. We tend to get most of our summer precipitation and these huge rain events. And one of the things that cover crops bring to the system is they slow the movement of water across our fields, and so we think that we have a lot of yield potential that we can garner from cover crop residues by allowing more water to soak into the soil Interviewer: Okay, okay. Well, tell us about some of the actual work that you've done. Chris: Sure, well we've worked both in corn and soybeans at this point. So we started with soybeans and there we use a rye cover crop. One of the ways that we're going to get more biomass into these systems is not treating the cover crop as an afterthought, thinking of it as a key part of the production philosophy of the field. We plant our rye cover crops early, which makes a big difference. We try to plant that in October, as opposed to throwing it in, you know, November December timeframe. That does tremendous amounts for us. It's interesting what that does for water dynamics. I think for one thing it makes it actually drier in the spring. If you think about it, if you're gonna plant a plant out there over the winter and we're going to grow it, we're gonna extract water out of the soil over the season. So as you plant, we can actually be a fair bit drier than we would be. Now that can be a plus or minus, depending on where you're farming. So in some areas, your traditional no-till agriculture without the cover crop, we can be a bit wet and cool later into the spring. And so getting into the field can be troublesome. Some drying can be a benefit on some soil types. On some soil types, it can be a greater concern. But then at some point in the season of that soybean, we then flop. The plot that had the cover crop now becomes the wetter one because we're soaking in. Again, those big rain events that come in, we're allowing greater water infiltration in those than we are in a conventional no-till setting where we don't have that residue to break up the water. Corn, of course, we stand even greater benefit. In our work with corn we've done, again, that side-by-side comparison, with and without the cover crop. And we can see that certainly by the time we get to silking, which can be a very important time for water dynamics, those two have flopped under our conditions. So now the one with the cover crop mulch is now wetter than the one without a cover crop mulch. Both of them done via no-till. We can actually score that. We go in and we look at our corn plots and we rate when in the morning, under drought conditions, does the leaf first start to curl. That's a powerful integrator, telling you what the water stress on that plant is. And the plants under normal no-till are rolling well before, hours before we see them rolling under a no-till with a massive cover crop under there. So we think that alone right there, gives you a longer period each day to grow the set carbohydrates, to build your yield.
Check Your Understanding
Describe two or three practices that are components of the conservation system or agroecological approach of soil conservation and health.
Click for the answer.
Reduced soil disturbance through reduced tillage, particularly no-till or zone/strip tillage; Continuous plant cover through the integration of perennials, double crops, and cover crops. Returning organic matter to the soil through the application of animal manure, compost, and the integration of green manure and cover crops that are returned to the soil.
Conservation Agriculture in Brazil Case Study
Conservation Agriculture in Brazil Case Study
Activate Your Learning
Go to the FAO UN website and read their brief description of Conservation Agriculture. Then watch the short video “Conservation Agriculture in Southern Brazil [167]” (4:41).
PRESENTER: In Santa Catarina and Piranha, southern Brazil, severe soil degradation over the past two decades left many farmers with no choice-- find a solution or abandon the land. Roland Ristow began experimenting with no-tillage farming more than 20 years ago. He is considered a pioneer of conservation agriculture.
ROLAND RISTOW: [NON-ENGLISH SPEECH]
INTERPRETER: Before starting conservation agriculture, there was a lot of work to do-- plowing harrowing, tilling. And then erosion would carry off all the water. If we hadn't changed over, all these would be desert now, and there would be no crops, just stones.
PRESENTER: Cover crops are the key. Grown between annual crops, they protect the soil from the damaging effects of heavy rainfall, sun, and wind, provide nutrients, and facilitate water infiltration by reducing soil compaction. By integrating livestock production, Francisco Sedosvki saves money on feed and effectively lets the cows prepare the land for direct seeding of his next crop.
His integrated approach to resource management, which includes pig raising and fish farming, actually improves the quality of the local water supply. This farm is a model of environmentally-friendly recycling.
FRANCISCO SEDOSVKI: [NON-ENGLISH SPEECH]
INTERPRETER: We don't have to worry now because we have clean water on our farm. There's no animal waste in our stream. The situation has really improved. We can raise pigs without damaging the environment.
PRESENTER: Direct seeding makes conservation agriculture considerably less labor-intensive than conventional farming and more cost-effective. The elimination of tillage reduces machinery and fuel costs, while cover crops reduce the need for expensive chemical inputs. And even in dry years, yields increase as soil quality and water infiltration improves.
DERLI BOITA: [NON-ENGLISH SPEECH]
INTERPRETER: With conservation agriculture, you save money and you can produce more. I don't know the exact figures, but I think that our production has increased by about 30% or 40%.
PRESENTER: Time saved with conservation agriculture is used by farmers to diversify production and supplement their income. Products like sugar and jam can be sold all year round to ensure financial security for small-scale farmers. In southern Brazil, conservation agriculture has made sustainability a reality, and the Food and Agriculture Organization is already promoting the same approach in Africa and Central Asia.
JOSE BENITES: [NON-ENGLISH SPEECH]
INTERPRETER: I think that conservation agriculture really could solve a food security problem, and it could also be a valuable weapon in the fight against poverty.
PRESENTER: For many families in southern Brazil, that fight has already been won by making the most of natural resources and letting nature take its course.
After Watching the Video, Answer the Following Three Questions:
Question 1 - Short answer
Describe the soil and crop management practices that the video about Conservation Agriculture describes that promote soil quality and crop productivity.
Click for answer.
i. No-till farming, ii. Cover crops that protect the soil from erosion, provide nutrients, and reduce soil compaction, iii. Integrating livestock and crop production.
Question 2 - Short answer
In Brazil, what were some of the ecological benefits of conservation agriculture?
Click for answer.
i. Soil is protected and conserved, ii. Soil quality has improved, iii. Cover crop roots reduce soil compaction and improve water infiltration into the soil, iii. Integrating livestock and crop production helps recycle nutrients, and with fish-farming, there is less animal waste in the stream.
Question 3 - Short answer
In Brazil, what were some of the socio-economic benefits of conservation agriculture?
Click for answer.
i. No-till or direct-seeding saves labor and time to plant crops, reduces machinery needs and saves money, ii. With reduced tillage and cover crops, farmers need fewer inputs, have saved money, and production has increased, iii. Time saved has allowed farmers to diversify production and produce added-value products.
Summary and Final Tasks
Summary
In this module, you have learned how crop and soil management can protect soil from erosion, improve soil quality and maintain crop productivity in the long-term. Recall that these crop and soil conservation management practices can also help agriculture adapt to climate change because soil that is high in organic matter can store more carbon, nutrients, and water. In addition, diversifying cropping systems can reduce the risk of weather impacting all of the crops on a farm and region, and utilizing a diversity of seasonal crops and varieties can take advantage of longer or potentially different growing seasons.
Reminder - Complete all of the Lesson 7 tasks!
You have reached the end of Module 7. Double-check the to-do list on the Module 7 Roadmap [169] to make sure you have completed all of the activities listed there before you begin Module 8.1.
References and Further Reading
Erosion Control Measures for Cropland: University of Nebraska Plant and Soil ELibrary http://passel.unl.edu/pages/printinformationmodule.php?idinformationmodule=1088801071 [170]
Karlen, D.L., M.J. Mausbach, J.W. Doran, R.G. Cline, R.F. Harris, and G.E. Schuman. 1997. Soil quality: A concept, definition, and framework for evaluation. Soil Sci. Soc. Am. J. 61:4-10.
Magdoff, F. and H. VanEs. 2009. Building Soils for Better Crops. Edition 3. Chapters on Cover Crops, Crop Rotation and more. Sustainable Agriculture Network, USDA. Beltsville, MD.
Module 8: Pests and Integrated Pest Management
Module 8: Pests and Integrated Pest Management
Introduction
Agroecosystems have many beneficial species that play important roles in processes such as nutrient cycling, pollination, and pest suppression; but some species, typically called pests, reduce crop or livestock yields and/or quality. This module introduces three types of agricultural pests (insects, weeds, and pathogens) and some of the scientific research, technologies, and management approaches developed to reduce agricultural pest damage.
Goals and Learning Objectives
Goals and Learning Objectives
Goals
- Learn some benefits of insects, some characteristics of insect and weed pests, some challenges associated with insect and weed pest control, and how trophic interactions can contribute to insect pest control
- Learn what IPM is and how to apply the economic threshold concept to interpret if a pest population has reached an economic threshold
- Learn some transgenic pest management technologies and their impact
- Understand how few pest control tactics can select for pest resistance while integrated pest and weed management can contribute to long-term successful weed and pest management
Learning Objectives
After completing this module, students will be able to:
- Describe characteristics of insect pests and factors that make them successful pests, as well as beneficial characteristics of insects.
- Explain some history of agricultural pesticides.
- Describe factors that contribute to pests evolving resistance to pest control strategies.
- Discuss what IPM is and why it is effective.
- Interpret how to apply pest scouting data and distinguish if pests have reached an economic threshold.
- Analyze pest management scenarios and describe the agroecosystem benefits of IPM.
- Describe and compare the characteristics of natural ecosystems and agroecosystems, and explain how trophic level interactions and biodiversity may contribute to pest control.
- Describe characteristics of weed pests and factors that make them successful pests.
- Describe categories of weed management tactics with examples of weed control practices.
- Explain what organisms and factors contribute to crop diseases.
- Explain some recent transgenic pest management technologies and analyze and interpret scientific data about transgenic technologies.
- Differentiate pest control approaches that are likely to be effective in the long term based on IPM principles, and generate or formulate IPM approaches to enhance pest control.
Assignments
Module 8 Assignments Roadmap
Detailed instructions for completing the Summative Assessment will be provided in each module.
| Action | Assignment | Location |
|---|---|---|
| To Read |
|
|
| To Do |
|
|
Questions?
If you prefer to use email:
If you have any questions, please send them through Canvas e-mail. We will check daily to respond. If your question is one that is relevant to the entire class, we may respond to the entire class rather than individually.
If you prefer to use the discussion forums:
If you have any questions, please post them to the discussion forum in Canvas. We will check that discussion forum daily to respond. While you are there, feel free to post your own responses if you, too, are able to help out a classmate.
Module 8.1: Insects and Integrated Pest Management
Module 8.1: Insects and Integrated Pest Management
Ecosystems have many trophic levels of organisms including primary producers, herbivores, omnivores, carnivores; parasites, and decomposers. Agroecosystems are ecosystems managed for food and fiber production that have less diversity and typically fewer trophic interactions than natural ecosystems. But diverse organisms and their trophic interactions provide important functions in agroecosystems including, for instance, decomposition and nutrient cycling; plant pollination, and pest suppression. Organisms that reduce agricultural productivity and quality and are referred to as agricultural pests; these include weed pathogens, insects, and other herbivorous organisms. Mammals that graze or browse crops (ex. deer and rodents), and other arthropod species such as mites and slugs (mollusks), can also reduce crop yields through grazing and seed predation.
Natural Ecosystem and Agroecosystem Comparison
Natural Ecosystem and Agroecosystem Comparison
Pest species can be present in agroecosystems, but not cause significant crop yield loss or livestock productivity reductions. Why? What factors prevent pest populations from reducing yield? One explanation may be that the crop or livestock is resistant to the pest. For instance, a crop plant may produce compounds that fend off pathogen infection or deter insect feeding. And if environmental conditions and resources are ideal, the plant may be able to grow and recover from pest infestation. What other ecological processes and factors might contribute to agricultural resilience to pests or other stresses such as climate change?
Activate Your Learning
Question 1 - Short Answer
Draw a food web pyramid and label the trophic levels as categories of organisms with i. primary producers at the bottom, ii. herbivores next, ii. omnivores and carnivores at the top of the pyramid. Chose a natural ecosystem and list all of the species you can think of that are found at each trophic level in the natural ecosystem. Then draw a second food web pyramid for a type of farm that you are familiar with, and list all of the species you might find at each trophic level. Describe how the natural ecosystem and the agroecosystem compare. How do they differ?
Click for the answer.
You should have many more species at each trophic level in the natural ecosystem. Additionally, the genetic diversity within species in the natural ecosystem is typically greater than in the agroecosystem.
Question 2 - Short Answer
Odum (1997), an Ecologist summarized some of the major functional differences between natural and agroecosystems that are shown in the table below. Consider how your natural and agroecosystem food pyramids offer examples of the below ecosystem differences. How many predatory and parasitic species are there in the natural ecosystem and agroecosystem? How might the presence of predatory and parasitic organisms impact agricultural pests? How might genetic diversity contribute to pest management and ecosystem stability?
Click for the answer.
Although you may not be familiar with parasitic species such as wasps and nematodes, you likely can think of many predatory species: humans, large and small mammals, predatory birds, rodents, fish, and arthropods (ex. beetles, spiders, ants, etc.)
In natural ecosystems there tend to be more niches and a higher diversity of species compared to most managed agroecosystems that are simpler, have fewer predatory and parasitic species, and less genetic diversity within a species. As the table below indicates with fewer trophic interactions, there are fewer species to reduce pest populations and prevent them from reducing agricultural yield and quality. Further, with low genetic diversity within agricultural species and across the landscape, the agricultural system is more vulnerable to pest outbreaks than natural ecosystems.
| Property | Natural Ecosystem | Agroecosystems |
|---|---|---|
| Human Control | Low | High |
| Net Productivity | Medium | High |
| Species and Genetic Diversity | High | Low |
| Trophic Interactions | Complex | Simple, Linear |
| Habitat Heterogeneity | Complex | Simple |
| Nutrient Cycles | Closed | Open |
| Stability (resilience) | High | Low |
Insects
Insects
Insects are the most diverse group of animals that are found in most environments. In the Animal kingdom, Insects are in the Phylum Arthropoda; Arthropods have an exoskeleton of chitin that they shed as they grow; they also have segmented bodies and jointed appendages. In addition to the Class Insecta, the Arthropoda also includes the arachnids (spiders and mites), myriapods (ex. centipedes), and crustaceans (crabs, lobsters, etc.). Insects are distinguished from the other Arthropod classes by the following features:
-
As adults and in some species in the juvenile stages, insects have three body parts: the head, thorax, and abdomen. Although in some insect species, some of the three body parts are fused together and may be difficult to distinguish. See this website for images and more discussion of insect anatomy: Purdue University, College of Agriculture, Department of Entomology, 4-H and Youth: Insect Anatomy [178]
- The adults have antennae on their heads that they use to sense their environment, and they have three pairs of legs or six legs.
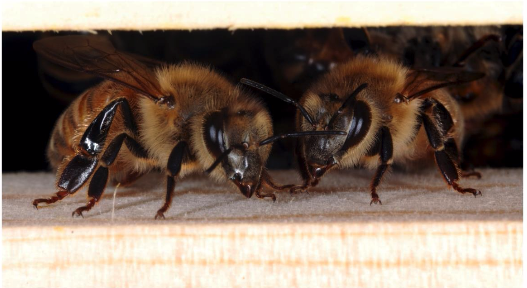 Figure 8.1.1: Honeybees are important pollinator insects. Note the three body parts (head, thorax, and abdomen) two antennae, and three pairs of legs.Credit: MaryAnn Frazier, Department of Entomology, Penn State University [179]
 - Most insects undergo a morphological change that occurs between the time they hatch from eggs and develop into adults. The morphological change is called either complete metamorphosis or incomplete metamorphosis referring to how significantly the insect's appearance changes from the early stage of development to the adult stage. Go to these links to see images of the types of metamorphosis and read more about insect metamorphosis: ASU School of Life Sciences: Metamorphosis [180]
Check Your Understanding
Question - Multiple Select
Browse the following websites for two major agricultural crop pests. What kind of organisms are they? In what stage of their lifecycle do they cause the most damage to the crop plants?
Click for answer.
Both are insects that undergo complete metamorphosis. They do the most crop feeding and damage in the larval stages when they resemble worms, that are sometimes also called caterpillars. Thus, their common names include the name: worm.
Feeding Types
Insects may be herbivores or omnivores. Herbivorous insects may eat plants by directly feeding on plant tissues such as leaves or roots. Herbivorous insects include caterpillars, beetles, grasshoppers, and ants. Some insects pierce plants and suck plant nutrients from the plant vascular system, typically the phloem, (the cells that transport plant carbohydrates and amino acids); although some insects feed on the xylem, the vascular cells that transport water and nutrients. Examples of piercing-sucking insects include aphids and mosquitoes. By contrast, butterflies and moths have siphoning mouthparts for drinking nectar. Omnivore insects consume multiple kinds of food including other insect prey and plant tissues such as leaves and/or nectar and pollen.
Beneficial insects
Although insect pests are major agronomic pests, only about 1% of insect species are agricultural pests. Insects also contribute to important ecosystem processes, including: i. pollination, ii. predation and parasitism (ex. lady beetles, lacewings, praying mantis, parasitic wasps); iii. decomposition of organic materials such as crop residues and manure (Ex. dung beetles) iv. providing food for other organisms, such as fish and birds. Review the photos below for some categories of beneficial insects, and some of their characteristics here: National Pesticide Information Center [183]
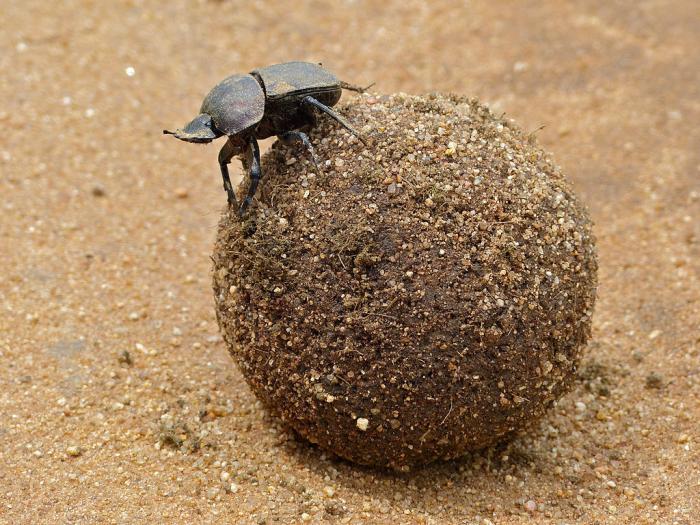
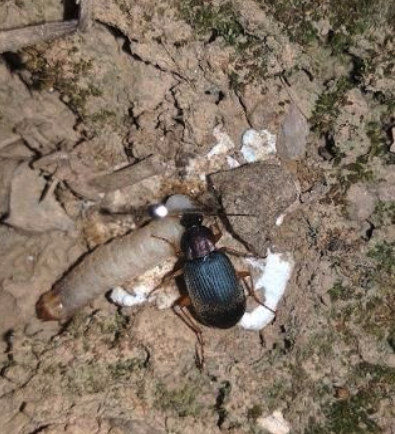
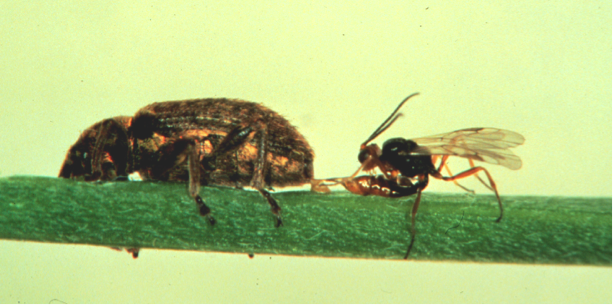
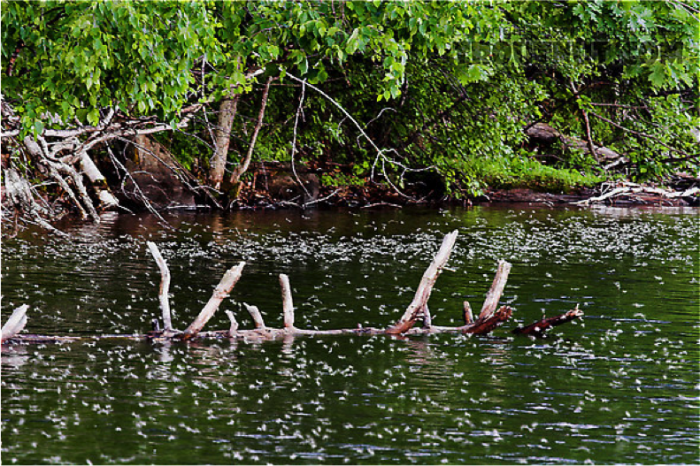
Activate Your Learning
Read the following website: Omnivorous Insects: Evolution and Ecology in Natural Agriculture Ecosystems [186].
Then answer the following questions:
What did scientists observe happened to cotton plants and insect herbivores after cotton plants were injured by herbivorous insects?
Click for answer.
To conserve or maintain predatory insects, what is required? What can farmers do to attract and conserve predatory insects?
Click for answer.
Pest Management
Pest Management
Humans have developed methods of insect and pest control for centuries.
Reading
Read the following brief history of pesticides and then answer the questions that follow:
Pesticide Development: A Brief Look at the History [187]. Taylor, R. L., A. G. Holley and M. Kirk. March 2007. Southern Regional Extension Forestry. A Regional Peer-Reviewed Publication SREF-FM-010 (Also published as Texas A & M Publication 805-124)
Check Your Understanding - Pesticide Development: Brief History
What chemicals were used to control pests from 1700 to the early 1900s?
Click for answer.
When was DDT invented and what was it first used for?
Click for the answer.
When and why was DDT banned?
Click for the answer.
Pesticide Resistance
Soon after the development of DDT in 1939 and the dawn of the modern insecticide era in the 1940s, scientists began to understand that pesticides were not the silver bullet of pest control. Particularly when a pesticide or one effective pest control strategy is relied on, the control tactic acts as a strong selective force for the development of resistance to the tactic in the target pest population. With the continuous application of the same pesticide, individuals that are susceptible to the pesticide are killed, leaving the few resistant individuals that survive to reproduce a offspring that are resistant to the pesticide. See the figure below for an illustration of how frequent reliance on one insecticide can select for a resistant insect population. Further, since many early pesticides were broad spectrum pesticides, the natural enemies of agricultural pest populations were also destroyed, contributing to pest population outbreaks.
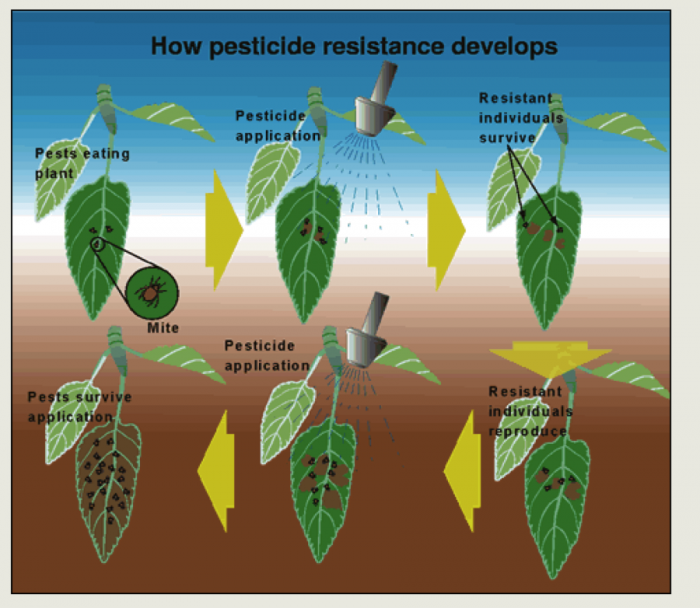
In 1984, the US Board of Agriculture of the National Academy of Sciences organized a committee to explore the science of pest resistance and strategies to address the challenge. A report called "Pesticide Resistance: Strategies and Tactics for Management" was co-authored by the Committee on Strategies for the Management of Pesticide Resistant Pest Populations and published in 1986 by the National Academies Press, Washington D.C. In Chapter 1, G. P. Georghiou (1986) documented the development of pest resistance across multiple pest organisms (see pages 17 and 28 for figure 2 [189] and figure 8 [190]), as well as how difficult and costly it was becoming to develop cost-effective pesticides (see figures 12 and 13 [191] on page 36).
In the report, the Committee recommended using Integrated Pest Management or IPM to reduce the evolution of pesticide resistance and provide more long-term, effective pest control. As early as 1959, a team of scientists (Stern et al.) in California had also proposed that pest control that integrated both biological and chemical control approaches, was needed to prevent pest resistance to pesticides and pest control. Stern et al. (1959) defined terms and concepts that are fundamental to IPM today.
Understanding Economic Thresholds
Understanding Economic Thresholds
Read the following two fact sheets for a description of Integrated Pest Management and the terms that Stern and his colleagues defined in 1959, which are still used today (economic injury level, economic threshold, and general equilibrium position). Then watch the following short video and answer the questions below:
-
The Integrated Pest Management (IPM) Concept [173]. D. G. Alston. July 2011. IPM 014-11. Utah State University Extension and Utah Plant Pest Diagnostic Laboratory
- IPM Pest Management Decision-Making: The Economic-Injury Level Concept [174]. D. G. Alston. July 2011. IPM 016-11. Utah State University Extension and Utah Plant Pest Diagnostic Laboratory
Activate Your Learning: IPM Concept and Decision-Making
Describe three things that are integrated into IPM.
Click for the answer.
On the IPM figure below, which IPM pest population terms from the article could describe the lines labeled A, B, and C?
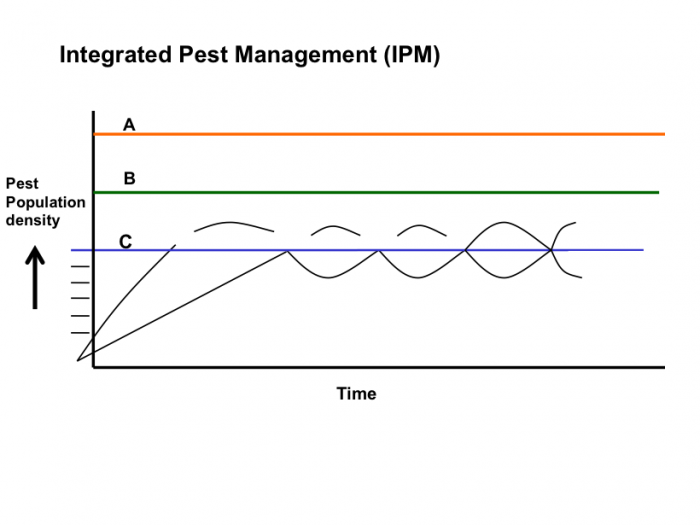
Click for the answer.
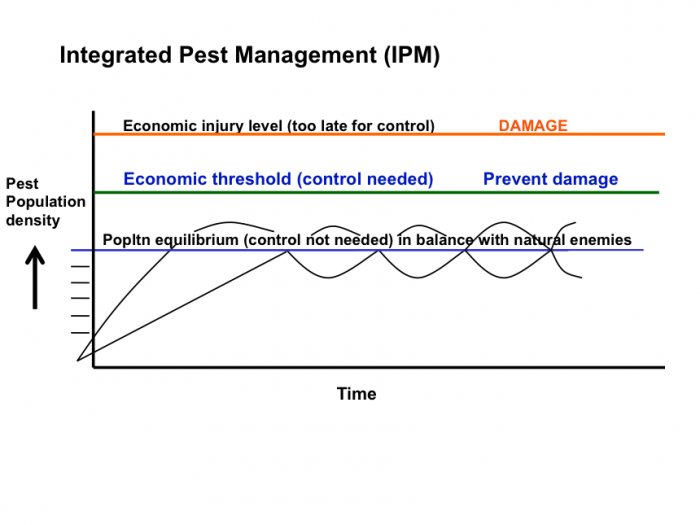
How would you describe the damage that the pest had caused to the crop at each of these pest population densities?
Click for the answer.
Watch the first 4.11 minutes of the below video: Integrated Pest Management (IPM) in Apple Orchards, which describes European Red Mite pests and predatory mites in Pennsylvania apple orchards.
Video: Integrated Pest Management (IPM) in Apple Orchards [192] (8.34)
What are the potential benefits of scouting for the European red mites and predatory mites in Pennsylvania orchards?
Click for the answer.
Formative Assessment: Australian Grain Crop IPM and Determining the Economic Threshold of Potato Leafhoppers in Alfalfa
Formative Assessment: Australian Grain Crop IPM and Determining the Economic Threshold of Potato Leafhoppers in Alfalfa
Part 1: Australian grain crop IPM
Watch the following video that explains IPM adoption in grain crops in Australia; then answer this question:
1. Identify and explain three benefits of utilizing IPM discussed in the Australian video from the GRDC.
Video 1: GCTV2: Integrated Pest Management (5:46)
Narrator: Now another aspect of the overall push for improved farming practices, is how we control pests; and Jane Drinkwater reports on the latest approach to pest control while looking after the environment.
Jane Drinkwater: Australia's crop production systems are forever improving. A prime example is how we manage insect pests. Where once broad-spectrum, often highly toxic, insecticides were used to blanket eradicate insects, there's a move towards a more holistic approach, and with good reason. Integrated pest management, or IPM, presents a win-win, less damage to the environment and to your hip pocket.
Rowan Peel (Mount Pollock VIC: I love the environment and I want to look after the environment, but I have to make a living. IPM has given us the opportunity to do all of these things, both look after the environment and to make more money.
Jane: IPM uses multiple strategies to manage insect pests. One of the tactics is to let an army of the insects’ natural predators, or beneficials, fight the battle for you, and that means holding off on the use of broad-spectrum chemicals.
Rowan: I've probably learned that nature has its way of handling things its own way. You just have to give those beneficials that time. And when you understand that when you are using a broad-spectrum insecticide that you might control it straight away, but you'll get another flight straight in. But you've killed all your beneficials, and you've killed beneficials for other pests later on. And some of these beneficials don't have the lifecycle of an aphid. You know, their lifecycle might be only once or twice a year. And so you know, economically, if you look at the long-term, you're a long way worse off.
Jane: For insects without natural predators, or where the ratio of pests to beneficials is high enough to affect yield, strategies include the application of pesticides to problem areas only and the use of chemicals which target the problem pests, without damaging the beneficial insects. Rowan: We actually treat the seed for earwig infestation to give ita protection. But if there is a further problem, and that may well only be in certain areas of the paddock, which we tend to know where they will be, we will make up a brew of wheat, a little lawsben, and a little bit of vegetable oil. And we'll go out and spread just on that area. So as the earwigs are attracted to that bait, rather than all the other insects.
Jane: Peter Enkelmann’s been using IBM for more than a decade. While his beneficials successfully control silver leaf whitefly, there are still a few pests without natural predators.
Peter Enkelmann (“Riverview” Byee QLD): The chemistry that we use here, it takes out the beneficial insects. So the attitude is to delay spraying any product at all basically, apart from very few natural viruses, right through until the very last.
Jane: And using IPM means, when you do need to pull out the big guns, they're more likely to work.
Peter: One of the big advantages is that resistance to our traditional chemistry is just dropped dramatically.
Jane: But how do growers know when to take action? Well thanks to research funded by GRDC, entomologists have data on the density of pests in each crop that will lead to economic damage. Growers measure the number of pests in their fields and only take action once they've reached this threshold.
Hugh Brier (Senior Entomologist, Primary Industries and Fisheries, DEEDI QLD): So the short-term gain is you might avoid unnecessary sprays. Another short-term gain is by not spraying when you didn't need to, you might avoid flaring another pest which is more expensive to control, so that's another benefit. Longer term, if you avoid spraying unnecessarily, you build up beneficials in the whole system and the system is much more stable.
Jane: Fundamental to successful integrated pest management is the ability to correctly identify pests and beneficial species, and to regularly monitor both populations.
Hugh: In row crops, we use a bed sheet. So we'll go and we shake the plants from meter of row and that shakes all the insects out, or a lot of them out onto the bed sheet and you can count them.
Jane: With IPM leading to lower costs and better environmental outcomes, GRDC views it as an important step forward. Apart from funding IPM Research, GRDC also provides information and training for growers.
David Shannon (GRDC Southern Region Panel Chairman): We have run a series of workshops, IPM workshops. We also work with the grower groups so that grower groups can scale up their grower members on the use of IPM.
Jane: And it's well worth getting up to speed.
Rowan: I find the system of IPM very easy because it's not an almost do nothing, but you just don't worry about it anywhere near as much.
Jane: With IBM's effectiveness in controlling insects, while reducing costs both financial and environmental, it's here to stay.
Rowan: IPM for us has cut down our chemical usage, insecticide usage a long way and you feel better for not using it.
If the video does not load for you, go to GCTV2: Integrated Pest Management [193]
Part 2: Determining the Economic Threshold of Potato Leafhoppers in Alfalfa
Read the Penn State University Potato Leafhopper on Alfalfa Fact Sheet [194].
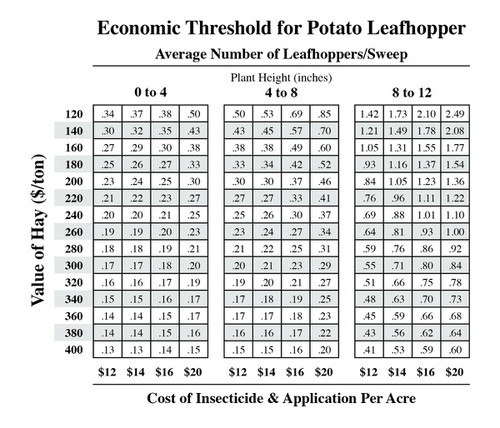
Scenario
Assume that you followed the procedure described in the Penn State fact sheet to scout for Potato Leafhoppers in an alfalfa field by sweeping 20 times with your sweepnet in each of 5 different locations in the alfalfa field. The number of leafhoppers that you found in the 5 different locations was: 15, 12, 16, 7, 13 when the alfalfa crop was about 11 inches tall. You would like the alfalfa to grow about 25-30 inches height before harvesting it for hay, this could require 2 to 3 more weeks of growth, depending on rainfall. Based on current alfalfa hay prices in your region, you estimate your alfalfa hay is worth about $250/Ton, and the insecticide you would spray to control the leafhoppers would cost about $16/A. If you spray the alfalfa field, it cannot be harvest until 7 days after spraying the insecticide; and due to toxicity to bees, the alfalfa should not be sprayed if it is flowering.
Answer the following questions:
- Calculate the average number of leafhoppers per sweep. Add the number of potato leafhoppers from the 20 sweeps in each of the 5 locations (20 X 5= 100 sweeps). Divide by 100 to calculate the number of leafhoppers per sweep. Use the Economic Threshold Table from the Fact Sheet for Potato Leafhoppers, shown here. Has the insect population reached an economic threshold for your crop at this height?
- Based on the average number of leafhoppers per sweep, what should you do? Why?
- If your crop height was 7 inches tall and you had the same number of leafhoppers per sweep that you calculated here, would your pest management decision change and how?
- Discuss at least two potential benefits of using the economic threshold decision tool rather than spraying as soon as potato leafhoppers were first visible.
Files to Download
Module 8 Formative Assessment Worksheet [195]
Submitting Your Assignment
Please complete the Module 8 Formative Assessment in Canvas.
Module 8.2: Weeds, Transgenic Crops for Pest Management, and Pathogens
Module 8.2: Weeds, Transgenic Crops for Pest Management, and Pathogens
Weeds are a major crop pest that persist in agricultural ecosystems, and significant resources are allocated to studying weeds and developing technologies to control them. What characteristics make weeds such significant pests and how can they be controlled? We will employ the plant lifecycle terms that you learned about in Module 6 to describe weed lifecycles and identify effective weed control practices. We will also explore how the principles of integrated pest management are applied in weed management; and you will learn about transgenic pest control practices that have been widely adopted for insect and weed control; as well as some plant pathogen management principles.
Weeds
Weeds
A weed is a plant that is not wanted or a plant growing in the wrong place. In agricultural systems, weeds tend to be unwanted because they compete with crops for light, water, and/or nutrients, and can reduce crop yield and/or quality, particularly if weeds are permitted to grow and reproduce. Weeds may reduce crop quality through contamination with seeds or plant parts that may be toxic, or of poor nutritional or culinary quality (produce off-flavor compounds). Some weeds may harbor crop insect pests or pathogens; and when weeds have a significant negative impact, they can reduce the economic value of agricultural land. On the other hand, if weeds are not numerous enough to reduce crop yield and quality, weeds can provide some agroecosystem benefits. For instance, weeds can provide:
-
protection from soil erosion
- pollen, nectar, and habitat for beneficial organisms and wildlife
- forage for grazing animals
Competitive Characteristics of Weeds
Weeds tend to be plants that are adaptive and competitive in a range of environmental conditions. They typically have seeds or perennial storage organs that enable them to grow rapidly and produce aboveground canopies that compete with crop plants for light, and root systems that compete for nutrients and water. Annual weed species often grow and mature relatively quickly, producing seeds earlier than crops. To increase survival of their offspring, annual weeds often produce many seeds, and some species produce large seeds. Strategies to control annual weed species target terminating them early, to prevent them from competing with crops and producing seeds.
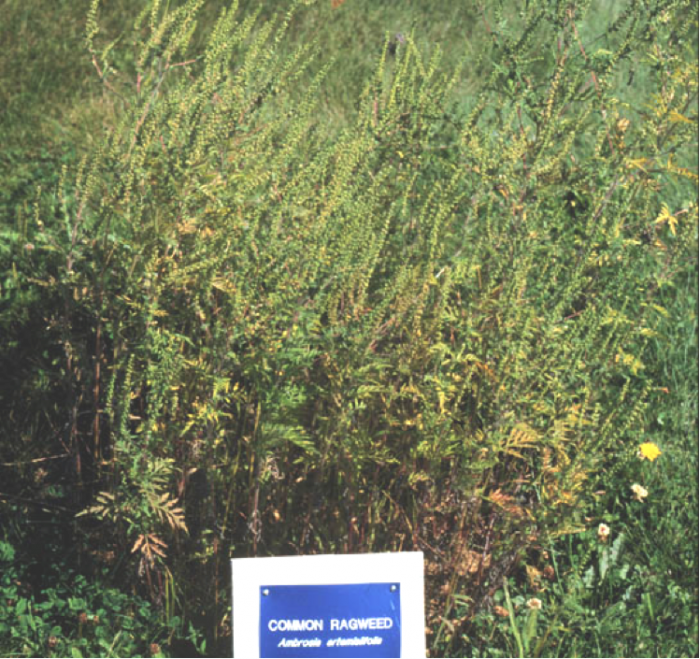
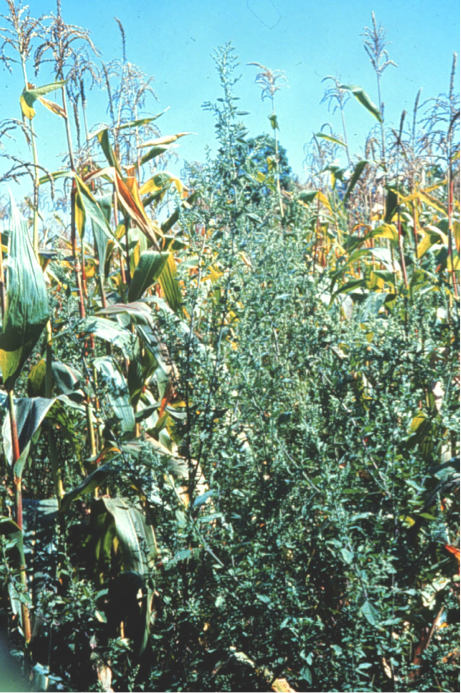
If perennial weeds are growing from the small seeds they produce, they establish more slowly than annual crop seeds. But seeds are not their primary form of reproduction, recall that perennial plants often spread and reproduce via established storage organs such as taproots, tubers, bulbs, and rhizomes (belowground modified stems that store reserves and enable a plant to spread horizontally), or aboveground stolons or storage stem bases. Perennial weeds growing from storage organs can be very competitive with crop plants. If perennial weed storage organs are cut and distributed over a larger area and reburied or partially covered, they can also establish and spread across a larger area. If weed storage organs are left on the soil surface to freeze and thaw over winter or desiccate in mid-summer, then tillage can terminate perennial storage organs. Repeated mowing of plant regrowth may weaken or deplete plant reserves, particularly if it is prior to the end of the growing season when perennials tend to translocate plant reserves to storage organs. Chemical control of perennials is also often most successful at this time when herbicides can be translocated to storage organs.
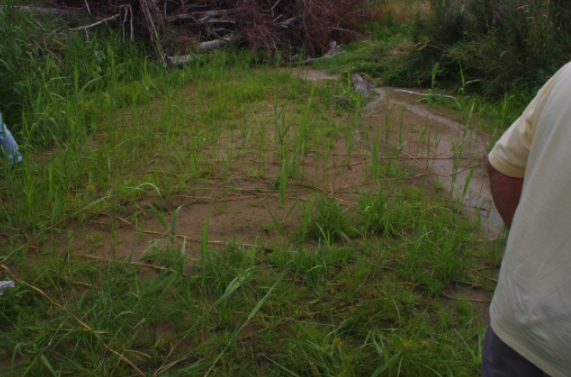
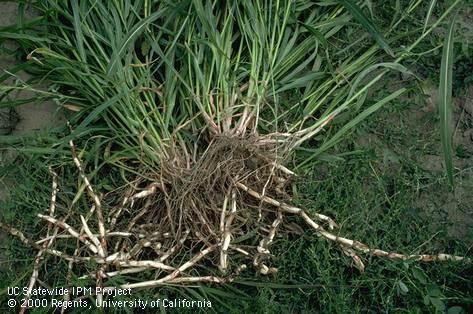
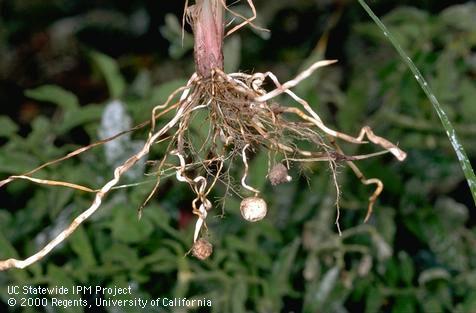
Weed Survival Characteristics
Weed Survival Characteristics
In addition, many weeds have traits that enhance their survival and reproductive success such as: i. hard-seeds or seeds that can remain dormant for long time periods until environmental conditions for germination are good, enhancing weed seed success, ii. plant protective characteristics such as thorns, toxic tissues, protected growing buds, iii. adaptive growth to a wide range of environmental conditions also referred to as plasticity. For example, in a field or lawn that is grazed or mowed to a short height to control weeds, adaptive weeds can produce leaves very close to the soil surface and flowers on short stems below the mowing height.
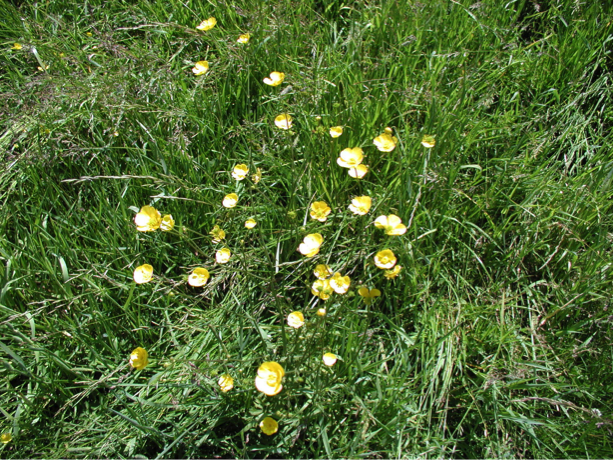
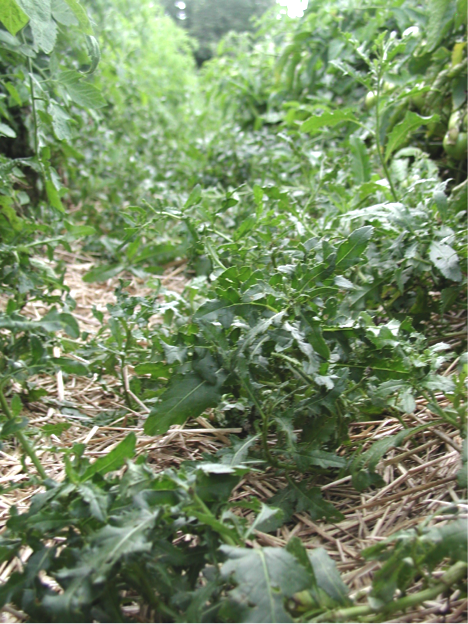
Check Your Understanding
Read about the Velvetleaf weed species (Abutilon theophrasti L.) at Velvetleaf. [199]
Velvetleaf has hard seed. How long can the seed survive? On the website click on the link that discusses Velvetleaf Adaptation and Stress. What examples does the author use to illustrate velvetleaf plasticity or ability to adapt to its growing conditions?
Click for the answer.
Activate Your Learning: Weed Control Practices
Recall what you have learned about crop plant lifecycle classification and characteristics in Module 6.
Read the Australian Department of the Environment website that describes Integrated Weed Management [200]. Click on and read the links that describe each type of weed management technique. After you have read both of the above readings, answer the questions below.
Question 1 - Essay
Review examples of the four weed control strategies discussed in these two online publications. Explain at least two specific weed control strategies that are likely to be effective for controlling annual weeds and explain why they are effective for annual weeds.
Click for the answer.
Annual weeds typically germinate, grow and develop to maturity and seed production quickly, and therefore can offer significant competition with crop plants for light, nutrients, and water. They can also produce seeds and increase weed population pressure relatively quickly. Therefore, annual weeds should be terminated early and especially prior to they produce seeds. Because annual weed species do not allocate significant resources to below ground storage organs, they can be terminated with mechanical or physical control tactics such as: plowing, cultivation, hoeing, removal by hand, hay making, mowing or grazing, soil mulching, and flaming. Allowing weed seeds to germinate and then terminating them with light tillage (stale seedbed) strategically uses tillage for weed control. Annual weed germination and establishment can be suppressed with cultural control practices such as crop rotation, rotating crops with different seasonal life cycles, successive planting (double or triple-cropping); the integration of cover crops; and managing for competitive crops with early crop planting and good crop management practices (competitive crop varieties, soil fertility and health management).
Chemical control with herbicides applied at the recommended time, and rotating or varying herbicide chemistry can reduce the evolution of herbicide-resistant weeds. Biological control can also reduce weed populations and may include conserving habitat for weed seed predators such beetles, small rodents, and birds by integrating cover and perennial crops on a farm, and avoiding pesticides that can reduce weed seed predatory populations. In addition, in some cases, browsing or grazing animals or specific pathogens of weeds such as bacteria or fungi are sometimes introduced.
Question 2 - Essay
Describe at least two weed control strategies that are likely to be effective to control perennial weeds. Explain why.
Click for the answer.
Perennial weeds have below-ground storage organs that they can regrow from (ex. tubers, rhizomes, stolons, and bulbs); therefore mechanical control strategies such as tillage, cultivation, and hoeing can break up and distribute perennial weed storage organs, facilitating the spread of perennial weeds. Mechanical weed control tactics can be effective if they can bring the majority of the storage organ to the soil surface to desiccate or freeze, thaw, desiccate and die. Perennials typically begin storing reserves for spring regrowth in late summer and early autumn. Therefore, frequent mowing or flaming can deplete a perennial weed’s storage reserves, if the tactic is repeated multiple times, particularly during summer before the plant begins replenishing storage reserves.
Applying systemic herbicides that are taken up by the plant and translocated to storage organs is also most effective in late summer and early fall when perennial plants are replenishing storage reserves. Rotating or varying herbicide chemistry can also reduce the evolution of herbicide-resistant weeds.
Cultural control strategies for perennial weed control include crop rotation between perennials and annual crops, planting perennial crops with competitive annual companion crops that are harvested early, and managing for competitive crops with early crop planting and good crop management practices.
Biological control practices as described for annual weeds can reduce perennial weed populations, and be particularly cost-effective in rangelands where other practices are often cost-prohibitive. Biological control strategies may include introducing browsing animals such as goats that will eat thorny perennial weeds, or application of weed-specific pathogens such as bacteria or fungal spores.
Herbicide Resistance
Herbicide Resistance
Although integrated pest management was introduced in the 1980s, the number of weeds that have evolved resistance to new herbicides continues to grow (See Figure 8.2.8 below).
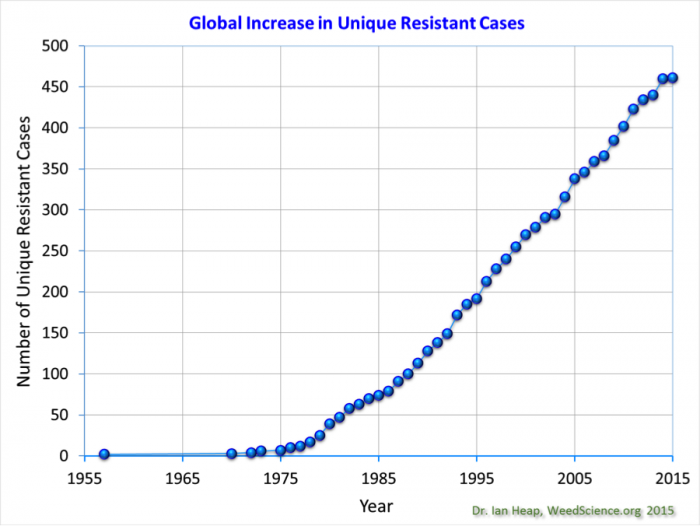
Similar to other pests, weeds evolve resistance when exposed to the same strong selective force, such as an application of the same herbicide over consecutive years. When the same herbicide is applied numerous times to a field, susceptible weeds are killed, leaving resistant individuals to reproduce and dominate the population, as illustrated in figure 8.2.9 below.
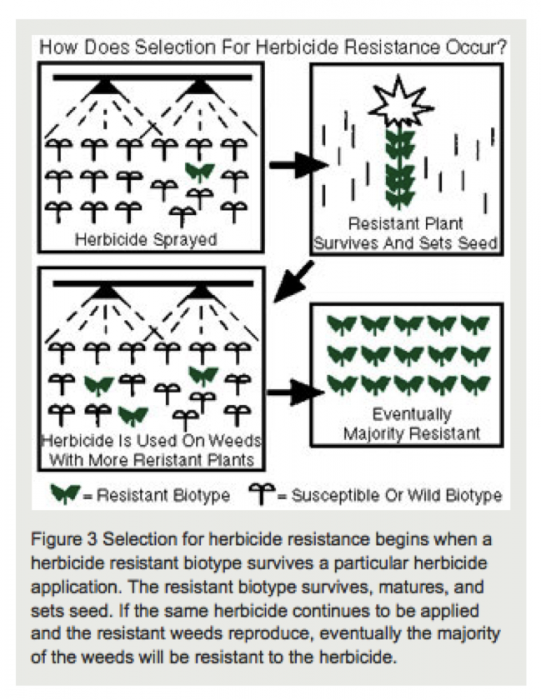
Integrated Weed Management
Integrated weed management (IWM) is an IPM approach for weeds that can provide long-term weed control of weeds by integrating multiple control strategies. Some weed scientists have described IWM as utilizing “many little hammers” as opposed to continuously employing one “big hammer” such as an herbicide (Liebman & Gallandt, 1997). Weed control tactics fall into the IPM control categories that you learned about for insect control in Module 8.1. Examples of weed control practices include the following:
-
Cultural control practices are management practices humans can employ to prevent weed establishment and maintain vigorous crop growth. Examples include: crop rotation with crops of different life cycles and seeding densities, planting certified seed that is managed to have minimal weed contamination, planting adapted crop varieties, adjusting row spacing, population density, and timing for a competitive crop and successful crop establishment, maintaining soil health and fertility, and using practices that prevent weed establishment such as cover crops and mulching.
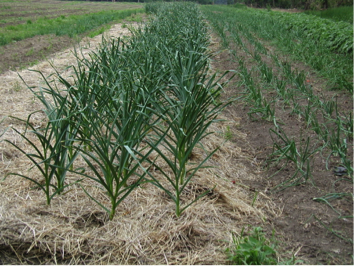 Figure 8.2.10: Straw mulch to suppress weeds in garlic.Credit: Heather Karsten
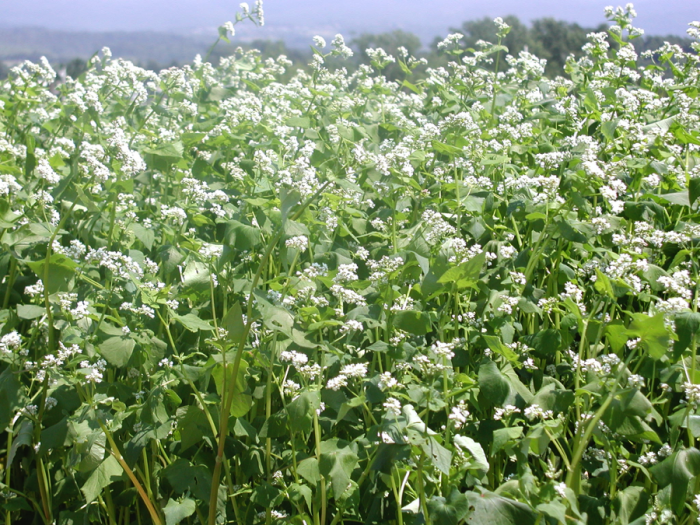 Figure 8.2.11: Buckwheat (Fagopyrum esculentum L. ) cover crop planted mid-season to smother weeds, produce organic matter and provide habitat for beneficial insects.Credit: Anna Santini
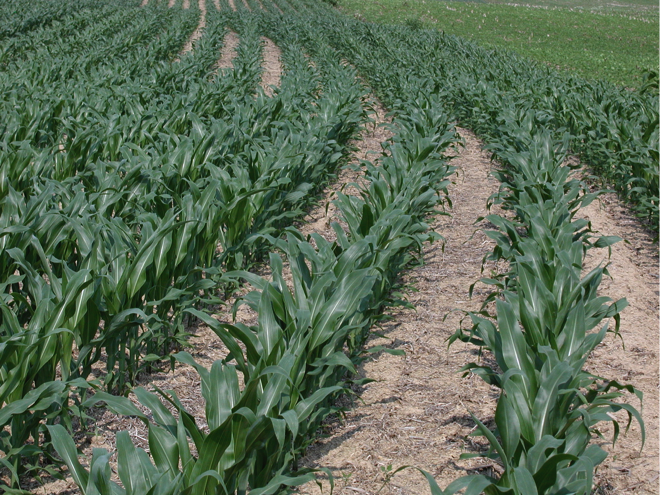
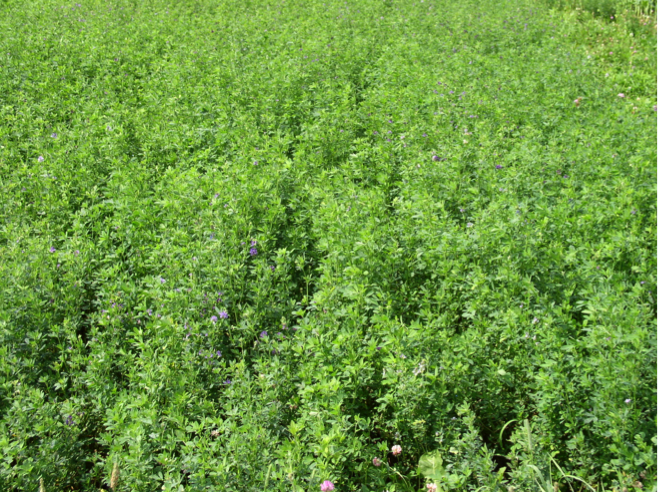
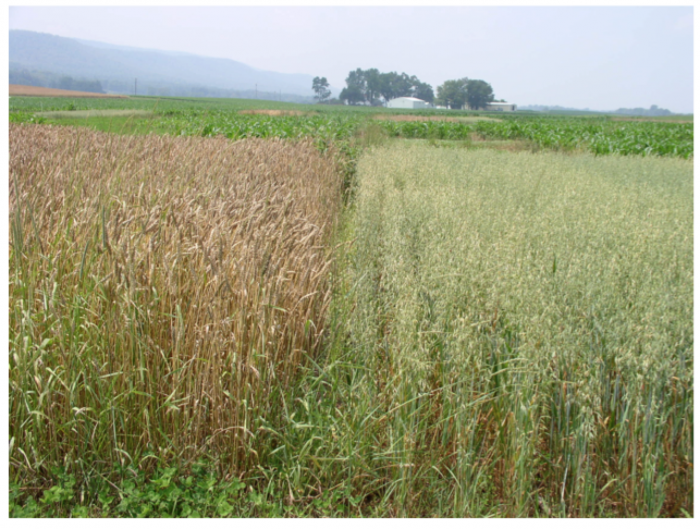 Figure 8.2.12: Crop rotation of summer annual row crops such as corn (first photo) with densely seeded perennial alfalfa (second photo), and/or densely planted winter annual wheat and spring oats (third photo, wheat is on the right, oats are on the left).Credit: Heather Karsten
 - Mechanical or physical weed control includes practices such as plowing, cultivation, hoeing, targeted hand-weeding, and flaming.
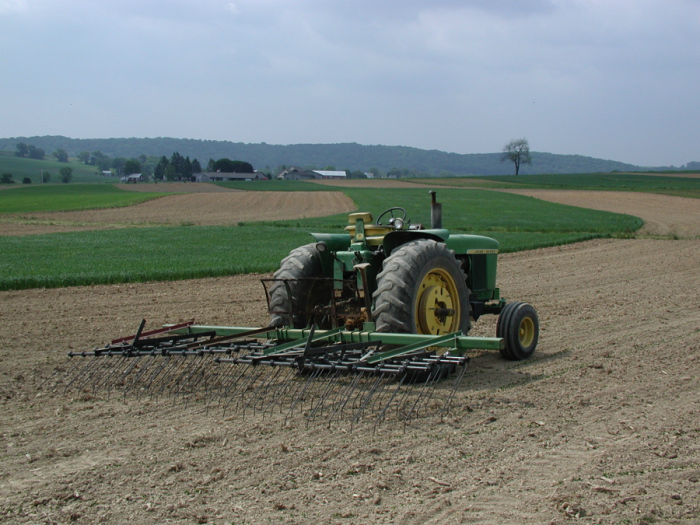 Figure 8.2.13: This flex tine cultivator is used to control weeds when they are very small.Credit: Heather Karsten
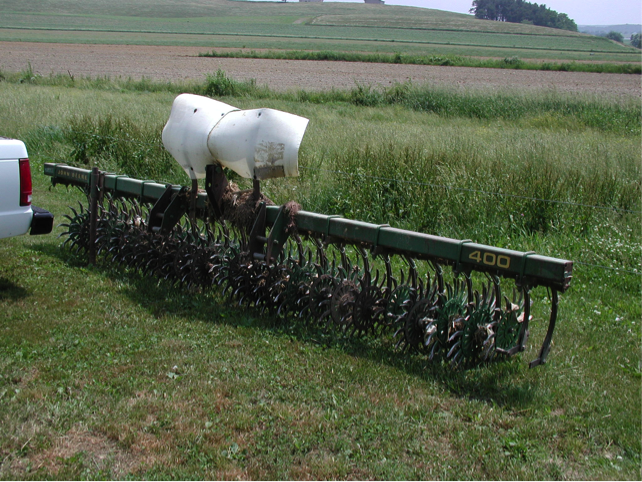 Figure 8.2.14: Rotary harrow for weed cultivation.Credit: Heather Karsten
 - Biological control: conserving or introducing herbivorous insects, grazing or browsing animals, or plant pathogens to reduce weed populations. Biological control of weeds is typically used on extensive rangeland where other more labor intensive or expensive methods are not cost effective.
- Chemical control: the application of herbicides, or the use of herbicide-resistant crops with herbicide applications to control weeds
- Genetic resistance: selecting crop varieties that are well adapted to an environment and competitive with weeds. Herbicide-resistant crops may also be considered a form of genetic resistance.
Transgenic Crops for Pest Control
Transgenic Crops for Pest Control
Transgenic crops or animals are often referred to as GMO’s or genetically modified organisms. This is misleading because all cultivated crop plants and livestock have been genetically modified through centuries of human selection and traditional breeding. A more accurate name for the genetically engineered organisms that are referred to as GMOs, is transgenic organisms. Transgenic crops or livestock contain genetic material that was transferred from a different species through biotechnology techniques or genetic engineering.
In the 1980s, agricultural input companies began developing and using transgenic techniques to develop new crop varieties. The first traits that were inserted into major crop plants and commercialized on a large scale were genes from two different species of bacteria. The transgenic traits were for insect resistance (Bt) and resistance to the herbicide glyphosate (commercially marketed as Round-up). Since the first commercial release in 1996, these technologies have been widely adopted in the US and other parts of the world (See Figure below).
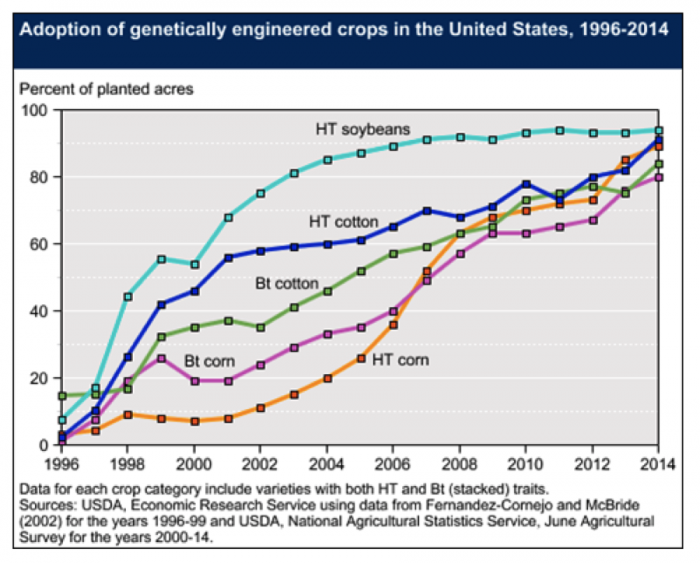
Insect Resistant Bt Crops
Insect Resistant Bt Crops
Bt is an abbreviation for Bacillus thuringiensis a bacteria that produces an enzyme that is toxic to the digestive system of insects in the Beetle; and Moth and Butterfly families. These two insect families include some major crop pests. Scientists have transferred the genes that code for the production of the toxins into crop plants. Because the Bt trait confers insect pest resistance, the adoption of Bt corn and Bt cotton has contributed to a significant reduction of insecticide use in these crops (See Figures 8.2.16- 8.2.18 below).
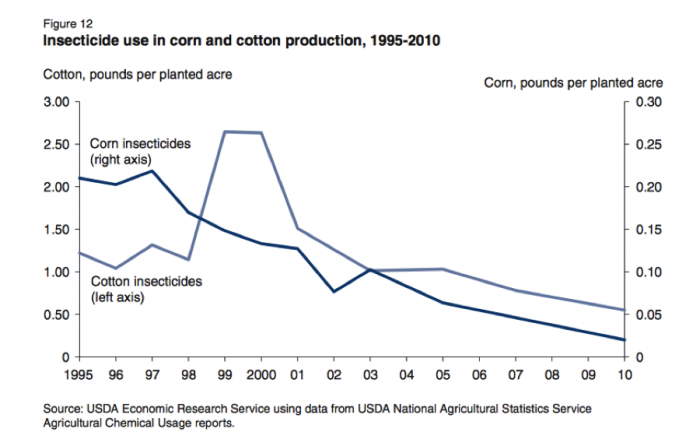
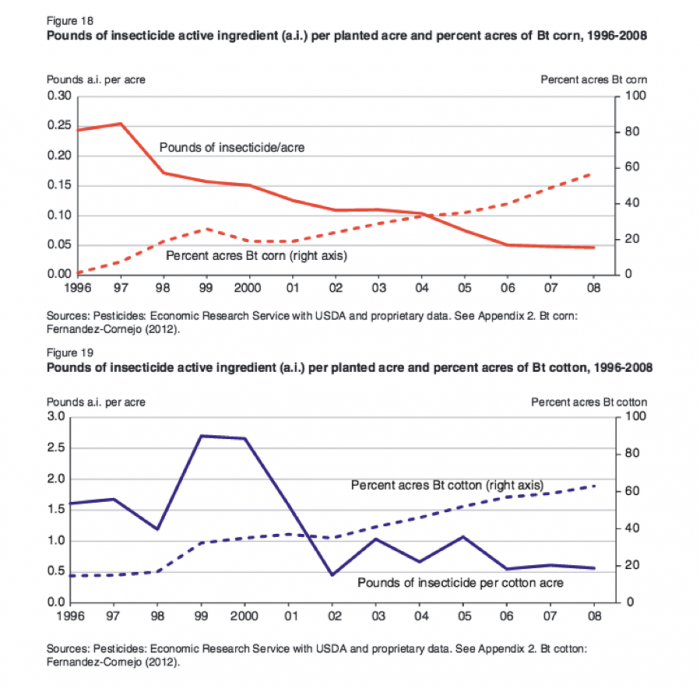
Figure 8.2.18: (Figure 19) Pounds of insecticide active ingredient (a.i.) per planted acre and percent acres of Bt cotton, 1996 - 2008.
Reading
Read this summary of the use and impact of Bt corn, in the following online article “Use and Impact of Bt Maize [172]” by: Richard L. Hellmich (USDA–ARS, Corn Insects and Crop Genetics Research Unit, and Dept of Entomology, Iowa State Univ, IA) & Kristina Allyse Hellmich (Dept. of Biology, Grinnell College, IA). 2012 Nature Education.
Check Your Understanding
Many Bt corn hybrids marketed today contain Bt Cry proteins that are toxic to the corn rootworm and are “stacked” or “pyramids”. To what does this stacked or pyramid in Bt hybrids refer?
Click for the answer.
Name three benefits of Bt corn for farmers.
Click for the answer.
To prevent the evolution of pest resistance to Bt, what practices are most recommended?
Click for the answer.
Prior to the development of Bt crops, spores of the bacteria Bacillus thuringiensis were sometimes used as biological control for insect pests in forestry and agriculture, often on organic farms. Initially, commercial Bt crops were released in the US without any regulations to prevent resistance. But science had shown that pest populations could quickly evolve resistance to Bt, and planting Bt crops on a large scale across the agricultural landscape would create a strong selective force for pests to evolve resistance to Bt. Therefore, in response to public concern about the high risk of pests evolving resistance to Bt, the EPA convened a committee that developed a resistance management plan for Bt crops.
In addition to the crop expressing a high dose of the Bt toxin, to prevent or delay pest resistance to Bt farmers who plant transgenic Bt corn and cotton, are required to plant a refuge, a percentage of the crop field or a field close by that does not express the Bt trait. The refuge area conserves a population of insects that are susceptible to Bt, so that the susceptible insects can reproduce with insects that might have resistance to Bt, sustaining some Bt-susceptible individuals in the population. Depending on the presence of Bt crops in a region, the EPA regulation requires that farmers plant between 5% and 20% of their crop field without the Bt trait. For stacked Bt corn hybrids (with 2 or more Bt traits) farmers must plant the required refuge for each Bt trait that their crop expresses. For more information on refuge requirements, read Insect Resistance Management and Refuge Requirements for Bt Corn [205], from the University of Wisconsin.
Pest Resistance to Transgenic Bt Crops
Despite the refuge requirement in the US, western corn rootworm resistance to Bt corn was reported in multiple Midwestern states (Jakka et al., 2016). The first reported Bt-resistant corn rootworm populations were found in cornfields in Iowa that had been planted to Bt corn consecutively for at least three years, and the authors suggested that the fields likely did not include refuge corn (Gassman et al., 2011). Additional studies also found that the Bt toxin dose was not sufficiently high to delay the evolution of insect resistance and that corn rootworm could evolve resistance to additional Bt toxins in three to seven generations (Gassman, 2016). Further, in 2013 pest resistance to Bt crops was reported in 5 of 13 major pest species in a survey of 77 studies from eight countries across five continents, where resistance management requirements and enforcement varied. Practices that delayed resistance to Bt included the Bt crop expressing a high dose of the Bt toxin and an abundance of refuge crop planting (Tabashnik, et al., 2013). In accordance with integrated pest management principles, entomologists also recommend that other control tactics be utilized to control pests targeted by Bt crops.
In a number of countries (ex. most countries in the European Union), Bt crops and transgenic crops were not approved for commercial production. Concerns about the potential human health and ecological risks of transgenic crops limited acceptance of Bt crops and other transgenic crops. Applying the precautionary principle, some policy-makers and the public require more research and long-term assessment of transgenic traits on human health and ecosystems. An interest in protecting domestic seed markets and companies may also contribute to policy decisions to prohibit the adoption of transgenic seeds produced by multi-national seed companies.
Herbicide Resistant Crops
Herbicide Resistant Crops
Herbicide-resistant (or tolerant) crops, such as glyphosate-resistant crops are transgenic crops that are resistant to the herbicide glyphosate. Glyphosate is a broad-spectrum herbicide that controls a wide range of plants and breaks down relatively quickly in the environment; it was first marketed under the trade name: Round-up. Round-up Ready soybeans were released in the US in 1996, and since then, additional glyphosate-resistant crops (corn, cotton, canola, sugarbeet, and alfalfa) have been developed and widely adopted in the US and other countries (Fernandez-Cornejo J. and S. J. Wechsler, 2015; Benbrook, 2014; Duke and Powles, 2009). See Figure 8.2.15 on the Transgenic Crops for Pest Control page: Adoption of genetically engineered crops.
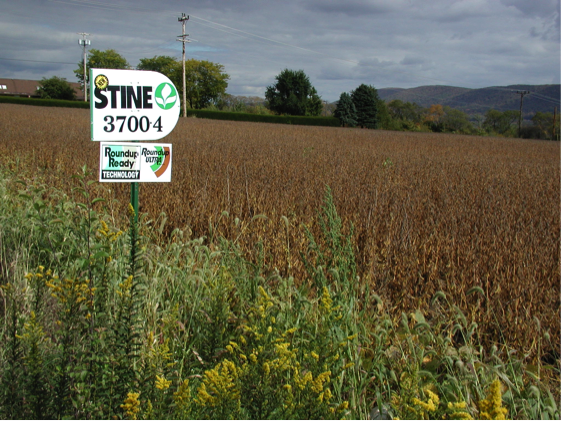
Herbicide-resistant (HR) crops such as glyphosate-resistant crops have facilitated the increased adoption of no-till or direct seeding of some HR crops because tillage is not needed for weed control. Once a crop has emerged, the risk of glyphosate herbicide damage to the HR crop is eliminated, making it easier for farmers to plant crops and control weeds without tillage. However, although Bt crops reduced insecticide use, the glyphosate herbicide must be applied to glyphosate-resistant crops to control weeds. Since they were first introduced in 1996, glyphosate use has increased. See the Figure 8.2.20 from the USGS Pesticide National Synthesis project below.
In addition, in contrast to Bt crops, the EPA did not require farmers to employ a glyphosate resistance management plan or refuge, and the number of weeds that are resistant to glyphosate has increased. Weeds have evolved resistance to glyphosate particularly in cases where farmers consistently applied glyphosate to manage weeds in HR crops and terminated cover crops and/or perennials with glyphosate prior to planting an HR crop. See the Figure 8.2.21 from the International Survey of Herbicide Resistant Weeds illustrating the increase in glyphosate-resistant weeds below.
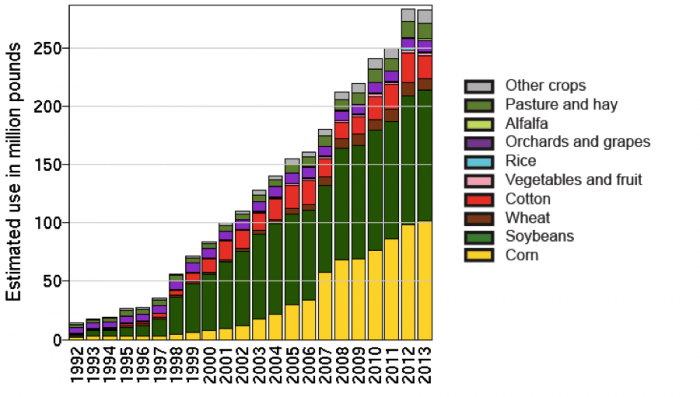
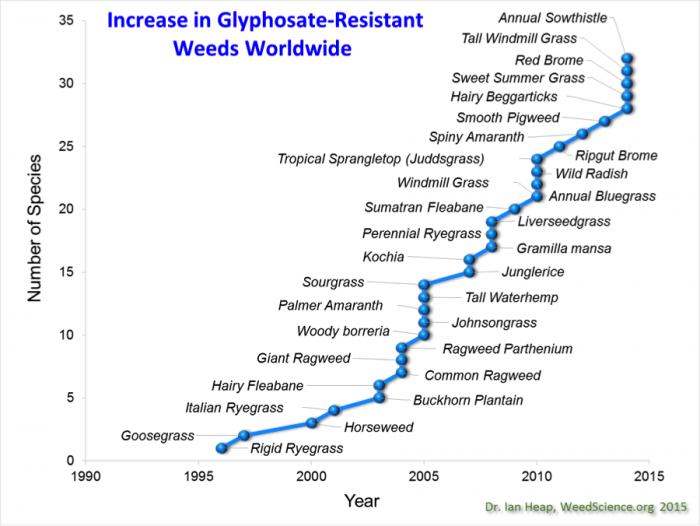
Stacked Herbicide-Resistant Crops
When the number of glyphosate-resistant weeds increased and became difficult to control, the agricultural-input industry developed transgenic herbicide-resistance crops that are resistant to additional herbicides. Dow AgroSciences developed a transgenic trait for resistance to 2,4-D, an herbicide that controls broadleaf weeds (dicot plants) and the company stacked or added the trait to soybean and cotton crops that also have resistance to glyphosate. And Monsanto produced a transgenic trait for resistance to an herbicide called dicamba that they stacked (or added to) soybeans that have glyphosate resistance. Dicamba and 2,4-D herbicides are volatile, and there is a risk that when the herbicides are sprayed, they will drift into neighboring fields and field edges, potentially damaging other crops and other plants. Wild plants in field edges and natural ecosystems often provide habitat for beneficial organisms, such as pollinators, pest predators, and wildlife. In 2017, Monsanto's crops with stacked dicamba and glyphosate resistance were available for use in some midwestern and southern states, where glyphosate-resistant weeds were particularly problematic. In 2017, there were so many reports and complaints from farmers about crop damage due to dicamba drift, that the states of Arkansas and Missouri banned dicamba spraying for some of the growing season. The EPA also investigated the complaints, and in autumn 2017, the EPA announced that the companies had agreed to new steps to reduce the risk dicamba drift with dicamba-resistant crops. For more information, see the EPA Registration of Dicamba for Used on Genetically Engineered Crops. [208]
We will explore concerns about the stacked, herbicide-resistant technologies and tactics to manage glyphosate-resistant weeds more in the Summative Assessment.
Plant Pathogens
Plant Pathogens
Pathogens include fungi, bacteria, nematodes, and viruses, all biological organisms that can cause disease symptoms and significantly reduce the productivity, quality, and even cause the death of plants. Pathogens can also infect agricultural animals, but for this module, we will focus on plant pathogens. Read the following brief overview of plant pathogens, Plant Disease: Pathogens and Cycles [209].
Pathogens can be introduced and spread to host plants in many ways. Bacteria and fungal spores can be transferred by wind, in rain, and from the soil via rain splashing onto plant tissues. Insects can vector or infect a plant with a pathogen when they feed on an infected host plant, and then move and feed on an uninfected plant. Pathogens can also spread through infected seeds, transplants, or contaminated equipment, irrigation water, and humans.
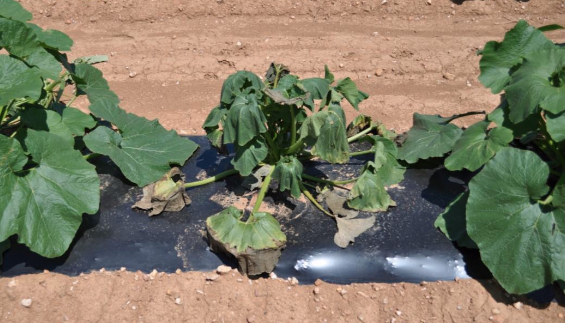
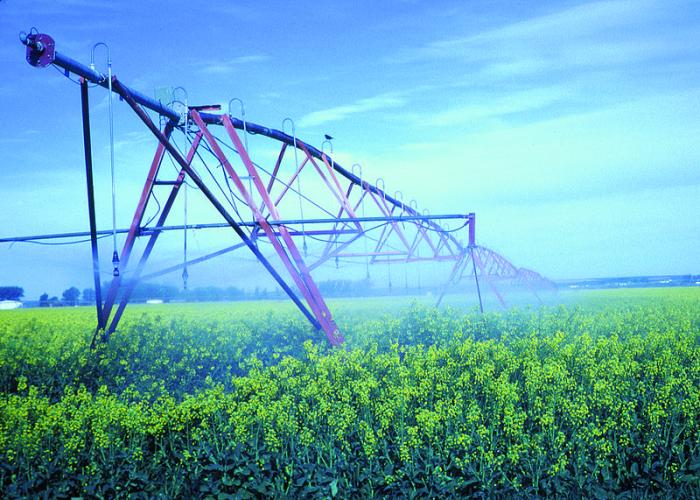
Plant Disease Triangle: Plant pathologists have identified three factors that are needed for a plant disease to develop:
i. a susceptible host Some pathogens have a narrow host plant range, meaning they can infect just a few host species. For instance, the primary host crops of Late blight (Phytophthora infestans) are tomato and potato. For more information see Tomato-Potato Late Blight in the Home Garden [211]. By contrast, pathogens with a wide host plant range can infect many different host species. There are almost 200 plant species that can be infected by Bacterial wilt (Ralstonia solanacearum). For more information, see Bacterial Wilt - Ralstonia solanacearum [212].
ii. a disease-causing organism (pathogen). Plant pathogens include fungi, bacteria, viruses, and nematodes. For examples, again, see the reading: Introduction to Plant Diseases [175], A. D. Timmerman, K.A. Korus. 2014. University of Nebraska-Lincoln. Extension. EC 1273.
iii. a favorable environment for the pathogen. Pathogens usually require specific humidity and temperature conditions for pathogen infection and disease symptoms to manifest. For instance, Late Blight disease symptoms are most likely to occur when the weather is cool and wet.
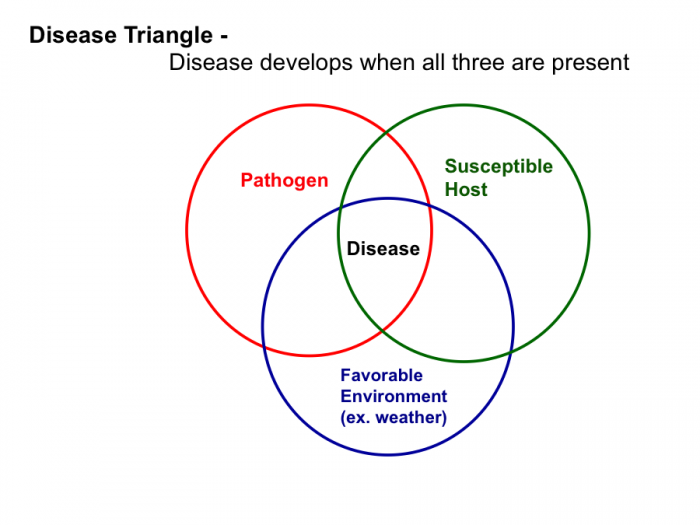
Disease Diagnosis
The three disease triangle factors are important for diagnosing the cause of disease symptoms. Pathologists consider the weather, environmental conditions and the host species to diagnosis what pathogen is causing disease symptoms. Pathologists also consider other factors that could favor and help diagnose a disease, such as i. the field history, particularly what crops and pathogens were present in the past, ii. current crop management practices, iii. when disease symptoms were visible, and on what other species. To assist farmers and others with disease diagnosis, many land-grant universities in the US have crop and animal diagnostic disease clinics where one can submit diseased tissue samples with detailed information that can aid in the diagnosis, such as the host species, environmental conditions, the site history, and management.
Pathogen Management
Although disease control practices could be categorized into the pest control approaches that were discussed earlier for managing insects and weeds (genetic, cultural, chemical, etc.), plant pathologists typically describe pathogen control tactics with more specific language. For instance, Exclusion tactics involve rejecting infected transplants from being introduced to a farm.
Prevention or Avoidance of pathogen introduction and spread tactics include:
- crop rotation, particularly for pathogens with narrow host ranges
- sanitizing equipment for planting, trellising, pruning, and harvesting
- managing for healthy vigorous crops with optimal soil and water nutrient management
- managing to avoid environmental conditions that promote pathogens, such as avoiding very humid conditions due to over-watering, or promoting drying of plant surfaces with wide row spacing to facilitate air flow, or using drip-tape irrigation that waters plants at or below the soil surface versus over the canopy
- using physical barriers such as row covers, mulch to reduce water splashing; and high tunnel/hoop houses or greenhouses to prevent the introduction of rain and wind-borne pathogens
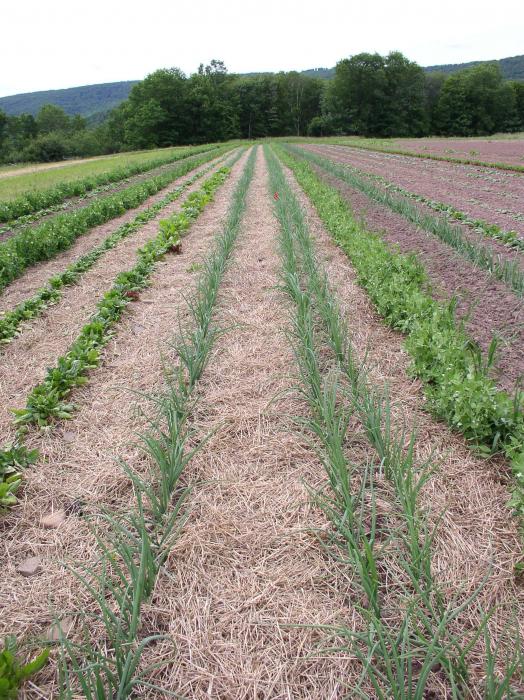
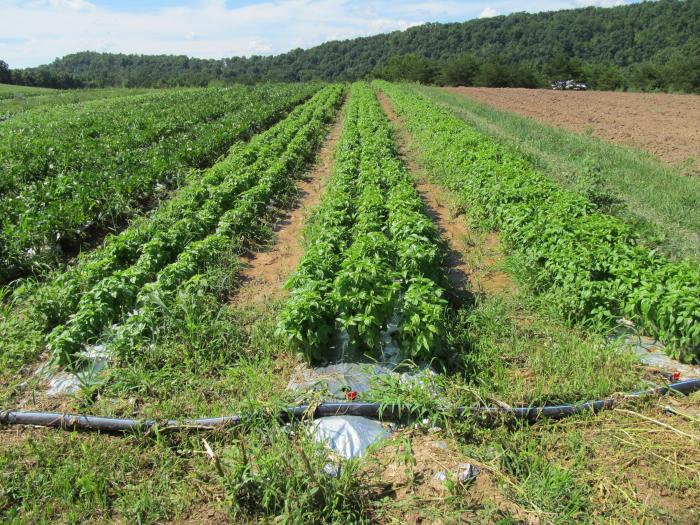
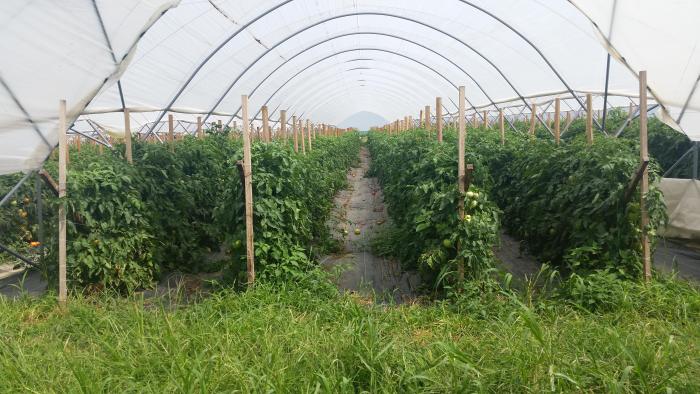
Genetic resistance to pathogens is a very valuable and important pathogen control tool. Many plant breeding programs select for genetic resistance to pathogens. When available, pathogen resistance traits are included in most crop variety descriptions to help growers select appropriate crop varieties for their farm.
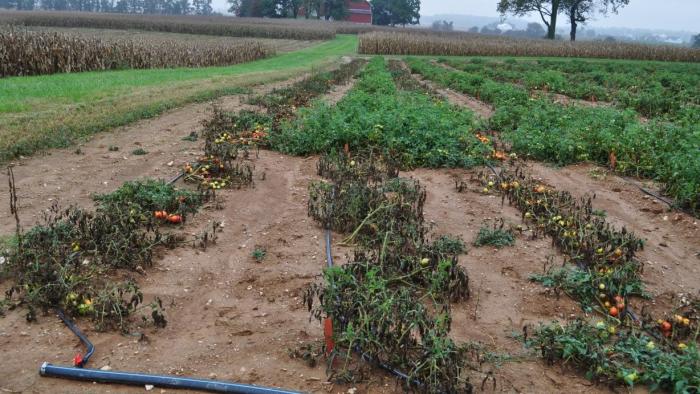
If disease symptoms develop, infected plants may be Eradicated or destroyed. And materials that may have been contaminated with pathogens, such as the soil and planting containers, can be heated to very high temperatures with pasteurization equipment or through solarization. For instance, soil may be solarized by placing black plastic over the crop bed (planting zone) during the warm season to increase the soil temperature and destroy pathogens prior to planting the crop.
Therapy or Fungicides (chemical control) may be applied to infected plants to terminate pathogens. Particularly when plant pathogen symptoms are identified early and favorable weather conditions for the pathogen are projected to continue, fungicides can prevent disease spread and significant economic losses. In some high-value crop systems, the soil may be fumigated prior to planting crops.
Similarly, in agricultural livestock systems, animals with disease symptoms can be treated with antibiotics. And in some livestock production systems, antibiotics and vaccinations are administered to animals to prevent diseases and pathogen infection.
Activate Your Learning
Read Nonchemical Disease Control [213], from Colorado State University Extension and identify some pathogen control tactics that could also qualify as other types of pest control categories that we have explored in this module (such as genetic, cultural, and chemical control).
Click for the answer.
- Cultural control strategies: Prevention and Avoidance through crop rotation and management of the crop environment. Exclusion and Eradication of inoculum through sanitation to the survival of plant pathogens on crop residues and agricultural equipment and managing for healthy vigorous crop growth.
- Genetic: Resistance, Selecting and breeding crop varieties for resistance to plant pathogens is one of the primary means of disease management, particularly in agronomic crops.
- Chemical: Fungicides that are toxic to pathogens
- Physical or mechanical: Protection of crops via barriers such as plant netting or soil mulching. Eradication could also be qualified as a physical control strategy
- Regulatory: Quarantines
Summative Assessment: Herbicide-Resistant Weed Interpretation and Management of Multiple Pest Types
Summative Assessment: Herbicide-Resistant Weed Interpretation and Management of Multiple Pest Types
Note
Please read through the entire assignment before you begin the assignment. Once you have done that, return here to follow the link and review the information.
Explore the International Survey of Herbicide Resistant Weeds [207] to examine the trends of herbicide-resistant weeds and answer the questions below. By going to the "US State Map [214]" to click on different states and "map of different countries [215]" to move your cursor over different counties, compare the number of herbicide-resistant weed species across a range of geographical regions.
You will also use the following information in the proposed scenario:
Dow AgroSciences developed a transgenic trait for resistance to 2,4-D, an herbicide that controls broadleaf weeds (dicot plants), that has been transferred to soybean, corn, and cotton crops. The trait is stacked or added to soybeans that also have resistance to glyphosate, and another herbicide called glufosinate.
Monsanto has produced a transgenic trait for resistance to an herbicide called dicamba, that they are stacking (or adding to) soybeans that have glyphosate resistance. Some formulations of the dicamba herbicide are volatile, and there is a risk that when farmers spray dicamba it will drift into neighboring fields and field edges, potentially damaging other crops and wild plants in field edges and natural ecosystems. These field edges and other plants often provide habitat for beneficial organisms, such as pollinators, pest predators, and wildlife.
Please also read these short NPR articles on dicamba:
With ok from EPA use of controversial weedkiller is expected to double [216]
A wayward weed killer divides farm communities harms wildlife [217]
If you are interested in more information about the use of dicamba and Arkansas' recent restrictions on the herbicide you may read or listen to the following brief (3-minute) story: Arkansas defies Monsanto moves to ban rogue weed killer [218]
Directions
Read the following scenario and in approximately 450-500 words answer the questions below. I suggest you write your response in a separate document and then copy and paste it into Canvas. Once you have posted your own answers, you need to respond to ONE classmate. Your response should be approximately 150 words.
Assume you manage a 200-acre corn and soybean farm in Southern Pennsylvania. You keep up with the latest technological advances in farming and use seeds from either Dow or Monsanto depending on what your seed salesperson recommends. You are proud of your farm and strive to keep your crops free from both weeds and harmful insects that could damage your crop and cut into your profits. Your immediate neighbors on the East side have a large organic vegetable production farm. Based on what you have observed on the above website, the information mentioned above, and from what you have learned through the readings in this module, answer the following questions:
- What are some potential problems you might encounter if you adopt seeds with the new herbicide traits listed above? How do these problems differ between now and in the future?
- What other weed-control strategies could you use to control glyphosate-resistant weeds?
- How might your pest management system affect your neighbors?
- Are there strategies you can use to mitigate potential harm to your neighbors’ fields?
- If you were farming in Thailand or Egypt instead of in Pennsylvania, what might explain differences in the number of herbicide-resistant species you encounter there compared to your farm in the United States?
- If you farmed in Canada, Australia, or Western Europe what might explain the herbicide-resistant species you encounter there?
Consider the following possible questions when responding to a classmate:
- How do their answers differ from yours?
- Are there suggestions you can make to help them improve their IPM practices-for weeds as well as insects?
- Do they have possible solutions you could use on your farm?
- Is there a question you have about why or how they answered the way they did?
Files to Download
Module 8 Summative Assessment Worksheet [219]
Submitting Your Assignment
Submit your response in Module 8 Summative Assessment Discussion in Canvas.
Summary and Final Tasks
Summary
Scientists have identified and continue to study and develop strategies to reduce the impact of pests in agriculture. Pest species that are subject to one or few pest control practices over time inevitably develop resistance to the strong selective force. Multiple biological factors and ecological processes, however, influence host-pest population interactions, providing many opportunities to combine pest control tactics and identify new pest control approaches. Climate change will also pose new pest challenges. Some of these challenges are discussed in the online resource that you read parts of in Modules 4 and 5. We highly encourage you to read this a short summary of some of the research on Climate Change Impacts in the United States [220]. See Section title: Key Message 2: Weeds, Diseases, and Pests.
Reminder - Complete all of the Module 8 tasks!
You have reached the end of Module 8! Double-check the to-do list on the Module 8 Roadmap [221] to make sure you have completed all of the activities listed.
References and Further Reading
Benbrook. C. 2014. Impacts of genetically engineered crops on pesticide use in the U.S. -- the first sixteen years. Environmental Sciences Europe 2012, 24:24. doi:10.1186/2190-4715-24-24
Duke. O. S. and S. B. Powles. 2009. Glyphosate-Resistant Crops and Weeds: Now and in the Future AgBioForum, 12(3&4): 346-357
Gassmann A.J., Petzold-Maxwell J.L., Keweshan R.S., Dunbar M.W. 2011. Field-evolved resistance to Bt maize by western corn rootworm. PLoS One. [222] 2011:6(7):e22629. doi: 10.1371/journal.pone.0022629. E pub 2011 Jul 29.
Gassman, A. J. 2016. Resistance to Bt maize by western corn rootworm: insights from the laboratory and the field. Current Opinion in Insect Science. 15: 111-115. doi.org-10.1016/j.cois.2016.04.001.
Georghiou. G. P. 1986. The Magnitude of the Resistance Problem. Chapt 1. 14-44. In Pesticide Resistance: Strategies for the Management. Eds. Committee on of Pest Populations; Board of Agriculture, National Research Council.
Gunsolus, L. J. Weed Science, Department of Agronomy and Plant Genetics. Herbicide-resistant weeds [202].
International Survey of Herbicide Resistant Weeds [207].
Jakka, S. R. K., R.B. Shrestha, and A. J. Gassmann. 2016. Broad-specture resistance to Bacillus thuringiensis toxins by western corn rootworm (Diabrotica virgifera vergifera). Scientific Reports. 6:27860. doi:10.1038/srep27860.
Liebman, M. and E. R. Gallandt. 1997. Many little hammers: ecological management of crop-weed interactions. Pages 291–343 in L. E. Jack- son, ed. Ecology in Agriculture. San Diego, CA: Academic.
Odum, E. P. 1997. Ecology: A Bridge Between Science and Society. Snauer Associates: Sunderland, MA.
Stern, V. M., Smith, R. F., van den Bosch, K. & Ragen, K. S. 1959. The integration of chemical and biological control of the spotted alfalfa aphid: the integrated control concept. Hilgardia 29:81-101.
Tabashnik B., Brevault, T., Carriere, Y. 2013. Insect resistance to Bt crops: lessons from the first billion acres. Nature Biotechnology 31: 510-521.
Additional Reading:
- FAO UN More About IPM [223]
- Cornell University’s Pesticide Safety Education Program (PSEP) [224] Part of the Pesticide Management Education
- Cullen, E., and R. Proost, D. Volenberg. 2008. Insect Resistance Managment and Refuge Requirements for Bt Corn [205]. University of Wisconsin Extension. Pest and Nutrient Management Program.
Module 9: Food and Climate Change
Module 9: Food and Climate Change
Introduction
We've seen in previous modules how crucial climate is in food production. Temperature and precipitation are critical factors in the growth of crops, choice of crops, and food production capacity of a given region. In this module, we'll first review the mechanism and projected effects of human-induced climate change. We'll also explore the role that agriculture plays in contributing to human-induced climate change. In the second half of this module, you'll explore the varied impacts that climate change may have on agricultural production. The summative assessment for this module will be an important contribution to your capstone project, as you'll be exploring the potential future climate changes in your assigned regions, and begin proposing strategies to improve the resilience of your assigned region.
Goals and Learning Objectives
Goals and Learning Objectives
Goals
- Outline the basic science behind human-induced climate change and the contribution from agriculture.
- Compare various potential impacts of climate change on our global and local food systems.
- Select strategies that enhance the resilience of food systems in the face of a changing climate.
Learning Objectives
After completing this module, students will be able to:
- Identify climate variables that affect agriculture.
- Explain possible climate change impacts on crops.
- Summarize the mechanisms of human-induced climate change.
- Explain the role of food systems in contributing to climate change.
- Discuss how climate change impacts food production and yield.
- Evaluate how farmers adapt to climate change.
- Differentiate impacts of climate change on climate variables in different regions.
Assignments
Module 9 Roadmap
Detailed instructions for completing the Summative Assessment will be provided in each module.
| Action | Assignment | Location |
|---|---|---|
| To Read |
|
|
| To Do |
|
|
Questions?
If you prefer to use email:
If you have any questions, please send them through Canvas e-mail. We will check daily to respond. If your question is one that is relevant to the entire class, we may respond to the entire class rather than individually.
If you prefer to use the discussion forums:
If you have any questions, please post them to the discussion forum in Canvas. We will check that discussion forum daily to respond. While you are there, feel free to post your own responses if you, too, are able to help out a classmate.
Module 9.1: Understanding Global Climate Change and Food Systems
Module 9.1: Understanding Global Climate Change and Food Systems
We hear a lot about global climate change and global warming in the news, especially about the controversy surrounding proposed strategies to reduce carbon emissions, but how well do you understand the science behind why our climate is changing and our planet is warming? In this unit, we'll review the basic science that underpins our understanding of global warming. Agriculture is one of the human activities that contributes carbon dioxide to the atmosphere, so we'll consider those contributions and how they can be reduced. Finally, we'll start to look to the future. What are some of the projections for future temperatures? We need to know what the future projections are so that we can plan to make our food systems more resilient to expected changes.
Introduction
Introduction
Understanding the Science of Climate Change: The Basics
Module 9 focuses on how agriculture contributes to global climate and how climate change will affect global agriculture. In addition, we'll explore agricultural strategies for adapting to a changing climate. But, before we explore the connections between global climate change and food production, we want to make sure that everyone understands some of the basic science underpinning global climate change.
Have you ever thought about the difference between weather and climate? If you don't like the weather right now, what do you do? In many places, you just need to "wait five minutes"! If you don't like the climate where you live, what do you do? Move! Weather is the day-to-day fluctuation in meteorological variables including temperature, precipitation, wind, and relative humidity, whereas climate is the long-term average of those variables. If someone asked you what the climate of your hometown is like, your response might be "hot and dry" or "cold and damp". Often we describe climate by the consistent expected temperature and precipitation pattern for the geographic region. So, when we talk about climate change, we're not talking about the day-to-day weather, which can at times be quite extreme. Instead, we're talking about changes in those long-term temperature and precipitation patterns that are quite predictable. A warming climate means that the average temperature over the long term is increasing, but there can still be cold snowy days, and blizzards even!
The two videos below are excellent introductions to the science of climate change. We'll use these videos as your introduction to the basic science behind our understanding of climate change that we'll build on as we explore the connections between climate change and food production in the rest of this module. Follow instructions from your instructor for this introductory section of Module 9.
Optional Video Climate Change: Lines of Evidence
The National Academies of Sciences Engineering and Medicine have prepared an excellent 20-minute sequence of videos, Climate Change: Lines of Evidence, that explains how scientists have arrived at the state of knowledge about current climate change and its causes. Use the worksheet linked below to summarize the story that the video tells about anthropogenic greenhouse gas emissions and the resulting changes in Earth's climate. The narrator speaks pretty quickly, so you'll want to pause the video and rewind when you need to make sure you understand what he's explaining. It's important to take the time to understand and answer the questions in the worksheet because you'll use this information in a future assignment.
If instructed by your instructor, download detailed questions about the Climate Change: Lines of Evidence videos:
- MSWord docx -Climate Change: Lines of Evidence video questions [232]
- pdf -Climate Change: Lines of Evidence video questions [233]
Video: What is Climate? Climate Change, Lines of Evidence: Chapter 1 (25:59)
Another resource you can use to help answer the questions is the booklet that goes with this video: Climate Change: Evidence, Impacts, Choices [234]. It is 40 pages, so you might not want to print it. Use it as an online reference.
Penn State geology professor, Richard Alley's, 45-minute video uses earth science to tell the story of Earth's climate history and our relationship with fossil fuels. There is no worksheet associated with this video.
Optional Video: Earth: The Operators' Manual (53:42)
RICHARD ALLEY: All across the planet, nations and cities are working to reduce their dependence on fossil fuels and promote sustainable energy options.
ANNISE PARKER: Because it's the smart thing, because it makes business sense, and it's the right thing. NARRATOR: In China, Europe, and Brazil, energy innovations are changing how we live. And in the US, every branch of the military is mobilizing to cut its carbon bootprint.
DAVID TITLEY: We really believe that the climate is changing.
RICHARD ALLEY: In this program, we'll share how we know Earth is warming and why and discover what Earth science tells us about clean, green energy opportunities. I'm Richard Alley. I'm a geologist at Penn State University. But my research has taken me around the planet, from Greenland to Antarctica. I'm fascinated by how our climate has changed dramatically and often, from times with ice everywhere to no ice anywhere on the planet. Records of past climate help us learn how our Earth operates. What has happened can happen again. And I know that sometimes, things change really fast. I'm a registered Republican, play soccer on Saturdays, and go to church on Sundays. I'm a parent and a professor. I worry about jobs for my students and my daughter's future. I've been a proud member of the UN Panel on Climate Change. And I know the risks. And I've worked for an oil company and know how much we all need energy. And the best science shows we'll be better off if we address the twin stories of climate change and energy, and that the sooner we move forward, the better. Our use of fossil fuels for energy is pushing us towards a climate unlike any seen in the history of civilization. But a growing population needs more and more clean energy. But I believe science offers us an operator's manual with answers to both of these huge challenges.
[MUSIC PLAYING] NARRATOR: "Earth-- The Operator's Manual" is made possible by NSF, the National Science Foundation, where discoveries begin.
RICHARD ALLEY: Humans need energy. We always have and always will. But how we use energy is now critical for our survival. It all began with fire. Today, it's mostly fossil fuels. Now we're closing in on 7 billion of us, and the planet's population is headed toward 10 billion. Our cities and our civilization depend on vast amounts of energy. Fossil fuels-- coal, oil, and natural gas-- provide almost 80% of the energy used worldwide. Nuclear is a little less than 5%, hydropower a little under 6%, and the other renewables-- solar, wind, and geothermal-- about 1%, but growing fast. Wood and dung make up the rest. Using energy is helping many of us live better than ever before. Yet well over 1.5 billion are lagging behind, without access to electricity or clean fuels. In recent years, Brazil has brought electricity to 10 million. But in rural Ceara, some still live off the grid-- no electricity, no running water, and no refrigerators to keep food safe. Life's essentials come from their own hard labor. Education is compulsory, but studying is a challenge when evening arrives. The only light is from kerosene lamps. They're smoky, dim, and dangerous. Someday, this mother prays, the electric grid will reach her home.
TRANSLATOR: The first thing I'll do when the electricity arrives in my house will be to say a rosary and give praise to God.
RICHARD ALLEY: More than half of China's 1.3 billion citizens live in the countryside. Many rural residents still use wood or coal for cooking and heating, although most of China is already on the grid. China has used energy to fuel the development that has brought more than 500 million out of poverty. In village homes, there are flat-screen TVs and air conditioners. By 2030, it's projected that 350 million Chinese-- more than the population of the entire United States-- will move from the countryside to cities, a trend that's echoed worldwide. Development in Asia, Africa, and South America will mean 3 billion people will start using more and more energy as they escape from poverty. Suppose we make the familiar, if old-fashioned, 100-watt light bulb our unit for comparing energy use. If you're off the grid, your share of your nation's energy will be just a few hundred watts, a few light bulbs. South Americans average about 13 bulbs. For fast-developing China, it's more like 22 bulbs. Europe and Russia, 5,000 watts, 50 bulbs, and North Americans, over 10,000 watts, more than 100 bulbs. Now let's replace those light bulbs with the actual numbers. Population is shown across the bottom and energy use displayed vertically-- off the grid to the left, North America to the right. If everyone everywhere started using energy at the rate North Americans do, the world's energy consumption would more than quadruple. And using fossil fuels, that's clearly unsustainable. No doubt about it-- coal, gas, and oil have brought huge benefits. But we're burning through them approximately a million times faster than nature saved them for us, and they will run out. What's even worse-- the carbon dioxide from our energy system threatens to change the planet in ways that will make our lives much harder. So why are fossil fuels such a powerful, but ultimately problematic, source of energy? Conditions on the waterways of today's Louisiana help us understand how fossil fuels are made and why they're ultimately unsustainable. Oil, coal, and natural gas are made from things-- mostly plants-- that lived and died long ago. It's taken hundreds and millions of years for nature to create enough of the special conditions that saved the carbon and energy and plants to form the fossil fuels that we use. Here's how it works. Plants, like these tiny diatoms encased in silica shells, grow in the upper layers of lakes and oceans, using the sun's energy to turn carbon dioxide and water into more plants. When they die, if they're buried where there's little oxygen to break them down, their chemical bonds retain the energy that began as sunlight. If enough carbon-rich matter is buried deeply enough for long enough, the Earth's heat and pressure turn it into fossil fuel, concentrating the energy that once fed the growing plants. Vary what goes into Earth's pressure cooker and the temperature, and you end up with the different kinds of fossil fuel. Woody plants make coal. Slimy plants, algae, will give you oil, and both of them give rise to natural gas. The fossil fuels formed over a few hundred million years, and we're burning them over a few hundred years. And if we keep doing that, sooner or later, they must run out. But there's a bigger problem with fossil fuels. As we've seen, they're made of carbon, primarily. And when you burn them, you add oxygen, and that makes CO2 that goes in the air. We're reversing the process by which they formed. And if we keep doing this, it must change the composition of Earth's atmosphere. What CO2 does was confirmed by basic research that had absolutely nothing to do with climate change.
REPORTER: A continuance of the Upper Air Program will provide scientific data concerning the physics of the upper atmosphere.
RICHARD ALLEY: World War II was over, but the Cold War had begun. The US Air Force needed to understand the atmosphere for communications and to design heat-seeking missiles. At certain wavelengths, carbon dioxide and water vapor block radiation, so the new missiles couldn't see very far if they used a wavelength that CO2 absorbs. Research at the Air Force Geophysics Laboratory in Hanscom, Massachusetts produced an immense database with careful measurements of atmospheric gases. Further research by others applied and extended those discoveries, clearly showing the heat-trapping influence of CO2. The Air Force hadn't set out to study global warming. They just wanted their missiles to work. But physics is physics. The atmosphere doesn't care if you're studying it for warring or warming. Adding CO2 turns up the planet's thermostat. It works the other way as well. Remove CO2, and things cool down. These are the Southern Alps of New Zealand, and their climate history shows that the physicists really got it right. These deep, thick piles of frozen water are glaciers-- slow-moving rivers of ice sitting on land. But once, when temperatures were warmer, they were liquid water stored in the sea. We're going to follow this one, the Franz Josef, from summit to ocean to see the real world impact of changing levels of CO2. It's beautiful up here on the highest snow field, but dangers lurk beneath the surface. I've spent a lot of time on the ice. It's standard practice up here to travel in pairs, roped up for safety. The glacier is fed by something like six meters of water a year-- maybe 20 meters, 60 feet of snowfall, so really seriously high snowfall. The snow and ice spread under their own weight, and it's headed downhill at something like a kilometer a year. When ice is speeding up a lot as it flows towards the coast, it can crack and open great crevasses that give you a view into the guts of the glacier. Man, this is a big one. 10, 20, 30, meters more, 100 feet or more heading down in here. And we can see a whole lot of the structure of the glacier right here.
MAN: So what we're going to do is just sit on the edge and then walk backwards, and then I'll lower you.
RICHARD ALLEY: Tell me when. OK. Roll her around, and down we go. Snowfall arrives in layers, each storm putting one down. Summer sun heats the snow and makes it look a little bit different than the winter snow. And so you build up a history. In these layers, there's indications of climate-- how much it snowed, what the temperature was. And all of this is being buried by more snow. And the weight of that snow squeezes what's beneath it and turns it to ice. And in doing that, it can trap bubbles. And in those bubbles are samples of old air-- a record of the composition of the Earth's atmosphere, including how much CO2 was in it, a record of the temperature on the ice sheets and how much it snowed. As we'll see, we can open those icy bottles of ancient air and study the history of Earth's atmosphere. This landscape also tells the story of the Ice Ages and the forces that have shaped Earth's climate. Over the last millions of years, the brightness of the sun doesn't seem to have changed much. But the Earth's orbit, and the tilt of its axis, have shifted in regular patterns over tens and hundreds of thousands of years. The orbit changes shape, varying how close and far the Earth gets as it orbits the sun each year. Over 41,000 years, the tilt of Earth's axis gets larger and smaller, shifting some of the sunshine from the Equator to the poles and back. And our planet has a slight wobble, like a child's top, altering which hemisphere is most directly pointed towards the sun when Earth is closest to it. Over tens of thousands of years, these natural variations shift sunlight around on the planet, and that influences climate. More than 20,000 years ago, decreasing amounts of sunshine in the Arctic allowed great ice sheets to grow across North America and Eurasia, reaching the modern sites of New York and Chicago. Sea level fell as water was locked up on land. Changing currents let the oceans absorb CO2 from the air. That cooled the Southern Hemisphere and unleashed the immense power of glaciers, such as the Franz Josef, which advanced down this wide valley, filling it with deep, thick ice. Now we're flying over today's coastline, where giant boulders are leftovers from that last ice age. A glacier is a great earth-moving machine. It's a dump truck that carries rocks that fall on top of it. It's a bulldozer that pushes rocks in front of it, and it outlines itself with those rocks, making a deposit that we call a moraine that tells us where the glacier has been. We're 20 kilometers, 12 miles, from the front of the Franz Josef glacier today. But about 20,000 years ago, the ice was depositing these rocks as it flowed past us and out to sea. The rocks we can still see today confirm where the glacier once was. Now, in a computer-generated time lapse condensing thousands of years of Earth's history, we're seeing what happened. Lower CO2, colder temperatures, more snow and ice, and the Franz Josef advanced. 20,000 years ago, 30% of today's land area was covered by great ice sheets which locked up so much water that the global sea level was almost 400 feet lower than today. And then, as Earth's orbit changed, temperatures and CO2 rose, and the glacier melted back. The orbits set the stage. But by themselves, there weren't enough. We need the warming and cooling effects of rising and falling CO2 to explain the changes we know happened. Today, atmospheric CO2 is increasing still more, temperatures are rising, and glaciers and ice sheets are melting. You can see this clearly on the lake formed by the shrinking Tasman Glacier across the range from the Franz Josef. This is what the end of an ice age looks like-- glaciers falling apart, new lakes, new land, icebergs coming off the front of the ice. In the early 1980s, we would have been inside New Zealand's Tasman Glacier right here. Now we're passing icebergs in a new lake from a glacier that has mostly fallen apart and ends over six kilometers, four miles away. One glacier doesn't tell us what the world is doing. But while the Tasman has been retreating, the great majority of glaciers on the planet have gotten smaller. This is the Columbia Glacier in Alaska. It's a type of glacier that makes the effects of warming easy to see. It's been retreating so fast that the Extreme Ice Survey had to reposition their time-lapse cameras to follow its motion. In Iceland, warming air temperatures have made this glacier simply melt away, leaving streams and small lakes behind. Thermometers in the air show warming. Thermometers in the air far from cities show warming. Put your thermometer in the ground, in the ocean, look down from satellites-- they show warming. The evidence is clear. The Earth's climate is warming. This frozen library, the National Ice Core Lab in Denver, Colorado, has ice from all over, kept at minus 35 degrees. The oldest core here goes back some 400,000 years. Here, really ancient ice from Greenland in the north and Antarctica in the south reveals Earth's climate history. Let's see what cores like this can tell us. First are those layers I mentioned in the New Zealand snow. They've turned to ice, and we can count them-- summer, winter, summer, winter. Like tree rings, we can date the core. Other cores tell other stories. Look at this. It's the ash of an Icelandic volcano that blew up to Greenland 50,000 years ago. Cores hold other, and even more important, secrets. Look at these bubbles. They formed as the snow turned to ice and trapped old air that's still in there. Scientists now are working with cores from Antarctica that go back even further. They tell us, with a very high degree of accuracy, how much carbon dioxide was in the air that far back. Researchers break chunks of ice in vacuum chambers and carefully analyze the gases that come off. They're able to measure, very precisely, levels of carbon dioxide in that ancient air. Looking at the cores, we see a pattern that repeats-- 280 parts per million of CO2, then 180, 280, 180, 280. By analyzing the chemistry of the oxygen atoms in the ice, you can also see the pattern of rising and falling temperature over time-- colder during the ice ages, warmer during the interglacial periods. Now put the two lines together, and you can see how closely temperature and carbon dioxide track each other. They're not exactly alike. At times, the orbits caused a little temperature change before the feedback effects of CO2 joined in. But just as we saw in New Zealand, we can't explain the large size of the changes in temperature without the effects of CO2. This is the signature of natural variation, the cycle of the ice ages driven by changes in Earth's orbit with no human involvement. But here's where we are today. In just 250 years since the Industrial Revolution, we've blown past 380 with no sign of slowing down. It's a level not seen in more than 400,000 years, 40 times longer than the oldest human civilization. So physics and chemistry tell us that adding carbon dioxide to the atmosphere warms things up, and Earth's climate history shows us there will be impacts, from melting ice sheets to rising sea level. But how do we know, with equal certainty, that it's not just more natural variation, that humans are the source of the increasing CO2? When we look at a landscape like this one, we know immediately that volcanoes put out all sorts of interesting things, and that includes CO2. So how do we know that the rise of CO2 in the atmosphere that we see comes from our burning of fossil fuels and not from something that the volcanoes have done? Well, the first step in the problem is just bookkeeping. We measure how much CO2 comes out of the volcanoes. We measure how much CO2 comes out of our smokestacks and tailpipes. The natural source is small. Humans are putting out 50 to 100 times more CO2 than the natural volcanic source. We can then ask the air whether our bookkeeping is right, and the air says that it is. Volcanoes make CO2 by melting rocks to release the CO2. They don't burn, and they don't use oxygen. But burning fossil fuels does use oxygen when it makes CO2. We see that the rise in CO2 goes with the fall of oxygen, which says that the rising CO2 comes from burning something. We can then ask the carbon in the rising CO2 where it came from. Carbon comes in three flavors-- the lightweight, carbon-12, which is especially common in plants, the medium weight, carbon-13, which is a little more common in the gases coming out of volcanoes, and the heavyweight, carbon-14. It's radioactive and decays almost entirely after about 50,000 years, which is why you won't find it in very old things, like dinosaur bones or fossil fuels. We see a rise in carbon-12 which comes from plants. We don't see a rise of carbon-13, so the CO2 isn't coming from the volcanoes. And we don't see a rise in carbon-14, so the CO2 can't be coming from recently living plants. And so the atmosphere says that the rising CO2 comes from burning of plants that have been dead a long time. That is fossil fuels. The CO2 is coming from our fossil fuels. It's us. So physics and chemistry show us carbon dioxide is at levels never seen in human history. And the evidence says it's all of us burning fossil fuels that's driving the increase. But what about climate change and global warming? Are they for real? Here's what those who have looked at all the data say about the future.
MAN: Climate change, energy security, and economic stability are inextricably linked. Climate change will contribute to food and water scarcity, will increase the spread of disease, and may spur or exacerbate mass migration.
RICHARD ALLEY: Who do you suppose said that? Not a pundit, not a politician. The Pentagon. These war games at Fort Irwin, California provide realistic training to keep our soldiers safe. The purpose of the Pentagon's Quadrennial Defense Review, the QDR, is to keep the nation safe. The review covers military strategies for an uncertain world. The Pentagon has to think long-term and be ready for all contingencies. The 2010 QDR was the first time that those contingencies included climate change. Rear Admiral David Titley is oceanographer of the Navy and contributed to the Defense Review.
DAVID TITLEY: Well, I think the QDR really talks about climate change in terms that really isn't for debate. And you take a look at the global temperatures. You take a look at sea level rise. You take a look at what the glaciers are doing-- not just one or two glaciers, but really glaciers worldwide. And you add all of those up together, and that's one of the reasons we really believe that the climate is changing. So the observations tell us that. Physics tells us this as well.
RICHARD ALLEY: What climate change means for key global hotspots is less clear.
DAVID TITLEY: We understand the Earth is getting warmer. We understand the oceans are getting warmer. What we do not understand is exactly how that will affect things like strong storms, rainfall rates, rainfall distribution. So yes, climate change is a certainty, but what is it going to be like in specific regions of the world, and when?
RICHARD ALLEY: One area of particular concern to the Navy is sea level rise.
DAVID TITLEY: Sea level rise is going to be a long-term and very, very significant issue for the 21st century.
RICHARD ALLEY: The QDR included an infrastructure vulnerability assessment that found that 153 Naval installations are at significant risk from climatic stresses. From Pearl Harbor, Hawaii to Norfolk, Virginia, the bases and their nearby communities will have to adapt.
DAVID TITLEY: Even with one to two meters of sea level rise, which is very, very substantial, we have time. This is not a crisis, but it is certainly going to be a strategic challenge.
RICHARD ALLEY: Globally, climate change is expected to mean more fires, floods, and famine. Nations may be destabilized. For the Pentagon, climate change is a threat multiplier. But with sound climate science, Titley believes forewarned is forearmed.
DAVID TITLEY: The good thing is the science is advanced enough in oceanography, glaciology, meteorology that we have some skill at some frames of predicting this. And if we choose to use those projections, we can, in fact, by our behavior, alter the future in our favor. RICHARD ALLEY: Titley and the Pentagon think the facts are in.
DAVID TITLEY: Climate change is happening, and there is very, very strong evidence that a large part of this is, in fact, man-made.
RICHARD ALLEY: The military is America's single largest user of energy, and it recognizes that its use of fossil fuels has to change. The Pentagon uses 300,000 barrels of oil each day. That's more than 12 million gallons. An armored Humvee gets four miles to the gallon. At full speed, an Abrams battle tank uses four gallons to the mile. And it can cost as much as $400 a gallon to get gas to some remote bases in Afghanistan. Fort Irwin is a test bed to see if the Army can operate just as effectively while using less fossil fuel and more renewables. And it's not just Fort Irwin in the Army. At Camp Pendleton, Marines were trained on an energy-saving experimental forward operating base that deployed with them to Afghanistan.
ROBERT HEDELUND: Before any equipment goes into theater, we want Marines to get trained on it. So what are some of the things that we can take hold of right away and make sure that we can make a difference for the warfighter down range? RICHARD ALLEY: They test out different kinds of portable solar power units. They also practice how to purify stagnant water and make it drinkable. The Army and Marines both want to minimize the number of convoys trucking in fuel and water. A report for the Army found that in five years, more than 3,000 service members had been killed or wounded in supply convoys.
ROBERT HEDELUND: And if you've got Marines guarding that convoy, and God forbid, it get hit by an IED, then what are the wounded, what are the deaths involved in that? And are we really utilizing those Marines and that capability the way we should?
RICHARD ALLEY: Generators used to keep accommodations livable and computers running are also major gas guzzlers.
ADORJAN FERENCZY: Right now, what we're doing is putting up a power shade. It has flexible solar panels on the top and gives us enough power to run small electronics, such as lighting systems and laptop computers. It also provides shade over the tent structure. Experimenting with this equipment in Africa proved that it could reduce the internal temperature of the tent seven to 10 degrees.
RICHARD ALLEY: All the LED lights in the entire tent use just 91 watts, less than one single old-fashioned incandescent bulb.
ADORJAN FERENCZY: It's a no-brainer when it comes to efficiency.
RICHARD ALLEY: Light-emitting diodes don't weigh much, but they're still rugged enough to survive a typical Marine's gentle touch.
ZACH LYMAN: When we put something into a military application and they beat it up, it's ruggedized. It's ready for the worst that the world can take. And so one thing that people say is if the military has used this thing and they trust it, then maybe it's OK for my backyard.
RICHARD ALLEY: Renewable energy will also play an important role at sea and in the air. The Navy's Makin Island is an amphibious assault ship with jump jets, helicopters, and landing craft. It's the first vessel to have both gas turbines and a hybrid electric drive, which it can use for 75% of its time at sea. This Prius of the ocean cut fuel costs by $2 million on its maiden voyage. By 2016, the Navy plans to have what it calls a Great Green Fleet, a complete carrier group running on renewable fuels with nuclear ships, hybrid electric surface vessels, and aircraft flying only biofuels. By 2020, the goal is to cut usage of fossil fuels by 50%. Once deployed in Afghanistan, the XFOB cut down on gas used in generators by over 80%. In the past, the Pentagon's innovations in computers, GPS, and radar have spun off into civilian life. In the future, the military's use of renewable energy can reduce dependence on foreign oil, increase operational security, and save lives and money.
JIM CHEVALLIER: A lot of the times, it is a culture change more than anything else. And the Department of Defense, over the years, has proved, time and time again, that they can lead the way in that culture change.
RICHARD ALLEY: If the US military is the largest user of energy in America, China is now the largest consumer on the planet. At 1.3 billion, China has a population about four times larger than the US, so average per-person use in CO2 emissions remain about 1/4 those of Americans. But like the US Military, China is moving ahead at full speed on multiple different sustainable energy options. And it pretty much has to. Cities are congested. The air is polluted. Continued rapid growth using old technologies seems unsustainable. This meeting in Beijing brought together mayors from all over China, executives from state-owned enterprises, and international representatives. The organizer was a US-Chinese NGO headed by Peggy Liu.
PEGGY LIU: Over 20 years, we're going to have 350 million people moving into cities in China. And we're going to be building 50,000 new skyscrapers, the equivalent of 10 Manhattans, 170 new mass transit systems. It's just incredible, incredible scale.
RICHARD ALLEY: This massive, rapid growth comes with a high environmental cost.
MARTIN SCHOENBAUER: They recognize that they're spending as much as 6% of their gross domestic product on environmental issues.
RICHARD ALLEY: In 2009, China committed $35 billion, almost twice as much as the US, TO energy research and incentives for wind, solar, and other clean energy technologies. It's attracted an American company to set up the world's most advanced solar power research plant. China now makes more solar panels than any other nation. But it's also promoting low-tech, low-cost solutions. Solar water heaters are seen on modest village homes. Some cities have them on almost every roof.
PEGGY LIU: China is throwing spaghetti on the wall right now in terms of over 27 different cities doing LED street lighting, or over 20, 30 different cities doing electric vehicles.
RICHARD ALLEY: But visit any city, and you can see that the coal used to generate more than 70% of China's electricity has serious consequences with visible pollution and adverse health effects. China uses more coal than any other nation on Earth, but it's also trying to find ways to burn coal more cleanly.
PEGGY LIU: In three years, 2006 to 2009, while China was building one new coal-fired power plant a week, it also shut down inefficient coal plants. So it's out with the old and in with the new. And they're really trying hard to invent new models.
RICHARD ALLEY: This pilot plant, designed for carbon capture and sequestration, was rushed to completion in time for Shanghai's 2010 World Expo. It absorbs and sells carbon dioxide and will soon scale up to capture 3 million tons a year that could be pumped back into the ground, keeping it out of the air.
MARTIN SCHOENBAUER: Here in China, they are bringing many plants online in a much shorter time span it takes us in the US. PEGGY LIU: China is right now the factory of the world. What we'd like to do is turn it into the clean tech laboratory of the world. RICHARD ALLEY: If nations choose to pay the price, burning coal with carbon capture can offer the world a temporary bridge until renewables come to scale. PEGGY LIU: China is going to come up with the clean energy solutions that are cost-effective and can be deployed at large scale-- in other words, solutions that everybody around the world wants.
RICHARD ALLEY: Can low-carbon solutions really give us enough energy to power the planet and a growing population? Let's put some numbers on how much energy we can get from non-fossil fuel renewables. Today, all humans everywhere on Earth use about 15.7 terawatts of energy. That's a big number. In watts, that's 157 followed by 11 0's, or 157 billion of those 100-watt light bulbs we used as a reference. To show what's possible, let's see if we can get to 15.7 terawatts using only renewable energy. I'm here in the Algodones Dunes near Yuma, Arizona. The Guinness Book of Records says it's the sunniest place in the world. There's barely a cloud in the daytime sky for roughly 90% of the year. 0.01%, 1/100 of 1%-- if we could collect that much of the sun's energy reaching the Earth, it would be more than all human use today. Today's technologies have made a start. This was the world's first commercial power station to use a tower to harvest concentrated solar energy. Near Seville, Spain, 624 mirrors stretch over an area of more than 135 acres, beaming back sunlight to a tower nearly 400 feet high. Intense heat produces steam that drives the turbine, which generates electricity. When completed, this one facility will be able to power 200,000 homes, enough to supply the entire nearby city of Seville. Remember our target of 15.7 terawatts? Well, the sun delivers 173,000 terawatts to the top of Earth's atmosphere, 11,000 times current human use. No way we can capture all of that potential energy at Earth's surface. But the deserts of America's Southwest, with today's technology, have enough suitable land to supply 80% of the entire planet's current use. Of course, there's one big problem with solar power-- night. But with more efficient transmission lines, and as part of a balanced renewable energy portfolio that includes storage, the sun's potential is vast. In tropical nations like Brazil, the sun heats water, makes clouds, and unleashes rainfall that feeds some of the planet's largest rivers. Iguazu Falls is a tourist attraction, one of the most spectacular waterfalls on Earth, where you can feel the immense power of falling water. The nearby Itaipu Dam on the border of Brazil in Paraguay produces the most hydroelectric power of any generating station in the world. This one dam supplies most of the electricity used in Sao Paulo, a city of more than 11 million. Sao Paulo is 600 miles away, but Brazil made the decision to build innovative, high-voltage direct current transmission lines to minimize energy loss. The Itaipu to Sao Paulo electrical grid has been in operation since 1984 and shows that renewable energy can go the distance. Dams can't be the answer for every nation. They flood landscapes, disrupt ecosystems, and displace people. But hydropower gives Brazil, a nation larger than the continental United States, 80% of its electricity. And worldwide, hydropower could contribute 12% of human energy use, ready at a moment's notice in case the sun goes behind a cloud. Brazil is also using its unique natural environment in another way. Its tropical climate provides ideal conditions for sugarcane, one of the Earth's most efficient plants in its ability to collect the energy of sunlight. Plantations like this one harvest the cane for the production of sugar and the biofuel called ethanol. The US is actually the number one producer of ethanol in the world, mostly using corn instead of cane. But ethanol made from sugar cane is several times more efficient at replacing fossil fuel than corn-based ethanol. Modern facilities like this one pipe back wet waste to fertilize the fields and burn the dry waste, called the gas, to generate electricity to run the factory. For Brazil, at least, ethanol works. Today, almost all cars sold in Brazil can use flex fuels. Drivers choose gasoline blended with 25% ethanol or pure ethanol, depending on price and how far they plan to drive. Local researchers say that if all the gasoline in the world suddenly disappeared, Brazil is the only nation that could go it alone and keep its cars running. Using food for fuel raises big questions in a hungry world. As of now, sugarcane ethanol hasn't affected food prices much. But there are concerns with corn. So here in the US, government labs like NREL, the National Renewable Energy Lab, have launched programs to see if biofuels can be made from agricultural waste. It does work, and researchers are trying to bring the cost down. So with plants capturing roughly 11 times human energy use, they're a growing opportunity. New Zealand takes advantage of another kind of energy. These are the geysers and hot springs at Rotorua on the North Island. Once, they were used by the native Maori people for cooking and bathing. Now geothermal power plants harvest heat and turn it into as much as 10% of all New Zealand's electricity. Many power projects are partnerships with the Maori, benefiting the local people and avoiding the "not in my backyard" problems that often complicate energy developments. Globally, geothermal energy offers three times our current use. But we can mine geothermal, extracting the energy faster than nature supplies it, cooling the rocks deep beneath us to make power for people. This energy exists even where you don't see geysers and mud pots, so it can be extracted without harming these natural wonders. A study by MIT showed that the accessible hot rocks beneath the United States contain enough energy to run the country for 130,000 years. And like hydroelectric, geothermal can provide peaking power, ready to go at a moment's notice if the sun doesn't shine and the wind doesn't blow. Mining energy from deep, hot rocks is a relatively new technology, but people have been using windmills for centuries, and the wind blows everywhere. Here's where the United States is very lucky. Let's take a trip up the nation's wind corridor, from Texas in the South to the Canadian border. Bright purple indicates the strongest winds. All along this nearly 2,000 miles, there's the potential to turn a free, non-CO2-emitting resource into electricity. But that takes choices and actions by individuals and governments. Here's what's been happening in West Texas. It's a land of ranches and farms and, of course, oil rigs and pump jacks. But in the early '90s, this was one of the most financially depressed areas in the state. Communities like Nolan Divide fell on hard times. Schools closed. People moved away. But since 1999, the new structures towering above the flat fields aren't oil derricks, but wind turbines. The largest number-- more than 1,600-- is in Nolan County. Greg Wortham is Mayor of Sweetwater, the county seat.
GREG WORTHAM: It wasn't a philosophical or political decision. It was ranchers and farmers and truck drivers and welders and railroads. and wind workers.
RICHARD ALLEY: Steve Oatman's family has been ranching the Double Heart for three generations. Steve may have doubts about the causes of climate change, but not about wind energy.
STEVE OATMAN: But it's been a blessing. It helps pay taxes. It helps pay the feed bill. Rosco, 30 May.
GREG WORTHAM: We talk about this being green energy because it pays money. The ranchers and the farmers call it mailbox money. They have to get up, and sweat, and work hard all day long. Things are pretty stressful. And if you can just walk to the mailbox and pick up some money because you've got turbines above the ground, that makes life a lot easier. RICHARD ALLEY: Each windmill can generate between $5,000 and $15,000 per year. So a ranch with an average of 10 to 20 turbines can provide financial stability for people who have always lived with uncertainty.
STEVE OATMAN: I don't just believe in it because I make a living from it. It's something that's going to have to happen for the country.
RICHARD ALLEY: So now, local schools have growing enrollments and funds to pay for programs.
GREG WORTHAM: We had about $500 million in tax based in the whole county in 2000. And by the late part of that decade, in less than 10 years, it went up to $2.5 billion in tax value.
RICHARD ALLEY: By the end of 2009, the capacity of wind turbines in West Texas totaled close to 10,000 megawatts. If Texas were a country, it would rank sixth in the world in wind power. The US Department of Energy estimates that wind could supply 20% of America's electricity by 2030. New offshore wind farms would generate more than 43,000 new jobs. That translates into a $200-billion boost to the US economy. Worldwide, wind could provide almost 80 times current human usage. No form of energy is totally free of environmental concerns or hefty startup costs. Some early wind farms gave little consideration to birds and other flying critters, like migrating bats. But recent reports by Greenpeace and the Audubon Society have found that properly sighted and operated turbines can minimize problems. Mayor Wortham, for one, welcomes wind turbines into his backyard.
GREG WORTHAM: We like them. Some people don't. But we're more than happy to export our energy to those states who want to buy green, but don't want to see green.
STEVE OATMAN: In the long run, I hope we have wind turbines everywhere they can produce energy. We need them. That's what America is going to have to do. That's the next stepping stone to save ourselves.
RICHARD ALLEY: The state of Texas has invested $5 billion to connect West Texas wind to big cities like Dallas and Fort Worth. Farther south is Houston, one of the most energy-hungry cities in the country. Its port is America's largest by foreign tonnage, and its refineries and chemical plants supply a good portion of the nation. But already, perhaps surprisingly, Houston is the largest municipal purchaser of renewable energy in the nation. 30% of the power city government uses comes from wind, with a target of 50%. And its mayor wants to cut energy costs and increase energy efficiency.
ANNISE PARKER: I want to go from the oil and gas capital of the world to the green and renewable energy capital of the world.
RICHARD ALLEY: Supported by federal stimulus dollars, the local utility is ahead of schedule to install smart meters. These will help consumers economize on energy use. The city has already installed 2,500 LED traffic lights using 85% less energy than traditional incandescent bulbs. That translates into savings of $3.6 million per year. City Hall thinks it can also improve air quality by changing the kinds of cars Houstonians drive.
ANNISE PARKER: If
RICHARD ALLEY: The city already operates a fleet of plug-in hybrids. Now it's encouraging the development of an infrastructure to make driving electric vehicles easy and practical. And in Houston's hot and humid environment, it helps to have an increasing number of energy-efficient, LEED-certified buildings. ANNISE PARKER: We're going to do it because it's the smart thing, because it makes business sense, and it's the right thing.
RICHARD ALLEY: Some estimates are that the US could save as much as 23% of projected demand from a more efficient use of energy.
ANNISE PARKER: Well, if you're going to tackle energy efficiency, you might as well do it in a place that is a profligate user of energy. And when you make a difference there, you can make a difference that's significant.
RICHARD ALLEY: Globally, efficiency could cut the demand for energy by 1/3 by 2030. Bottom line-- there are many ways forward, and we can hit that renewable energy target. And if next-generation nuclear is also included, one plan has the possible 2030 energy mix transformed from one relying on fossil fuels to one that looks like this, with renewables-- sun, wind, geothermal, biomass, and hydropower-- totaling 61%, fossil fuels down to 13%, and existing and new nuclear making up the balance. Another plan meets world energy needs with only wind, water, and solar. And in fact, there are many feasible paths to a sustainable energy future. Today's technologies can get us started, and a commitment to research and innovation will bring even more possibilities. We've traveled the world to see some of the sources the planet offers to meet our growing need for clean energy. There's too many options to cover all of them here. And besides, each nation, each state, each person must make their own choices as to what works best for them. But the central idea is clear. If we approach Earth as if we have an operator's manual that tells us how to keep the planet humming along at peak performance, we can do this. We can avoid climate catastrophes, improve energy security, and make millions of good jobs. For "Earth-- The Operator's Manual," I'm Richard Alley.
NARRATOR: "Earth-- The Operator's Manual" is made possible by NSF, the National Science Foundation, where discoveries begin.
[MUSIC PLAYING] For the annotated, illustrated script with links to information on climate change and sustainable energy, web-exclusive videos, educator resources, and much more, visit pbs.org. "Earth-- The Operator's Manual" is available on DVD. The companion book is also available. To order, visit shoppbs.org, or call us at 1-800-PLAY-PBS.
Optional Follow-up Questions to the Videos
If instructed by your instructor, download the following questions that can be applied to either video:
Understanding the Science of Climate Change
Understanding the Science of Climate Change
At this point, you should have either watched one or two of the videos from the introduction, or you're already familiar with how human activities have resulted in the warming of the planet in the last century. Now, we'll explore some of the latest data from the National Aeronautics and Space Administration (NASA), the National Oceanic and Atmospheric Administration (NOAA), and the Intergovernmental Panel on Climate Change (IPCC) to review and to help us better understand the connections between increases in atmospheric carbon dioxide and climate change.
Data on current atmospheric concentrations of carbon dioxide are collected and compiled by NOAA and can be found at NOAA Earth System Research Laboratory [237]. The longest record of carbon dioxide concentration in the atmosphere is from Mauna Loa in Hawaii and was initiated in the 1950s. The resulting curve is often referred to as the “Keeling Curve” (Figure 9.1.1) after the atmospheric scientist who first began collecting CO2 data.
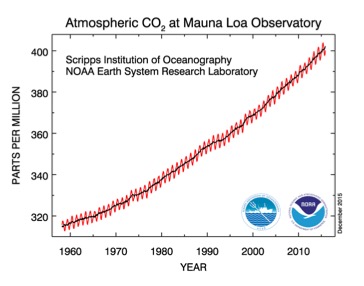
Carbon dioxide is not the only greenhouse gas. Human activities have also increased concentrations of methane and nitrous oxide. The IPCC has compiled data from many sources to summarize the changes in greenhouse gas concentrations for the last 2000 years (Figure 9.1.2), and concentrations of carbon dioxide, methane, and nitrous oxides have all risen dramatically with industrialization. The increases in carbon dioxide concentrations have the greatest impact on global climate, but the increases in the other greenhouse gases play a supporting role.
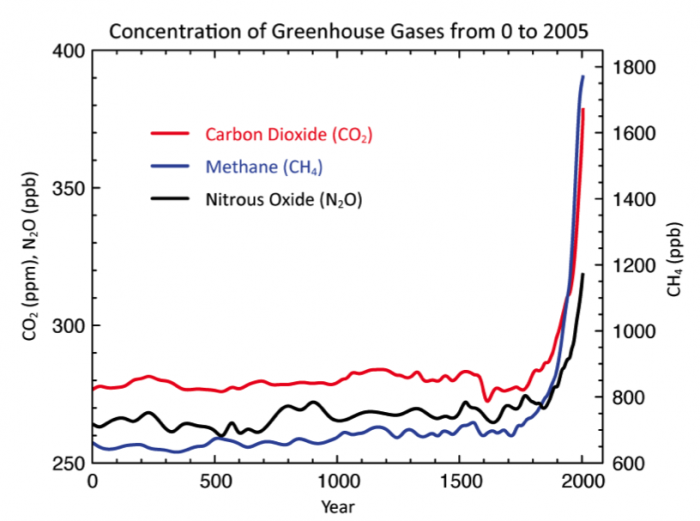
To understand Earth's past climate, scientists use data extracted from air bubbles trapped in ice cores from Greenland and Antarctica to study past carbon dioxide concentrations and temperatures. The longest ice core record is from Vostok, Antarctica and gives us a picture of changes in CO2 concentrations and temperatures for the last 800,000 years (Figure 9.1.3). In November 2015, CO2 concentrations in the atmosphere reached 400.16 ppm, a level not seen in the past 800,000 years on Earth. Also, there is a clear correlation between temperature changes and changes in atmospheric CO2 concentrations.
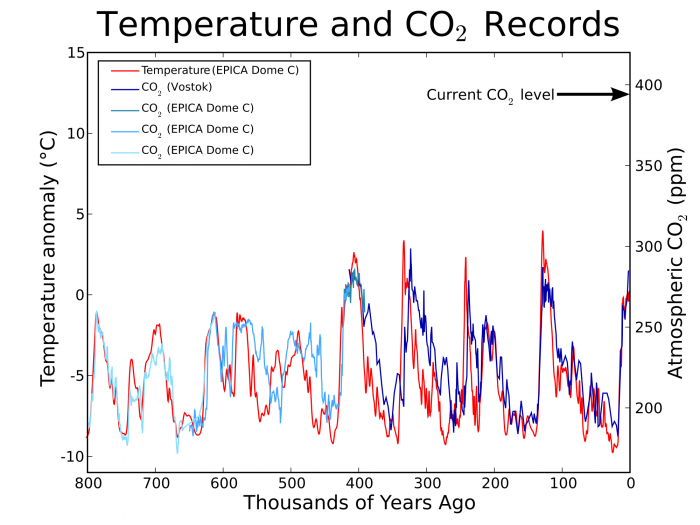
NASA has compiled surface air and ocean temperature data from around the globe and summarized temperature changes into an index (Global Climate Change: Vital Signs of the Planet [240]) that compares annual average temperature with the average temperatures from 1951-1980 (Figure 9.1.4). Global temperatures have been rising for the last 100 years. We'll explore more temperature data and consider the impact of rising temperatures as we continue in this module.
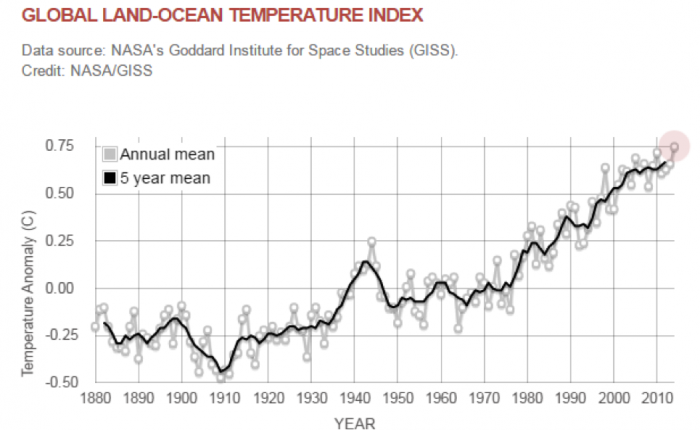
Activate your learning
Question 1 - Short Answer
How does the current concentration of carbon dioxide in the atmosphere compare with atmospheric carbon dioxide concentrations measured in the Vostok ice core (Figure 9.1.3)?
Click for answer.
Current carbon dioxide concentrations (400 ppm in November 2015) are higher than at any time in at least the past 800,000 years.
Question 2 - Short Answer
In the Keeling Curve (Figure 9.1.1), there is a clear upward trend in carbon dioxide concentrations, and there is also a smaller oscillating pattern in the data. Each year, CO2 concentration increase and decrease. What could be causing the annual cycle in carbon dioxide concentrations?
Click for answer.
The annual cycle is a result of the large deciduous forests in the northern hemisphere. Trees take up more CO2 in the summer time when they have green leaves that are taking up CO2 to create new plant material via photosynthesis. In the fall, this process stops. In the winter, when deciduous trees lose their leaves, CO2 levels in the atmosphere increase as photosynthetic rates decline and as CO2 is released as plant material decays. The upward trend, since recording started in the late 1950s, is a result of the burning of fossil fuels and other anthropogenic greenhouse gas emissions.
Question 3 - Short Answer
What is the source of the increasing CO2 concentrations in the atmosphere that is evident in the Keeling Curve (Figure 9.1.1), and that has occurred since about 1850 (Figure 9.1.2)?
Click for answer.
The increase of CO2 concentrations in the atmosphere since 1850 is primarily from the burning of fossil fuels (petroleum, coal and natural gas). Other human activities also contribute, such as deforestation.
Question 4 - Short Answer
Global average temperatures have been increasing since about 1920. Explain the relationship between global temperature increase and increasing levels of CO2 in the atmosphere.
Click for answer.
As carbon dioxide concentrations in the atmosphere increase, more heat energy is trapped in the Earth's lower atmosphere, which results in an increase in temperature. As temperature increases, evaporation rates also increase. Water vapor is a very powerful greenhouse gas, so there is a positive feedback that causes an additional increase in temperature.
Climate is Already Changing
Climate is Already Changing
The impacts of increasing greenhouse gas concentrations are already being felt around the globe, though the degree of change varies with location. The Third National Climate Assessment (NCS), released in 2014 by the US Global Change Research Program (USGCRP), reports that over the last century increasing average temperatures, increasing weather variability, increasing warmer nights and winters, lengthening of the growing season, and an increase in the frequency and intensity of extreme weather events have already been observed. The severity of these impacts varies throughout the US and the world because of regional topography, proximity to the ocean, atmospheric circulation patterns, and many other factors.
Changing Temperature Patterns
The average temperature in the United States has increased in the last century, with each recent decade being warmer than the past, but this warming is not uniform across the United States (Figure 9.1.5). In general, western and northern regions have warmed more than the southeastern US. In the most recent decade, all regions have shown warming. What impact might this warming trend have on our food production and water supply? For example, we know from our study of water for food production that plants evaporate or transpire water and that the rate of evaporation is dependent on temperature. If temperatures go up, we know that plants will transpire more water. The southwestern US is already a water-scarce area, so increasing temperatures will exacerbate that condition.
We'll explore more connections between climate change and food production in the next section of this module. First, let's investigate changes in some other climate variables.
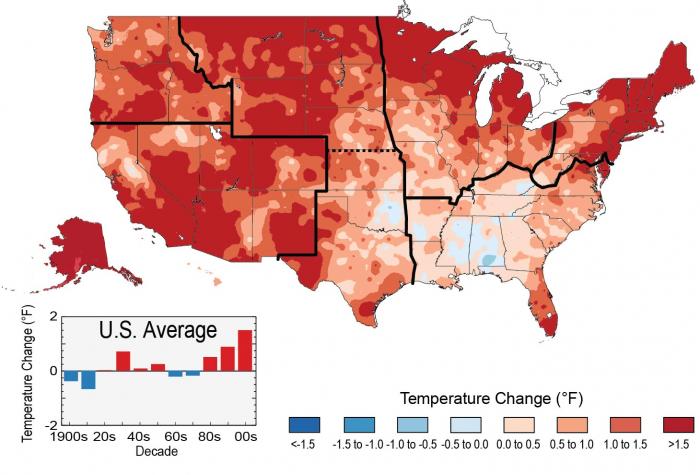
Changing Precipitation Patterns
In addition to changing temperatures, the recent decades have seen changes in precipitation patterns. Nationwide average precipitation has increased (Figure 9.1.6), but the patterns of change are not as clear as those for temperature. Notice in Figure 9.1.6 that the water-scarce Southwest experienced a decline in precipitation in recent decades. Additionally, some of the precipitation increase in the eastern US came in form of extremely heavy precipitation (Figure 9.1.7) and resulted in flooding (Figure 9.1.8). Both of these effects are anticipated results of increased concentrations of heat-trapping greenhouse gases in the lower atmosphere.
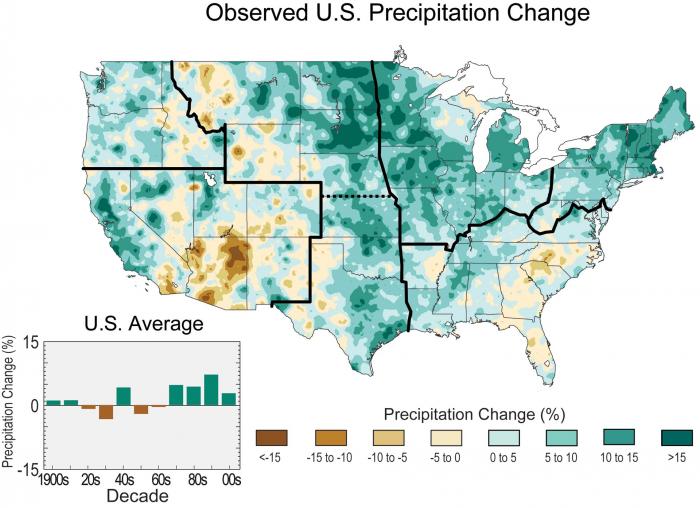
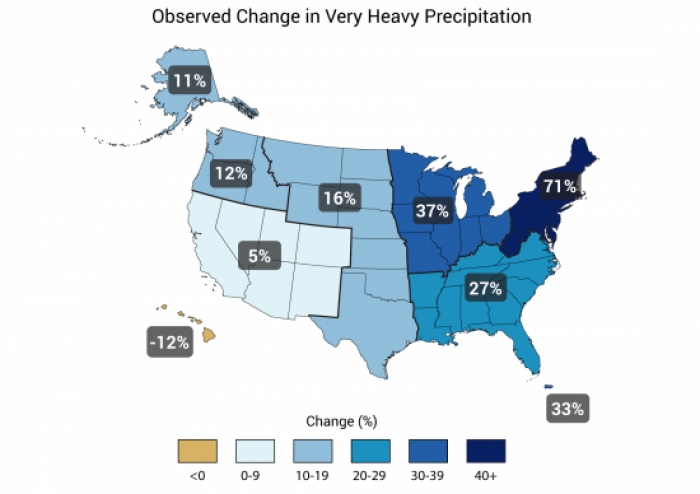
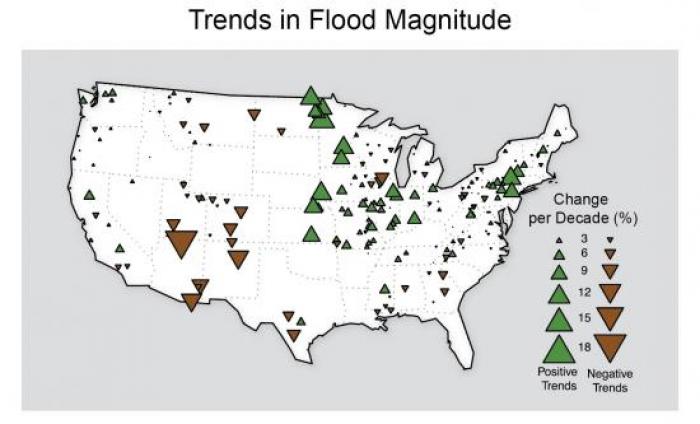
Projected Climate Changes
Projected Climate Changes
So far in module 9, we've studied the basics of the science of climate change and by now you should have a pretty good understanding of the relationship between greenhouse gases and temperature. We've seen how human activities, including our food systems, are contributing carbon dioxide and other greenhouse gases to the atmosphere. And, as greenhouse gas concentrations increase, more heat energy is trapped, so temperatures at the Earth's surface increase.
We've also seen that temperatures are already increasing around the globe and that precipitation patterns are changing, but what does the future hold? How much will temperatures increase? Will precipitation increase or decrease? Those are very good questions! And, the answers aren't perfectly clear. Atmospheric and climate scientists all over the world are working hard to estimate how Earth's climate will change as greenhouse gas concentrations increase. Future predictions are made by running computer models that simulate natural processes and human activities and estimate future conditions. Model results vary from model to model, but they all predict future warming. Also, as we've already seen, the amount of warming varies from place to place.
What are the predictions for future climate?
The models used to predict future climate are very complicated and incorporate a vast number of variables, natural processes, and human activities. Projecting into the future is always a tricky endeavor and is always fraught with uncertainty. However, all of the models predict continued warming in the future. The magnitude of the warming varies from model to model and depending on which carbon emission scenario is used. For example, warming might slow in the future if we manage to curb our burning of fossil fuels, which would result in lower carbon dioxide emissions.
The model results are presented on two websites (National Climate Change View and Global Climate Change Viewer) that allow us to view the future projections for the US and for the globe on easy-to-read maps. In the summative assessment for this module, you'll explore these websites in greater depth to extract data for your capstone assignment. Right now, we'll just look at a few of the maps to get an idea of how the climate is projected to change in the latter part of this century. Exploring these maps develops our spatial thinking skills, which in turn enhances our math skills! And, who doesn't want to be better at math?
Future climate projections are presented as the projected change compared to the latter part of the last century (1950-2005). So for example, if the projected temperature change for 2050-2074 is 4oF, then that means the 2050-2074 average temperature is projected to be 4oF higher than the average temperature from 1950-2005. All of the following maps present projected change in this manner.
First, let's look at temperature. The National Climate Change Viewer (NCCV) (Figures 9.1.9 and 9.1.10) and Global Climate Change Viewer (GCCV) (Figure 9.1.11) both provide maps of projected temperature changes. Notice that the global map gives temperature change in degrees Celsius, and the US map is in Fahrenheit. One notable aspect of all three maps is that temperature is expected to increase everywhere. As you look at these maps, notice where the temperature change is expected to be the greatest. Can you make any generalizations? What is the expected temperature change in the region where you live right now? For example, if we were in New York City, the map in Figure 9.1.9 suggests that the average maximum temperature by 2050-2074 could be 4oF higher than it was in 1950-2005.
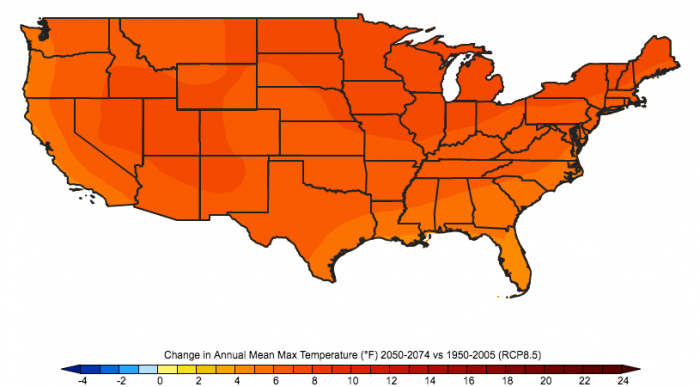
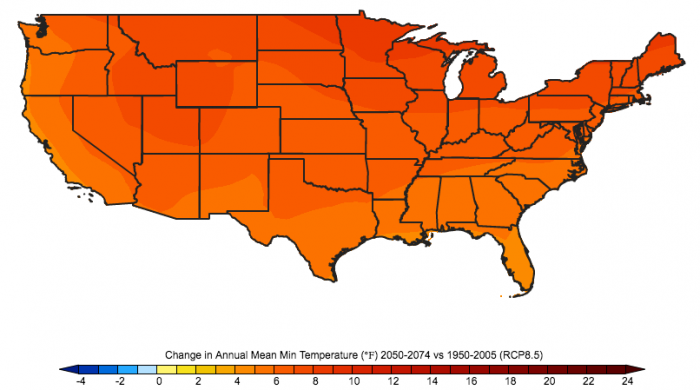
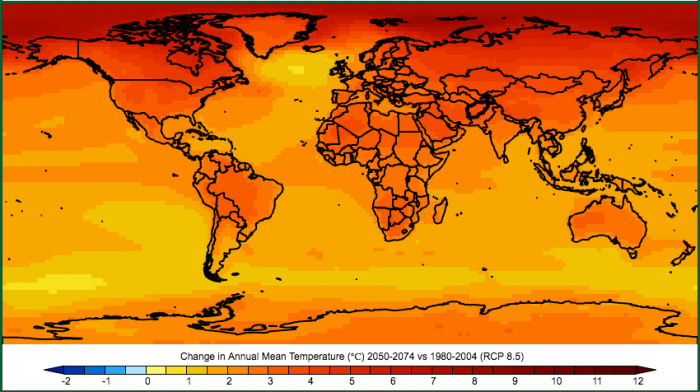
The projected changes in precipitation aren't quite as straightforward or certain as the projected temperature changes. Some regions are expected to receive more precipitation and some regions less. You can see in Figure 9.1.12 the southwestern US, a region that is already water-scarce, is expected to receive less annual precipitation on average. On the global map in Figure 9.1.13, equatorial regions are expected to receive a little more precipitation, and there's a band just north and south of the equator where precipitation is expected to decrease. The certainty in the precipitation predictions is lower than for temperature and the variability within a given year and from year to year in how the precipitation falls is expected to increase.
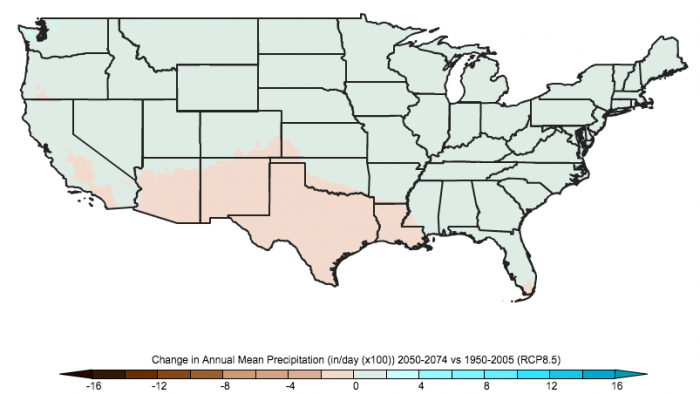
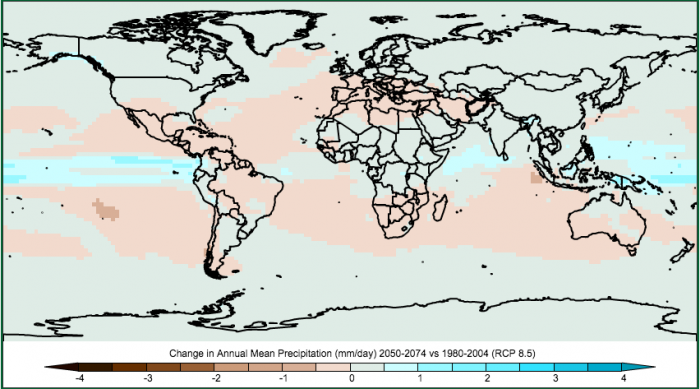
The NCCV also allows you to view projected changes in a few more variables that are not available on the GCCV. Students studying food regions outside of the US will need to work with their instructor to find similar data for their regions.
Precipitation falls on the land surface and flows into streams and rivers, which is called runoff. If precipitation is projected to decrease in the future, it would make sense that runoff would also decrease. Also, as temperatures increase and cause evaporation and transpiration to increase, there is less water available to run off into streams and rivers. The NCCV runoff map (Figure 9.1.14) suggests that runoff will also decrease in many areas of the US. The units for runoff are given in inches of water per month, similar to units for precipitation. In water-scarce regions where the precipitation is low, for example in deserts, often agriculture is irrigation with runoff from upstream regions where the precipitation is higher. Decreases in runoff could have adverse impacts on some regions that rely on runoff for irrigation.
As temperatures increase, there is an expected decrease in annual snowpack. While this is bad news for avid skiers, it's also bad news for regions that rely on water stored in snowpack in the winter that melts and is used for irrigation in the summer months. Figure 9.1.15 illustrates the projected change in annual mean snow in inches. Regions that don't normally get snow are indicated as zero (the deep south and southwest). The Rockies, Sierra Nevadas, Cascades as well as the mountains in the northeast are all expected to see significant decreases in annual snowpack.
The combination of increased temperatures with increased evaporation and transpiration rates will leave soils drier. Soil moisture content is projected to decrease across much of the US (Figure 9.1.16). Soil moisture is measured in units of depth of water (inches) and is the water available to plants. Some of our very important agricultural regions, the Midwest, are expected to see some of the largest declines in soil moisture storage.
The last data set, evaporative deficit, (Figure 9.1.17) gives us an idea of how much water could evaporate compared to how much water is actually available. An increase in evaporative deficit is a symptom of a transition to a hotter and drier climate. Not surprisingly the entire US is projected to see an increase in evaporative deficit, with the highest increases being in the Southwest and Midwest.
In summary, the future projected climate for the US is generally hotter and drier. Precipitation projections are more variable and less certain, but the increase in temperature and resulting increase in evaporation and transpiration will result in less runoff and drier soils in much of the US. The implications for agriculture are significant. We've already seen how water is essential for crop growth and changes in the temperature regime may have some surprising impacts on growing our food. In the next section, we'll explore projected climate changes and the potential impacts on agriculture in more detail. We'll also consider some possible adaptation strategies that can make our food systems more resilient to our changing climate.
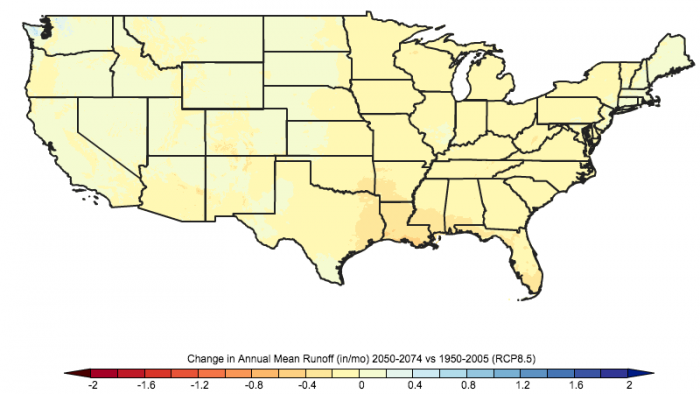
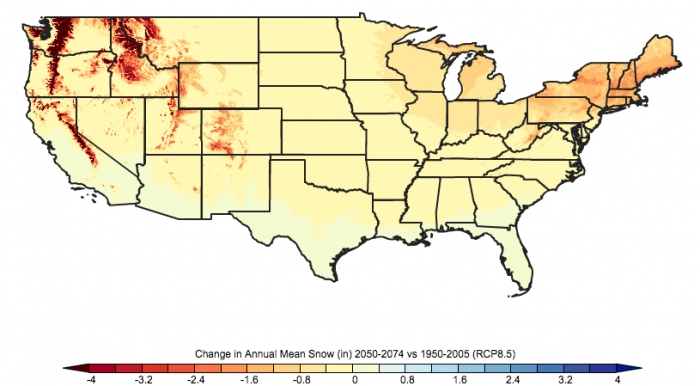
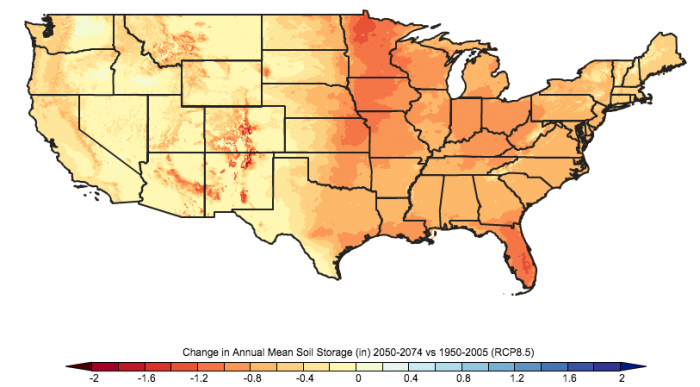
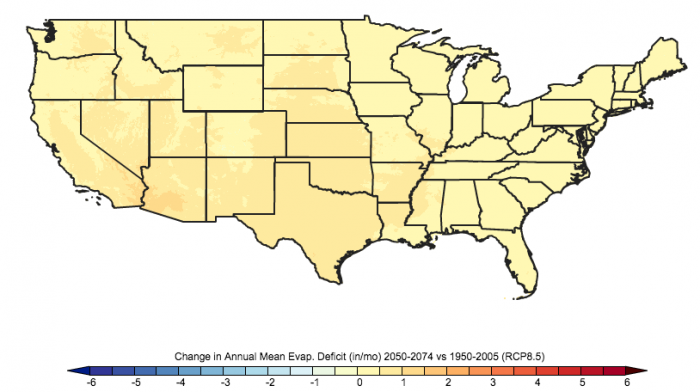
The Role of Our Food Systems in Climate Change
The Role of Our Food Systems in Climate Change
Food systems, including agriculture, play a significant role in contributing to global warming, perhaps contributing between 19% to 29% of global anthropogenic greenhouse gas emissions (Vermeulen et al. 2012). Growing food requires energy. While the sun is the source of energy for plant growth, a majority of the energy that fuels our modern food system comes from fossil fuels (petroleum and natural gas). Petroleum is used as a fuel for tractors and other vehicles that transport food. Natural gas is used in fertilizer production and other fossils fuels are burned to generate electricity that is used in the processing and refrigeration of food. The burning of fossil fuels is our largest source of greenhouse gases globally, and food production is a significant contributor to greenhouse gases.
The Food And Agriculture Organization of the United Nations (FAO) estimates that “the food sector (including input manufacturing, production, processing, transportation marketing and consumption) accounts for around 95 exa-Joules (1018 Joules), ...— approximately 30 percent of global energy consumption — and produces over 20 percent of global greenhouse gas emissions” (from Food and Agriculture Organization of the United Nations [244]).
In addition to carbon dioxide emissions from the fossil fuel consumption associated with agricultural activities discussed above, agriculture also contributes to greenhouse gas emissions in other ways (Figure 9.1.18). The loss of above-ground vegetation when grasslands and forests are converted to agriculture contributes about six percent of the global warming potential from greenhouse gas emissions. In addition, methane released from irrigated agriculture and from digestion and decomposition of manure from ruminants combined with nitrous oxide emissions from mismanagement of fertilizers contributes about 14 percent of the increase in total warming potential (Nelson 2014).
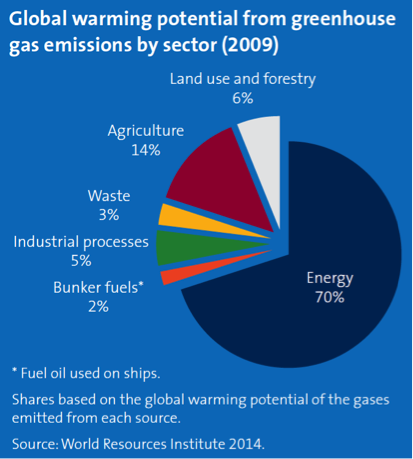
Module 9.2: Food Production in a Changing Climate
Module 9.2: Food Production in a Changing Climate
In Module 9.1, we explored the causes of global climate change, the ways that our food systems contribute to greenhouse gas emissions, and how climate variables are expected to change in different parts of the US. In this unit, we’ll consider the expected impacts of global climate change on food production.
Farmers have always had to struggle against the vagaries of the weather in their efforts to produce food for a growing population. Floods, droughts, heatwaves, hailstorms, late frosts, and windstorms have plagued farmers for centuries. However, with increased levels of CO2 in the atmosphere trapping more heat energy, farmers will face more extreme weather events, greater variability, and more extreme temperatures. Unpredictable and varied weather can lead to a domino effect through the entire food system, creating shortages and food price spikes. Farmers are developing strategies for resilience in the face of a changing climate, such as, more efficient irrigation, better soil health, and planting more resilient crop varieties.
Climate change can have both direct and indirect impacts on agricultural food production. Direct effects stem directly from changes in temperature, precipitation, and CO2 concentrations. For example, as temperatures increase in crop water demands and stresses on livestock increase. Changes in the maximum number of consecutive dry days can affect crop productivity. Increases in precipitation can increase soil erosion. Increased incidence of extreme weather events can also have direct impacts on agriculture, in the form of floods, droughts, hail and high winds.
Indirect effects of climate change include changes in weed, disease, and insect populations and distributions, which will have impacts on costs of managing pests and may increase crop losses. Increased incidence of wildfire can favor survival on invasive species. Some weeds respond well to increasing CO2 concentrations and may put greater pressure on crops.
In summary, a 2015 report on Climate Change, Global Food Security, and the U.S. Food System states that by 2050, global climate change may result in decreased crop yields, increased land area in crop production, higher food prices, and slightly reduced food production and consumption, compared to model results for 2015 with no climate change (Brown et al. 2015).
Global Effects of Climate Change
Human influences will continue to alter Earth’s climate throughout the 21st century. Current scientific understanding, supported by a large body of observational and modeling results, indicates that continued changes in the atmospheric composition will result in further increases in global average temperature, changes in precipitation patterns, rising sea level, changes in weather extremes, and continued declines in snow cover, land ice, and sea ice extent, among other effects that will affect U.S. and global agricultural systems.
While climate change effects vary among regions, among annual and perennial crops, and across livestock types, all production systems will be affected to some degree by climate change. Temperature increases coupled with more variable precipitation will reduce crop productivity and increase stress on livestock production systems. Extreme climate conditions, including dry spells, sustained droughts, and heatwaves will increasingly affect agricultural productivity and profitability. Climate change also exacerbates indirect biotic stresses on agricultural plants and animals. Changing pressures associated with weeds, diseases, and insect pests, together with potential changes in timing and coincidence of pollinator lifecycles, will affect growth and yields. When occurring in combination, climate change-driven effects may not simply be additive, but can also amplify the effects of other stresses on agroecosystems.
From Expert Stakeholder Workshop for the USDA Technical Report on Global Climate Change, Food Security, and the U.S. Food System [245]
Brown, M., P. Backlund, R. Hauser, J. Jadin, A. Murray, P. Robinson, and M. Walsh
June 25-27, 2013, Reston, VA,
Brown, M.E., J.M. Antle, P. Backlund, E.R. Carr, W.E. Easterling, M.K. Walsh, C. Ammann, W. Attavanich, C.B. Barrett, M.F. Bellemare, V. Dancheck, C. Funk, K. Grace, J.S.I. Ingram, H. Jiang, H. Maletta, T. Mata, A. Murray, M. Ngugi, D. Ojima, B. O’Neill, and C. Tebaldi. 2015. Climate Change, Global Food Security, and the U.S. Food System [246]. 146 pages.
Climate Variables that Affect Agriculture
Climate Variables that Affect Agriculture
In the first part of this module, we looked at observed and predicted changes in temperature and precipitation. Now, we'll consider some of the impacts that changes in temperature and precipitation may have on crops. For example, the projected increase in temperature will increase the length of the frost-free season (the period between the last frost in the spring and the first frost in the fall), which corresponds to a similar increase in growing season length. Increases in frost-free season length have already been documented in the US (Figure 9.2.1). An increase in growing season length may sound like a great thing for food production, but as we'll see, that can make plants more vulnerable to late frosts and can also allow for more generations of pests per growing season, thus increasing pest pressure. The complexity of the system makes adapting to a changing climate quite challenging, but not insurmountable.
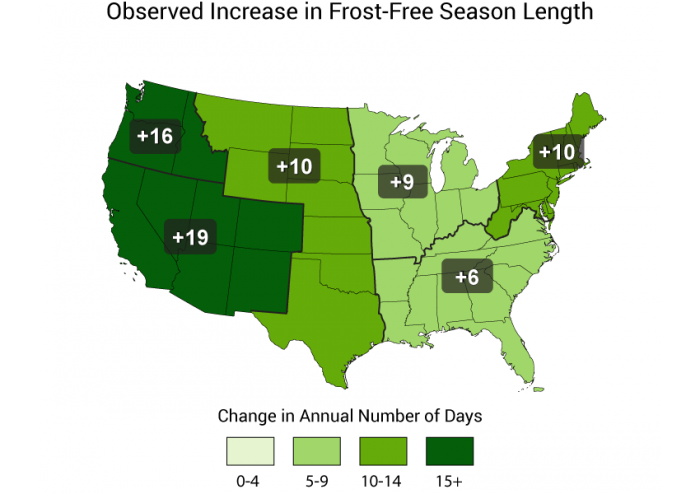
Crops, livestock, and pests are all sensitive to temperature and precipitation, so changes in temperature and precipitation patterns can affect agricultural production. As a result, it's important to consider future projections of climate variables so that farmers and ranchers can adapt to become more resilient.
Projected changes in some key climate variables that affect agricultural productivity are shown in Figure 9.2.2. The lengthening of the frost-free or growing season and reductions in the number of frost days (days with minimum temperatures below freezing), shown in the top two maps, can have both positive and negative impacts. With higher temperatures, plants grow and mature faster, but may produce smaller fruits and grains and nutrient value may be reduced. If farmers can adapt warmer season crops and planting times to the changing growing season, they may be able to take advantage of the changing growing season.
The bottom-left map in Figure 9.2.2 shows the expected increase in the number of consecutive days with less than 0.01 inches of precipitation, which has the greatest impact in the western and southern part of the U.S. The bottom-right map shows that an increase in the number of nights with a minimum temperature higher than 98% of the minimum temperatures between 1971 and 2000 is expected throughout the U.S., with the highest increase expected to occur in the south and southeast. The increases in both consecutive dry days and hot nights are expected to have negative effects on both crop and animal production. There are plants that can be particularly vulnerable at certain stages of their development. For example, one critical period is during pollination, which is very important for the development of fruit, grain or fiber. Increasing nighttime temperatures during the fruit, grain or fiber production period can result in lower productivity and reduced quality. Farmers are already seeing these effects, for example in 2010 and 2012 in the US Corn Belt (Hatfield et al., 2014).
Some perennial crops, such as fruit trees and grape vines, require exposure to a certain number of hours at cooler temperatures (32oF to 50oF), called chilling hours, in order for flowering and fruit production to occur. As temperatures are expected to increase, the number of chilling hours decreases, which may make fruit and wine production impossible in some areas. A decrease in chilling hours has already occurred in the Central Valley of California and is projected to increase up to 80% by 2100 (Figure 9.2.3). Adaptation to reduced chilling hours could involve planting different varieties and crops that have lower chilling hour requirements. For example, cherries require more than 1,000 hours, while peaches only require 225. Shifts in the temperature regime may result in major shifts in certain crop production to new regions (Hatfield et al., 2014).
To supplement our coverage of the climate variables that affect agriculture, read p. 18, Box 4 in Advancing Global Food Security in the Face of a Changing Climate [248], and scroll down to the Learning Checkpoint below.
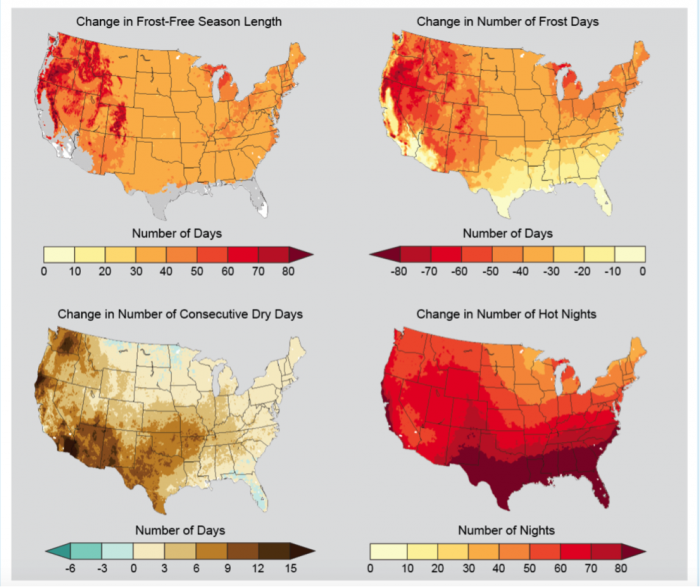
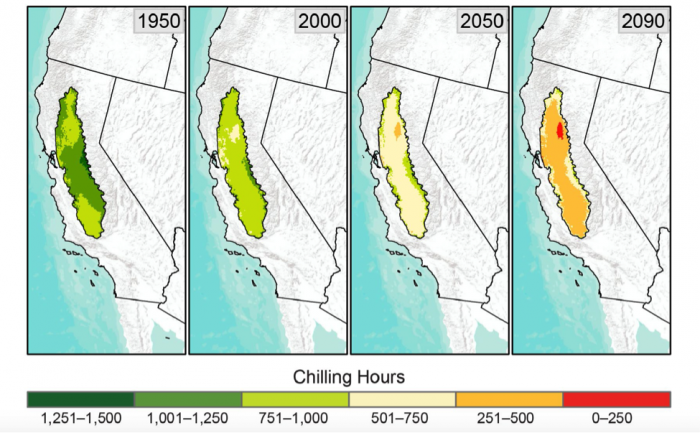
Learning Checkpoint
What are some of the challenges that farmers will face in a changing climate?
Click for the answer.
- increased temperatures
- leads to increased ET - increased water needs for the same crop production and increased water needs for irrigation
- heat stress
- can lead to reduced crop yields
- change in timing and intensity of rainfall
- more extreme weather events – floods and droughts
- increased CO2 concentrations
- may benefit some crops and weeds
- may negatively affect the nutritional makeup of some crops
- shifting zones of crop production
- changing threats from pests, disease, and invasive species
- insects
- weeds
In the first part of this module, we explored some maps from the National Climate Change Viewer. Discuss how the predicted changes in climate that you saw in those maps (Module 9.1 Projected Climate Changes [249]) will likely affect farmers.
Click for the answer.
Direct Effects of Climate Change on Crops
Direct Effects of Climate Change on Crops
Plants, whether crops or native plant species have adapted to flourish within a range of optimal temperatures for germination, growth, and reproduction. For example, plants at the poles or in alpine regions are adapted to short summers and long, cold winters, and so thrive within a certain range of colder temperatures. Temperature plays an important role in the different biological processes that are critical to plant development. The optimum temperature varies for germination, growth, and reproduction varies and those optimum temperatures needed to occur at certain times in the plant's life cycle, or the plant's growth and development may be impaired.
Let's consider corn as an example. In order for a corn seed to germinate, the soil temperature needs to be a minimum of 50oF. Corn seed typically will not germinate if the soil is colder than about 50oF. The minimum air temperature for vegetative growth (i.e., the growth of stem, leaves, and branches) is about 46oF, but the optimum range of temperatures for vegetative growth of corn is 77-90oF. At temperatures outside of the optimal range, growth tends to decline rapidly. Many plants can withstand short periods of temperatures outside of the optimal range, but extended periods of high temperatures above the optimal range can reduce the quality and yield of annual crops and tree fruits. The optimal reproduction of corn occurs between 64 and 72oF, and reproduction begins to fail at temperatures above 95oF. Reproductive failure for most crops begins around 95oF.
Water availability is a critical factor in agricultural production. We saw in Module 4 how increased temperature leads to increased transpiration rates. High rates of transpiration can also exhaust soil water supplies resulting in drought stress. Plants respond to drought stress through a variety of mechanisms, such as wilting their leaves, but the net result of prolonged drought stress is usually reduced productivity and yield. Water deficit during certain stages of a plant's growth can result in defects, such as tougher leaves in kales, chards, and mustards. Another example, blossom end rot in tomatoes and watermelon, is caused by water stress and results in fruit that is unmarketable (Figure 9.2.4 and for more photos of blossom end rot on different vegetables, visit Blossom end rot causes and cures in garden vegetables [250]).
In addition to water stress and impacts on plant productivity and yield, increased temperatures can have other effects on crops. High temperatures and direct sunlight can sunburn developing fruits and vegetables. Intense heat can even scald or cook fruits and vegetables while still on the plant.
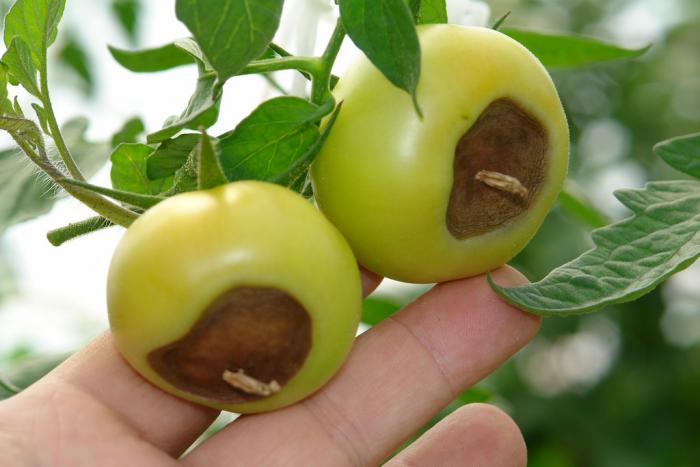
(NRCS_Photo_Gallery).jpg)
Crop yield
A warming climate is expected to have negative impacts on crop yields. Negative impacts are already being seen in a few crops in different parts of the world. Figure 9.2.5 shows estimated impacts of climate trends on crop yields from 1980-2008, with declines exceeding 5% for corn, wheat, and soy in some parts of the world. Projections under different emissions scenarios for California's Central Valley show that wheat, cotton, and sunflower have the largest declines in yields, while rice and tomatoes are much less affected (Figure 9.2.6). Notice that there are two lines on the graphs in Figure 9.2.6 projecting crop yields into the future. The red line corresponds to temperature increases associated with a higher carbon dioxide emissions scenario. We saw in Module 9.1 that the more CO2 we emit, the more heat energy is trapped in the lower atmosphere, and therefore the warmer the temperatures. For some crops, those higher temperatures are associated with great impacts on the crop's yield.
Why are some crops affected more by observed and projected temperature increases than others? It depends on the crop, the climate in the region where the crop is being grown, and the amount of temperature increase. Consider the Activate your learning questions below to explore this more deeply.
Why do some crops see a positive yield change with increasing temperatures, such as alfalfa in Figure 9.2.6? Generally, warmer temperatures mean increased crop productivity, as long as those temperatures remain within the optimal range for that crop. If a crop is being grown in a climate that has typical temperatures at the cooler end of the plant's optimal range, than a bit of warming could increase the crop's productivity. If the temperatures increase above the optimal range or exceed the temperature that leads to reproductive failure, then crop yields will decline.
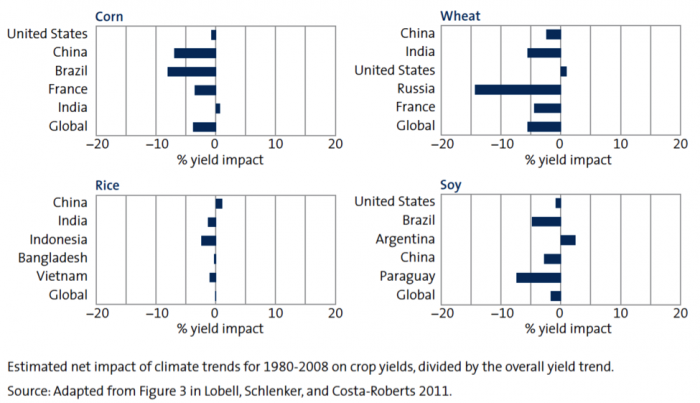
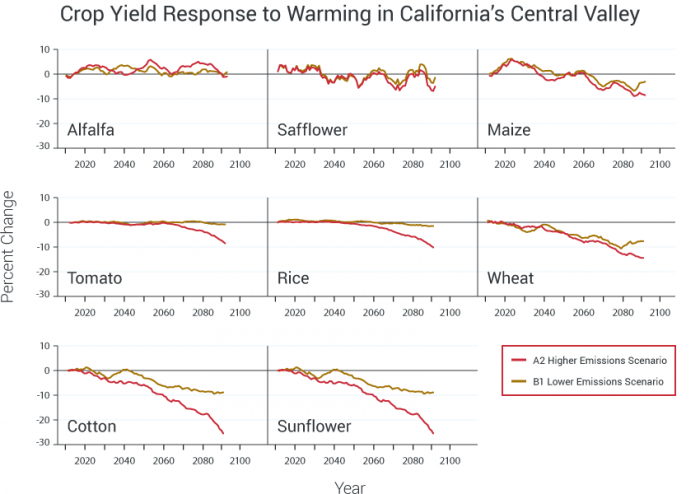
Activate your learning
Inspect Figure 9.2.5 above. Which crops' yields have already been most affected by climate change, and which crops the least?
Click for the answer.
What are some possible reasons for the difference in yield impact between corn, wheat, and rice that you see in Figure 9.2.5?
Click for the answer.
Consider the graph for Wheat in Figure 9.2.5. What is the % yield impact in Russia and United States? What could cause differences in yield impact between regions?
Click for the answer.
Indirect Effects of Climate Change on Plants
Indirect Effects of Climate Change on Plants
Weeds, Insects, and Diseases
Warming temperatures associated with climate change will not only have an effect on crop species; increasing temperature also affects weeds, insect pests, and crop diseases. Weeds already cause about 34% of crop losses with insects causing 18% and disease 16%. Climate change has the potential to increase the large negative impact that weeds, insects, and diseases already have on our agricultural production system. Some anticipated effects include:
- several weed species benefit more than crops from higher temperatures and increased CO2 levels
- warmer temperatures increase insect pest success by accelerating life cycles, which reduces time spent in vulnerable life stages
- warmer temperatures increase winter survival and promote the northward expansion of a range of insects, weeds, and pathogens
- longer growing seasons allow pest populations to increase because more generations of pests can be produced in a single growing season
- temperature and moisture stress associated with a warming climate leaves crops more vulnerable to disease
- changes in disease prevalence and range will also affect livestock production
Modeling and predicting the rate of change and magnitude of the impact of weeds, insects, and disease on crops is particularly challenging because of the complexity of interactions between the different components of the system. The agricultural production system is complex and the interactions between species are dynamic. Climate change will likely complicate the management of weeds, pests, and diseases as the ranges of these species changes.
Effects on Soil Resources
The natural productive capacity of a farm or ranch system relies on a healthy soil ecosystem. Changing climate conditions, including extremes of temperature and precipitation, can damage soils. Climate change can interfere with healthy soil life processes and diminish the ecosystem services provided by the soil, such as the water holding capacity, soil carbon, and nutrients provided by the soils.
The intensity and frequency of extreme precipitation events are already increasing and is expected to continue to increase, which will increase soil erosion in the absence of conservation practices. Soil erosion occurs when rainfall exceeds the ability of the soil to absorb the water by infiltration. If the water can't infiltrate into the soil, it runs off over the surface and carries topsoil with it (Figure 9.2.7). The water and soil that runoff during extreme rainfall events are no longer available to support crop growth.
Shifts in rainfall patterns associated with climate change are projects to produce more intense rainstorms more often. For example, there has been a large increase in the number of days with heavy rainfall in Iowa (Figure 9.2.8), despite the fact that total annual precipitation in Iowa has not increased. Soil erosion from intense precipitation events also results in increased off-site sediment pollution. Maintaining some cover on the soil surface, such as crop residue, mulch, or cover crops, can help mitigate soil erosion. Better soil management practices will become even more important as the intensity and frequency of extreme precipitation increases.
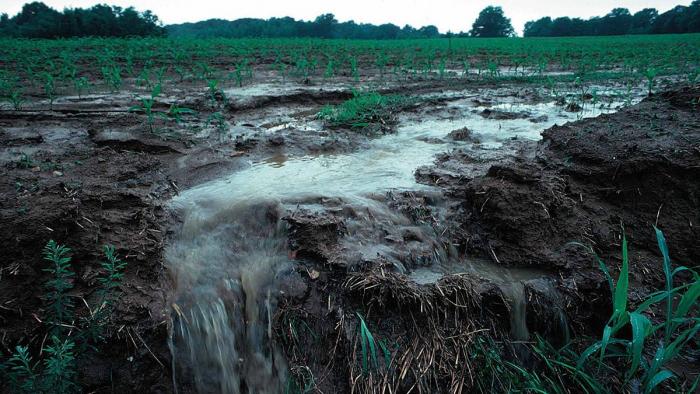
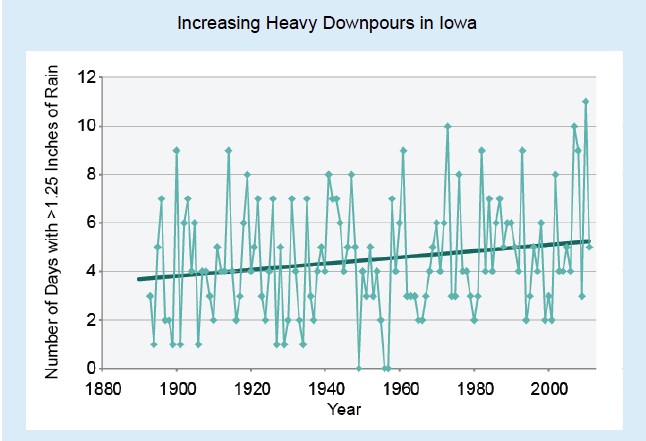
How Farmers Adapt to Climate Change
How Farmers Adapt to Climate Change
Farmers have had to adapt to the conditions imposed on them by the climate of their region since the inception of agriculture, but recent human-induced climate change is throwing them some unexpected curve balls. Extreme heat, floods, droughts, hail, and windstorms are some of the direct effects. In addition, there are changes in weed species and distribution, and pest and disease pressures, on top of potentially depleted soils and water stress. Fortunately, there are many practices that farmers can adopt and changes that can be made to our agricultural production system to make the system more resilient to our changing climate.
Farmers and ranchers are already adapting to our changing climate by changing their selection of crops and the timing of their field operations. Some farmers are applying increasing amounts of pesticides to control increased pest pressure. Many of the practices typically associated with sustainable agriculture can also help increase the resilience of the agricultural system to impact of climate change, such as:
- diversifying crop rotations
- integrating livestock with crop production systems
- improving soil quality
- minimizing off-farm flows of nutrients and pesticides
- implementing more efficient irrigation practices
The video below introduces and discusses several strategies being adopted by New York farmers to adapt to climate change. In addition, the fact sheet from Cornell University's Cooperative Extension about Farming Success in an Uncertain Climate [253]produced by Cornell University's Cooperative Extension outlines solutions to challenges associated with floods, droughts, heat stress, insect invasions, and superweeds. Also, p. 35, Box 8 in Advancing Global Food Security in the Face of a Changing Climate [248] outlines some existing technologies that can be a starting point for adapting to climate change.
Learning Checkpoint: How can farmers adapt to climate change?
- Watch 15 min video by Cornell University about Agriculture and Adaptation about how New York farmers are adapting to climate change.
- Read the fact sheet from Cornell University's Cooperative Extension about Farming Success in an Uncertain Climate [253]
- Read p. 35, Box 8 in Advancing Global Food Security in the Face of a Changing Climate [248]
- Answer the questions below
Video: Climate Smart Farming Story: Adaptation and Agriculture (15:09)
Check Your Understanding
How can frost damage increase with climate change, even if temperatures are overall warming?
Click for the answer.
What are some ways that the risk of frost damage can be reduced in a warming climate?
Click for the answer.
Why is triticale a beneficial forage crop for farmers to grow?
Click for the answer.
What is an important management strategy that farmers can use in growing grapes to work with a changing climate?
Click for answer.
What climate change impacts are the farmers in the video dealing with?
Click for answer.
What strategies are implemented by the farmers in the video to manage their farms in a changing climate?
Click for the answer.
References:
- Hatfield, J., G. Takle, R. Grotjahn, P. Holden, R. C. Izaurralde, T. Mader, E. Marshall, and D. Liverman, 2014: Ch. 6: Agriculture. Climate Change Impacts in the United States: The Third National Climate Assessment, J. M. Melillo, Terese (T.C.) Richmond, and G. W. Yohe, Eds., U.S. Global Change Research Program, 150-174. doi:10.7930/J02Z13FR. On the Web: http://nca2014.globalchange.gov/report/sectors/agriculture [136]
- Lengnick, L. 2015. Resilient Agriculture: Cultivating Food Systems for a Changing Climate, New Society Publishers.
Climate Change in the Coupled Human-Natural System
Climate Change in the Coupled Human-Natural System
We've covered quite a bit of ground in this module. We explored how human activities have led to an increase in atmospheric carbon dioxide, which in turn is increasing the surface temperature of the Earth and changing precipitation patterns. The resulting impacts on our agricultural production system are complex and potentially negative. As a result, farmers are adopting new practices and technologies to adapt to our changing climate and create more resiliency in the agricultural system.
Let's put global climate change and its interaction with our agricultural system into the Coupled Human-Natural System (CHNS) diagram that we've been using throughout the course. The development of global climate change is illustrated in the CHNS diagram in Figure 9.2.9, where the increased burning of fossil fuels within the human system results in more CO2 in the atmosphere. The response in the natural system is that more heat energy is trapped. The resulting feedback that affects the human system is that temperature increases along with all of the other climate change effects that we discuss in this module.
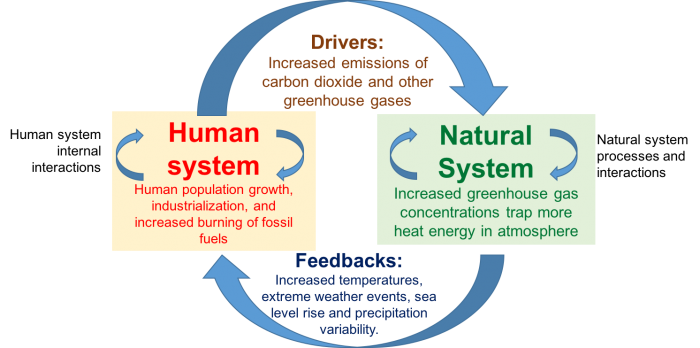
This loop shows the human system with an arrow labeled drivers pointing to natural system with an arrow labeled feedbacks pointing back to human system. Those four concepts are defined as follows:
Human system (human system internal interactions): human population growth, industrialization, and increased burning of fossil fuels
Drivers: increased emissions of carbon dioxide and other greenhouse gases
Natural system (natural system processes and interactions): increased greenhouse gas concentrations trap more heat energy in atmosphere
Feedbacks: increased temperatures, extreme weather events, sea level rise and precipitation variability
What would be the next step in the diagram? Consider the feedbacks associated with the arrow at the bottom of the diagram that will affect the human system. What are the possible responses in the human system to these feedbacks? Our response can be categorized into two broad categories: mitigation and adaptation. We've already discussed adaptation strategies that can be implemented by farmers to adapt to a changing climate. Some examples are to change the crops grown to adapt to the higher temperatures or to install more efficient irrigation systems so that crops can be grown more efficiently.
What about mitigation? Mitigation strategies are those that are targeted at reducing the severity of climate change. One important mitigation strategy is to reduce the burning of fossil fuel, and our agricultural system is a significant contributor to greenhouse gas emissions. Shifting to use renewable energy sources and more fuel-efficient equipment are two mitigation strategies. There are other important mitigation strategies that target other greenhouse gas emissions, such as nitrous oxide from fertilizer use and methane from ruminants and some types of irrigated agriculture.
In the next couple of modules, we'll talk more about strategies to make our agricultural systems more resilient and sustainable, and you'll see how our food production can become more resilient to climate change. In addition, you'll get the opportunity to explore the project climate change impacts on your capstone region and to consider how those projected change might affect the food systems of that region.
Summative Assessment: Climate Change Predictions in your Capstone Region
Summative Assessment: Climate Change Predictions in your Capstone Region
Summary
The summative assessment for Module 9 involves exploring the predictions of future climate variables from climate models for the US, then considering the possible impacts of increased temperature on your capstone region. Also, you will propose strategies to increase the resilience of the food systems in your capstone region to increasing temperatures.
The summative assessment for this module has two parts:
- Exploration of the National Climate Change Viewer - view national predicted change in climate variables for the US
- Data collection and interpretation from the National Climate Change Viewer for your capstone region
The second part requires that you work on the data collection for Stage 3 of the capstone project. Your grade for the module summative assessment will be based on your answers to the questions in the worksheet, which you will answer using the data you download and organize for the capstone.
For the capstone project, you will need to consider the resilience and vulnerabilities of the food systems in your assigned region to projected increases in temperatures. Your task now is to determine what are the temperature increases projected in your assigned region as a result of human-induced climate change. Also, you'll need to start thinking about what impacts those changes may have on the food system in your region. You'll use the National Climate Change Viewer (NCCV) to explore predicted changes in climate variables for the US and to investigate the projected changes in minimum and maximum monthly temperatures in your assigned region.
Instructions
Download the worksheet linked on the next page.
Submitting Your Assignment
Type your answers in essay format into the provided worksheet. If you can, highlight your answers. Submit your document to Module 9 Summative Assessment in Canvas.
Grading Information and Rubric
Your assignment will be evaluated based on the following rubric. The maximum grade for the assignment is 35 points. Pay very close attention to this rubric. The final questions on the worksheet are worth the most points!
| Criteria | Possible Points |
|---|---|
| 1. Summary of projected changes in climate demonstrates a clear understanding of the data retrieved from the NCCV. Correct units of measure are used in the discussion of climate variables. | 10 |
| 2. Summary of climate change impacts on crops shows that the students understand basic connections between plants growth and climate variables. | 10 |
| 3. The answer demonstrates that students considered the adaptation strategies presented in this module and identified strategies appropriate for the regions, including consideration of the region's crops, climate, and food systems. | 10 |
| Answers are typed and clearly and logically written with no spelling and grammar errors | 5 |
Summary and Final Tasks
Summary
In Module 9, we covered the human activities that have led to climate change and the resulting impacts on global climate. We explored some of the climate variables that will affect agriculture and then considered possible adaptation strategies that can be employed to make agriculture more resilient to climate change.
In the next two modules, we will delve deeper into the complexity of the coupled human-natural food system, continuing to employ spatial thinking. In Module 11, we will explore strategies to make food systems more resilient and sustainable. In order, to do that though we need to understand how vulnerable those systems are to stressors like climate change, and to identify the adaptive capacity of those systems. In that final module before the capstone, many of the concepts covered in the course will come together.
Finally, your capstone data collection should be proceeding. The Summative Assessment for Module 9 required that you capture some critical information for your capstone region. The data gathered about projected temperature changes in your capstone region is integral to your final assessment of the resilience of the food systems in your capstone region.
Reminder - Complete all of the Module 9 Tasks!
You have reached the end of Module 9. Double-check the to-do list on the Module 9 Roadmap [254] to make sure you have completed all of the activities listed there before you begin Module 10.
References and Further Reading
Cornell University, College of Agriculture and Life Sciences, Climate Change Facts, 2013, Farm Energy, Carbon, and Greenhouse Gases, (https://cpb-us-e1.wpmucdn.com/blogs.cornell.edu/dist/8/4308/files/2015/0... [255])
Cornell University, College of Agriculture and Life Sciences, Climate Change Facts, 2013, Farming Success in an Uncertain Climate [256](https://ecommons.cornell.edu/bitstream/handle/1813/54950/CornellClimateC... [256])
Hatfield, J., K. Boote, P. Fay, L. Hahn, C. Izaurralde, B.A. Kimball, T. Mader, J. Morgan, D. Ort, W. Polley, A. Thomson, and D. Wolfe, 2008. Agriculture. In: T [257]he effects of climate change on agriculture, land resources, water resources, and biodiversity [257]. A Report by the U.S. Climate Change Science Program and the Subcommittee on Global Change Research. Washington, DC., USA, 362 pp. (CCSP_Ag_Report.pdf from http://www.sap43.ucar.edu/documents/Agriculture.pdf [258])
Hatfield, J., G. Takle, R. Grotjahn, P. Holden, R. C. Izaurralde, T. Mader, E. Marshall, and D. Liverman, 2014: Ch. 6: Agriculture. Climate Change Impacts in the United States: The Third National Climate Assessment [259], J. M. Melillo, Terese (T.C.) Richmond, and G. W. Yohe, Eds., U.S. Global Change Research Program, 150-174. doi:10.7930/J02Z13FR. (NCA3_Full_Report_06_Ag.pdf from http://nca2014.globalchange.gov/report/sectors/agriculture [136])
Lengnick, L., 2015, Resilient Agriculture: Cultivating Food Systems for a Changing Climate, New Society Publishers, 288 pp.
Nelson, G.C., 2014, Advancing Global Food Security in the Face of a Changing Climate [248], The Chicago Council on Global Affairs.
Vermeulen, S.J., B.M. Campbell, J.S.I. Ingram, 2012, Climate Change and Food Systems, Annual Review of Environmental Resources [260], Vol. 37: 195-222. (Vermeulen_etal_2012_ClimateChangeFoodSystems.pdf from http://www.annualreviews.org/doi/pdf/10.1146/annurev-environ-020411-130608 [261] )
Capstone Project Stage 3 Assignment
Capstone Project Stage 3 Assignment
Soil/Crop Management, Pests, and Climate Change
(Modules 7-9)
At this stage, you should have collected quite a bit of data related to the physical environment of your region (water, soils, and climate) as well as related to the regional food system, including the history of the regional food system and which crops are grown in your region. You may also have discovered some impacts that the regional food system is having on soil and water resources in the region.
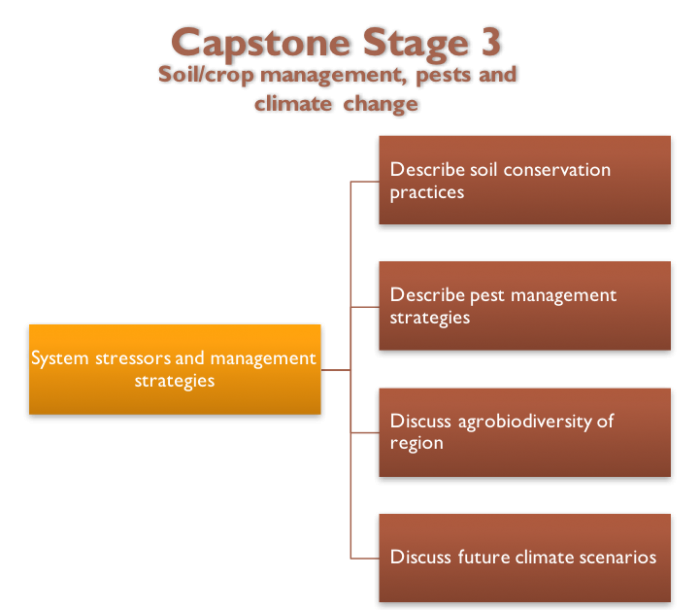
- System stressors and management strategies
- describe soil conservation practices
- describe pest management strategies
- discuss agrobiodiversity of region
- discuss future climate scenarios
What to do for Stage 3?
- Download and complete the Capstone Project Stage 3 worksheet [262] that contains a table summarizing the data you’ll need to collect to complete this stage. Remember, you need to think deeply about each response and write responses that reflect the depth of your thought as informed by your research.
- Add questions and continue to research the questions in your worksheet files.
- Keep track of all of the resources and references you use.
- Add relevant data, maps, and figures to your PowerPoint file.
- Revise your CHNS diagram and/or create a new one incorporating topics from Modules 7, 8 and 9.
Section 4: Food Systems and Sustainability
Section 4: Food Systems and Sustainability
Overview
Modules
- Module 10: Food Systems
- Module 11: Human-Environment Interactions
- Capstone Stage 4
- Module 12: Capstone Stage 5
Section Goals
Upon completion of Section 4 students will be able to:
- Describe ways that food systems impact the earth system.
- Explain the characteristics and scale of the three major food systems coexisting in the world today and their overlap.
- Demonstrate the complexity and interconnectedness of food system types that connecting society to the environment in different ways within a globalized world.
- Construct an assessment that measures the impacts of food systems on the earth system and local environments.
- Describe the concepts of resilience, adaptive capacity, and vulnerability (RACV) in a food system.
- Explain food access and food insecurity as a key challenge to food systems.
- Appraise the value of human seed systems and agrobiodiversity as human system components that incorporate crops as natural components and foster resilience.
- Apply concepts of RACV to understand changes in seed systems and food production in examples.
- Analyze stresses and shocks from climate change and food system failure that lead to both gradual changes in food systems and acute crises such as famines.
Section Learning Objectives
In order to reach these goals, we have established the following learning objectives for student learning. Upon completion of the modules within Section 4, you will be able to:
- Define food systems and name the component systems, the roles played by each, and the three dominant and overlapping types of food systems in the world today.
- Name different types of impacts of the food system on earth’s natural systems.
- Define the basic elements of a coupled human-natural system.
- Describe a life cycle assessment (LCA) and state what it is used for.
- Explain examples of food systems to illustrate and compare the combined social and environmental inputs and impacts.
- Apply the concept of natural human systems to food systems and distinguish different ways that food systems develop and change because of human and natural factors.
- Apply a coupled natural system framework to describe how human systems affect earth’s natural systems within food systems.
- Construct life-cycle assessments using data on food production activities that compare the impacts of different types of food systems on the earth systems.
- Synthesize outputs of LCAs you have constructed to compare impacts of different food production systems.
- Define the concepts of perturbations and shocks, resilience, adaptive capacity, and vulnerability in the context of agri-food systems.
- Define and describe agrobiodiversity within food production systems and changes in this agrobiodiversity over time
- Define the concepts of food access, food security, food Insecurity, malnutrition, and famine.
- Give examples of resilience, adaptive capacity, and vulnerability in food systems.
- Give examples of support systems for biodiversity in land use and food systems
- Use an online mapping resource to compare different parts of the United States in terms of food access, and identify key areas with low food access.
- Evaluate recent examples in land use and food systems of resilience, adaptive capacity, and vulnerability (RACV).
- Analyze an example of a recent famine and understand how multiple factors of vulnerability and shocks combine to create widespread conditions of food insecurity known as famines.
- Propose actions that can be taken to respond to and prevent famine within a recent historical example.
- Propose principles embodying RACV for incorporation into a proposal/scenario for an example food system (capstone project)
Module 10: Food Systems
Module 10: Food Systems
Overview
Understanding Coupling in Natural and Human Systems
Module 10 continues the theme of human-environment interactions seen at smaller scales in agroecosystems in module 8 and elaborates on the coupled human-natural systems (CHNS) concept introduced in Module 1. As learners, in Module 10.1 you will explore different scales and types of food systems, learn about barriers food producers face within food systems, and look in detail at how the framework of CHNS allows us to see divergences of food system into different types, and transitions from one type to another. In Module 10.2 you’ll learn about the impacts of food systems on natural systems, and practice a method called Life-Cycle Assessment (LCA) which is used to measure the impact of Human Food System components on the environment. LCAs can be applied to measure the impacts of both particular products as well as complex human systems on the environment. The food systems typology, the CHNS framework, and the broad ideas behind LCAs in measuring impacts across a system are tools that you can use to develop your ideas for the capstone project and other learning efforts beyond this course.
As you apply the CHNS framework and the LCA method, you'll be using a geoscience habit of mind introduced in module 1, that of systems thinking. Systems-oriented frameworks and methods are ways of interpreting and measuring complex systems in a way that incorporates the scale of an entire system as well as linkages among many interacting parts. As designers of this course, we believe that these frameworks and skills will be useful to you whether or not you go in some area of geosciences since systems thinking is a needed skill in today's complex world.
Goals and Learning Objectives
Goals and Learning Objectives
Goals
- Describe ways that food systems impact the earth system.
- Explain the characteristics and scale of the three major food systems coexisting in the world today and their overlap.
- Demonstrate the complexity and interconnectedness of food system types that connecting society to the environment in different ways within a globalized world.
- Construct an assessment that measures the impacts of food systems on the earth system and local environments.
Learning Objectives
After completing this module, students will be able to:
- Define food systems and name the component systems, the roles played by each, and the three dominant and overlapping types of food systems in the world today.
- Name different types of impacts of the food system on earth’s natural systems.
- Define the basic elements of a coupled human-natural system.
- Describe a life cycle assessment (LCA) and state what it is used for.
- Explain examples of food systems to illustrate and compare their combined social and environmental inputs and impacts.
- Apply the concept of natural human systems to food systems and distinguish different ways that food systems develop and change because of human and natural factors.
- Apply a coupled natural system framework to describe how human systems affect earth’s natural systems within food systems.
- Construct life-cycle assessments using data on food production activities that compare the impacts of different types of food systems on the earth systems.
- Synthesize outputs of LCAs you have constructed to compare impacts of different food production systems.
Assignments
Module 10 Roadmap
Detailed instructions for completing the Summative Assessment will be provided in each module.
| Action | Assignment | Location |
|---|---|---|
| To Read |
|
|
| To Do |
|
|
Questions?
If you prefer to use email:
If you have any questions, please send them through Canvas e-mail. We will check daily to respond. If your question is one that is relevant to the entire class, we may respond to the entire class rather than individually.
If you prefer to use the discussion forums:
If you have any questions, please post them to the discussion forum in Canvas. We will check that discussion forum daily to respond. While you are there, feel free to post your own responses if you, too, are able to help out a classmate.
Module 10.1: Food Systems
Module 10.1: Food Systems
What are food systems and what do they do?
This module builds on the introductory material in modules one and two defining food systems as coupled human-natural systems: human society interacting with the natural earth system. It marks the transition in the course to focusing on human food systems and land use and their impacts on the environment and earth systems.
Introductory Video on Food Systems
Introductory Video on Food Systems
In the introductory video below you will see a particular local example of a food system, presented by the Food and Agriculture Organization (FAO) of the United Nations. As you watch, look for examples of Human and Natural system components in a local food system particular to the Red River Delta in Vietnam, and the way that the food system has changed over time. Human and Natural system components were introduced in Module 1, and we have been referring to them regularly along the way in the course, as we have considered the natural system elements in agroecosystems and the way these are managed by humans. Now we will begin to take a larger, whole systems view of food systems.
Please watch the below video celebrating world food day 2013, which describes the Vietnamese “Garden, Pond, Livestock Plan” (V.A.C) food system.
Video: World Food Day 2013 [266] (6:52)
Food Systems: Environments, Production, Distribution, and Household Utilization of Food
Food Systems: Environments, Production, Distribution, and Household Utilization of Food
The introductory section below is adapted from "Chapter 3: The food system and household food security” at the document website of the United Nations Food and Agriculture Organization [9] (FAO).
This section attempts to describe the parts of a food system in basic terms, starting from the standpoint of the systems approach. It begins, "the perception underlying the systems approach is that the whole is greater than the sum of its parts. Any situation is viewed in terms of relationships and integration. A food system may thus include all activities related to the production, distribution, and consumption of food that affect human nutrition and health (see Figure 10.1.1, which is reproduced from module 1).
Food production comprises such factors as the use of land for productive purposes (land use), the distribution of land ownership within communities and regions (land tenure), soil management, crop breeding and selection, crop management, livestock breeding and management and harvesting, which have been touched on in previous modules. Food distribution involves a series of post-harvest activities including the processing, transportation, storage, packaging, and marketing of food as well as activities related to household purchasing power, traditions of food use (including child feeding practices), food exchanges and gift-giving and public food distribution. Activities related to food utilization and consumption include those involved in the preparation, processing, and cooking of food at both the home and community levels, as well as household decision-making regarding food, household food distribution practices, cultural and individual food choices, and access to health care, sanitation, and knowledge.
Among the components of the food system, e.g. food processing, communication, and education, there is substantial overlap and interlinkage. For example, household decision-making behavior with regard to food is influenced by nutrition knowledge and by cultural practices with regard to food allocation within the household as well as by purchasing power and market prices."
Food systems are further embedded in environments and societies (thus, both natural and social/political contexts) which differ according to a variety of factors such as agroecology (the composition of the local agroecosystem, see previous modules), climate, social aspects, economics, health, and policy. The model presented in Figure 10.1.1 above is useful in conceptualizing the various activities that determine food security and nutritional well-being and the interactions within the food system."
Two important features that we want to emphasize in the passage above from the FAO are first, the fact that food systems involve processes at multiple scales (e.g. local agroecosystems, government policy at a national scale, international research and technology development), which eventually have many impacts at a household scale, either in the livelihoods of food producers (who gain income from the food system and also consume food); and also for consumers around the world. Second, criteria with which we should evaluate food systems are their ability to deliver nutrition and health outcomes (see e.g. module 3), and also the sustainability of natural resources and environments, which we will consider in module 10.2. We note that these criteria of environmental sustainability and health are at opposite ends of this "conveyer belt" model of food systems, where the food system "conveyer belt" can be said to deliver nutrition and health outcomes by transforming the inputs from natural resources and environments. These health and nutrition outcomes are associated with the concept of food security (sufficient access to appropriate and healthy food) which was introduced in module 3 and will be further explored in module 11. Human health and environmental sustainability correspond roughly to the positive objectives that we conceive of for the human system and natural systems, respectively: health and equitable nutrition (or food security) in the human system, and environmental sustainability of natural systems. A final observation from Fig. 10.1.1 is that food systems are ubiquitous and touch on all aspects of human societies. We are all participants in food systems, either as producers, consumers, in the distribution or in other myriad ways.
Activate Your Learning: Food's Journey in the Food System
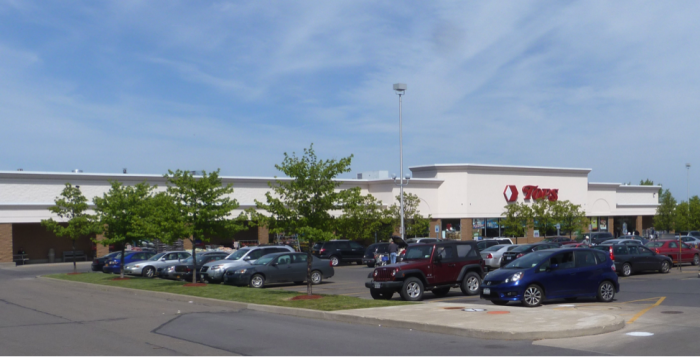
Food systems comprise the interacting parts of human society and nature that deliver food to households and communities (see the previous page), and can be used to understand food in its relation to the earth system. To better understand food systems, in the exercise below you'll be asked to consider a familiar food of your choice, and the journey this food takes from where it is produced to the meals that we consume every day. Within the food supply chain for this food, you'll be asked to distinguish between social (human system) aspects and environmental (natural system) aspects of that product's food production and supply chain.
Activate Your Learning Activity:
In the blanks below, fill in the blanks regarding the supply chain for food products. You can also download the worksheet [268] for filling in offline, or as part of a classroom activity. As depicted in Fig. 10.1.3, you’ll need to give the origin, some intermediate destinations, and then the final consumption point for the food product. Then you should think of some social or human system dimensions of the production, supply chain, or consumption of this product, as well as some ecological or natural system dimensions and fill in the corresponding blanks. Do this first for a product familiar to you, whose supply chain you either know about or can research quickly (part 1). Then repeat the activity for a food product in the online introductory video from the first page of this module, about food systems in Vietnam (part 2). When you are done with each part you can click on the ‘answers’ link in the below each part, and see how your answers match up.

Fill in the blanks below. If you are doing this online, just note your answers on a piece of paper regarding the food product you have chosen, or download the worksheet [268]. When you are done you can click on the ‘answers’ link below to see some possible examples and see if your answers match up with these answers.
- Food product ______________________________
- Food supply Chain:
- Source: Where main raw material is produced, fished, hunted: ___________________________
- Intermediate destination 1: ___________________________ (e.g processing plant, washing, trucking, warehouse, etc.)
- Intermediate destination 2: ___________________________ (e.g processing plant, washing, trucking, warehouse, etc.)
- Intermediate destination 2: ___________________________ (if needed)
- Consumption point: ___________________________
- Up to three social or human system dimensions of this food chain (e.g. policy, economic, or cultural factors associated with the production and consumption of this food, recall the Human System factors in a Coupled Human Natural Framework, module 1.2)
- _______________
- _______________
- _______________
- Up to three ecological or natural system dimensions of this food chain: (ecological factors would include crop and animal species, agroecosystems, climate, water, and soil influences on food production):
- _______________
- _______________
- _______________
Example answers
(These may be a good deal more complete than your examples but give a sense of the range of possible answers)
Example Answer 1 - frozen, breaded fish filet from a local supermarket:
Click for the answer.
- Frozen, breaded fish filet (i.e., the fish part)
- Food supply chain:
- Fishing boat in Atlantic, Chinese, or Alaskan Fishery, e.g., including flash-freezing.
- Preparation facility in Canada or U.S.
- Cold chain shipping / Supermarket
- Kitchen oven and dining table for food preparation and consumption.
See some fascinating details about the production process, in How It's Made [269].
- Social dimensions:
- Financing, organization, and contracts for a fishing fleet and processing
- Government and fishing communities’ agreements on fisheries regulation to avoid overfishing.
- Supermarket companies
- Ecological dimensions:
- The wild fish species itself
- Food sources for the fish (algae, other fish)
- Changing ocean temperatures and conditions with climate change
Example Answer 2 - Bagel or bread from a local bake or coffee shop:
Click for the answer.
- Baked good (i.e., flour it is made from)
- Food supply chain:
- Farm in Midwest or Western U.S.
- Grain elevator purchasing and storing grain
- Flour production facility
- Café or restaurant kitchen (may be a large centralized kitchen for a chain restaurant) and coffee shop table for consumption.
- Social dimensions: (could include any of these)
- Farm enterprise belonging to a farm family or company – organization of production labor and agroecosystem management.
- Supply chains and companies for fertilizers, seed, and other agricultural inputs
- Government policies regulating subsidies to farmers, tax on diesel fuel, pollution regulations etc.
- Grain commodity markets and corporations
- Ecological dimensions:
- Domesticated wheat species (Triticum aestivum)
- Prairie soils (Mollisols) with inherent good qualities and climate for wheat growing
- Soil bacteria breaking down organic matter, releasing nutrients, accessing fertilizer N and releasing nitrous oxide.
- Bread yeast and/or sourdough bacteria used in bread making.
Exercise 2:
Recall the video celebrating world food day 2013, World Food Day 2013 Video: the Vietnamese “Garden, Pond, Livestock Plan” (V.A.C) food system" [266]. You may want to quickly skim the video again and note the food pathways that foods are following in these systems. Then choose either a product that is consumed within the household that appears in the video or one that is sold outside the household (some products fit into both categories). Fill in the same set of production and transport steps for this product as you did in part 1, as well as some social and ecological aspects. You can use a piece of scrap paper or the downloaded worksheet. Note that a product consumed in this farming household may have a very short food supply chain!
Look at the following worksheet and fill in the blanks corresponding to the blanks below. When you are done you can click on the ‘answers’ link to see some possible examples and see if your answers match up with these answers.
- Food product ______________________________
- Food supply Chain:
- Source: Where main raw material is produced, fished, hunted: ___________________________
- Intermediate destination 1: ___________________________ (e.g processing plant, washing, trucking, warehouse, etc.)
- Intermediate destination 2: ___________________________ (e.g processing plant, washing, trucking, warehouse, etc.)
- Intermediate destination 2: ___________________________ (if needed)
- Consumption point: ___________________________
- Up to three social or human system dimensions of this food chain (e.g. policy, economic, or cultural factors associated with the production and consumption of this food, recall the Human System factors in a Coupled Human Natural Framework, module 1.2)
- _______________
- _______________
- _______________
- Up to three ecological or natural system dimensions of this food chain: (ecological factors would include crop and animal species, agroecosystems, climate, water, and soil influences on food production):
- _______________
- _______________
- _______________
Example Answers
Example for the Vietnam VAC food system example:
Click for the answer.
- Food Product: Fish from the fish pond in the video
- Food supply chain (if sold):
- Brought from pond
- Transported by cart or truck to city
- Sold in market
- Prepared at home
- Brought from pond
- Prepared and eaten.
- Social dimensions: (could include any of these)
- Farm enterprise belonging to a farm family – production roles of family members
- Government policies promoting choice by farmers of what to grow and the ability to market it (note as a communist government there was a time when this was not allowed)
- Government and community efforts to promote and adapt the V.A.C. food production methods.
- The organization of local markets and food sellers that allows farmers to sell products.
- Ecological dimensions:
- Fish species e.g. carp
- Pond / Garden agroecosystem
- Recycling of organic wastes from fish production into soils
- Rainy climate/river delta geography and abundant water for fish and crop production.
Spatial Scale and Typologies of Food Systems
Spatial Scale and Typologies of Food Systems
A good way to understand the complexity of different types of food systems is to look for organizing principles to classify them. In the introductory food supply chain exercise at the beginning of this module, if you chose a product that was produced a long distance from where you consumed it, you are aware that the global food system today handles food at an enormous spatial scale. This example leads to one way to organize our understanding of food systems, which is the hierarchy global, regional, and local scales of food systems (Fig. 10.1.4).
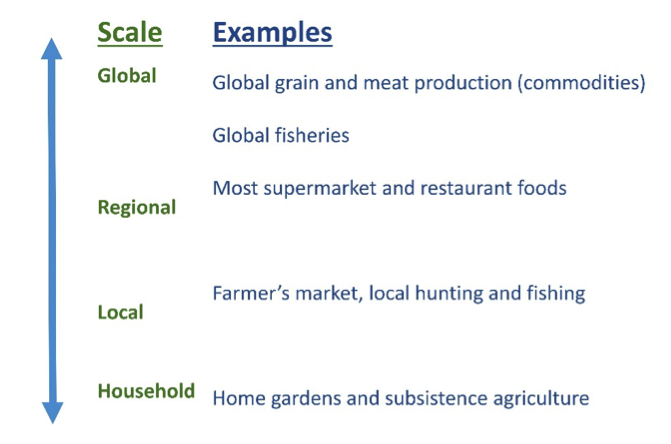
| Scale | Examples |
|---|---|
| Global | Global grain and meat production (commodities), Global fisheries |
| Regional | Most supermarket and restaurant foods |
| Local | Farmer's market, local hunting and fishing |
| Household | Home gardens and subsistence agriculture |
Another helpful way to classify food systems is to look for typologies of food systems. Building typologies is a somewhat subjective but often helpful process where we look for groups of systems or components that hang together in order to better understand their function, importance, or other attributes. For the typology of food systems we present here, we are thinking about classifying food systems based on how production occurs and at what scale, which portions of society are involved in production and distribution, and the rationale underlying production, distribution, and consumption. In this course, we use the scheme of three overlapping food systems that exist at global, regional, and local scales shown below in Fig. 10.1.5.
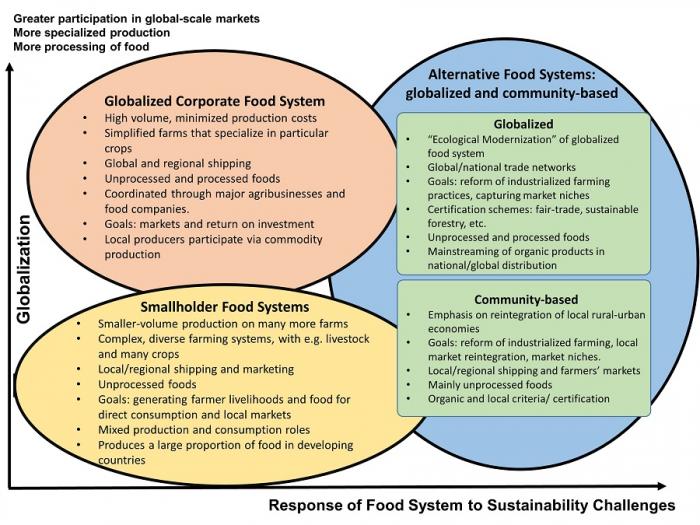
Global Corporate Food System
- High volume, minimized production costs
- Simplified farms that specialize in particular crops
- Global and regional shipping
- Unprocessed and processed foods
- Coordinated through major agribusinesses and food companies
- Goals: markets and return on investment
- Local producers participate via commodity production
Smallholder Food Systems
- Smaller-volume production on many more farms
- Complex, diverse farming systems with e.g. livestock and many crops
- Local/regional shipping and marketing
- Unprocessed foods
- Goals: generating farmer livelihoods and food for direct consumption and local markets
- Mixed production and consumption roles
- Produces a large proportion of food in developing countries
Alternative Food Systems: Globalized and Community-based
- Globalized
- "Ecological modernization" of globalized food system
- Global/national trade networks
- Goals: reform of industrialized farming practices
- Certification schemes: fair-trade, sustainable forestry, etc
- Unprocessed and processed foods
- Mainstreaming of organic products in national/global distribution
- Community-based
- Emphasis on reintegration of local rural-urban economies
- Goals: reform of industrialized farming, local economies
- Local/regional shipping and farmers' markets
- Mainly unprocessed foods
- Organic and local criteria/certification
The Globalized Corporate Food System
The Globalized Corporate Food System
Consumers worldwide who enter a supermarket are largely interacting with this type of food system. Some local and regional products are provided, but food is largely sourced from major national and global production regions and can be transported long distances (100 to thousands of miles or km) with enormous quantities of food moving through the system as a whole. There is an emphasis on modern production and processing techniques, efficiency, and lowering the immediate costs of production. Also, many of the products moving through this system are thought of as commodities: products that are generic and replaceable regardless of their origin and that carry standard global and national pricing frameworks. Examples would be corn grain for food, different grades of rice, soy and corn oils, supermarket potatoes and tomatoes, and cuts of pork for supermarket consumption.
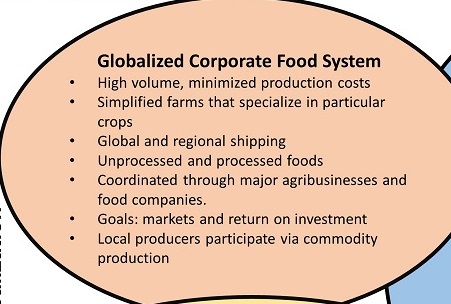
Globalized Corporate Food System
- High volume, minimized production costs
- simplified farms that specialize in particular crops
- global and regional shipping
- unprocessed and processed foods
- coordinated through major agribusiness and food companies
- goals: markets and return on investment
- local producers participate via commodity production
Calling this a ‘corporate’ system may obscure the fact that production for this national/global scale system occurs most commonly not on corporate property or company farms, but in family farm enterprises like the thousands of dairy and grain farms that populate many regions of the United States. For example, family farms still constitute about 97% of farms in the United States by number, although the acreage in company-owned farms and the value earned by these company-owned farms is larger than this numerical count suggests (top pie-charts within Figure 10.1.8a below). Also, in some areas of the country, ‘large’ and ‘very large’ family farms have mean farm sizes of many thousands of acres, which contradicts the traditional image of a small family enterprise, and illustrating the pressures for farms to become large in modern industrialized food systems, in order to take advantage of economies of scale in farming (economies of scale refers to the idea that as the size of an enterprise goes up, the efficiency of producing a given item goes up and the cost per item goes down, e.g. baking one tray of muffins every Saturday versus opening a muffin shop making hundreds of muffins every day).
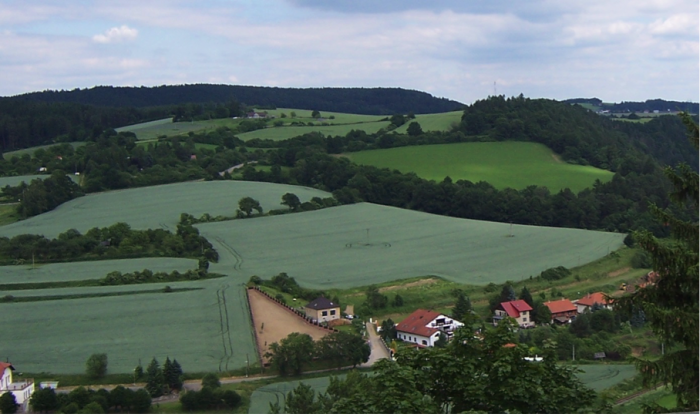
Nevertheless, this portion of the food system is called both ‘global’ and ‘corporate’ because most organizations that coordinate demand and organize processing and distribution of foodstuffs in this layer of the global food system are corporations seeking benefit for their shareholders. In module 3 on nutrition we discussed the way that food has become fiscalized, i.e. it is not only a product working its way through a marketplace to consumers but an active object of investment in the future growth potential of the business of food. These investments are managed through large-scale exchanges like the stock exchange here in the United States. These exchanges allow large swaths of relatively wealthy world citizens (including many in the middle class) to invest in the large-scale production of food and reductions in prices, but can create sustainability issues within the food system because the return on investment rather than food security or environmental sustainability becomes the predominant objective of investors and corporations. Nevertheless, not just corporate entities but also government and civil society (e.g. farmer and community organizations, universities) are also heavily involved in these global systems and can act to reform problems or regulate damaging or unjust practices. They act by way of advocacy and regulation, national/international food policies and support structures such as research on food production and food processing methods.
Within this global system, then, local farmers and fishing communities often act as producers selling into commodity markets, alongside industry-owned farms, feedlots, and other production facilities. In addition to unprocessed food ingredients, the globalized corporate food system has also been largely responsible for the expansion in processed and prepared foods, that seeks to provide convenience for consumers as well as capture the added market value of more prepared foods. Processed foods have been criticized, especially by those advocating community food systems (see description further on), because they displace fresh and whole food components of diets that are important to good nutrition outcomes (see module 3). Processed foods often contain processed industrial ingredients such as corn syrup and processed, low-quality fats along with a lower fiber and vitamin content, which is usually not true of whole unprocessed foods.
Farms and acreage of different crops in United States agriculture:
The pie charts below demonstrate aspects of the description of the globalized food system above. For example, at least in terms of numbers, smaller, family-owned farms with an average size of approximately 240 acres (around 100 hectares with one hectare = 100 x 100 m) dominate the numbers of farms in the United States (Fig. 10.1.8a). Nevertheless, large farms dominate to a greater extent than these smaller farms when considering the total area taken up by farms of different sizes, and a large proportion of income is going to larger operations in a number of classes of farm products (Fig. 10.1.8b). These patterns vary somewhat by what sector of the farming economy is being described, and we include some separate graphs for maize, vegetables, and dairy farms. You will use these graphs in the knowledge check activity below.
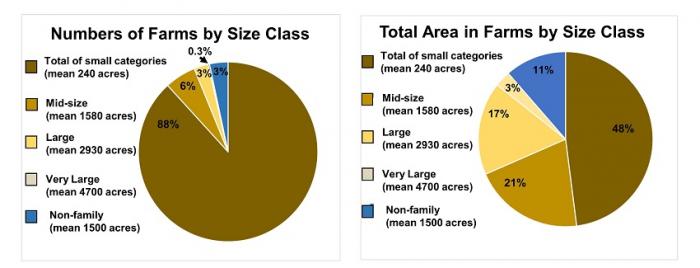
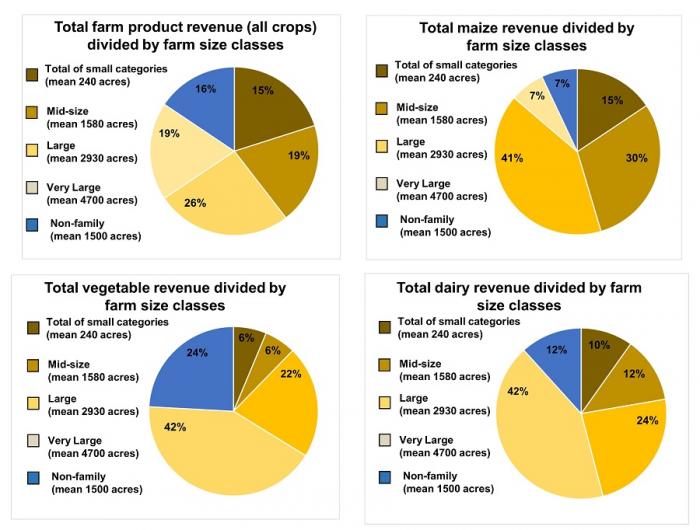
Knowledge Check: Food products and farm sizes in U.S. agriculture
Choose the correct answers based on the graphs in Figure 10.1.8 above and then click on the space for the correct answers.
Question 1 - Short Answer
Which food product type (maize, vegetables, dairy) above had the largest participation of non-family owned farms, in terms of revenue from sales of that food product type?
Click for the answer.
Vegetables. This means that in Maize and Dairy production, family-owned farms are more important in terms of total earnings.
Question 2 - Short Answer
Which crop type above has the largest participation of family-owned farms in the SMALL category, in terms of value sold?
Click for the answer.
Maize
Question 3 - Short Answer
These charts don’t show the large variation that exists in the distribution of farm sizes around the country, which you will want to incorporate into your capstone project for your capstone region. If you have looked up this information for your capstone, does your capstone region have a smaller or larger average (or median) farm size?
Click for the answer.
Here are some answers for different regions of the country that should help you to estimate how farm size varies: California – in line or larger than these figures; Colorado: in line with these figures on farm size; Pennsylvania: smaller. In particular, the Pennsylvania dairy sector is much less dominated by very large and corporate farm holdings. This is information you will be able to find in the USDA Census county-level reports, which give a breakdown on farmland areas for each county in the United States.
Question 4 - Short Answer
How do you think the “small” category of U.S. farms in land area (236 acres or just under 100 hectares) compares to the average landholdings of the “small” category for countries like Peru, Kenya, or India where smallholders (farmers on relatively small land areas) are a large part of the population?
Click for the answer.
The median small farm size of smallholder farmers in these countries is much smaller, often 10 acres (3-4 hectares) or less, which is less than a tenth of the "small" family farm in the united states.
Smallholder Farmer Food Systems
Smallholder Farmer Food Systems
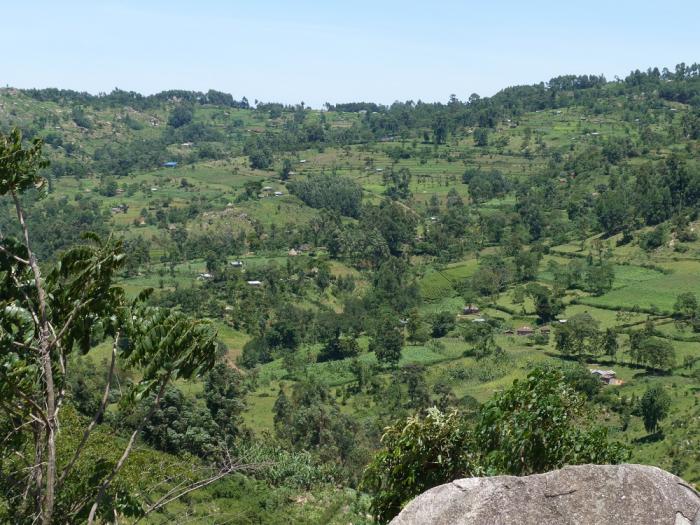
Approximately 500 million smallholder farms with areas less than 2 hectares (5 acres) support the nutrition and livelihood of approximately two billion people in smallholder farms globally (IFAD, 2013). As such smallholders form an important sector of the global food system, producing up to 80% of local and regional food supplies in Sub-Saharan Africa, South/Southeast Asia, and China. You saw an example of a smallholder system in the summative assessment for module 1. Livelihood strategies of households in this system attempt to overcome risk and guarantee subsistence as well as cash income. For this reason, these "semi-subsistence" farming systems are often complex, for example integrating agriculture, livestock, and agroforestry food production with off-farm livelihood activities that overlap with consumption from the globalized food system (previous page). Most food is consumed either on the farm where it is produced or locally and regionally, with transport and distribution handled by relatively short-distance networks.
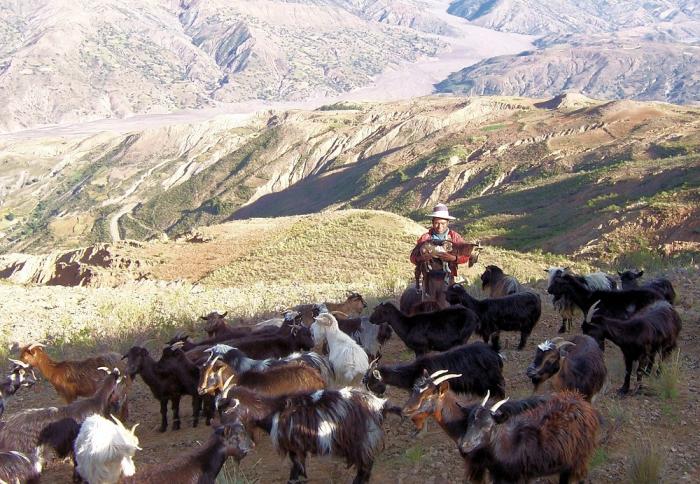
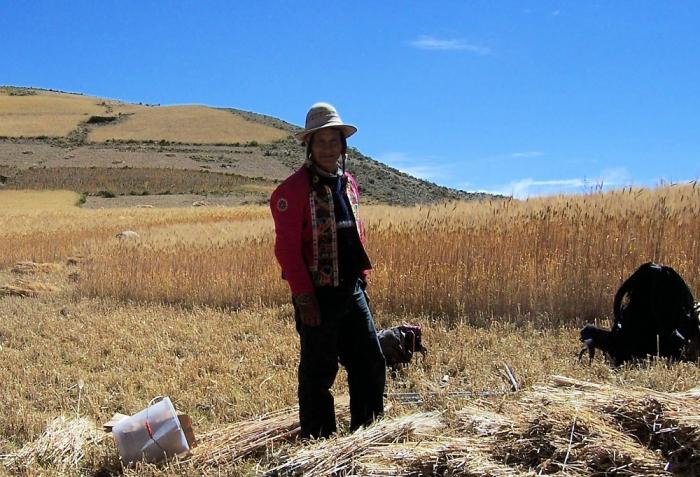
Alternative Food Systems: Global and Local Variants
Alternative Food Systems: Global and Local Variants
"Quasi-Parallel" Alternatives to Modern Food Systems
You may recall that the concluding section of module 2 on the history of crop domestication and food systems we presented the recent development of alternatives to the modern globalized food system as "quasi-parallel" new movements as well as food production and distribution strategies intended to address sustainability issues. We use the word "quasi-parallel" because the global and local variants of these responses focus on different strategies and scales within the food system, and target different outcomes, even though both consider themselves to be responding to the sustainability challenges in the modern food system, sometimes using similar practices at the farm scale for managing crops and soils. Also, we acknowledge at the outset that dividing these strictly into two variants may not cover every case. The intention is to give you a sense of the range of alternatives being proposed so that you can potentially look for these types of alternative food systems in your capstone regions and integrate them into proposed sustainability strategies for the future of food in these regions. Also, it is likely that both variants will have advantages and disadvantages that are pointed out and debated by proponents and critics. From this debate we can see that sustainability is a contested concept, depending on the assumptions, goals, and arguments used by different advocates: it does not have a single definition to different camps in the debate over sustainability.
Globalized Alternatives: "Ecological Modernization" as a Reformation of Globalized Food Systems
Globalized variants of alternative food systems seek to correct issues of sustainability from within the framework of global food production and food trade networks. This has been called a case of "ecological modernization" because it seeks to reform certain aspects of globalized corporate food systems (previous pages) such as environmental impact and labor standards, while not altering the main features of the modern global system, for example, large scale of production, long-distance distribution, and leveraging the economic power of global investment to expand production and increase efficiency. Advocates of this approach promote strategies such as the "triple bottom line" for companies, which refers to positive environmental and social benefits from company activities being measures of company success in addition to economic profitability (thus a triple measure mirroring the "three-legged stool" of sustainability, see Module 1 and following pages in this module). Advocates also generally point to the fact that given the globalized corporate food system embodies by far the largest impact on levels of social equality and natural systems currently, reforming its activities and standards for performance is a way to have a tremendous impact on global sustainability. Detractors of "ecological modernization", including advocates of community-based food systems below, complain that these reform efforts leave in place unsustainable features of the system, such as large-scale production that is corrosive to local communities, or marginalization of smallholder farmers within markets or in land distribution in some cases (see the "agriculture of the middle" critique and the concept of a poverty trap in the following pages).
Notwithstanding this debate, it is useful to note some main features and trends in this globalized approach. Like the community-based variant, the globalized variant has prescriptive goals for the food system in response to sustainability problems of the modern food system. It supports substitution of more sustainable methods of food production, such as integrated pest management, organic methods, reduced tillage, and protection of watersheds from pollution with improved farming techniques, some of which have been seen in previous modules. Certification schemes are promoted that hold producers and distribution networks to a higher standard, such as organic certification (which generally must conform to standards in the country where the food product is sold). As another example, fair trade certification seeks to improve the price paid to local producers in source regions, who have generally received very low prices for their products, and thus shares the approach of strengthening local economies with the community-based approaches below, even if it uses global trading networks.
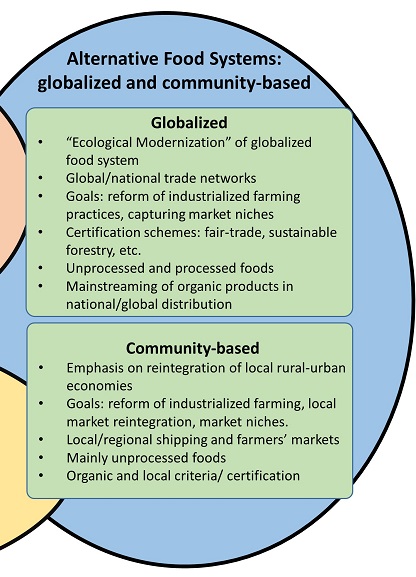
Alternative Food Systems: globalized and community-based
- Globalized
- "ecological modernization" of the globalized food system
- global/national trade networks
- goals: reform of industrialized farming practices, capturing market niches
- certification schemes: fair-trade, sustainable forestry, etc.
- unprocessed and processed foods
- mainstreaming of organic products in national/global distribution
- Community-based
- emphasis on reintegration of local rural-urban economies
- goals: reform of industrialized farming, local market reintegration, market niches, local/regional shipping and farmers' markets
- mainly unprocessed foods
- organic and local criteria/certification
Community-based Alternatives
Like the globalized variant, community-based alternative food systems define prescriptive goals but oppose many elements of the globalized corporate food system. The community food system primer (Wilkins and Eames-Sheavly 2010, see link below if further interested) states that "a community food system is a food system in which food production, processing, distribution, and consumption are integrated to enhance the environmental, economic, social and nutritional health of a particular place". Three examples of these prescriptive goals within common components of community food systems are:
- Organic agriculture as a way to reduce contamination of food with pesticides and improve the ecosystem health of farms
- Farmers markets and community-supported agriculture schemes that allow consumers to more directly support the activities of farmers
- An emphasis on supporting the activities of small and medium producers and resisting pressures for production and distribution enterprises to grow larger and larger
Many other examples of community food systems can be found, which also include efforts to link smallholder farmers and their food production systems (see previous page) as producers for burgeoning urban markets in developing countries, thus substituting some of the supply from the globalized corporate food system beyond the food products that are already supplied by smallholders to cities in these countries. The overall volume of food handled by these community-based food systems is generally much smaller than the globalized or smallholder types of food systems. Nevertheless, advocates point out that the potential market of urban consumers in relatively close proximity to small-scale producers around the world is potentially enormous. In fact, channels of alternative food production and distribution (e.g. organic agriculture) are among the fastest growing sectors in volume and economic value on a percentage basis, year after year [USDA-Economic Research Service [270]].
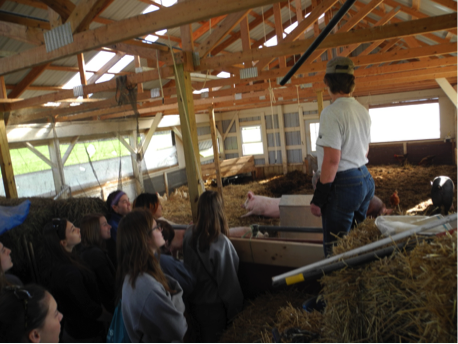
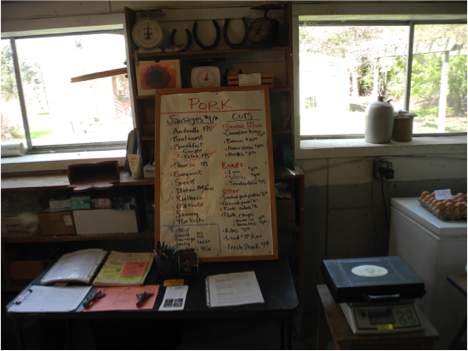
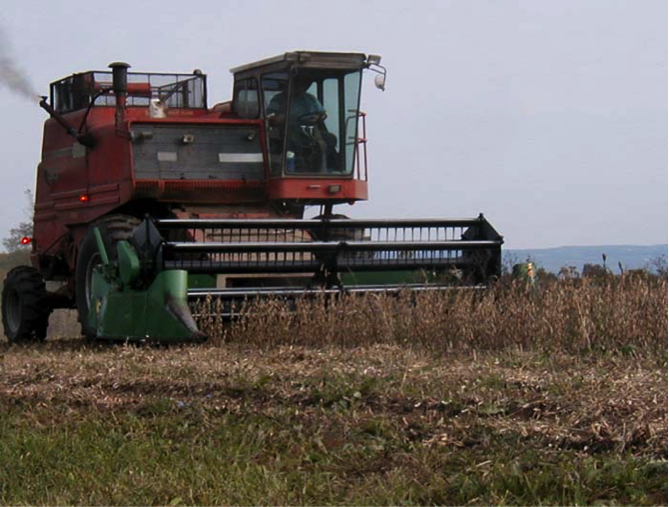
Additional Reading:
- "A Primer on Community Food Systems” [271]: Read the Introduction, Community Food Systems, and Goals of Community Food Systems.
Knowledge Check: Food System Typologies
For each of the following concepts, give which of the three types of food systems it pertains to (global corporate, smallholder, local/alternative).
- Shareholders invest in food companies
- Fairtrade organizations link smallholders in Kenya to consumers in the U.K.
- A dairy farmer sells small lots of milk using weekly deliveries to a mid-size city in New Hampshire.
- Most supermarket items
- Very important in densely populated rural areas of the developing world e.g. Ethiopia, Peru.
- Buying butternut squash at the local farmers market.
- Large wheat fields near Ciudad Obregón, Mexico for export to processors in Mexico, United States, and Colombia.
Scoring your answers to the knowledge check:
Click for the answer.
- global corporate
- global alternative
- local community-based, alternative
- global corporate
- smallholder
- alternative community based
- global corporate
Challenges to Producers: Sustainability and "Poverty Traps"
Challenges to Producers: Sustainability and "Poverty Traps"
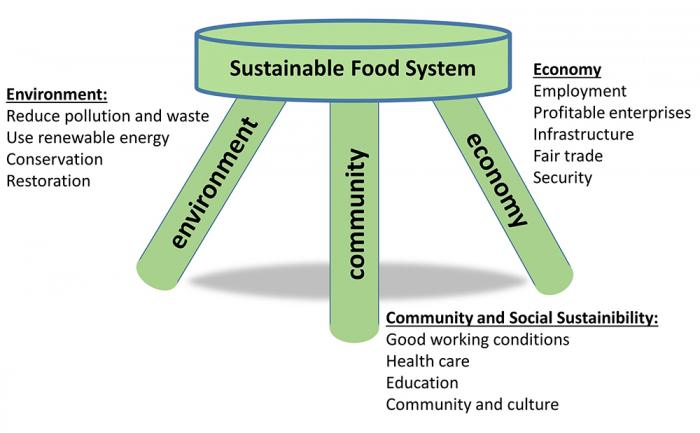
- Environment
- reduce pollution and waste
- use renewable energy
- conservation
- restoration
- Community (and social sustainability)
- good working conditions
- health care
- education
- community and culture
- Economy
- employment
- profitable enterprises
- infrastructure
- fair trade
- security
Challenges to Food Producers: The issue of scale and the “three-legged stool” of sustainability
The previous page on different variants of alternative food systems stressed different ways of analyzing and critiquing the modern global food system based on issues of sustainability. In your capstone projects, you are asked to propose ideas for sustainable food systems in your capstone regions. Therefore, in this page, we repeat from module one the concept of sustainability as a "three-legged stool" combining aspects of environmental, social, and economic sustainability (Fig. 10.1.15, also seen in module 1). We may be most used to thinking about Environmental Sustainability, for example in the need to conserve energy or recycle food containers to reduce pollution and energy generation by fossil fuels, as well as avoiding litter and saving on landfill space. As we presented in module 1, however, sustainability also contains economic or financial aspects devoted to employment, livelihood, and profitability, as well as the concept of social sustainability that embodies goals of social equity and more harmonious societies. Therefore, we are also interested in the nodes of food production such as farms because of the challenges to the economic sustainability of farm (and fishery) enterprises. It is important to think about economic sustainability because of the economic risks that food producers are exposed to. Economic risk is inherent in producing for local, regional and global food systems because producers may not be producing high-value products and must absorb environmental risk, for example from droughts, floods, or pests (see the previous modules, and module 11, next, regarding adaptive capacity). In a drought year, for example, selling vastly reduced yields of soybean or maize crops usually mean an economic loss for a farm because the price of these crops is not very high on the global or local market.
In addition, social sustainability concerns regarding food production are an important part of debates about modern society: for example, smallholder farmers, and laborers on larger farms and within fisheries in the United States and globally, are some of the most economically and politically marginalized populations in the world. Many researchers and advocates point out that food systems cannot be truly sustainable until they embody a more just distribution of resources and power. In this short section, we want to highlight two important concepts that link to these ideas of social sustainability and justice: first, the idea of “poverty traps” within smallholder farming around the world (see Carter and Barrett 2006, reference below), and on the next the threat posed to so-called “agriculture of the middle” in industrialized countries where pressures on producers lead either to a small-scale, niche markets orientation (e.g.. farmers markets) or an inexorable growth toward larger and larger farms that capture economies of scale in agriculture. By introducing these concepts now, you should see both how they fit into the analysis of vulnerability and resilience in the next module. You may be able to incorporate these challenges and potential solutions into your capstone region scenarios.
What is a poverty trap in smallholder agricultural systems?
As you’ve seen in the “pond-garden-livestock” (VAC) system of Vietnam in the video at the beginning of this module, agriculture practiced in smallholder food systems on small plots of land (less than 10 acres or 4 hectares, say) around the world is a hugely important and often quite sustainable enterprise. Smallholder agriculture can embody some of the most efficient use of resources in use today, whether these are traditional methods, well-adapted domesticated plants, new innovations taken up by smallholder families, or labor that is efficiently allocated by a family that is in constant contact with their enterprise and ecosystem. However, a concern about the most impoverished smallholders is that they can fall into what is called a poverty trap, where smallholders produce food from a degraded resource base, either because they have degraded it or because they have been forced to the margins of local society, and many times, both. The diversity of diets can also suffer when the least expensive food sources are local cereal and starch crops or calories coming from the globalized food system. The combination of poverty and degradation of soils and other resources does not permit these farmers sufficient income or well-being to invest in and therefore improve their soils or other aspects of local agroecosystems, and so it is likely that they, and their farm ecosystems, will remain in a low level of productivity and earnings. This is therefore called a poverty trap, and it essentially combines a lack of economic, social, and environmental sustainability for these smallholder households. It has also been linked to the concept of a downward spiral of poverty and soil degradation (Fig. 10.1.16).
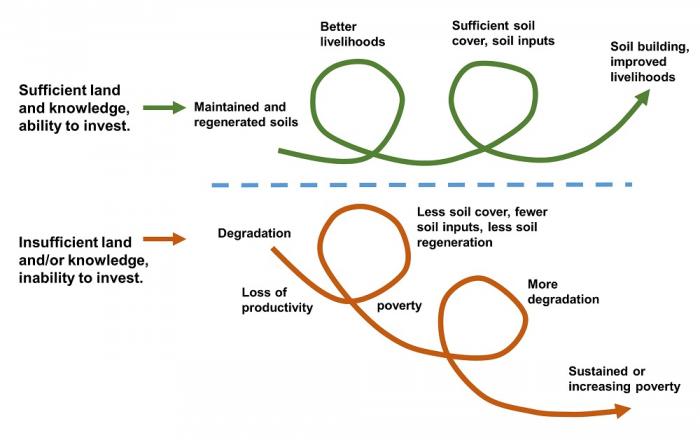
An example of this poverty trap "downward spiral" is furnished by the dust bowl of the 1930s in the United States, in the case of many families who farmed small plots of land during the depression. The combination of overexploited soils from decades of agricultural expansion after the U.S. civil war, a depressed economy contributing to overall hardship, and a multi-year drought led to a downward spiral in which many poor farmers were finally forced to leave their land and migrate to other areas of the country seeking employment and public assistance. In module 11, we'll examine further how combined human and natural system factors (like poverty and drought, for example) interact to create vulnerability for parts of human society, and ways that human systems have adapted to surviving such shocks and perturbations as drought. We'll include an example of a native American population that was relatively successful in weathering the Dust Bowl and was not subjected to this sort of poverty trap or downward spiral. Also, in the years after the dust bowl, the Soil Conservation Service of the United States Department of Agriculture (USDA) was highly active in helping farmers to transition to practices that helped to avoid soil erosion and aid in regeneration of degraded soils (see the additional reading resources below for this history of the Soil Conservation Service).
In current-day contexts where poverty traps represent a risk or chronic problem for small producers, then, both government agencies and development organizations focus on reducing barriers to practicing more sustainable agriculture. Development organizations include those called non-governmental organizations or NGOs, nonprofits, international aid organizations, as well as organizations founded by and managed by farmers themselves. For example, see the blog article below in "additional reading", regarding efforts to promote agroforestry in Haiti, where poverty and land degradation have long been intertwined. These organizations try to reduce barriers to investment in sustainable food production through the promotion of simple, low-cost strategies to conserve soils and raise crop diversity and productivity (see the previous modules for examples) that are within financial reach of smallholder producers. These technology options are optimally combined with credit and direct aid that helps farmers to overcome the resource barriers for investing in the protection of the natural systems that sustain their production. This sort of knowledge and technology, and the ability of farmers to invest in the productivity of their soils are an example of adaptive capacity, a concept that will a major topic of module 11. In addition, government, NGOs, and farmer organizations may also engage in political advocacy that seeks a more just distribution of land, credit, or access to markets that can help producers to avoid or move out of poverty traps.
Additional Reading:
- Carter, Michael R., and Christopher B. Barrett. "The economics of poverty traps and persistent poverty: An asset-based approach." The Journal of Development Studies 42.2 (2006): 178-199.
- Jacquet, Bruno: blog article, Agroforestry & Sustainable Land Management in Haiti [272], documenting efforts to promote agroforestry in Haiti with smallholder farmers.
- Natural Resource Conservation Service (USDA): web page giving a brief history of the dust bowl and the soil conservation service, which became the Natural Resource Conservation Service [273].
Challenges to Producers: Sustainability and "Agriculture of the Middle" in Globalized Food Systems
Challenges to Producers: Sustainability and "Agriculture of the Middle" in Globalized Food Systems
One of the characteristics of a globalized food system is that a smaller proportion of the population is needed to produce the large amounts of food for the global system. As a result, many analysts have noted shrinkage of the rural population in the rural United States over the last 100 years. Similar out-migrations from rural areas to cities have happened in Europe. Among other factors, this process has been hastened by the use of mechanization for agriculture (tractors, combine harvesters, mechanized crop processing, and transportation; we analyze the environmental impact of this in module 10.2). Mechanization and other factors mean that the cost of producing a bushel of corn, for example, and moving it into the global food system is cheaper when the scale of the farm and transportation infrastructure is larger. This phenomenon is referred to as economies of scale (recall also the example of dramatically scaled-up beef production in Greely, Colorado featured in the video of Module 1.2.) Farm producers in the United States and other industrialized economies thus often face pressures to grow their operations larger so that they can become more profitable, accentuated by competition against larger producers with lower prices, sometimes in other countries with lower labor prices.
These twin trends towards “get big or get out” and “get small for local markets” have left out a huge sector of farms that are mid-sized and that still generate a substantial amount of farm income in the U.S. economy and utilizing the lion’s share of cultivated soils (see figure 10.1.8 with pie-charts of earnings distributions different size farms in the United States). The analysis regarding this “Agriculture of the Middle” (Kirschenmann 2012) points out the threat posed to millions of farming households, most of whom produce for national and global commodity markets (e.g. soybeans, dairy). This analysis also points out that this sector of farms is vital as productive rural citizens that drive social organization, effective policy-making, and community values in most regions of the country. These mid-size farms are often leaders in the adoption of sustainable practices – especially when they are financially successful, illustrating potential linkages between financial and ecological sustainability. In any case, small and medium-sized farms have always played an important role in the maintenance of a rural landscape that most governments and citizens see as valuable. Agricultural landscapes and enterprises often contribute to the tourism value of a particular region, for example, the Pennsylvania Dutch region or wider presence of dairy farms in diverse, forested landscapes of Pennsylvania, or wine-producing regions of California and New York State.
The role of “Agriculture of the Middle” in sustaining rural life according to this analysis is worth protecting, and advocates of this analysis and action to support mid-size farm enterprises point out a few advantages these farms have in interacting with regional farm systems. When effective linkages can be built to regional markets, these farms usually combine production at a medium to large scale (compared to small diversified farms supplying farmers’ markets, say) with a flexible outlook that can allow them to change products and markets quickly, and best adopt sustainable production methods in a way that is visible to consumers and local communities (Kirschenmann 2012). As in the case of poverty traps for small farms discussed above, organizations that promote agriculture of the middle seek to clear barriers to these mid-sized producers. Note also that these “mid-sized” producers are enormous compared to farms in smallholder contexts throughout the developing world, though they are community members in an equivalent way to the role of smallholders in a rural third-world context). Mid-size producers and the food distribution organization that work with them may seek to promote “values-based food supply chains” where not just the commodity value of a food product is taken into account but also the value of a farm that demonstrates environmental sustainability and positive participation in rural communities. For example, many agricultural states now have state-level marketing efforts that promote state and regional agriculture, and these programs increasingly integrate ideas that help to promote mid-sized producers. Farmers, distribution network companies, and food markets have also banded together in different configurations to form networks that seek to support not only food availability for consumers but environmental, social, and economic sustainability along the entire food chain. Some examples of these are the Organic Valley dairy cooperative which now operates across the entire United States, the Red Tomato regional fruit and vegetable marketing effort in New England, U.S.A. (see Fig. 10.1.17 and 10.1.18), or the Country Natural Beef producers in the Northwest United States.
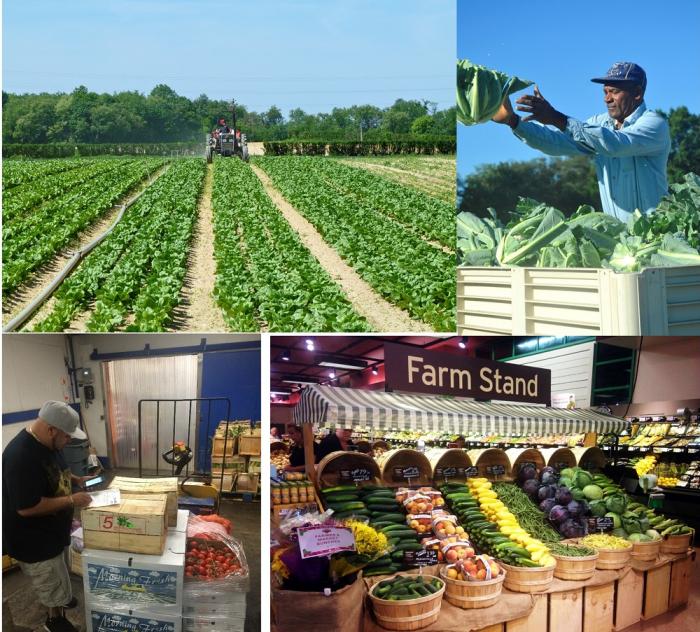
More Information on Values-Based Food Supply Chains
You can view a PowerPoint slide set introducing nine case studies on values-based food supply chains like the ones described above: "Agriculture of the Middle" [274], a research and education effort of the University of Wisconsin.
Integration into the Capstone Project
As you consider the food system of your capstone region, you may want to incorporate references to efforts that support either smallholder farmers in avoiding poverty traps or encourage continued participation of “Agriculture of the Middle” in the regional food system. The formative assessment for this module asks you to address whether you think there are concerns about poverty traps or agriculture of the middle in your capstone region. As you develop your capstone project final scenarios for sustainability, you may want to search on the internet for resources on regional food chains and food systems, as well as local farmers' markets and other initiatives, within your region of interest.
Food Systems as Coupled Natural-Human Systems
Food Systems as Coupled Natural-Human Systems
As you saw in the introductory video about a food system in Vietnam, food systems incorporate both natural and human components. In fact, because of the ubiquitous need for food, food systems are among the most important ways that human societies interact with the physical and biological elements and processes on earth's surface. Land used in some way for food production already occupies over two-thirds of the ice-free land surface (Ellis, 2011 or similar on anthromes) and the trend is for this proportion as well as for the intensity (roughly, the production from each unit of land area) to increase. Human fisheries and other forms of food production from oceans (for example, kelp farming) are also tending to exploit wider and wider areas. In addition, as seen in the multiple types of food systems presented above in section II of this unit, the interactions of human societies with earth's ecosystems in food production is not governed by a single human process but depends greatly on human priorities, land management and food production knowledge, rationales and prescriptive goals for food systems, and government policies that regulate and reward food system outcomes. Understanding these societal factors is key to improving the sustainability of food systems in their impact on the earth's ecosystems.
To understand the interaction of human societies with the earth's surface, a common and productive framework is that of coupled natural-human systems [Liu et al., 2007]. These start from a relatively simple diagram (Fig. 8.9), in which a generic human system (e.g. a community within a human society) interacts with a generic natural system (e.g. a farming-dominated landscape within a production region). The framework also recognizes that natural and human systems have many internal interactions and processes such as biogeochemical nutrient cycling (e.g. the nitrogen cycle, see unit N.N in this course) or the policies, corporate actors, and markets determining food supply chains (a human factor).
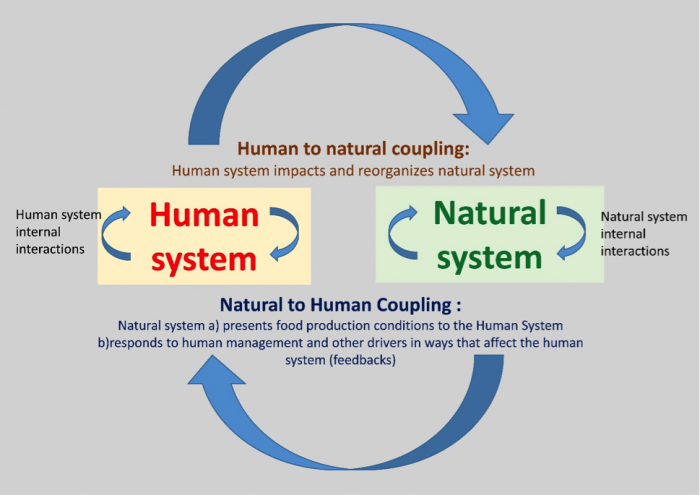
Generic Natural-Human system that can be applied to the food system in its interactions with earth system processes
Arrows labeled human to natural coupling and natural to human coupling form a circle between human system and natural system. Those are defined as follows:
Human system: human system internal interactions
Human to natural coupling: Human system impacts and reorganizes natural system
Natural System: natural system internal interactions
Natural to human coupling: Natural system a)presents food production conditions to the Human System b) responds to human management and other drivers in ways that affect the human system (feedbacks)
So, for example, in the video that you watched on the food system from the Red River delta in Vietnam, the river delta is the initial, broad natural system context that presents opportunities for farming, livestock production, and aquaculture to farming households and national/local government policies. Human farming/aquaculture knowledge and practices, markets and government policies are part of a human system that impacts and reorganizes the natural system over time into its current state. Over time the natural system internal interactions and processes may also change, for example, increases or decreases in soil fertility, crop pests, or animal diseases. Because of the evolution over time of the system, it is useful to reorganize the coupled natural-human system as evolving over time (Fig. 8.10).
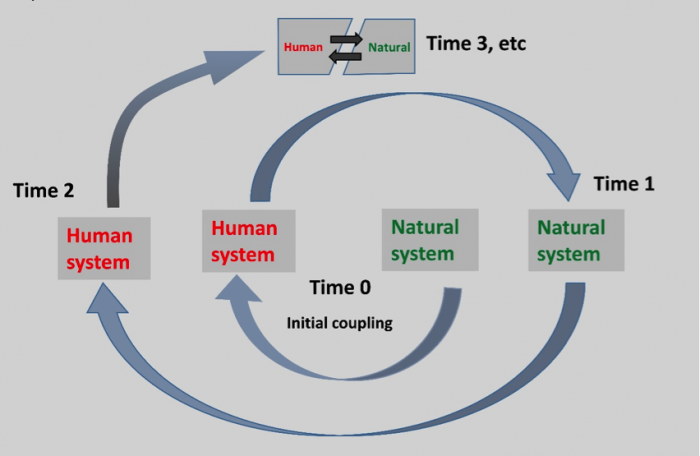
Divergence and Transition of Food Systems: Human-Natural Interactions
Divergence and Transition of Food Systems: Human-Natural Interactions
Overlap and Transition in Food Systems
As a final observation about ourselves as consumers within different food system types, it is important to stress that most consumers and households participate in multiple types of food systems at once. For example, someone in a modern society might consume a breakfast energy bar with globally sourced processed ingredients, along with a fair-trade certified cup of coffee and regionally sourced milk, on the way to picking up sweet corn at a direct-marketing farm stand of a local farmer. In addition, and of special importance for thinking about sustainable scenarios for your capstone project, it is important to find explanations of how transitions occur in food systems from one type of predominant system, to the inclusion of alternatives, or in some cases a wholesale change from one food system type another.
Human-Natural Interactions as Drivers of Food System Variation and Transitions
Recall that in Module two we presented the broad strokes of the history of food systems, from prehistoric times to the modern-day, including the globalized and local-regional variants of alternative food systems that were featured on the previous page of this module. In module two, we presented the idea of drivers and feedbacks that have caused large changes in the environment-food relations over human history (for example, from hunting and gathering to agriculture). In this final page of module 10.1 we want to develop concepts that constitute Coupled Human-Natural Systems explanations or "ways of seeing" that can help to understand two different processes:
- The way that two different and parallel food systems can exist in the same place, based on divergence from a common origin
- The transition from one food system type to another, considering the three major types of food systems and the different variants of alternative food systems.
Both of these ways of seeing may be useful in understanding proposals for sustainable food systems, as well as the issues of resilience and vulnerability of food systems presented in the next module.
Regarding process (1) above, The fact that food systems develop over time due to the interactions of human and natural systems means that different food systems can develop in the same natural system environment. For example, the same environment or natural system can support either a smallholder type of food system (small plots, less mechanization, local consumption) or a global corporate food system (larger land sizes, more mechanization and industrially-produced soil inputs, global distribution and consumption). It can also support a mosaic of the two types. This overlay of two types is in fact fairly common: for example, smallholder agriculture on smaller plots for mixed home and regional consumption coexists in Central America with the export agriculture of major food commodities such as bananas or vegetables, and often involves marginalization of smallholders to smaller landholdings in less productive and more difficult to manage soils. This mosaic of food system types is also increasingly true in Southeast Asia as globalized agriculture for cassava and maize production for export to China as well as domestic consumption coexists with more traditional smallholder agriculture as portrayed in the Vietnamese "VAC" system in the introductory video for this module. Figure 10.1.19 shows how two parallel food systems can develop in the same environment according to the Coupled Human-Natural System diagram we have seen at other points in the course. Starting at "time 0" in the middle we can see how an initial food system type might develop via human system management (e.g., the smallholder system in the Central American or Southeast Asian case). At "time 1", meanwhile, differences in the human system (say marginalization of smallholders to certain environments, investment in industrial farming in other environments) have created two divergent food system types. These divergent types then develop on their own through times two and three, and into the future, incorporating interactions between human and natural systems that embody the issues of social, financial, and environmental sustainability. As we can see by the Central American and Southeast Asian examples, this parallel trajectory of two different food system types is highly relevant, since it represents exactly what has happened in developing countries that seek to industrialize their agricultural sectors but retain a large rural population practicing smallholder agriculture, often in more marginal regions with greater heterogeneity of environments (e.g. mountainous areas of Central and South America, mosaics of large export-oriented farms alongside smallholder agriculture in South and Southeast Asia as well as Eastern and Southern Africa)
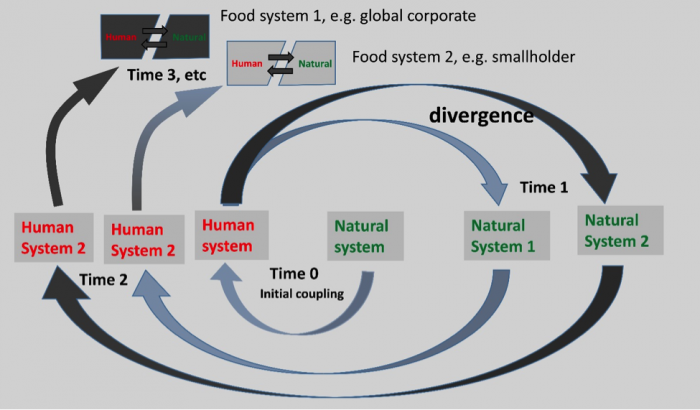
Regarding the transition from one food system type to another (process 2 as listed above), the CNHS diagram (figure 10.1.20 below) can help to understand these transitions. As an example, we'll use the transition to alternative food systems from the globalized industrial food system we described in module two and again in this module. In figure 10.1.19, between the "initial coupling" point at center and "Time 1", expansion of a dominant food system begins to create strains on both the natural and the human components of the system. In the case of the globalized industrial food system that emerged in developed countries (sometimes called the global north) after World War II, this system eventually created strains in the natural and human systems and a critique responding to the unintended consequences of the expansion of this industrial and globalized model. You'll recognize these strains and critique as the same issues of sustainability discussed in the previous modules:, "diseases of affluence" from poor nutrition, food insecurity, concerns about water use and the water footprint of food, soil degradation, pest and weed resistance to pesticide and herbicide management, and others. Between Time 1 and Time 2, the human society thus receives signals from the interactions and drivers within the coupled system, and then responds, in the form of a wide range of new policies and "models" of the new system that emerge during Time 3. In some cases, these responses are modest, for example, a new regulation on fertilizer or pesticide application to moderate the unintended negative consequences. In other cases, the responses are more dramatic and become the alternative food system types described in this module, both global and community-based. These different variants of the transition may increasingly create aspects of a "complete" food system, e.g. production, distribution, and consumption pathways in an integrated whole, as compared to their initial state as outliers, regulations, or policy proposals. Through different drivers and feedbacks from the natural and human sub-systems, a transition to new food system types occurs. These new types often coexist with a more dominant food system, which is certainly the case with the coexistence of alternative food systems in the present day with the still-dominant global corporate food system.
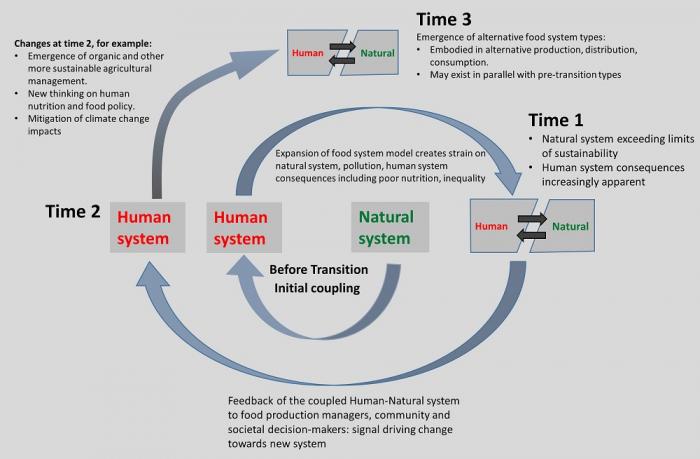
Module 10.2: Assessing Food System Impacts on Natural Systems and Sustainability
Module 10.2: Assessing Food System Impacts on Natural Systems and Sustainability
Introduction
What are the impacts of Food Systems on the Natural Systems that support our food production? You will learn about system-level impacts and impact assessment in module 10.2. You have already considered many of these impacts on the environment in earlier modules, for example, plant domestication, nutrient cycling, water use, and water pollution. You will learn about assessing impacts that emerge from the behavior of a whole food system, and practice life cycle assessment (LCA), one method used for assessing whole-system impacts.
Earth System Impacts and Energy Use by the Food System
Earth System Impacts and Energy Use by the Food System
Human System Impacts on the Environment Within Food Systems
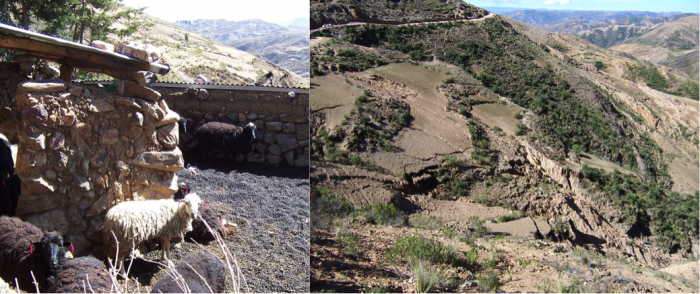
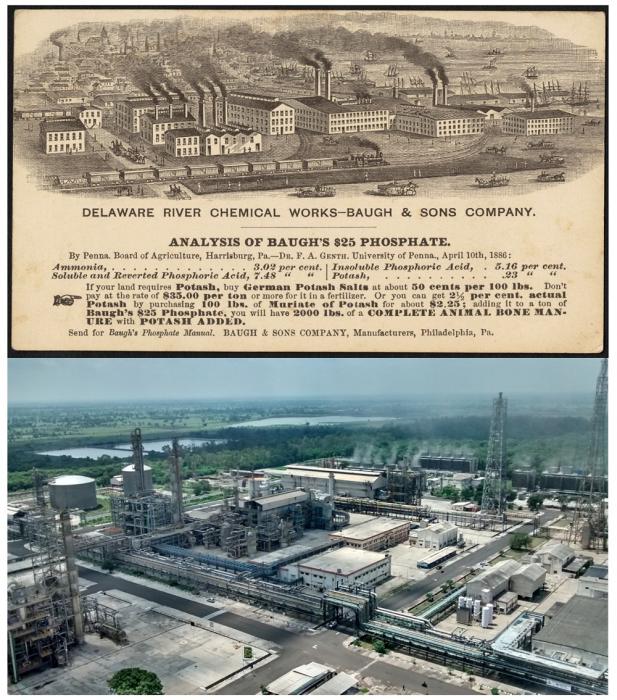
In modules one and two of this course, and most recently in this module, we represent food systems as coupled human-natural systems. Throughout the course, we have tried to emphasize the dramatic impacts that human food production has had and continues to have on earth's natural systems. Here are some examples from previous modules:
- Changing river basins to create irrigation systems
- Exposing soils to greater rates of erosion, and stabilizing some soils against erosion
- Domestication and development of new crop types, including transgenic engineering of new crop traits in the recent past
- Contributions of agriculture to greenhouse gas emissions that are warming planet earth and leading to climate change
Different types of food systems – global, smallholder, and alternative, as we summarized in module 10.1 -- may all impact the earth's natural systems in a different way and to different degrees. You may recognize on the short list of examples above that the impacts from these changes and the creation of agroecosystems by humans may have both positive and negative aspects. For example, irrigation and crop breeding both have as objectives increasing the productive potential of crops. They may carry other unforeseen consequences, such as depletion and collapse of water resources, changes in the dietary quality of food with domestication and breeding, and greater use of herbicides in the case of Roundup-ready crops. These human system actions within the food system improve production can be seen as the initial driving arrow as part of a human-natural system coupling (Fig. 10.2.3) and generally involve management, reorganization of the ecosystem, and energy and nutrient inputs (e.g. the use of fossil fuels to create fertilizers). The natural system then responds with positive and negative impacts on productivity and other natural system processes, which can include positive and negative consequences. These consequences eventually determine the level of sustainability of the food system. The massive extent of food systems and food production globally, within different types of food systems, translates into a large effect, or leverage, on the sustainability of human societies. To promote the sustainability of food systems, we must understand how food systems as a whole affect measures of sustainability. In this unit, we will first refer to the different human system impacts on natural systems, and then allow you to practice life-cycle assessment (LCA) to compare the energy use of two food production systems in the Andes and North America.
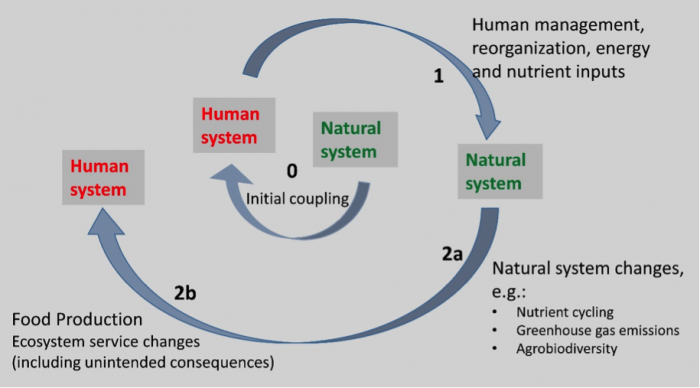
Life Cycle Assessment (LCA): Measuring the Impacts of Systems in Multi-part Processes
Life Cycle Assessment (LCA): Measuring the Impacts of Systems in Multi-part Processes
Life Cycle Assessments
Life cycle assessments or life cycle analyses (LCAs) are defined as “a tool to analyze the potential environmental impacts of products at all stages in their life cycle” (International Standards Organization). Analogous to the food supply chain activity you completed in module 10.1, LCAs follow products (foods and otherwise) from production, through transport and assembly steps, to the consumption or operation of the product, and in some cases even its disposal. In contrast to the supply chain descriptions in module 10.1, at each of these stages of production, transport, consumption, and disposal, LCAs keep a running total of environmental costs or impacts of the product. Common impacts that are tracked by LCAs across product life cycles are greenhouse gas emissions, water pollution impacts, and energy use. As such LCAs are a key tool in analyzing the impacts of human on natural earth surface systems within the coupled natural-human food system (Fig. 10.2.3). LCAs require some careful thinking about where to draw the boundaries of the system for considering the life cycle of a product. For example, an LCA devoted to carrots would probably include the energy required to operate the refrigerated truck used to transport the carrots but not the energy needed to make the truck. Also, many LCAs are “cradle to grave” and include both impacts of all raw materials used in production as well as disposal impacts for the product, but some do not focus on the entire life cycle and assess other segments of the lifecycle such as “cradle to farm-gate” or “cradle to plate” in the case of food products.
Life cycle analyses are an excellent way of putting into practice a geosciences "habit of mind" of using systems thinking. Because food systems are complex, we think about a way to measure its performance and then explore all the linkages in the system within that single metric or measurement parameter (see module 1.2 for a discussion of complex systems behavior). That is, we don't content ourselves with just thinking about a crop plant in a field, the entire farm field, or the highway where foods are transported; we go several levels up to measure impacts along the entire pathway or web of interacting system parts. Along the way, it is likely that we will start to think in new ways about the linkages between parts of the system, about the most important contributions to impact, or about previously hidden factors or unexpected outcomes that explain the performance of the system.
Required Reading
National Center for Appropriate Technology (NCAT): Life Cycle Assessment of Agricultural Systems [264], pp. 1-3 and figure 3 for light bulb LCA on page 9.
You'll notice that the presentation of compact fluorescent light bulbs is somewhat dated since there has now been a big move to LED light bulbs that are further reducing energy usage for lighting. We continue to feature this presentation of LCA from the NCAT because it is one of the better non-technical introductions to the subject and also relates LCA concepts to agriculture. See the resources below if you want to read more about LCAs, including a detailed PowerPoint comparing different types of light bulbs.
Additional Reading on LCAs (optional)
- Colin Sage's book, Environment, and Food, pp. 167-172, Chapter 5, Final foods and their consequences. You may remember that the first few pages of this book were assigned as a reading in module 1.1. This document may be available through your E-Reserve System.
- A PowerPoint comparison of light bulbs to complement the reading from NCAT above, H. Dillon and C. Ross: "Updating the LED Life-Cycle Assessment [275]".
- A video of a "six-minute crash course, LCA 6 minute crash course Life cycle thinking and sustainability in design [276], by Leyla Acarogluintroducing.
Using LCAs, Part One: Comparing Costs and Impacts
Using LCAs, Part One: Comparing Costs and Impacts
Life cycle assessments are often used in two important ways. The first is to compare the costs or impacts of different products or production systems in a rigorous way, seen in Fig. 10.2.4 which compares the phosphorus water pollution resulting from three ways of producing pork meat in France (Basset-Mens and Van Der Werf, 2005). This “cradle to farm-gate” pork LCA includes the cropping used to produced pig feed as well as the animal raising methods at pig farms that use three different standard methods. In this example, two different ways of expressing LCA results show how different messages can emerge depending on how results are presented. The graph at left shows the impacts at a per-area of land used basis (per hectare), while the graph at right expresses the impact as a per-kg of food produced, which means that if a production method yields more on a per-area basis, its impact can be reduced compared to one with less productivity per hectare. Organic and red-label humane methods with straw-bedded barns pollute less on a per-hectare basis, but the organic methods are not less polluting than the conventional treatments on a per-kg of pig basis because more area is needed to both raise the pigs and grow the crops for feed in the organic system. Therefore if demand (in kg pork) remains the same for pigs while consumers switch from conventional to organic pork, total water pollution from phosphorus in pig production is unlikely to decline, at least according to this study. Rather, the red-label option seems to be able to shrink pollution per kg of pork consumed in the food system. Meanwhile, if you limited your viewpoint to a single watershed with a delimited area, you would say that both the red-label and organic methods reduce pollution. Despite some of the benefits of organic management generally, in reducing toxins in the environment and building soil quality (for example), this study can give us some pause in thinking about the particular system we are talking about (e.g. organic hog production versus organic apple production, for example) and the need to respect specific case analyses and the measures used in LCA analysis. When we talk about a whole food system, it may be best to employ a per-kg of food produced approach.
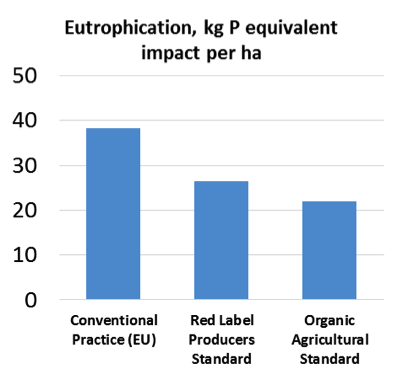
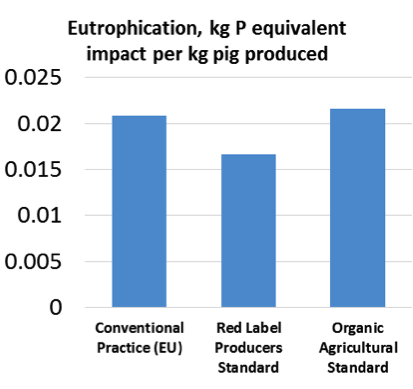
Using LCAs, Part Two: Assessing Hot Spots
Using LCAs, Part Two: Assessing Hot Spots
The second main way of using LCA is to assess which steps or process inputs in the production, consumption, and disposal of a product are most responsible for human negative impacts of practices. These “hot spots” in the analysis can then be the focus for better measurement to confirm the findings of the LCA and/or innovations in practices that eliminate these practices or limit their impact. One type of LCA uses the common measure of external energy inputs for food production (i.e., those not related to solar energy that is used by plants "for free") to analyze one aspect of the sustainability of food production. These energy inputs are visualized in Figure 10.2.5.
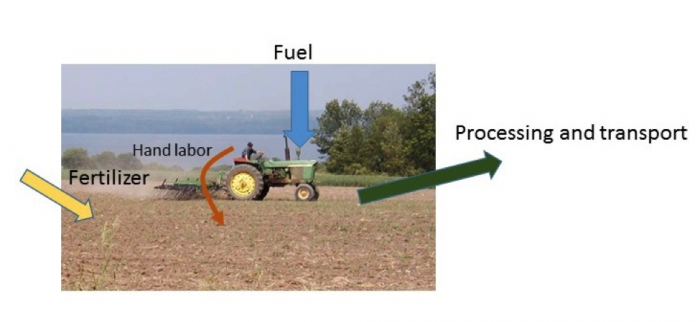
Dissecting an LCA
An LCA for energy use is illustrated below in Fig. 10.2.6 which shows the comparison of total energy used in different crop production practices in a long-term trial of farming practices in Switzerland. This graph shows the energy used in food production in two formats: stacked colored bars as kilowatt-hours (kWh) energy equivalent per land area under production (i.e. per Ha or 100 x 100 m area) of food production, and also as a total watt-hours (Wh) per kg of food produced (dark green lines and points above the stacked bars).
It's worth considering these results and the units used in more detail. First, for comparison, a typical U.S. home uses about 72 kWh per day for heating, cooling, and electricity, if we boil all these energy uses down to one energy equivalent* (calculations based on the U.S. Energy Information Administration, 2009 data [277]). Some further "ballpark" or rough calculations allow us to see that the fertilizer-based system (bar at right) uses a total of about 100 days of mean household energy**to produce food on one hectare in a year (per year), while the organic system (bar at left) uses a little over half this amount of energy. Meanwhile, if we express this daily household energy use as the energy used for food per kg of food, the 72 kWh become 94 kg of food in the fertilizer-based case at right, and 144 kg of food in the organic management case at left ***. Expressing LCA results as energy per land area and energy per kg food produced are common approaches, analogous to the pollution impact analysis on the previous page. In the summative assessment on the next page, you will use an LCA to calculate energy inputs per kg of potato production in two systems.
* That is the amount of heat and light given off by 30 100-watt light bulbs burning for 24 hours.
** That is, about 7200 kWh (height of rightmost split bar on the left axis showing energy use per hectare), divided by about 72 kWh household use per day, which is equal to 100 days.
*** Dividing 72 kWh by the energy amounts per kg from the green point+line data above the stacked bars, e.g. 72 kWh / 0.77 kWh per kg or 93 kg food for the fertilizer based-case, and 72 kWh / 0.50 kWh per kg, or 144 kg of food, for the organic case.
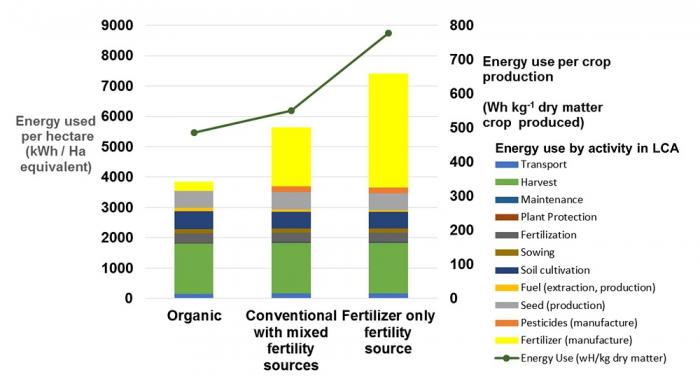
Fertilizer Use as a "Hot Spot" in the Analysis
Two additional observations: first, in this LCA there emerged large differences in energy use that have to do almost completely with the energy used to produce chemical fertilizer, especially of nitrogen fertilizers like those produced in the large fertilizer plant in India shown in Fig. 10.2.2. Energy inputs to fertilizer production are especially high for nitrogen fertilizer because it takes a great deal of energy to fix inert nitrogen in the atmosphere (N2) into reactive forms like ammonium and nitrate that can be easily taken up by crops (see module 5 and other previous modules). Fertilizer use emerges as a "hot spot" in this analysis and might prompt managers or policymakers to work towards reducing fertilizer use by incorporating aspects of the organic and manure-based system into the more conventional, fertilizer-based system. Many energy inputs in agriculture, such as these fertilizer inputs or tractor fuel that are tallied in the LCA above, are important to consider because they represent non-renewable fossil fuel energy sources that contribute to greenhouse gas emissions and anthropogenic climate change through the release of carbon dioxide. The LCA thus helps to measure natural system impacts and sustainability of food systems. Second, this LCA used energy as a yardstick to measure the impact of food production. As we will note for your summative assessment, such an LCA using energy inputs is only ONE measure of sustainability, and may not capture other measures of sustainability, like forest clearing needed to establish agroecosystems, runoff of nutrients that contribute to dead zones, pesticide effects on beneficial insects like pollinators, or whether farming practices provide sustained income and other livelihoods to farmers. As an example of using a different yardstick for LCAs, consider the emissions of greenhouse gases (GHG) by different pork production systems on the previous page, in which the organic management system, in fact, had higher potential to pollute waterways with phosphorus runoff per kg of pork produced, than either conventional or "best practices" red label standard in the European Union. This result contrasts with the favorable result shown on this page for organic management when energy inputs were used as a yardstick.
Knowledge Check: Earth System Impacts and Life Cycle Analysis
Question 1 - Short Answer on types of impacts from food system activities
One of the skills involved in building life-cycle analyses is the ability to conceptualize all the different impacts on natural systems related to the different functions of production, transport, and consumption of a product. The activities give below in each question form a part of the functioning of food systems. Identify an impact or impacts on the natural system (e.g. soil erosion, air pollution, water pollution) that would most likely result from these activities, based on the material in this module and previous modules. Then check your answers by clicking on "click for answer" as a review.
Transporting food by ship and truck:
Click for answer.
greenhouse gas emissions from burning fuel, other air pollution from burning fuel
Applying manure to soils:
Click for answer.
water pollution from nitrogen and phosphorus drainage and runoff if over-applied, and no measures in place to retain nutrients in soils (cover crops, riparian barriers that keep nutrients out of waterways). Greenhouse gases, especially N2O, will be emitted if manures are applied on waterlogged soils, and methane as a greenhouse gas is associated with the animal production (especially cows) used to produce the manure.
Applying fertilizer to soils:
Click for answer.
greenhouse gases because of fertilizer manufacturing, greenhouse gas due to denitrification and N20 emission, water pollution if over-applied as in the case of manure above.
Tillage of soils:
Click for answer.
if practiced irresponsibly, soil erosion; siltation of waterways; greenhouse gas emission from mechanized tillage with tractors; emission of carbon as carbon dioxide that was once part of organic matter in soils.
Pesticide and herbicide application:
Click for answer.
toxicity to organisms in the environment, e.g. honey bees, other beneficial insects and water pollution; evolving resistance of pests and weeds, greenhouse gas emissions from manufacture, transport to farms, and application with tractors
Question 2 - Short Answer
As preparation for doing your own life-cycle analysis, make a list of all of the energy needs you can think of that go into both manufacturing and operating a car. You may want to also refer to the NCAT/ATTRA required reading to review an example life cycle analysis:
Click for answer.
mining and refining metal ore to make steel, refining oil and synthetic production of plastics and paint, energy for water supply to all manner of production processes, burning gasoline or diesel in the engine for running the car, etc.
Summative Assessment: Life Cycle Assessment (LCA) of Energy Use in Potato Production in Smallholder Andean and North American Production Systems
Summative Assessment: Life Cycle Assessment (LCA) of Energy Use in Potato Production in Smallholder Andean and North American Production Systems
Instructions
This assignment has been broken down into three steps. First, you need to understand the LCA Spreadsheet, next you will need to complete the spreadsheet and finally you will complete the Summative Assessment Worksheet using the results of the completed spreadsheet. Please read all of the instructions very carefully. They are presented in the next three pages.
Files to Download
Energy Input LCA Activity Spreadsheet [279]
Summative Assessment Worksheet [280]
Submitting Your Assignment
Please complete the Module 10 Summative Assessment in Canvas.
Step 1: Description of the LCA Exercise
Step 1: Description of the LCA Exercise
Instructions for Filling in the LCA Spreadsheet
- If you haven't already done so, download the Energy Input LCA Activity Spreadsheet [281], which includes an excel spreadsheet with embedded calculations that will carry out some of the calculations in the LCA, and also a copy of the data table below.
- In a step-by-step fashion, the spreadsheet asks you to use data given in tables on the next page to calculate the total energy needed to produce and ship potatoes in two contrasting food system types: a smallholder agricultural system in Peru and an industrialized system like those in New York, Pennsylvania, Michigan, or Colorado, USA. See Fig. 10.2.5 (previous pages) for a simple view of the flows that will be accounted for in the LCA.
- To translate the energy usage into an understandable form, the energy results from the LCA are given in gallons of gasoline-equivalent, which is a “yardstick” of energy usage (for learners outside the United States, multiply by 3.8 for liters of gasoline). This is similar to the use of kilowatt-hours of electricity (kWh) as an energy yardstick for the LCA on production practices in Europe, two pages ago.
- The results we will calculate will be in gallons of gasoline equivalent per land area (per hectare or Ha, equal to a 100 by 100-meter area), and also per 1000 kg (metric ton) of potatoes (a metric ton is slightly more than a standard U.S. ton or 2000 lbs.)
- Detailed instructions for filling in the excel table appear on the following page. You will first fill in the excel table in the cells labeled as 1.1, 1.2, etc. for the smallholder system in the Andean region of South America, where yields are generally lower and satisfy the needs of households and local markets (a smallholder food system).
- You will then continue filling in the energy inputs for the United States-based industrial system for the excel cells labeled 2.1 through 2.17
- Note that to make the exercise easier, a few values in the excel sheet have been filled in for you. Also, greyed-in cells in the excel table will fill automatically by summing the blank cells once these have been filled in.
- After filling in both sides of the excel table carefully and checking, you will answer questions regarding the LCA on the page for step three, to complete the summative assessment.
Now, move to the next online page to start filling in the spreadsheet to complete this activity.
Step 2: Complete the Excel Spreadsheet
Step 2: Complete the Excel Spreadsheet
Instructions
Read the table below very carefully and follow the instructions to complete the spreadsheet (see the previous page for spreadsheet download) using the Gallon Gasoline Equivalents per Hectare given in table 10.2.1 below.
Instructions for lines 1.1 to 1.15 of Excel table. This is for potatoes produced in the Andean smallholder agriculture system.
The table below provides instructions for filling in the data needed for the LCA of energy use by Andean smallholder agriculture based on the agricultural practices in these systems. You will need the table of values for the two different systems (see table 10.2.1 below, see link below to download or use the online version)
| Line Number in Excel Table | What to enter into the spreadsheet -- you are entering 'Gallon Gasoline Equivalents' of energy |
|---|---|
| A.1 | Look up the smallholder tillage energy value (LEFT side of table 10.2.1 below) in the table and enter it. |
| A.2 | Look up the smallholder hand labor energy value on the LEFT side of table 10.2.1 below and enter it -- it is considerable because many operations like weeding and hilling up potatoes to make them yield better are done by hand. |
| A.3 | Manure energy is not counted as it is a by-product of other animal uses on the farm such as meat, wool, and traction uses, so enter zero. |
| A.4 | Irrigation - as explained on the right side of table 2, this does not use energy even when it is used, because it is usually gravity-fed. |
| A.5 & A.6 | This value has been entered to simplify the exercise, but please read this explanation: small amounts of fertilizers are used by smallholders, so use a value of 10 kg per Ha of nitrogen (N) and phosphorus (P) in fertilizers. The values in the table happen to be given just "per 10 kg of nutrient", so we have multiplied the figure in the table (4.9 gallons gasoline per 10 kg N) by 10 kg, which gives 4.9 gallons gasoline and 1.0 gallons of gasoline for N and P respectively. These are already filled in. |
| A.7 | Potassium fertilizer is not used, so enter zero. |
| A.8 | Energy is required to produce seed, in essence, the energy value from this LCA for the preceding crop multiplied by the seeding rate of potatoes. Enter this value into the excel table. |
| A.9 | Fungicide might be one chemical input that would be used in the Andes by smallholders to combat late blight and other common potato diseases, so we include it here. Enter the value shown in the table into your LCA excel table. |
| A.10 | This cell is summed automatically. You do not need to enter anything, but you should note it for comparison and checking with other findings of the LCA. The energy inputs for all production activities are summed automatically by the spreadsheet, in gallons gasoline equivalent per Ha. At right it is also given per 1000 kg of potatoes produced, assuming a yield of 10,000 kg/ha fresh weight of potatoes which is a medium to good yield for smallholders in the Andes. |
| A.11 | This cell is summed automatically and you do not need to fill in. Here the energy inputs are summed as in A10 but representing ONLY those energy sources that represent fossil fuel inputs (e.g. fertilizer, fungicide) |
| A.12 | Transport distance. For smallholder systems in the Andes, about half the crop might be transported about 100 km as an average. Half the crop being sold is already factored into the calculations for energy used (A13). |
| A.13 | This cell is calculated automatically. The transport energy required to transport half the crop to market is calculated by the spreadsheet. The other half is assumed to stay on the farm for home consumption. |
| A.14 | This represents a total of energy inputs for production plus transport to market per land area (Ha); at right on line 13, it is given per kg of potato produced. |
| A.15 | This represents only the fossil fuel energy required for production plus transport |
When you have entered all the values for the smallholder system, you will see the LCA results for production only, and production plus transport summarized at right in column E of the Excel spreadsheet.
Instructions for lines 2.1 to 2.17 of the excel table, LCA for industrial agriculture:
Use the instructions below to fill in the second LCA for industrial agriculture:
| Line Number in Excel Table | What to enter into the Excel Table -- you are entering 'Gallon Gasoline Equivalents' of energy |
|---|---|
| B.1 | look up the industrial agriculture value for tillage energy value (RIGHT side of table 10.2.1 below) in the table and enter it. |
| B.2 | look up the industrial agriculture hand labor energy value in table 10.2.1, RIGHT side, and enter it (hand labor energy is very small because most operations have been mechanized) |
| B.3 | We assume manure is not used on these potato farms. They tend to be large farms and not necessarily close to sources of manure, so we have already entered zero here. |
| B.4 | Irrigation: Enter the value on the right side of the table if you wish to model the case of Colorado or other regions where potatoes are grown in dry climates. Otherwise, you should enter zero because we assume that potatoes use only rainfall, and energy is not required to irrigate them. |
| B.5 | Nitrogen fertilizer: 180 kg/ha of nitrogen is applied to potatoes. The value in the table below gives an energy value in gallons of gasoline per 10 kg of N, so you should calculate 180/10= 18 and multiply it by the value in the table, equal to 18 x 4.9 or 88.2 gallons gasoline. This value has been entered in the excel table, and you will use the phosphorus and potassium fertilizer energy equivalents to enter them. |
| B.6 | Repeat the process above for N fertilizer, but using the P fertilizer value from the table and 120 kg of P/Ha as the application rate of phosphorus to potatoes (remember to divide this P rate by 10) |
| B.7 |
Repeat the process above for N fertilizer, but using the K fertilizer value from the table and 200 kg of P/Ha as the application rate of phosphorus to potatoes (remember to divide this P rate by 10)
|
| B.8 | Energy is required to produce seed, in essence, the energy value from this LCA for the preceding crop multiplied by the seeding rate of potatoes. This value is 35.4 and has been entered into the excel table. |
| B.9 | Fungicide is applied to combat fungal diseases that are common in potato-growing regions, and ensure high yields that justify the relative expensiveness of growing in this intensively managed crop. |
| B.10 | Insecticide is used to manage insect pests of the crops. These have an energy cost of manufacture, transport, and driving through the field on a tractor to apply them. Enter the value from the right side of the table |
| B.11 | Herbicide is used to control weeds in the potato crop. These have an energy cost of manufacture, transport, and driving through the field to apply them. Enter the value from the right side of the table. |
| B.12 | This cell is summed automatically. You do not need to enter anything, but you should note it for comparison and checking with other findings of the LCA. The energy inputs for all production activities are summed automatically by the spreadsheet, in gallons gasoline equivalent per Ha. At right it is also given per 1000 kg of potatoes produced, assuming a yield of 10,000 kg/ha fresh weight of potatoes which is a medium to good yield for smallholders in the Andes. |
| B.13 | This cell is summed automatically and you do not need to fill in. Here the energy inputs are summed as in A10 but representing ONLY those energy sources that represent fossil fuel inputs (e.g. fertilizer, fungicide) |
| B.14 | Transport distance: For potatoes in New York or Michigan (examples of eastern states in the U.S.) choose 200 km. For potatoes in more remote Colorado, the mean transport distance is approximately 700 km (on average), so enter this in the excel table. The energy for transport is calculated automatically in the next cell below. |
| B.15 | This cell is calculated automatically as the energy needed to transport the entire crop to ma et, since this is exclusively a cash crop by contrast to the smallholder system. |
| B.16 | This represents a total of energy inputs for production plus transport to market per land area (Ha). To the right on row 33, it is given per kg of potato produced. |
| B.17 | This represents only the fossil fuel energy required for production plus transport |
Also, in the case of the industrial system, the yield that is present in the excel table is a good deal higher than that shown for the Andean system, at 35,000 kg potatoes per Ha. This can be traced to a number of factors: less limiting fertility provided by higher nutrient inputs, different varieties specialized for high yields as well as different globalized market characteristics in North America, reduced pest and weed pressure, and better overall quality of soil resources where potatoes are grown, which may include flatter, deeper, and better-drained soils.
| LCA Category | Smallholder agriculture system description | Energy input for smallholder agriculture, in Gallon Gasoline Per Hectare equivalents | Industrial agriculture description | Energy input for industrial agriculture, in Gallon Gasoline Per Hectare equivalents |
|---|---|---|---|---|
| 1.Tillage and field operations | Energy input of oxen for plowing | 16.1 | Tractor fuel use and other machinery energy use on-farm | 146 |
| 2. Hand labor | Driving traction animals and several hand operations (hilling, weeding, harvesting) | 6.4 | Human operation of machinery and occasional direct field operations | 0.05 |
| 3. Irrigation | Irrigation is usually gravity-based if used at all. | none | Choose this value ONLY if you decide to do an LCA for Colorado potato production - all other areas use zero irrigation. | 137 |
| 4. Nitrogen (N) fertilizer | Manufacture of N fertilizer per 10 kg fertilizer | 4.9 | Manufacture of N fertilizer per 10 kg fertilizer | 4.9 |
| 5. Phosphorus (P) fertilizer | Manufacture of P fertilizer per 10 kg fertilizer | 1.0 | Manufacture of P fertilizer per 10 kg fertilizer | 1.0 |
| 6. Potassium (K) fertilizer | Manufacture of P fertilizer per 10 kg fertilizer | 0.5 | Manufacture of P fertilizer per 10 kg fertilizer | 0.5 |
| 7. Seed | Energy embodied in seed production | 2.3 | Energy embodied in seed production (in an industrial system) | 35.4 |
| 8. Insecticide | none | -- | Energy embodied in insecticide production and application | 87.6 |
| 9. Herbicide | none | -- | Energy embodied in herbicide production and application | 58.5 |
| 10. Fungicide | Energy embodied in fungicide production | 12.7 | Energy embodied in fungicide production and application | 12.7 |
| 11. Electricity | none | -- | Electrical equipment and lighting for processing potatoes | 4.4 |
| 12. Transport |
Energy to transport half of one-hectare yield to wholesale market or processor (for e.g. 100 km distance) - this will be calculated by the spreadsheet.
|
7.8 |
Energy to transport the whole yield of industrially produced potatoes to market. |
72.2 |
Step 3: Discussion and Analysis
Step 3: Discussion and Analysis
Conclusions: Discussion and Completing the Summative Assessment Worksheet
If you have finished both LCA sections, congratulations! You have just learned the basics of a common analysis tool for complex systems such as coupled natural-human food systems.
Taking stock: For discussion: here are some items you may want to discuss in your groups and with the class.
- Module 10.2 has been devoted to summarizing natural systems impacts of the food system. In this LCA, why did we focus on energy use and fossil fuel energy use in particular? What specific impact on natural systems, does fossil fuel use create that evokes sustainability concerns?
- Within the particular measurement parameter or metric from question one, which system created less impact on the earth system per unit of food produced (note that there might be other ways to measure the systems with other conclusions, see question 4)?
- Which system yielded more potatoes per area? Does this make a difference to the conclusions regarding energy use and its contribution to sustainability? (think about in which units we expressed the results of the analysis)
- What are other measures of sustainability that could be applied to the two systems? Think about the other natural systems components presented in sections II and III of the course and in modules 10.1 and 10.2 (water, soil, etc.), or the concepts of social and economic/financial sustainability.
- What lessons from the smallholder system, could be applied to the industrial system, and vice-versa?
You will now complete an assignment based on the LCAs you have just conducted, to submit as the second part of your summative assessment, using a worksheet you will download below.
Files to Download
Summative Assessment Worksheet [280]
Submitting your Answers
Complete the Summative Assessment Worksheet short answer and paragraph responses, based on modules 10.1 and 10.2 and your responses on the Excel LCA Spreadsheet you just completed. Then complete the Module 10 Summative Assessment in Canvas.
Summary and Final Tasks
Summary
In the first part of Module 10, you learned about some of the formal concepts around food systems seen either as food production, transport, and consumption chains, and as types of coupled natural-human systems, and explored these concepts using real examples: food products as windows into production and transport chains, and food system examples from around the United States and the world. In the second part, module 10.2, you learned about and practiced a skill for measuring impacts of food production activities and other human processes on the environment: Life cycle analysis. These are vital tools that you can use to understand human-environmental linkages that pertain to food, one of the main goals of section III of this course.
Reminder - Complete all of the Module 10 tasks!
You have reached the end of Module 10! Double-check the to-do list on the Module 10 Roadmap [283] to make sure you have completed all of the activities listed there before you begin Module 11.
References and Further Reading
Altieri, M. A., Funes-Monzote, F. R., & Petersen, P. (2012). Agroecologically efficient agricultural systems for smallholder farmers: contributions to food sovereignty. Agronomy for Sustainable Development, 32(1), 1-13.
Cooper, J. M., Butler, G., & Leifert, C. (2011). Life cycle analysis of greenhouse gas emissions from organic and conventional food production systems, with and without bio-energy options. Njas-Wageningen Journal of Life Sciences, 58(3), 185-192.
Ericksen, P. J. (2008). Conceptualizing food systems for global environmental change research. Global Environmental Change, 18(1), 234-245
Food and Agriculture Organization of the United Nations (FAO). 1997. "Chapter 3: The food system and household food security” in Agriculture food and nutrition for Africa - A resource book for teachers of agriculture. Available at the document website of the United Nations Food and Agriculture Organization [9] (http://www.fao.org/docrep/w0078e/w0078e04.htm [26]).
Hinrichs, C. C. (2003). The practice and politics of food system localization.Journal of rural studies, 19(1), 33-45.
IFAD (International Fund for Agricultural Development): Investing in smallholder family agriculture for global food security and nutrition. IFAD -2015 Policy Brief 3, 2013.
Liu, J., Dietz, T., Carpenter, S. R., Folke, C., Alberti, M., Redman, C. L.,& Provencher, W. (2007). Coupled human and natural systems. AMBIO: A Journal of the Human Environment, 36(8), 639-649.
NCAT/ATTRA: Life Cycle Assessment of Agricultural Systems. Available at: https://attra.ncat.org/wp-content/uploads/2022/12/life_cycle_assessment.pdf [284]
Netting, R. M. (1993). Smallholders, householders: farm families and the ecology of intensive, sustainable agriculture. Stanford University Press.
P. Pinstrup Andersen and D. D. Watson. 2011. Toward a dynamic global food system”. In: Food Policy for Developing Countries: The Role of Government in Global, National and Local Food Systems, 1-25
Sage, Colin. 2011. “Final foods and their consequences” Ch. 5 in Environment & Food. Routledge, 2011.
Module 11: Human-Environment Interactions
Module 11: Human-Environment Interactions
Overview
Human-Environment Interactions: Resilience, Vulnerability, and Adaptive Capacity (RACV) of Food Systems
In Module 11, we focus on human-environment interactions in food systems under stress. Just as a human body does not persist in a constant state of perfect health, farms, fisheries and other components of food systems face adversity. These components must have sources of resilience and restoration to overcome these challenges. Shocks and perturbations from the natural world are a major negative coupling force from the natural systems to human societies and are sometimes compounded by problems and crises within societies. Such shocks are most evident where the natural world meets human management in production areas, and so Module 11.1 focuses on the resilience and vulnerability of agriculture. As a premier example of this, we build on the material from module 2 and learn about the way that humans’ manipulation of seeds and plant varieties has created agrobiodiversity. Agrobiodiversity, along with crop management techniques, make food production systems resilient or vulnerable to shocks and perturbations. In Module 11.2 we take up the theme of food access and food insecurity as a major example of vulnerability and an ongoing challenge for a significant proportion of humanity. Food insecurity also manifests as acute crises that carry the formal designation of famines. We will also study these since they are large-scale failures of the modern food system, which currently produces enough food for every person on earth. Just as health sciences and medicine are ways to improve and guarantee health for all persons, our hope is that by understanding vulnerability and resilience in food systems we can address food insecurity for all people as a facet of sustainable food systems. Addressing food insecurity is a serious consideration that you will contemplate in your capstone project.
Goals and Learning Objectives
Goals and Learning Objectives
Goals
- Describe the concepts of resilience, adaptive capacity, and vulnerability (RACV) in a food system.
- Explain food access and food insecurity as a key challenge to food systems.
- Appraise the value of human seed systems and agrobiodiversity as human system components that incorporate crops as natural components and foster resilience.
- Apply concepts of RACV to understand changes in seed systems and food production in examples.
- Analyze stresses and shocks from climate change and food system failure that lead to both gradual changes in food systems and acute crises such as famines.
Learning Objectives
After completing this module, students will be able to:
- Define the concepts of perturbations and shocks, resilience, adaptive capacity, and vulnerability in the context of agri-food systems.
- Define and describe agrobiodiversity within food production systems and changes in this agrobiodiversity over time.
- Define the concepts of food access, food security, food insecurity, malnutrition, and famine.
- Give examples of resilience, adaptive capacity, and vulnerability in food systems.
- Give examples of support systems for biodiversity in land use and food systems.
- Evaluate recent examples in land use and food systems of resilience, adaptive capacity, and vulnerability (RACV).
- Analyze an example of a recent famine and understand how multiple factors of vulnerability and shocks combine to create widespread conditions of food insecurity known as famines.
- Understand scales at which resilience and vulnerability come into play, including farm, community, regional, and international scales.
- Propose principles embodying RACV for incorporation into a proposal/scenario for an example food system (capstone project).
Assignments
Module 11 Roadmap
Please note that some portions of the Summative Assessment may need to be completed prior to class. Detailed instructions for completing the Summative Assessment will be provided in each module.
| Action | Assignment | Location |
|---|---|---|
| To Read |
|
|
| To Do |
|
|
Questions?
If you prefer to use email:
If you have any questions, please send them through Canvas e-mail. We will check daily to respond. If your question is one that is relevant to the entire class, we may respond to the entire class rather than individually.
If you prefer to use the discussion forums:
If you have any questions, please post them to the discussion forum in Canvas. We will check that discussion forum daily to respond. While you are there, feel free to post your own responses if you, too, are able to help out a classmate.
Module 11.1: Resilience, Adaptive Capacity, and Vulnerability (RACV): Agrobiodiversity and Seed Systems
Module 11.1: Resilience, Adaptive Capacity, and Vulnerability (RACV): Agrobiodiversity and Seed Systems
In this module, we consider resilience, adaptive capacity, and vulnerability (RACV) of food systems through the lens of agrobiodiversity and seed systems. We will build on the awareness of human-natural system interactions that was explored in module 10.2. In this module, we examine the way that shocks and perturbations affect human systems and the ways in which human systems have found to cope with these shocks that produce resilience within food systems. You will learn about agrobiodiversity at a crop and varietal level as an important case of adaptive capacity that provides resilience to shocks for food systems within different types of food systems (e.g. smallholder, globalized). You will apply this learning to examining RACV in a case study from the southwestern United States.
Perturbations and Shocks in Agri-Food Systems
Perturbations and Shocks in Agri-Food Systems
Perturbations and shocks are common in food systems and involve both the “natural system” components and the “human system” components in these systems. Throughout modules 11.1 and 11.2, we will use the word shocks and perturbations fairly interchangeably to refer to these negative events that challenge food systems and their proper function, although the word "shock" denotes a perturbation that is more sudden and potentially disastrous. Perturbations and shocks in “natural” components include dramatic changes in climate factors such as rainfall, as well as changes brought on by biological components such as disease and pest outbreaks that affect plants and livestock. Similarly, perturbations can occur within the “human system” components of a system. For instance, food prices are rarely entirely constant and farmers and consumers are said to face "price shocks" in the purchasing of food.
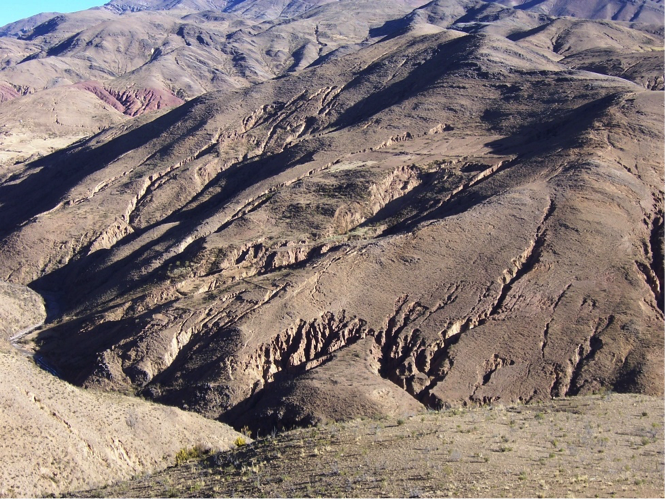
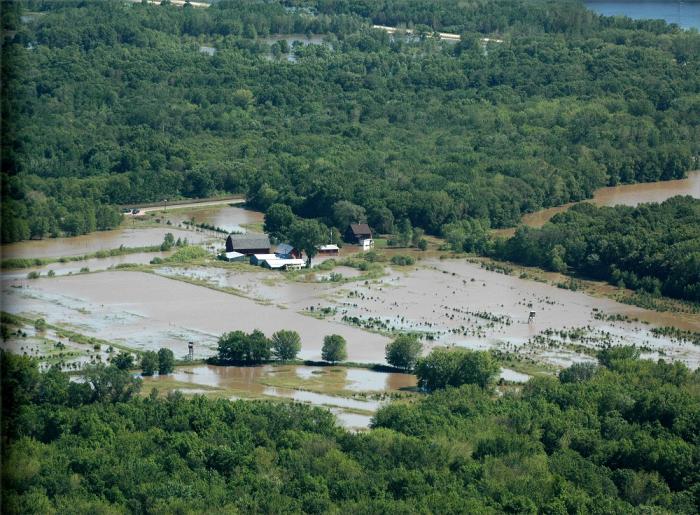
Extreme conditions can result in major perturbations and shocks in agri-food systems. Major climate variation, such as severe or prolonged drought, is a common example with regard to major changes emanating from the natural system (see figure 11.1.1). Gary Paul Nabhan, the author of the required reading in this module, uses the example of the extreme "Dust Bowl" drought in the United States in the 1930s. Since it is already a region that receives little rainfall, the agri-food systems in the U.S. Southwest were considerably threatened by this drought. Extreme conditions endangering food-growing and availability can also arise in human systems. Examples include political and military instability as well as market failures and volatility (such as the sharp increase in prices).
The human-environment dynamics of major perturbations and shocks in agri-food systems are shown in figure 11.1.3. This figure uses the already familiar approach of Coupled Natural-Human Systems (CNHS) introduced in Module 1 and applied in module 10 and throughout the course. Here we apply it to interactions of the natural and human systems that result in reduced production and accessibility of food. The human response to perturbations and shocks can be understood by applying the CNHS framework to agri-food systems. Within this diagram, we also want to emphasize that because of the coupling and interactions within and among these systems, the human and natural systems are never just passive recipients of a shock. Both subsystems have mechanisms for responding that can either ameliorate or worsen the "crisis" effects of perturbation. These system properties and responses to shocks are considered through the concepts of resilience, adaptive capacity, and vulnerability (RACV), defined on the next page. In the next module (11.2) we will use the RACV and human-natural systems framework to understand shocks and system responses that result in famine and severe malnutrition.
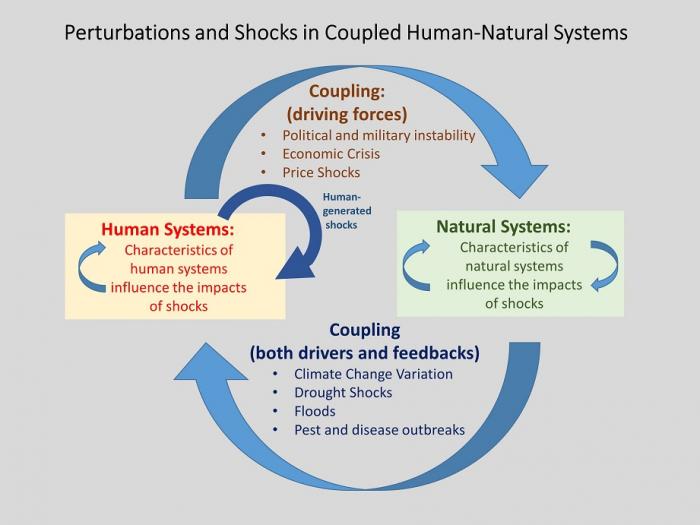
Defining Resilience, Adaptive Capacity, and Vulnerability
Defining Resilience, Adaptive Capacity, and Vulnerability
Introductory Video and Knowledge Check
Please watch the brief video about resilience and adaptive capacity. The presenter, Terry Chapin of the University of Alaska- Fairbanks, is an ecosystem ecologist who is used to thinking about the stresses that whole systems like ecosystems and food systems confront. Note that he uses the term 'resources' as roughly equivalent to the components of natural systems that support coupled human-natural food systems presented on the previous page. After the video in the knowledge check activity below, we'll ask you to identify the types of resources (i.e. components of natural systems) we've presented as vital to food systems in this course. You should, therefore, think about how the example he presents of Alaskan Native American communities and peoples can extend to many other elements of the food system.
Video: Resilience: The importance of adaptive capacity (2:10)
Knowledge Check Activity
Based on your learning in the course so far:
Question 1 - Short Answer
Try to quickly think of two important resources for food production like the ones described in this video. For each of the three, think of threats that confront these resources in their role of affecting food production.
Click for answer.
- Example 1
Resource: water
Threat: drought, climate change, decreased soil water holding capacity, depletion of aquifers (don't need to have all these, just examples) - Example 2
Resource: Soils and soil nutrients
Threat: soil erosion, too little manure, fertilizer, organic matter, and other soil inputs being returned to soils, urbanization, and loss of agricultural land base - Example 3
Resource: Crop production
Threat: pests, diseases, and weeds
Question 2 - Short Answer
Can you guess some examples of "adaptive capacity" by human systems within food systems we've seen so far?
Click for answer.
Policies to regulate water use and water pollution, breeding of resistant crops, measures to maintain soil health, creation of irrigation systems, crop insurance
Definitions of Resilience, Adaptive Capacity, and Vulnerability
Resilience, adaptive capacity, and vulnerability (RACV) are three concepts used to explain how human and natural systems respond to perturbations and shocks. We can use these concepts to understand the responses of agri-food systems to such factors as drought or the occurrence of market shocks or political crises. Here are some definitions of the RACV concepts, understood within a Coupled Natural-Human System Framework.
Resilience
Resilience is a system property which denotes the degree of shock or change that can be tolerated while the system maintains its structure, basic functioning, and organization. Talking about resilience usually implies thinking about the resilience “OF what TO what”. That is, we need to understand the resilience of a system (what system or process?; e.g. crop production; food distribution; farming or culinary knowledge) TO a threat or shock (what kind?; e.g. drought, war, plant disease). A recent report from a United Kingdom scientific commission states that resilience is “the capacity to absorb, utilize or even benefit from perturbations, shocks and stresses” which includes the idea that resilient systems, provided they are sufficiently robust, can even benefit from perturbations.
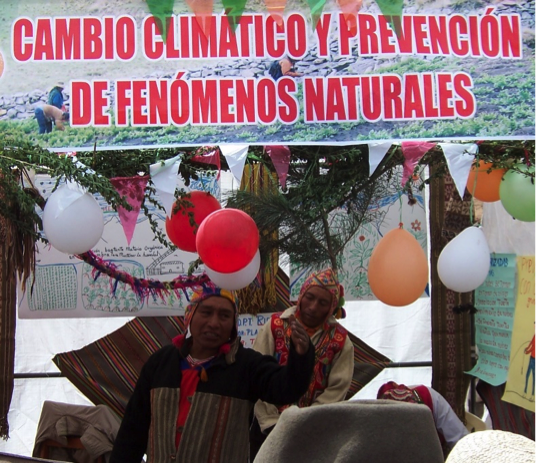
Adaptive Capacity
Adaptive capacities are the social and technical skills and strategies of individuals and groups that are directed towards responding to environmental and socioeconomic changes. In the context of food systems, adaptive capacity is usually exhibited or deployed to maintain livelihoods, food production, or food access. In the context of climate change, it is important to distinguish between adaptive capacity vs. mitigation: Adaptive capacity is deployed to adapt to perturbations in growing or living conditions or shocks brought on by climate change. Mitigation involves actively reducing the threat of climate change, rather than adapting to its effects: for example reducing emissions, reducing meat consumption among high-meat consuming populations, or geoengineering of the atmosphere to reduce CO2 concentrations.
Adaptive capacity is the second important property that refers to the responsiveness of agri-food systems when faced with extreme conditions. Human systems might, for example, have the capacity to switch to alternative land use within the agri-food systems. In these cases, people would be able to adapt to change since they have the capacity to shift their use of land and other resources. Adaptive capacity in the case of natural systems is exemplified by drought-tolerant crops (figure 11.1.5). Such crops may have more developed root systems or biological adaptations for conserving moisture.

Vulnerability
Vulnerability is the exposure and difficulty of individuals, families, communities, and countries in coping with shocks, risk, and other contingencies. This can be thought of as the opposite of adaptive capacity, with a continuum of mixed adaptation/vulnerability in between the two extremes of adaptive capacity and vulnerability. Farmers and consumers in extremely poor and isolated circumstances (whether in urban or remote areas) can be considered highly vulnerable because they lack their own ability to adapt to threats, and may be cut off or marginalized from external resources (family, government assistance etc.) that allows them to adapt to changes.
Now we can apply the concepts of resilience, adaptive capacity, and vulnerability to agriculture and food, using a Coupled Natural-Human System (CNHS) framework (Figure 11.1.6)
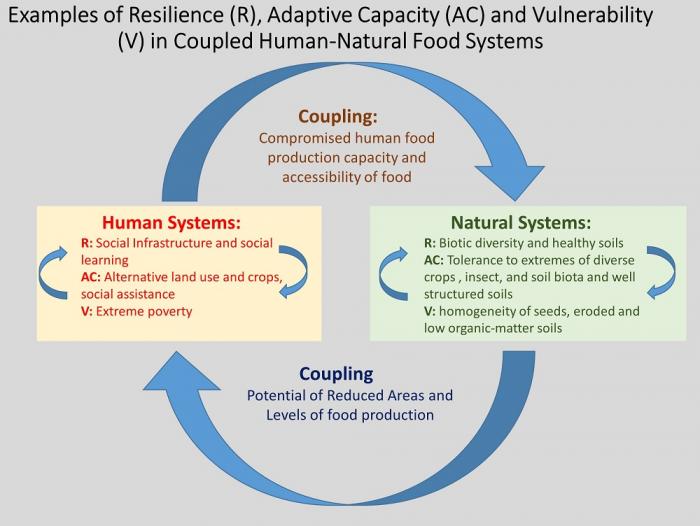
Examples of Resilience (R), Adaptive Capacity (AC), and Vulnerability (V) in Human systems and natural systems
Human Systems:
R: Social infrastructure and social learning
AC: Alternative land use and crops, social assistance
V: Extreme poverty
Natural Systems:
R: Biotic diversity and healthy soils
AC: Tolerance to extremes of diverse crops, insect, and soil biota and well structured soils
V: homogeneity of seeds, eroded and low organic-matter soils
As shown in Figure 11.1.6, resilience can be found in both the natural and human subsystems of food systems. You may recognize that many of the examples of natural system adaptive capacity refer to the "best practices" that we have advocated for water, soils, crops, and pest management in sections II and III of this course. These would include examples such as reducing the water footprint of food production, managing soils in a system framework for greater "soil health", and managing pests with ecological practices that seek to avoid pest and weed resistance to our management approaches (Modules 4, 5, 7, and 8 respectively). These approaches are not only important in increasing productivity under average conditions, but also help a food production system to adapt to shocks and perturbations.
Meanwhile, the human component of coupled human-natural food systems also is a vital part of resilience and adaptive capacity. Resilience is higher where there are higher levels of social infrastructure that enable people to share learning and resources in response to shocks and perturbations, such as extreme drought. Social infrastructure, shown in Fig. 11.1.6, includes mutual assistance within families and communities or among regions in a country, coordinated by governments to assist in the case of shocks that affect food production. Social learning is vitally important since it’s one of the main ways that people would learning new techniques based on the conditions prevailing in their area. For example, farmers could use social learning to acquire the skills and knowledge to lessen water use, and thereby lessen the degree of agricultural production decline and reduced food access. Biological diversity is a major example of higher resilience functioning in the natural components of coupled agri-food systems. Food production systems with more biological diversity---a property referred to as agrobiodiversity and covered on the next pages---typically have the capacity for greater levels of resilience. This greater level of resilience may result from a mixture of crops and varieties combining vulnerable and resistant type of crop, for any given stress, so that even if some crops fail, others will do well. Different crops and land uses may also produce positive or facilitating interactions in which one crop type or wild plant species, for example, provides benefits to another (e.g. nitrogen fixation and better soils or screening from an important pest; see module 6 on crops and the previous section on systems approaches for management for additional examples).
Resilience vs. Adaptive Capacity: What's the Difference?
On the surface, resilience and adaptive capacity in systems may seem very similar, and it is true that as defined here they are very aligned. One way to remember the difference is that resilience is a broader system property that may have to do with the interplay of human and natural systems, or one or the other of these subsystems. We can say that a region's food system is quite resilient to drought (a more general statement) if we think for a number of reasons that its food supply would be able to continue mostly without issues during a drought. Adaptive capacity meanwhile is more narrowly focused on the specific skills and mechanisms that are deployed by human systems to contribute to resilience. In other words, we might identify that the system or component thereof is resilient (like the region mentioned above), and then identify sources or mechanisms of resilience in terms of particular knowledge, practices, land uses, or biological properties that are functioning in a food production system, referring to these as adaptive capacity. We turn next to agrobiodiversity as an example of adaptive capacity that can contribute to food system resilience (can you see the difference between the two words in this last sentence?).
Agrobiodiversity: Biological Diversity and Associated Human Capacity in Agri-food Systems
Agrobiodiversity: Biological Diversity and Associated Human Capacity in Agri-food Systems
One major way of increasing the resilience and adaptive capacity of agri-food systems in response to perturbations and shocks is to be certain they contain components with high levels of agrobiodiversity.
Here is a standard definition of agrobiodiversity:
This definition is taken from Gary Nabhan’s book Where Our Food Comes From and is based on work of the United Nation’s Food and Agriculture Organization (FAO)
Agricultural biodiversity…includes the cornucopia of crop seeds and livestock breeds that have been largely domesticated by indigenous stewards to meet their nutritional and cultural needs, as well as the many wild species that interact with them in food-producing habitats. Such domesticated resources cannot be divorced from their caretakers. These caretakers have also cultivated traditional knowledge about how to grow and process foods.. (which) is the legacy of countless generations of farming, herding and gardening cultures.
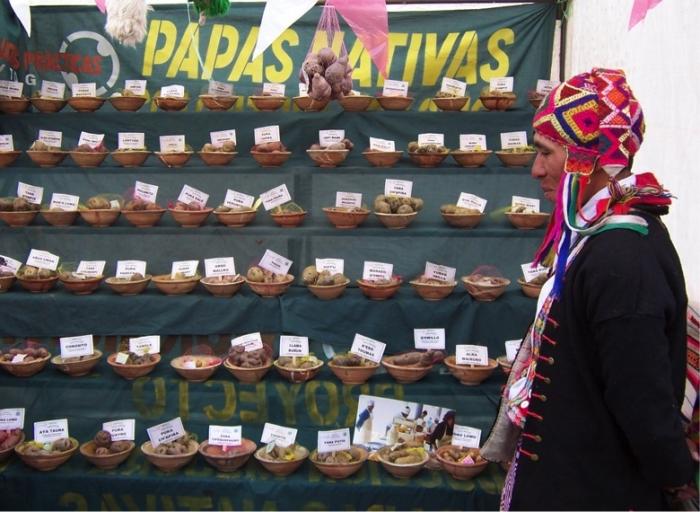
There are two important points to note about this definition:
- First, and most importantly, the biological diversity of agri-food systems includes vital coupling to the human system, most directly the people who are growers and their skills, knowledge, and other factors. These growers are “caretakers” in Nabhan’s definition; see Fig. 11.1.7 for potato varieties and a representative "caretaker" - a local farmer with working knowledge of these varieties. Agrobiodiversity exists squarely at the intersection of human and natural systems conceptualized in this course.
- Second, it encompasses both our cultivated species of plants and animals, which are crops and livestock chosen and evolved for production, as well as their still living wild relatives and the biodiversity of the ecosystems associated with this production (both the agroecosystem itself and the surrounding uncultivated ecosystem). Agrobiodiversity production in the natural system must be sufficient to offer positive feedbacks into the human system in order to offer the incentive for continued production.
The above-mentioned points in the definition of agrobiodiversity are illustrated in figure 9.6, which depicts agrobiodiversity as a Coupled Human-Natural System (CNHS).
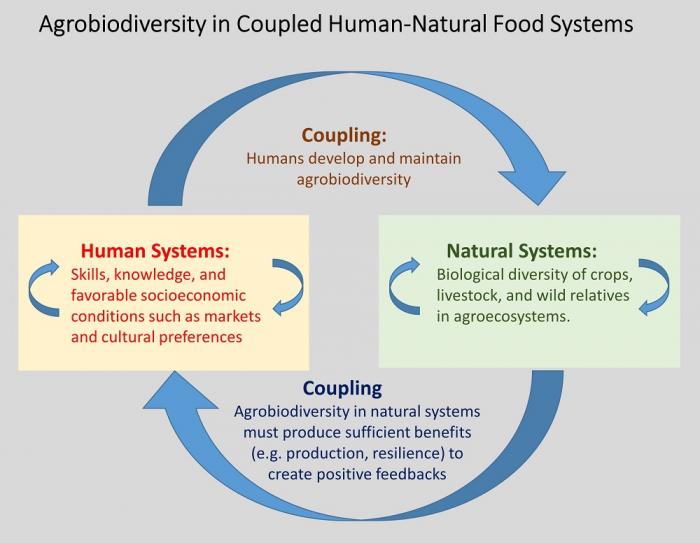
The growers of agrobiodiversity range widely around the world. They include the people of traditional and indigenous cultures who often live in more remote locations. Many of these people live in mountainous regions and hill lands of the tropics and sub-tropics. Their use of agrobiodiversity in agri-food systems is reflected in certain global centers of diversity, as shown in the map that we presented in Module 2 regarding the sites of crop domestication in the early history of food systems. Such centers are sometimes called “Vavilov Centers” in recognition of the pioneering contribution of the scientist Nikolay Vavilov in the 1920s.
Increasingly it’s recognized that significant agrobiodiversity also occurs outside the Vavilov Centers. For example, many urban and peri-urban dwellers grow small fields and gardens as part of local, small-scale agri-food systems. Producers of diversified production for local markets in North America and Europe are still another important group of agrobiodiversity-growers.
The extent of agrobiodiversity, in terms of crops and livestock, may vary from only a few types in a field or farm to many dozens. Agri-food systems with only a few types are quite important since they can confer significant resilience to perturbations and stressors. For example, cultivation of only a few types of barley, wheat, or maize (“corn” in the U.S.) among neighboring farms and communities can offer a much higher degree of resilience than the monoculture of a single type.
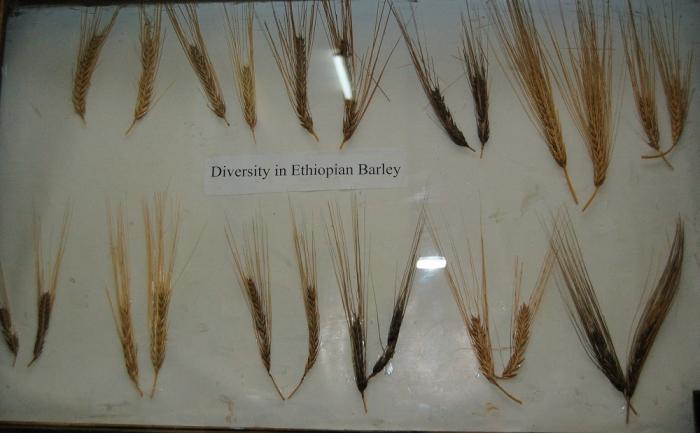
Equally important is the case of the megadiverse agri-food systems. In the potato fields of the Andes Mountains of western South America, for example, a farmer may grow as many as 20-30 major types of potatoes in a single field. (Figure 11.1.11). Here, in tha global “Vavilov Center” of the Andes mountains, high levels of agrobiodiversity are integral to the agri-food system as a result of factors in the human system (skills, knowledge, labor-time, cultural and culinary preferences) and the natural system (highly varied climate and soil conditions characteristic of tropical mountains).
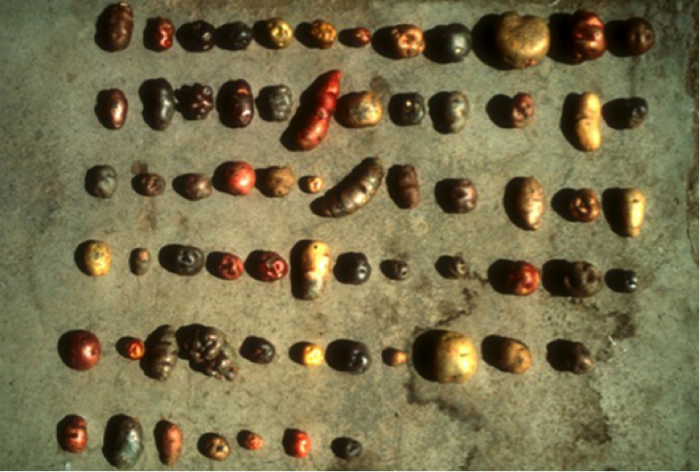
Activate Your Learning: Agrobiodiversity and Resilience
Assigned Reading:
Please read the brief "introduction to the reading" below and then the following pages from Gary Nabhan's book "Where Our Food Comes From":
Nabhan, G.P. "Rediscovering America and Surviving the Dust Bowl: The U. S. Southwest ", p. 129-138, part of Chapter 9, Where Our Food Comes From: Retracing Nikolay Vavilov's Quest to End Famine. Washington: Island Press.
Introduction to the reading: The reading describes part of a much longer account of travels by Vavilov (for whom the Vavilov centers of agrobiodiversity are named, see the previous page in the book, and module 2.1 in this course) from 1929 to 1934 in North America. During this trip, the Russian crop researcher met with U.S. researchers as well as "keepers" of U.S. native agrobiodiversity. This chapter describes Vavilov's trip to the Hopi Indians in 1930, in which he and the U.S. scientists were able to observe firsthand the seed systems and their resilience to the drought that was currently going on in the United States. The author of the book, Gary Nabhan, relates this account of the visit and then compares it to similar visits he made to the Hopi in the more recent past. This compiled history of seed systems and their relation to both human and natural system changes in the U.S. Southwest is a sort of case study, from which the assessment worksheet will ask you to draw conclusions.
Download Worksheet [289]
Activate Your Learning
This exercise requires you to fill in some of the blanks in the worksheet [289] based on the reading.
- Two of the shocks that the Hopi food system has been exposed to have already been filled in on the worksheet, the main one being periodic drought. Within the human system box, fill in some of the agricultural methods (ways of growing food) described by Nabhan that represent adaptive capacity to drought shocks.
Click for answer.Deep planting of crops to capture moisture, spring-fed terraces, stream-side fields to capture flood moisture. - In the natural system box, fill in how agrobiodiversity and their seed systems also represented adaptive capacity of the Hopi against drought.
Click for answer.Diverse crops adapted to local conditions, local seed saving so that seeds were not lost, tree crops and edible wild plant gathering to supplement diet. - During the more recent drought, Nabhan states that an additional climatic factor related to climate change tended to worsen the effects of drought. What was this? Place it in the additional shock box at the lower edge of the diagram.
Click for answer.Hotter summer temperatures due to climate change. - A shock that emerged from the human system was the pumping of groundwater for coal mining and coal slurry transport in the region. What was the vulnerability to drought in the local natural system that this water extraction created? Fill it in in the “vulnerabilities” box in the natural system part of the diagram.
Click for answer.Pumping of groundwater for coal mining dries out springs and reduces the availability of spring water for irrigated terraces. - In the last part of the chapter, Nabhan notes first a social/cultural vulnerability that has emerged in recent times. What is this social vulnerability? Note it in the vulnerability space of the Human System rectangle.
Click for answer.Shift toward salaried work in cities by young people within the community. - Nabhan also notes a new social adaptive capacity that has arisen to challenge this vulnerability. What is this newest change that gives Nabhan hope about the fate of Hopi seed and agricultural systems?
Click for answer.Hopi organizations that seek to revitalize farming traditions and the Hopi food system. - Of the three shocks now documented in the diagram, to which one would the Hopi knowledge system and adaptive capacity been most exposed to over recent centuries? Answer in one sentence.
Click for answer.Likely, drought would have been a recurrent shock with which Hopi knowledge systems and adaptive capacity would have been familiar. - Compare the level of success the Hopi food system had in adapting to the older, better-known shock you chose in (7), in comparison to the other two shocks, at least during the last thirty years. (3-4 sentences, this may make the page run over to the next).
Click for answer.It was more challenging to adapt to these later shocks – their effects may have been unfamiliar based on long experience, and also they tend to affect not just production but the very means of existing adaptive capacity, for example limiting the effectiveness of known farming strategies (e.g. spring-fed terraces) or the entire knowledge system from which the Hopi drew their adaptive capacity. (some version of the above is acceptable as an answer: explain that it is more challenging and some reference to why that was so)
Module 11.2: Food Access and Food Insecurity
Module 11.2: Food Access and Food Insecurity
In this module, we will introduce the concepts surrounding the global challenge of food access and insecurity and the vulnerability of agri-food systems and particular populations to market and climate shocks. The concepts used in this unit build on the ideas of shocks and perturbations, resilience, adaptive capacity, and vulnerability of agri-food systems that were covered in unit 11.1. The unit, therefore, illustrates an urgent aspect of the analysis of the agri-food system as a coupled natural-human system.
Introduction to Food Access, Food Security, and Food-Insecure Conditions
Introduction to Food Access, Food Security, and Food-Insecure Conditions
Food access is a variable condition of human consumers, and it affects all of us each and every day. If you have ever traveled through an isolated area of the country or the world and encountered difficulty in encountering food that is customary or nutritious to eat, or within reach of your travel budget, you have an inkling of what it means to have issues with food access. For those with little capacity for food self-provisioning from farms or gardens, food access is determined by factors influencing the spatial accessibility, affordability, and quality of food sellers. The consistent dependability of adequate food access helps to enable food security whereby a person’s dietary needs and food preferences are met at levels needed to main a healthy and active life. Famines are conditions of extreme food shortage defined by specific characteristics (see below). Food-insecure conditions, such as acute and chronic hunger, are important conditions that affect many people both in the United States and in other countries.
Definitions:
Food Access:
Determined among consumers by the spatial accessibility and affordability of food retailers---specifically such factors as travel time to shopping, availability of healthy foods, and food prices---relative to the access to transportation and socioeconomic resources of food buyers. You examined both of these in the Module 3 nutrition activity that used the United States Atlas of Food Access. Some people and places, especially those with low-income, may face greater barriers in accessing healthy and affordable food retailers, which may negatively affect diet and food security. Food access among growers of food, whether full-time farmers or part-time farmers (including many smallholders), is influenced through the ability of e.g. farmers to produce and store enough food to complement purchased food or food themselves entirely, referred to as self-provisioning capacity.
Food Security:
“when all people at all times have access to sufficient, safe, nutritious food to maintain a healthy and active life. Commonly, the concept of food security is defined as including both physical and economic access to food that meets people's dietary needs as well as their food preferences” (World Health Organization)
Components of food security: Some food programs, such as the Food and Nutrition Technical Assistance (FANTA) unit of the U.S. Agency for International Development (USAID), have found it helpful to analyze food security as composed of:
- food availability (production and/or markets that deliver sufficient amounts of food)
- food access (see above definition)
- food utilization: the ability to exercise cultural food preferences and the effective use of food within households and communities to guarantee equitable nutrition.
Famine:
Famine is generally understood as acute (versus chronic) food shortages at crisis levels across a wide area, with disastrous health and mortality outcomes. While there are various formal definitions of famine, many experts say that there must be evidence of three specific outcomes before a famine can be declared:
- At least 20 percent of households face extreme food shortages with limited ability to cope; Note the explicit linkage to reduced adaptive capacity of famine victims (see module 11.1)
- The prevalence of acute malnutrition across the famine region, in a generalized way, must exceed 30 percent.
- Death rates from hunger must exceed 2 deaths per 10,000 people per day.
(World Food Program definition, from Zero Hunger [290]).
Food-insecure conditions: acute vs. chronic hunger and malnutrition:
The definitions above imply concepts of acute and chronic that are broadly analagous to their definitions in the medical field. An acute food shortage is one that occurs suddenly, while chronic conditions go on month after month or year after year. Most climate and price shocks provoke acute impacts or crises; while chronic malnutrition of vulnerable or poor populations within countries can go on year after year, provoking long-term negative health and livelihood impacts. Both are considered failures of food systems. Acute food insecurity is rare in wealthier countries, but chronic under-nutrition and poor nutrition can be common especially among the poor, and is one of the current crises faced in the United States.
Smallholders:
You may already be familiar with this term and absorbed some of the characteristics of smallholder farmers through our focus on the food systems that these farmers occupy around the world (Module 10.1). In formal terms, smallholders are food producers whose households typically own less than 2-3 hectares (approximately 7 acres) of farmland. Demographically, smallholders number approximately 2.0-2.5 billion people worldwide, which makes them a major stakeholder group and "target population" for global food and agricultural policy. The socioeconomic characteristics of smallholders vary widely. Some smallholders, including ones in the U.S. and Europe, may include locally well-to-do “hobby farmers” while the majority of smallholders are relatively poor, both in these countries and in the far more numerous populations of smallholders in countries such as China, India, and Brazil, and well as many other less developed and developing nations. The food access of smallholders typically combines some self-provisioning along with significant reliance on food acquisitions at stores and markets for staple foods such as grains, noodles, sugar, and oils.
Global Overview of Food Insecurity: Food Deficit Map and Required Readings
Global Overview of Food Insecurity: Food Deficit Map and Required Readings
A global overview of food insecurity can be obtained by mapping the average daily calorie supply per person for each country (see Figure 11.2.1). Mapped values are shown as ranging from less than 2,000 calories per person (e.g., in Ethiopia and Tanzania) to the range of 2,000-2,500 calories per person, which covers several countries in Africa as well as India and other countries in Asia in addition to Latin America and the Caribbean. Calories are a reasonable way to begin to understand large-scale patterns related to the lack of food access around the world. Nevertheless just looking at calories hides other aspects of human nutrition, such as the need for a diverse diet that satisfies human requirements for vitamins, minerals, and dietary fiber, which were described in module 3.
Required Readings
The following brief readings are good ways to appreciate the analyses and debates surrounding food insecurity and the challenges of "feeding the world", especially in the emerging scenario of climate change impacts on food production. They form part of the required reading for this module and will help you to better understand the materials and the summative assessment.
- Bittman, Mark. "Don't Ask How to Feed the 9 Billion [292]" NYT, Nov 12, 2014. (Note: The link is available only for users with Penn State accounts.)
- Deering, K. 2014. Stepping up to the challenge – Six issues facing global climate change and food security [286], CCAFS (Climate Change and Food Security Program)-UN (United Nations), 2014. Read the page headings on each challenge and the brief description of the response below.
Food Shortages, Chronic Malnutrition, and Famine: Coupled Human-Natural Systems Aspects
Food Shortages, Chronic Malnutrition, and Famine: Coupled Human-Natural Systems Aspects
Food Crises and Interacting Elements of the Natural and Human Systems
This section employs the framework of Coupled Natural-Human Systems (CHNS) in order to illustrate the interacting elements of natural and human systems that can combine to produce severe food shortages, chronic malnutrition, and famine food systems around the world. These CHNS concepts build on the diagrams and concepts in modules 10 and 11.1. You will also apply these concepts in the summative assessment on the next page.
As you read this brief description consult figure 11.2.2 below. It depicts that interacting conditions within the human and natural systems, combined with driving forces and feedbacks, are at the core of many cases of severe food shortages, chronic malnutrition, and famine in agri-food systems.
The best place to begin interpreting Figure 11.2.2 is by focusing on the driving forces emanating out of both the human and natural systems. Human system drivers often involve political and military instability and/or market failures and volatility (such as prices). Most cases of famine, as well as many instances of severe food shortages and chronic malnutrition, involve these human drivers. In addition, human drivers not only drive vulnerability in natural systems but may act first and foremost on human systems, reducing the adaptive capacity of consumers and producers, for example by reducing the purchasing power of poor populations during price spikes.
Figure 11.2.2 also shows that drivers emanate from the natural system. Climate change and variation, such as drought and flooding, often contribute to cases of famine, as well as severe food shortages and chronic malnutrition.
These drivers, however, are only PART of the causal linkages of severe food shortages, chronic malnutrition, and famine. Similarly important are the conditions of poor resilience (potentially arising as result of weak social infrastructure), low levels of adaptive capacity and poverty. Poverty is tragically involved as a cause of nearly all cases of severe food shortages, chronic malnutrition, and famine. For Mark Bittman, the author of the required reading on the previous page, the link between poverty and failures of food systems, rather than a failure of any other human or natural factors such as food production, food distribution, or overpopulation, is the central thesis he advances in his short opinion piece. You may want to glance again at this reading in order to remind yourself of why poverty is so deeply implicated in the failures of agri-food systems.
Weak or inadequate resilience (R) and adaptive capacity (AC), along with vulnerability (V), are also symptomatic of natural systems prone to severe food shortages, chronic malnutrition, and famine. For example, cropping and livestock systems unable to tolerate extreme conditions illustrate a low level of adaptive capacity (AC) that can contribute significantly to the failure of agri-food systems.
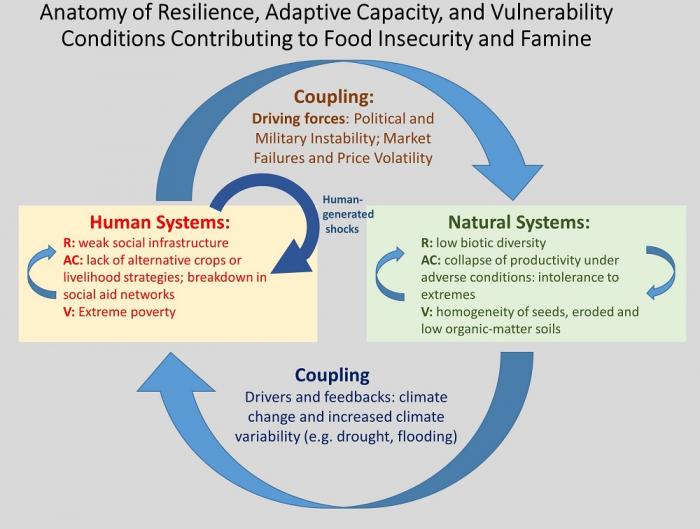
Summative Assessment: Anatomy of a Somali Famine (2010 - 2012)
Summative Assessment: Anatomy of a Somali Famine (2010 - 2012)
Instructions
Download the worksheet and follow the detailed instructions provided.
Files to Download
SEE WORKSHEET ON NEXT PAGE
Anatomy of a Famine: multifactorial failures of adaptive capacity to climate and social shocks.
This worksheet relies heavily on the data resources presented by the Food Security and Nutrition Analysis Unit – Somalia [293]and the Famine Early Warning System Network [294] (FEWS Net).
This worksheet uses maps, tables, and graphs to guide you in analyzing a tragic famine in Somalia between 2010 and 2012 as a case of adaptive capacity and vulnerability (see Module 9.2 for the definition of a famine). As many as 260,000 people died in this famine, half of them children under five years old (optional: see Somalia famine 'killed 260,000 people' [295], May 2, 2013). You should read carefully through the case study presented in the worksheet (download above) and answer the question in each section, e.g. “Question A1” and the two summary questions at the end.
Submitting Your Assignment
You do not need to submit your worksheet; it will instead act as a guide for you to complete the summative assessment quiz.
Summary and Final Tasks
Summary
Module 11 analyzes the way in which food production and food systems are vulnerable to shocks and perturbations, such as extreme weather, a changing climate, and economic and political crises like those caused by wars. However, food producers like farmers, and food systems generally, don't merely absorb or suffer these shocks. Rather, farmers and other participants in food system exhibit adaptive capacity or capacities, part of a more general system property called resilience, which allows them to respond to and partially blunt the impacts of perturbations. In addition to forms of adaptive capacity such as migration, wage labor, and irrigated crops, which allow farmers to access food in difficult conditions, a major form of adaptive capacity we have examined in module 11.1 is that of agrobiodiversity: the different crops and crop varieties possessed by a community or society. This range of crops help these communities and a whole food system to respond over time to new and different conditions for food production and even escape extreme conditions.
However, as module 11.2 and the summative assessment indicate, there are situations where farmers become extremely vulnerable to shocks and economic marginalization. This may take the form of food insecurity and consequent malnutrition, a topic that was first introduced in module 3. There are also situations, such as the Somali famine of 2012, and earlier famines, in which a combination of climatic and political conditions become so extreme that widespread hunger and mortality occurs. Knowing about the principles of adaptive capacity and vulnerability, and the terrible consequences of vulnerability in famines may help you to act constructively to help global society to end acute hunger, as well as more chronic food insecurity around the world.
Reminder - Complete all of the Module 11 tasks!
You have reached the end of Module 11! Double-check the to-do list on the Module 11 Roadmap [296] to make sure you have completed all of the activities listed there before you begin module 12 where you will finalize your capstone project.
References and Further Reading
Chambers, R. (1989). Editorial introduction: vulnerability, coping and policy. IDS Bulletin, 20(2), 1-7.
Folke, C., Colding, J., & Berkes, F. (2003). Synthesis: building resilience and adaptive capacity in social-ecological systems. Navigating social-ecological systems: Building resilience for complexity and change, 352-387.
Gillis, Justin. A Warming Planet Struggles to Feed Itself [297], New York Times. June 4, 2011. This article provides an insight into the efforts to adapt to climate change with more resilient crops, and maintain or increase production of crops in the next decades.
Hajjar, Reem, Devra I. Jarvis, and Barbara Gemmill-Herren. "The utility of crop genetic diversity in maintaining ecosystem services." Agriculture, Ecosystems & Environment 123.4 (2008): 261-270.
Nabhan, G.P. "Melting Glaciers and Waves of Grain: The Pamirs", p. 45-64, Chapter 3 in Where Our Food Comes From: Retracing Nikolay Vavilov's Quest to End Famine. Washington: Island Press.
Capstone Project Stage 4 Assignment
Capstone Project Stage 4 Assignment
Strategies for Sustainability
(Modules 10 and 11)
You’ve now completed the content modules for the Future of Food course. In Stage 4 of the capstone project, you’ll gather a bit more data about your region. In Stage 5, you will put together your final web page which will present your assessment of the current status of your assigned regional food system, projections for future scenarios of increased human population growth and increased temperatures in your region, and your proposed strategies to enhance the resilience and sustainability of your region’s food systems.
In Stage 4, you will gather data related to what you’ve learned in Modules 10 and 11. Also, you will explore population projections for your assigned region, so you can begin to assess the potential future resilience of the food systems of your assigned region.

Capstone Stage 4 (food systems and sustainability)
describe regional food systems
assess using life-cycle concepts
discuss agrobiodiversity using RACV
discuss food insecurity/security
research population growth projections
propose strategies for sustainability
What to do for Stage 4?
- Download and complete the Capstone Project Stage 4 worksheet [298] that contains a table summarizing the data you need to collect to complete this stage. Remember, you need to think deeply about each response and write responses that reflect the depth of your thought as informed by your research.
- Add questions and continue to research the questions in your worksheet files.
- Keep track of all of the resources and references you use.
- Add relevant data, maps, and figures to your PowerPoint file.
- Revise your CHNS diagram and/or create a new one incorporating topics from Modules 10 and 11.
Module 12: Capstone Project Stage 5
Module 12: Capstone Project Stage 5
Future Food Scenarios
Stage 5 is the final stage of the semester-long capstone project. There are two parts to this assignment.
- You will submit a rough draft of your final Capstone Paper to be peer-reviewed. You will submit 700-1000 words, or roughly half of your final paper. Once the deadline for this submission passes, you will be able to access the paper of a peer's to review. When reviewing someone else's paper, consider the following:
- What are aspects of this paper do you enjoy the most? (3-5 sentences)
- What three aspects of this paper do you think could be improved? (3-5 sentences)
- To improve this paper, what two things would you change? (3-5 sentences)
- You will write a 1500-2000 word paper (approximately 6-8 pages double-spaced) as your final project. For this paper, you will use the data you've been gathering in the previous capstone stages throughout the semester to write a paper. Your paper will summarize the data and information you’ve gathered in stages 1, 2, 3, and 4 about the food systems of your assigned region. You may incorporate images, maps, and/or charts in your final paper, but keep in mind that these do not go toward your final count. You must include proper citations and references in your paper for any work (ideas, quoted material, maps/charts/images) that is not your own. If at any time you have a doubt about needing a citation, you should go ahead and include one or reach out to your instructor for assistance.
You will follow the instructions from your teacher to write and submit the paper. Your paper must include the following information:
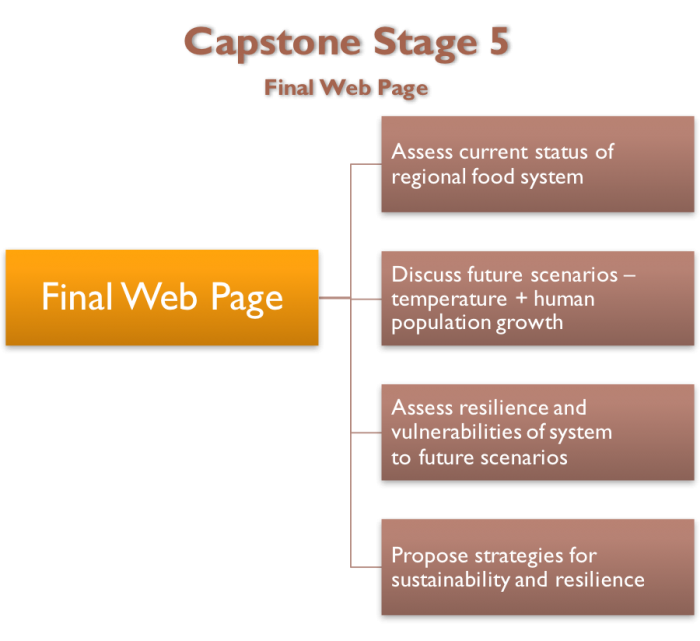
- Assess current status of regional food system
- Discuss future scenarios - temperature + human population growth
- Assess resilience and vulnerabilities of system to future scenarios
- Propose strategies for sustainability and resilience
What to do for Stage 5?
- Download the Capstone Project Stage 5: Final Paper Project [299]
- Follow the instructions from your instructor to write the paper.
- Turn in via Canvas:
- Your final paper draft for peer-review
- Your final paper
Grading Information and Rubric for Final Capstone Paper:
| Criteria | 9 | 6 | 3 | 1 |
|---|---|---|---|---|
| Completeness of paper & all supporting documents: Conforms to all instructions and guidelines | All specific instructions are met and exceeded; no components are omitted. | Most instructions are met with only 1 to 2 minor omissions | Some components are present with the omission of several key elements | Missing most components of the project, minimal conformity to guidelines. |
| Identification of the key food systems of the region | Clearly and thoroughly identifies the regional food systems with a clear application of material from Modules 1, 2, & 10 | Satisfactory identification of the regional food systems some mention of material from modules 1, 2, & 10 | Minimal identification of the regional food systems some mention of material from modules 1, 2, & 10 | Little to no identification of the regional food systems some mention of material from modules 1, 2, & 10 |
| Assessment of the regional food system and the physical environment of the region (water resources, soils, crops, climate) | Thoroughly articulates specified elements with in-depth & accurate application of key concepts from Modules 4, 5, 6 & 9 | Satisfactory articulation of specified elements with some application of key concepts from Modules 4, 5, 6 & 9 | Minimal articulation of specified elements with little application of key concepts from Modules 4, 5, 6 & 9 | Little to no articulation and application of key concepts from Modules 4, 5, 6 & 9 |
| Analysis of the resilience of the regional food system based on data and facts | Thoughtful and thorough consideration of potential vulnerabilities using concepts from Module 11 | Satisfactory consideration of potential vulnerabilities using concepts from Module 11 | Minimal consideration of potential vulnerabilities with little use of concepts from Module 11 | Little to no consideration of potential vulnerabilities with little use of concepts from Module 11 |
| Proposes reasonable strategies for sustainability and resilience based on data and facts | Clearly develops viable & insightful strategies with well‐ supported data & research | Develops viable strategies supported by some data and research | Develops minimal strategies supported with limited data and research | Little to no strategies provided or not supported by data and research |
| Criteria | 5 | 3 | 2 | 1 |
| Overall professionalism and timing | Advanced ‐ no typos, or grammatical concerns, attention to detail with superior effort demonstrated | A solid effort with few typos, or grammatical concerns, attention to detail evident with some effort demonstrated | Minimal effort with numerous typos, or grammatical concerns, little attention to detail minimal effort demonstrated | Little to no effort demonstrated with extensive typos, or grammatical concerns, little to no to attention to detail |
| Total Points (out of 50) |
- Summary of Current Regional Food System
- Summarize the data and information that you’ve gathered throughout the semester about your assigned regional food system(s) and the interaction between those food systems and the environment, as well as any relevant socioeconomic, cultural and policy factors.
- Provide an overview of the current status of your assigned regional food system(s). Summarize the data and information that you acquired in the previous modules to present the current status of your regional food system. Details are provided in the Stage 5 worksheet document.
- Discussion of future scenarios
- What are projections for regional human population growth in your assigned region?
- What are the projections for temperature increases in your assigned region?
- Analysis of the resilience of future food system
- Provide a discussion of the resilience of your food system given the potential of increasing human population growth and increasing temperatures.
- Consider possible impacts of climate change and human population growth on the regional food system and the resilience and/or vulnerability of the food system to those changes.
- Proposed strategies for sustainability enhanced resilience
- Propose strategies that contribute to the increased resilience of your assigned regional food systems in the face of human population growth and rising temperatures and evaporation rates.
Files to Download (if you haven't already done so)
Capstone Project Stage 1
Capstone Project Stage 1

Capstone Stage I - Introduction to your regional food system, history and diet/nutrition
- Describe physical environment
- Describe human environment
- Explore history of the food system
- Discuss diet and nutrition
Instructions
- Confirm with your instructor which region you will be studying and introduce yourself to your group members.
- Download and complete the CapstoneProject_Stage1.docx worksheet that contains a table summarizing the data you’ll need to collect to complete this stage. You need to think deeply about each response and write responses that reflect the depth of your thought as informed by your research. Do not just write one-word answers.
- Create a powerpoint file that you’ll use to store maps, data, graphs, photos, etc. that you collect related to your assigned region. For every piece of information that you put in your powerpoint file, you MUST include a citation that clearly explains where that piece of information came from.
- Create a Word document to list questions that you have about your region related to the key course topics covered so far. Include in this document a record or your efforts to answer the questions so far.
Capstone Project Stage 2
Capstone Project Stage 2
Water, crops, and climate
The diagram below summarizes the topics you will explore in Stage 2 for your assigned region.
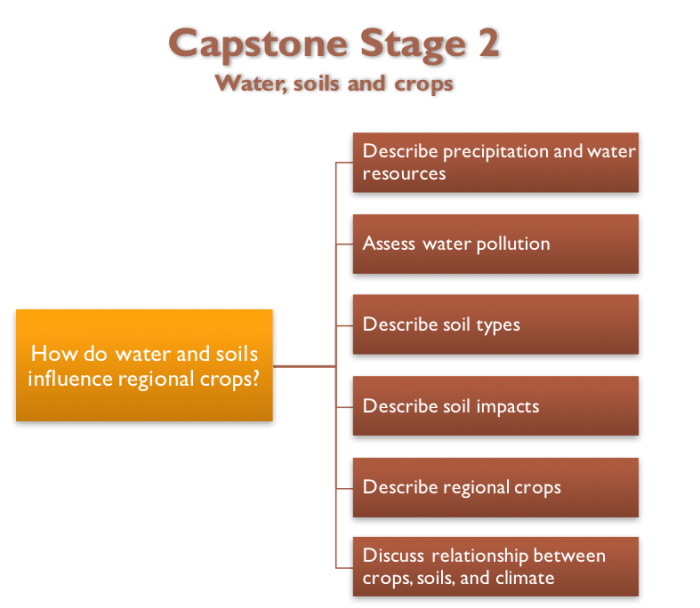
Capstone Stage 2 - Water, soils, and crops
How do water and soils influence regional crops?
- Describe precipitation and water resources
- Assess water pollution
- Describe soil types
- Describe soil impacts
- Describe regional crops
- Discuss the relationship between crops, soils, and climate
What to do for Stage 2?
- Download and complete the CapstoneProject_Stage2.docx worksheet that contains a table summarizing the data you’ll need to collect to complete this stage. Remember, you need to think deeply about each response and write responses that reflect the depth of your thought as informed by your research.
- Add relevant data to your PowerPoint file.
- Add questions and continue to research the questions in your word file.
- Capstone Project Overview: Where do you stand?
- At this stage, you should have started to investigate your assigned region and have added information, maps, and data to your worksheets and PowerPoint file for Stages 1 and 2.
Upon completion of stage 2, you should have at this point:
- Confirmed which region you will study for your capstone project and identified the members of your group.
- Initiated research and data compilation in the Stages 1 and 2 sections of the Future Food Scenarios table.
- a. Stage 1: Regional food setting, history of regional food systems, soil types
- b. Stage 2: Water resources, c, ops, and climate
- Created a PowerPoint file to hold the data that you are collecting about the food system of your assigned region. The information you may have:
- a. Labeled map of your region
- b. Soil map of your region
- c. Precipitation and temperature map of your region
- d. Major crops and crop families grown in your region
- Compiled an initial list of questions you have about your region related to key course topics and initiated significant efforts to answer.
Capstone Project Stage 3
Capstone Project Stage 3
Vulnerability and Resilience
At this stage, you should have collected quite a bit of data related to the physical environment of your region (water, soils, and climate) as well as related to the regional food system, including the history of the regional food system and which crops are grown in your region. You may also have discovered some impacts that the regional food system is having on soil and water resources in the region.
In stage 3, you will explore the vulnerabilities in your regional food system and the potential resilience of the system. The diagram below summarizes what you will cover in Stage 3.
Capstone Stage 3 (soil/crop management, pests, and climate change)
- System stressors and management strategies:
- describe soil conservation practices
- describe pest management strategies
- discuss agrobiodiversity of region
- discuss future climate scenarios
What to do for Stage 3?
- Download and complete the CapstoneProject_Stage3.docx worksheet that contains a table summarizing the data you’ll need to collect to complete this stage. Remember, you need to think deeply about each response and write responses that reflect the depth of your thought as informed by your research.
- Add questions and continue to research the questions in your word file.
- Keep track of all of the resources and references you use.
- Add relevant data, maps, and figures to your PowerPoint file.
Capstone Project Stage 4
Capstone Project Stage 4
Strategies for Sustainability
Stage 4 is the last piece of data gathering and research that you need to do.
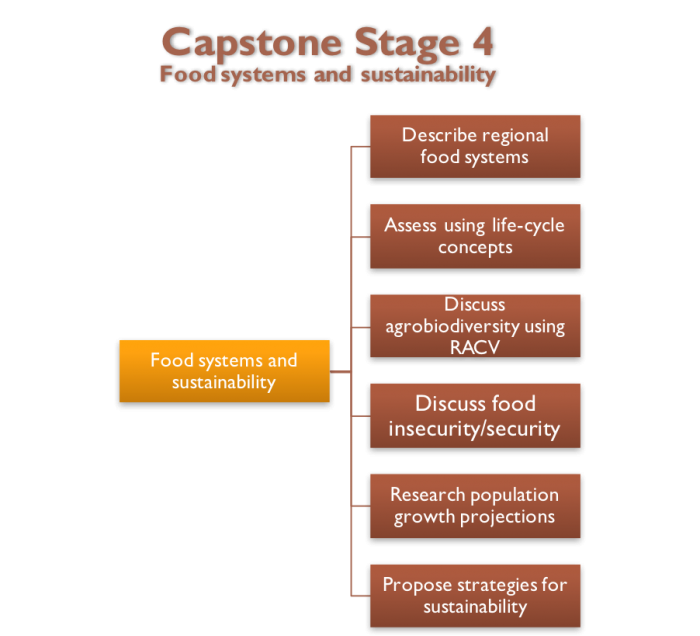
- describe regional food systems
- assess using the life-cycle concepts
- discuss agrobiodiversity using RACV
- discuss food insecurity/security
- research population growth projections
- propose strategies for sustainability
What to do for Stage 4?
- Download and complete the CapstoneProject_Stage4a.docx worksheet that contains a table summarizing the data you need to collect to complete this stage. Remember, you need to think deeply about each response and write responses that reflect the depth of your thought as informed by your research.
- Add questions and continue to research the questions in your word file.
- Keep track of all of the resources and references you use.
- Add relevant data, maps, and figures to your PowerPoint file