Module 4.2: Impacts of Food Production on Water Resources
Module 4.2: Impacts of Food Production on Water Resources
Introduction
Agricultural food production impacts water resources by depleting quantities of both surface water and groundwater and by polluting surface and groundwater with pesticides and fertilizers. Module 4.2 includes a brief introduction to the impacts of agriculture on water resources, followed by two case studies: the Colorado River (flow depletion and salinity) and the Mississippi River (nutrients, eutrophication, and the hypoxic zone in the Gulf of Mexico).
In completing this module, you will be able to:
- Attribute major water pollutants to appropriate agricultural sources
- Summarize the major impacts of agriculture on water resources
- Relate nutrient loading from fertilizer use to the dead zone in the Gulf of Mexico
Agricultural production has significant impacts on both the quality and quantity of surface and groundwater resources around the globe. In this unit, we'll look at how agricultural activities can contribute to water pollution, and we'll also consider how the diversion of irrigation water from both surface and groundwater resources creates significant impacts on those water resources and the ecosystems they sustain. Some of the critical issues connecting agricultural activities with water resource quality and quantity are:
- Agricultural groundwater removal generally exceeds the natural recharge rate, and groundwater overpumping causes irreversible land settling and loss of aquifer storage capacity.
- Surface water diversion contributes to downstream ecosystem deterioration.
- Agricultural non-point source pollution is an important contributor to water quality degradation.
Impacts of Water Withdrawals
As discussed in the first part of Module 4, in regions where precipitation is insufficient to grow crops, irrigation water is drawn from lakes, rivers, and aquifers to supplement the insufficient or unreliable precipitation. Water diversions for irrigation can have impacts on both surface and groundwater resources.
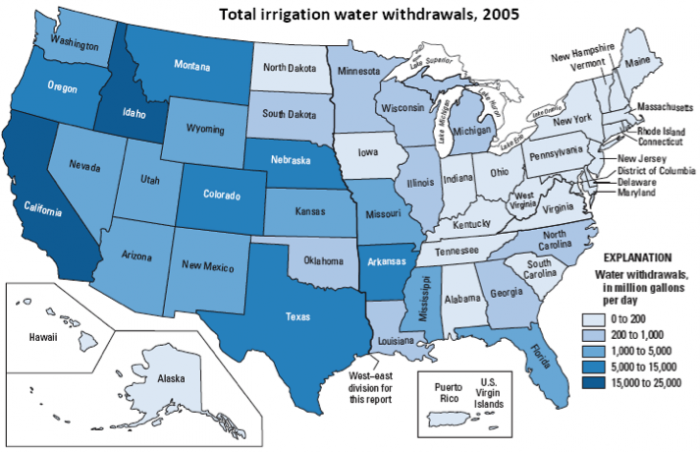
We saw earlier in this module that the western US receives less precipitation than the eastern US. What does that mean for irrigation needs? The western US withdraws more water from lakes, rivers, and groundwater for irrigation than the eastern US (Figure 4.2.1). These water withdrawals are not without impacts, as we will see throughout the rest of this module. Figure 4.2.1 maps the water withdrawal data we explored in the previous unit. Do you remember the three states in the US that diverted the most water for irrigation in the US? California, Idaho, and Colorado. But Nebraska irrigated more acres than both Idaho and Colorado. In the map in Figure 4.2.1, you can clearly see the states that use the most irrigation water. Next, we'll look at some of the impacts of surface and groundwater withdrawals.
Impacts of Surface Water Withdrawals for Irrigation
Impacts of Surface Water Withdrawals for Irrigation
The storage and redistribution of water by dams, diversions, and canals has been a key element in the development of civilizations. Large-scale water control systems, such as on the Nile in Egypt or the Colorado River in the southwestern U.S. make it possible to support large cities and millions of hectares of agricultural land. As the population grows and water diversions increase, serious questions are being raised about the environmental costs of these large water management systems.
Agricultural water withdrawals are placing significant pressure on water resources in water-scarce regions around the globe (Figure 4.2.2). If more than 20 percent of a region's renewable water resources are withdrawn, the region is in a state of water scarcity and the water resources of the region are under substantial pressure. If the withdrawal rises to 40 percent or more, then the situation is considered critical and evidence of stress on the functions of ecosystems becomes apparent. More than 40% of the world's rural population lives in river basins that are physically water-scarce and some regions, such as parts of the Middle East, Northern Africa, and Central Asia, are already withdrawing water in excess of critical thresholds (FAO 2011).
In order to divert water from rivers, diversion structures or dams are usually constructed and create both positive and negative effects on the diverted river system. Dams can provide a multitude of benefits beyond their contribution to storage and diversion for agricultural uses. Dams can contribute to flood control, produce hydroelectric power, and create recreational opportunities on reservoirs. Negative impacts of dams and agricultural diversions include:
- Habitat fragmentation – blocks fish passage
- Reduction in streamflow downstream, which then results in changes in sediment transport, and in floodplain flooding
- Changes in water temperature downstream from a dam
- Evaporation losses from reservoirs in hot, dry climates
- Dislocation of people
- Sedimentation behind dam fills in reservoirs with sediment and reduces their useful lifespan
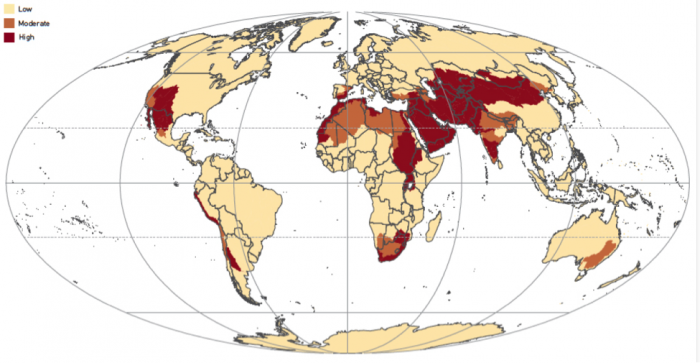
This world map shows that water famine especially high in the Southwestern United States and large areas of Africa, the Middle East, and South Asia.
Impacts of Groundwater Withdrawals for Irrigation
Impacts of Groundwater Withdrawals for Irrigation
Where surface water supplies are insufficient, groundwater is often used for irrigation (Figure 4.2.3). Agriculture uses about 70% of the groundwater pumped for human use globally and about 53% of the groundwater pumped in the US (USGS: Groundwater use in the United States [3]). In some parts of the world, groundwater is pumped at a faster rate than natural processes recharge the stored underground water. Groundwater use where pumping exceeds recharge is non-renewable and unsustainable.
Another problem that may occur in some aquifers with excessive groundwater pumping is a compaction of the aquifer and subsidence of the ground surface. When the water is pumped from the pore spaces in the aquifer, the pore spaces compress. The compression of millions of tiny pore spaces in hundreds of meters of aquifer material manifests on the surface as subsidence. The ground elevation actually decreases. Subsidence from groundwater pumping is irreversible and leaves the aquifer in a condition where it cannot be recharged to previous levels.
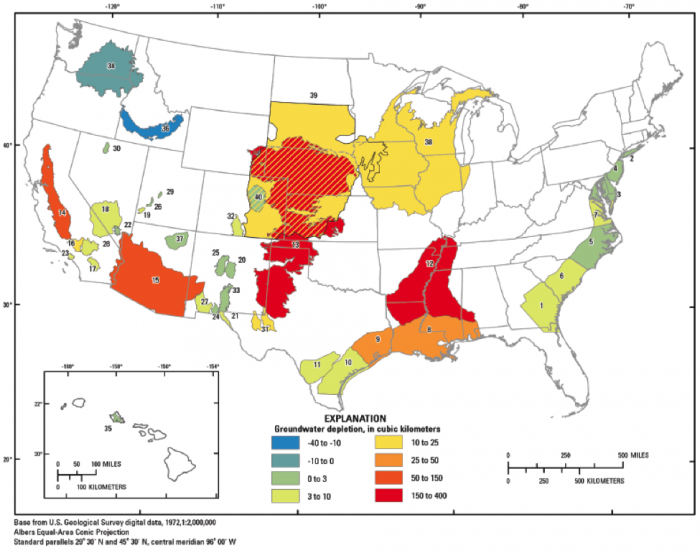
Our reliance on and depletion of groundwater resources is becoming a global concern as aquifers are being pumped at unsustainable rates in the US (Figure 4.2.4) and all over the world. Enhanced irrigation efficiencies and conservation measures are being implemented when possible to prolong the life of some aquifers. Unfortunately, groundwater is often the water resource that we turn to in times of drought or when other surface-water resources have been depleted. For example, in California during the recent drought, farmers drilled wells and used groundwater to save their crops when surface water resources were not available.
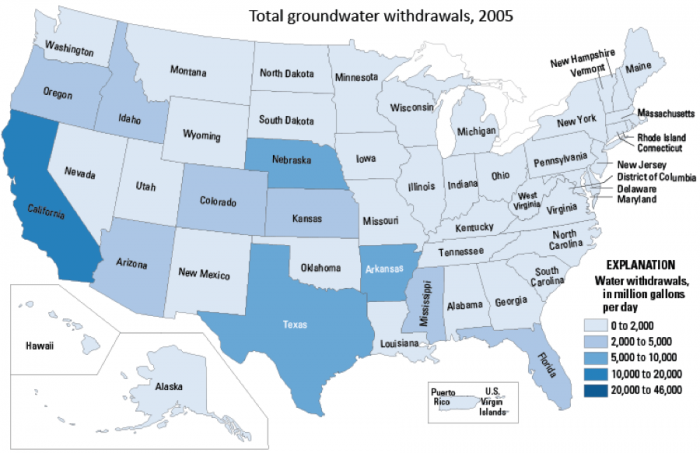
This map of the U.S. shows total groundwater withdraws by state, in millions of gallons per day. California has the highest at 20,000 - 60,000. Nebraska follows at 10,000 - 20,000. Texas and Arkansas are 5,000 - 10,000, Mississippi, Florida, Colorado, Kansas, Arizona, Oregon, and Idaho are each 2,000 - 5,000. The rest of the country is 0 - 2000.
Knowledge Check
Read the following article:
Rosenberg, David M., Patrick McCully, and Catherine M. Pringle. "Global-scale environmental effects of hydrological alterations: introduction. [6]" BioScience 50.9 (2000): 746-751.
Water Quality Impacts
Water Quality Impacts
Runoff from agricultural areas is often not captured in a pipe and discharged into a waterway; rather it reaches streams in a dispersed manner, often via sub-surface pathways, and is referred to as non-point source pollution. In other words, the pollutants do not discharge into a stream or river from a distinct point, such as from a pipe. Agricultural runoff may pick up chemicals or manure that were applied to the crop, carry away exposed soil and the associated organic matter, and leach materials from the soil, such as salts, nutrients or heavy metals like selenium. The application of irrigation water can make some agricultural pollution problems worse. In addition, runoff from animal feeding operations can also contribute to pollution from agricultural activities.
The critical water quality issues linked to agricultural activities include:
- Fertilizers – nutrients (nitrogen and phosphorus)
- Eutrophication – dead zones
- Pesticides
- Soil erosion
- Animal Feeding Operations
- Organic matter
- Nutrients
- Irrigation and return flows
- Salinity
- Selenium
Check Your Understanding
Review the following fact sheet on agricultural impacts on water quality:
Protecting Water Quality from Agricultural Runoff, 2005, EPA Fact Sheet on Agricultural Runoff [7]
Colorado River Case Study
Colorado River Case Study
Flow Depletion and Salinity
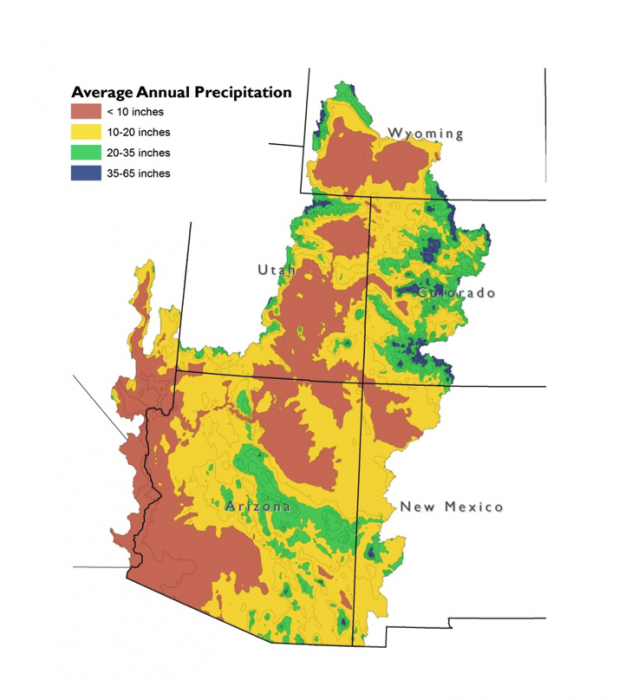
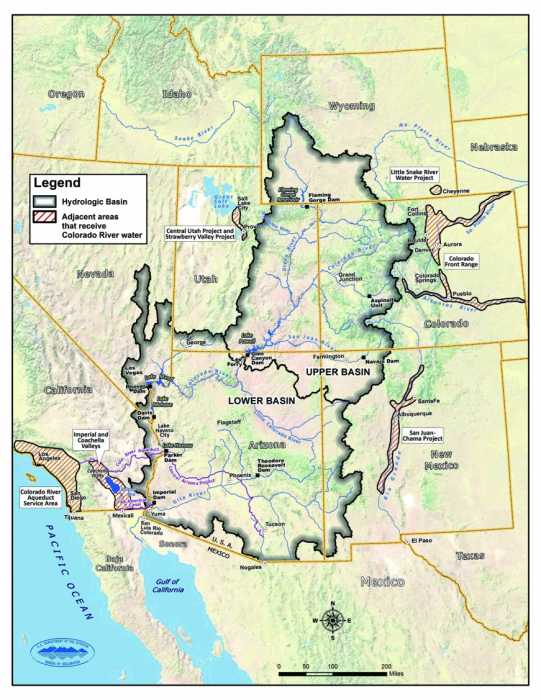
The Colorado River in the southwestern U.S. is an excellent case study of a river that is highly utilized for irrigation and agriculture. A majority of the Colorado River’s drainage basin has an arid or semi-arid climate and receives less than 20 inches of rain per year (Figure 4.2.5), and yet the Colorado River provides water for nearly 40 million people (including the cities of Los Angeles, San Diego, Phoenix, Las Vegas, and Denver) and irrigates 2.2 million hectares (5.5 million acres) of farmland, producing 15 percent of U.S. crops and 13 percent of livestock (USBR 2012). Much of the irrigated land is not within the boundaries of the drainage basin, so the water is exported from the basin via canals and tunnels and does not return to the Colorado River (Figure 4.2.6).
The net results of all of these uses of Colorado River water (80 percent of which are agricultural) in both the U.S. and Mexico are that the Colorado River no longer reaches the sea, the delta is a dry mudflat, and the water that flows into Mexico is so salty as a result of agricultural return flows that the U.S. government spends millions of dollars per year to remove salt from the Colorado River.
Many farmers in the Colorado River basin are working to use Colorado River water more efficiently to grow our food and food for the animals that we eat. Watch the video below and answer the questions to learn more about farming in the Colorado River basin.
Check your Understanding
Watch the following video then answer the questions below
Video: Resilient: Soil, water and the new stewards of the American West (10:13)
Click for transcript of the Resilient: Soil, water and the new stewards of the American West video
Narrator: A drop of water from a sprinkler on a quiet Los Angeles street. A shower head in a Las Vegas hotel. Agricultural land in California's Imperial Valley. Where does all this water come from? The Colorado River. In 1922, representatives from seven states gathered at Bishop’s Lodge New Mexico to sign the Colorado River Compact, an agreement on how to allocate water in this precious river system. But that River had more water then, than it does today. The Colorado River Basin touches the lives of every American. The river system runs through seven states in the US, and two in Mexico, and supplies water for over 36 million people. It also irrigates over five million acres of cropland and provides eighty percent of our winter produce, all from one river. And agriculture is the first to feel the pressure. At the headwaters of the Colorado River, farmers and ranchers are creating a toolbox of resilience. They save water with efficient technology and by building healthy soil.
Brendon Rockey, Rockey Farms, Center, Colorado: My grandpa always had a philosophy on this farm that you have to take care of the soil before the soil can take care of you, and he just felt like we had gotten away from that. That's the number one thing with everybody. is yield, yield, yield. Everybody wants just big production, you know, so that's why you want to dump on the fertilizer, kill off anything that poses a threat. It's all about production. We put more of an emphasis on quality. And what's really nice is when you put the emphasis on quality, the quantity usually comes along with it.
Narrator: And he also uses less water. How? By managing his soil more efficiently and working with nature instead of against it. Brendon rotates his potato crops with green manure, or cover crops, that enhance soil health while reducing his dependence on pesticides, fertilizers, and water.
Narrator: Unhealthy soil lacks life. Often a crust forms on its surface. When a crop is watered, very little soaks into the soil. Instead, it sits on top and is left to evaporate or run off. This land often has to be watered more frequently to get water to the crops. Healthy soils teem with life and are often built when farmers plant a mix of cover crops that add nutrients to the soil. When these plants die they become organic matter which helps store water in the soil. That means farmers can irrigate less, and have more certainty in times of drought.
Brendon Rockey: The reason we got into cover cropping was a response to a drought. Now that we've brought in more diverse crops, that have diverse root systems, which actually help benefit the water use efficiency as well, we've regenerated the soil to the point now where I'm growing a potato crop on about 12 to 14 inches of irrigation water per year. We're focusing on the soil, we're investing in the soil and we're bringing up for the functionality of the soil back to its optimum range.
Mike Jensen, Homegrown Biodynamic Farm, Bayfield, Colorado: A farm after 20 years should have much better soil than when it started. The best thing I do for my land is cover cropping. It rejuvenates the soil keeps everything happy, gets all the flora and fauna in balance. It's not about production this year, it's about production for the next 30 years.
Mike Nolan, Mountain Roots Produce, Mancos, Colorado: One thing I've learned from a bunch of folks, old-timers I've worked with is, do your best to not ever have any bare ground, nothing open, no open soil. I mean even in nature, even in the desert, technically there are things covering the ground. There's things, fungi and bacteria, that are holding the ground together. So what I did about three weeks ago is I planted out this oats crop. I’m not gonna harvest this for the seed or anything, but what it's going to do, it's going to hold moisture in here.
Cynthia Houseweart, Princess Beef Company, Hotchkiss, Colorado: Right now we're in full bloom, but what I like to see is a variety of plants. I don't want to just see straight alfalfa, I want to see grass and, and clover. I don't want bare ground. If we didn't have irrigation water, we would be a desert. This would be sagebrush, cedar trees. This, the water is what creates our livelihood. We graze during the growing season. So the conventional thing is, you move your cows off your pastures, grow them and cut them for hay. What we do instead of cutting them for hay, we graze them.
Narrator: Cynthia waters, using a center pivot. As it moves across her fields, the cattle follow behind eating fresh grass.
Cynthia: And the things they trample in, and their manure, adds to the soil, feeds the soil. It breaks down, turns into humus. The soil becomes more like a sponge and can suck up water that we put on it and rain, so the soil improves, which means the plants grow better and then our cows look better.
Dan James, James Ranch, Durango, Colorado: When you build topsoil, you increase the capillary action of the soils ability to retain water; and the less frequent you're applying your water, the more those roots have to go after that water, as it recedes into the ground. And so now you have all these roots below the surface, and all of a sudden here comes your cow. She comes in and she clips that off. Now your plant’s this high and the plant sheds the same proportion of roots. Now you're adding organic material and you're growing topsoil.
Strengthening the soil is also a concern of Steve Ela, a fruit grower in Hotchkiss Colorado. With precise tools like micro sprinklers and permanent drip irrigation, Steve can use water precisely when and where he needs it most, and his soil is healthy enough to efficiently deliver that water to his crops.
Steve Ela, Ela Family Farms, Hotchkiss, Colorado: For us on the farm it's the difference between using first furrows and the micro specters and now drip. It’s been a bit of an evolution of thinking. So for me it's been, it's not that really one system is better or worse, but it's an evolution of thinking, of trying to manage our water better, trying to use the system of irrigation management and cover cropping to manage our weeds, and also to just only to grow better fruit and healthier trees. Yes, it's expensive on the upfront cost, but it's a system then we can use for 20 years. It's very efficient. I think it probably saves us that much, you know, in water.
Narrator: It's innovation that saves water and money, while increasing soil fertility. It's also innovation that includes technology. Water data delivered by weather satellites, GPS, and even smart sensors like those used by Randy Meaker, a Colorado wheat and corn grower. He uses cover crops to improve his soil and by monitoring soil moisture, he can more effectively use the center pivots to reduce water use.
Randy Meaker: There are huge efforts going on right now, trying to figure out how we and the western United States can solve the shortages of water due to drought conditions. There's two ways to keep water in a bucket and one is to put more water in at the top, the other one is to take less water out at the spigot. People in the lower Basin States, where the population centers are, they're looking for us to supply them more water. But what we're looking for is a responsible use from them. What good is it for me to be restricted if I realize that we're still irrigating lawns, we're still washing cars.
Narrator: Water is the lifeblood of our Western landscape. Farmers and ranchers are as essential to it as the water itself. The water challenges these farmers face are many, but across the country they gather to share their water knowledge and provide each other with valuable support. They build community and grow good food, while stewarding both their land and their water. They are the water stewards of the Colorado River Basin.
Mississippi River Case Study
Mississippi River Case Study
Dead Zone in the Gulf of Mexico
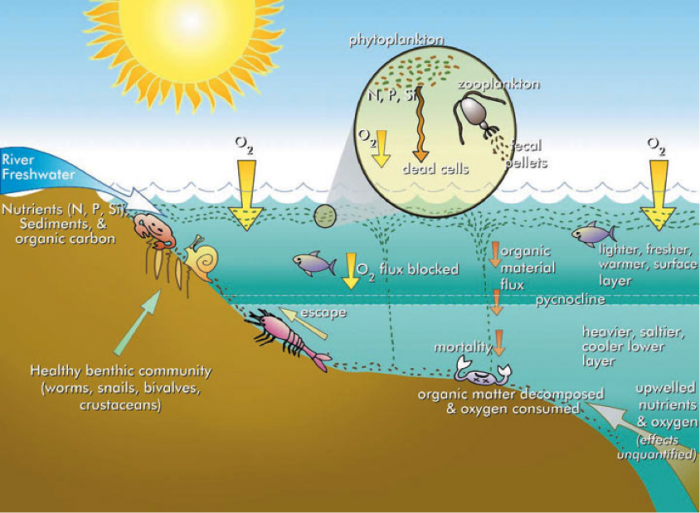
Agricultural runoff can contribute pollutants to natural waters, such as rivers, lakes, and the ocean, that can have serious ecological and economic impacts, such as the creation of areas with low levels of dissolved oxygen called dead zones caused by pollution from fertilizers. Nutrients, such as nitrogen and phosphorus, are elements that are essential for plant growth and are applied on farmland as fertilizers to increase the productivity of agricultural crops. The runoff of nutrients (nitrogen and phosphorus) from fertilizers and manure applied to farmland contributes to the development of hypoxic zones or dead zones in the receiving waters through the process of eutrophication (Figure 4.2.7).
Watch the following videos from NOAA’s National Ocean Service that show how dead zones are formed and explain the dead zone in the Gulf of Mexico:
- Video: Happening Now: Dead Zones in the Gulf 2017 [10] (2:33) (Transcript [11])
- Video: Hypoxia [12] (3:51) (Text description [13] - video has no narration, just on screen text)
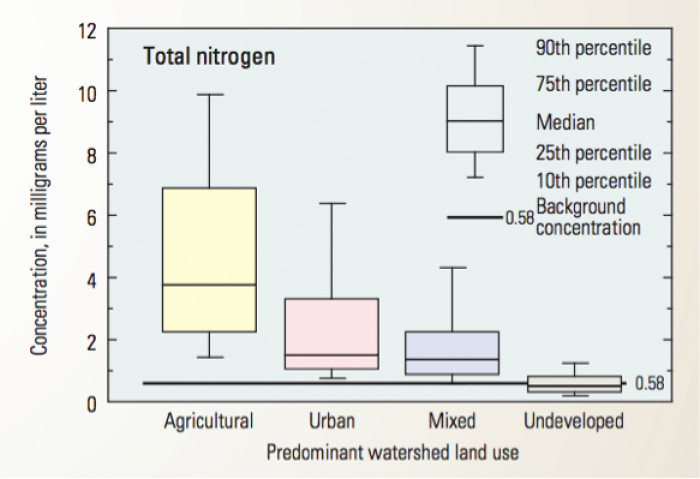
The nutrients that make our crops grow better also fertilize phytoplankton in lakes and the ocean. Phytoplankton are microscopic organisms that photosynthesize just like our food crops. With more nitrogen and phosphorus available to them, they grow and multiply. When the phytoplankton dies, decomposers eat them. The decomposers also grow and multiply. As they’re eating all of the abundant phytoplankton, they use up the available oxygen in the water. The lack of oxygen forces mobile organisms to leave the area and kills the organisms that can’t leave and need oxygen. The zone of low oxygen levels is called a hypoxic or dead zone. Streams flowing through watersheds where agriculture is the primary land use exhibit the highest concentrations of nitrogen (Figure 4.2.8).
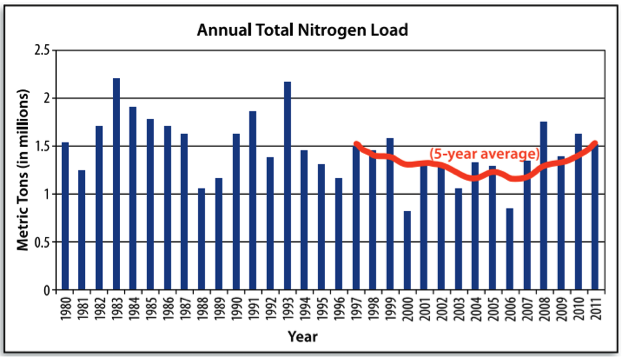
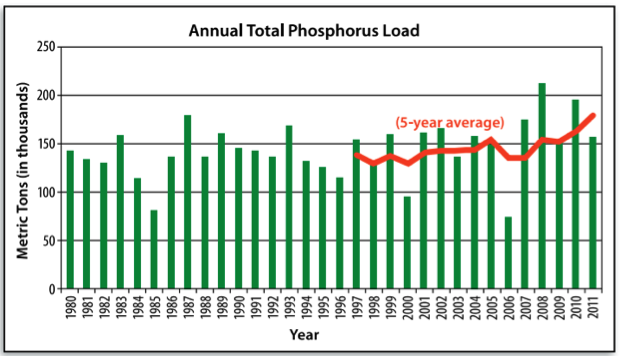
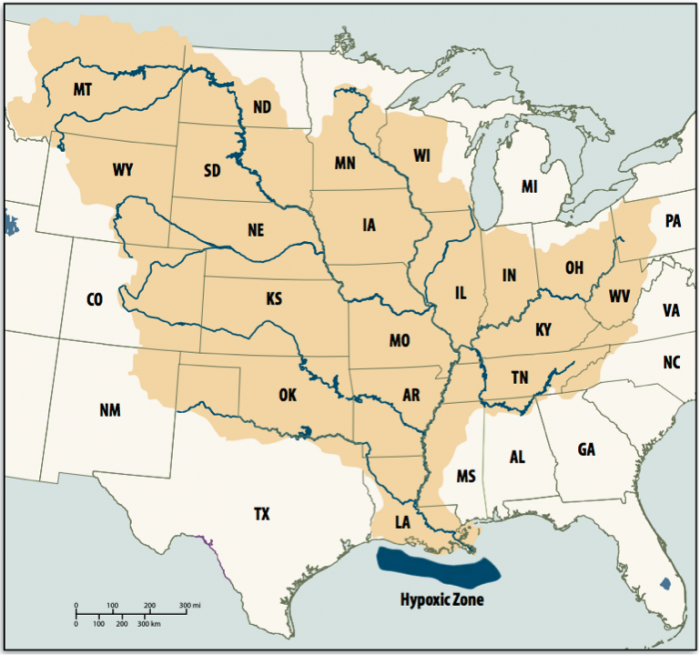
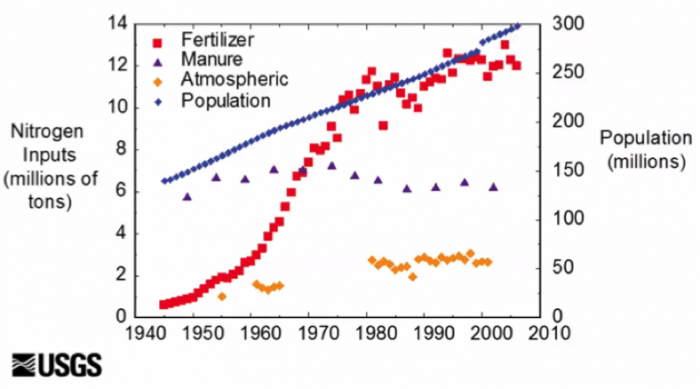
The Mississippi River is the largest river basin in North America (Figure 4.2.9), the third largest in the world, and drains more than 40 percent of the land area of the conterminous U.S., 58 percent of which is very productive farmland (Goolsby and Battaglin, 2000). Nutrient concentrations in the lower Mississippi River have increased markedly since the 1950s along with increased use of nitrogen and phosphorus fertilizers (Figure 4.2.10). When the Mississippi River’s nutrient-laden water reaches the Gulf of Mexico, it fertilizes the marine phytoplankton. These microscopic photosynthesizing organisms reproduce and grow vigorously. When the phytoplankton die, they decompose. The organisms that eat the dead phytoplankton use up much of the oxygen in the Gulf’s water resulting in hypoxic conditions. The resulting region of low oxygen content is referred to as a dead zone or hypoxic zone. The dead zone in the Gulf of Mexico at the mouth of the Mississippi River has grown dramatically and in some years encompasses an area the size of the state of Connecticut (~5,500 square miles) or larger. Hypoxic waters can cause stress and even cause the death of marine organisms, which in turn can affect commercial fishery harvests and the health of ecosystems.
Optional Reading
Additional Resources about the Dead Zone in the Gulf of Mexico
- NOAA sponsored program out of LSU runs the hypoxia net website with great information (Hypoxia In the Gulf of Mexico [17])
- Hypoxia and Eutrophication from the National Centers for Coastal Ocean Science [18] of the NOAA National Ocean Service
- USGS Fact Sheet 105-03, 2003, Nutrients in the Upper Mississippi River: Scientific Information to Support Management Decisions [19]
Managing Runoff to Reduce the Dead Zone
Managing Runoff to Reduce the Dead Zone
What can be done to reduce the size of the dead zone?
The dead zone in the Gulf of Mexico is primarily a result of runoff of nutrients from fertilizers and manure applied to agricultural land in the Mississippi River basin. Runoff from farms carries nutrients with the water as it drains to the Mississippi River, which ultimately flows to the Gulf of Mexico. If a number of nutrients reaching the Gulf of Mexico can be reduced, then the dead zone will begin the shrink.
Since 2008, the Hypoxia Task Force, led by the U.S. Environmental Protection Agency and consisting of five federal agencies and 12 states, has been working to implement policies and regulations with the aim of reducing the size of the dead zone in the Gulf of Mexico. Many of the strategies for reducing nutrient loading target agricultural practices including (USEPA, The [20]Sources [20] and Solutions: Agriculture [20]).
- Nutrient management: The application of fertilizers can vary in amount, timing, and method with varying impacts on water quality. Better management of nutrient application can reduce nutrient runoff to streams.
- Cover Crops: Planting of certain grasses, grains, or clovers, called cover crops can recycle excess nutrients and reduce soil erosion, keeping nutrients out of surface waterways.
- Buffers: Planting trees, shrubs, and grass around fields, especially those that border water bodies, can help by absorbing or filtering out nutrients before they reach a water body.
- Conservation tillage: Reducing how often fields are tilled reduces erosion and soil compaction, builds soil organic matter, and reduces runoff.
- Managing livestock waste: Keeping animals and their waste out of streams, rivers, and lakes keep nitrogen and phosphorus out of the water and restores stream banks.
- Drainage water management: Reducing nutrient loadings that drain from agricultural fields helps prevent degradation of the water in local streams and lakes.
Watch the following video from the US Department of Agriculture about strategies to reduce nutrient loading into the Mississippi River:
Video: Preventing Runoff Into The Mississippi River (1:44)
EPA website about nutrient pollution and some solutions to nutrient pollution: The Sources and Solutions: Agriculture [21]
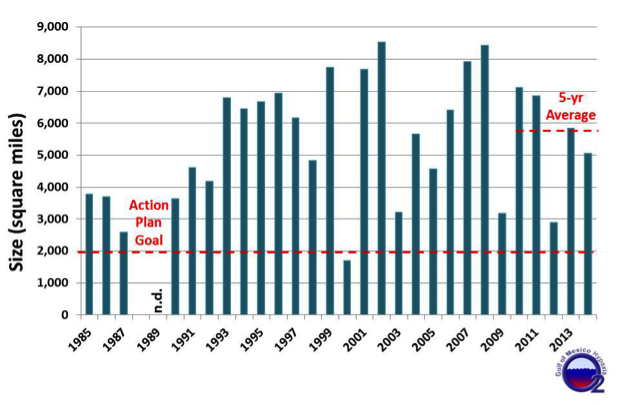
Activate Your Learning
Review the graphs below and answer the questions that follow. Figure 4.2.11 presents the size of the hypoxic zone in the Gulf of Mexico from 1985 to 2014. The U.S. Environmental Production Agency led a task force in 2008 that identified a goal to reduce the five-year average of the size of the dead zone to less than 2,000 square miles by 2015.