Module 1 - Geographic Perspectives
Introduction
Introduction
Did you complete the Course Orientation?
Before you begin this course, make sure you have completed the Course Orientation.
About Module 1
Here you will be introduced to fundamental geographic topics including scale, cartography and GIS and human-environment interactions. These topics are introduced using case studies and specific examples. The central objective of this lesson is for you to understand key concepts in geography and how they apply to this course. You will also be introduced to some key concepts that will be returned to throughout the course.
What will we learn in Module 1?
By the end of Module 1, you should be able to:
- examine several major themes of geography, particularly scale, cartography and GIS, and human-environment interactions;
- consider how the links between spatial and temporal scales help explain decision-making and environmental change;
- understand why social science is important to the study of the natural environment;
- be introduced to topics that will be discussed in greater detail later in the course.
What is due for Module 1?
Module 1 will take us one week to complete. See the Syllabus page in Canvas for specific due dates.
| Requirement | Location | Submitting Your Work |
|---|---|---|
| Reading Assignment: State Department Office of the Geographer | Introduction to Geography page | No submission |
| Citation Training (Part 1) Assignment | End of Module 1 | Complete Check You Knowledge quiz |
Questions?
If you have any questions, please post them to our Course Q & A discussion forum in Canvas. I will check that discussion forum often to respond. While you are there, feel free to post your own responses if you, too, are able to help out a classmate. If you have a more specific concern, please send me a message through Inbox in Canvas.
Introduction to Geography
Introduction to Geography
You are now in the process of doing something that few other Americans have done: taking a college-level geography course. In contrast with other countries such as the United Kingdom, France, and India, most American colleges and universities do not even have a geography department. Because of this, you might not be familiar with geography as an advanced discipline of study and professional activity. This module is designed to introduce you to the field of geography as it is practiced at Penn State and beyond.
The Greeks were the first to use the term geography, which literally translates as “to describe the Earth.”
The geographer's task is nothing less than to understand and explain the entire world as we live in it. The geographer focuses on what's happening on Earth’s surface. If it’s below the surface, it’s more likely to be studied in the Geosciences Department. If it’s above the surface, it’s more likely to be studied in the Meteorology Department. But there is a lot of overlap among these three fields of study, which is why they are grouped together in Penn State’s College of Earth and Mineral Sciences, along with the Energy and Mineral Engineering Department and the Materials Science and Engineering Department.
The Penn State Geography Department (and many others) divides geography into four sub-disciplines:
- Human Geography: how human societies are arranged and interact around the world, including economies, governments, and cultures;
- Physical Geography: how natural and geophysical phenomena are arranged and interact around the world, including ecosystems, mountain ranges, bodies of water, and climates;
- Environment & Society Geography: interactions between humans and the natural and geophysical world, including human impacts on the environment and environmental impacts on humanity;
- Geographic Information Sciences: techniques for acquiring, analyzing and displaying geographic information, including satellites, software programs, and maps.
Geography 30 is Penn State's introductory course for environment & society geography. It is offered to students at both the University Park campus and the World Campus.
At University Park, Geography 30N is a core course for the undergraduate programs in Geography. Introductory courses for the other subdisciplines are Geog 010 (physical), 020 (human), and 160 (GISciences). Geog 040 is World Regional Geography, which presents both the human and physical geography of every region of the world.
At World Campus, Geography 30N is a major requirement for both the Bachelor of Arts and Bachelor of Science degrees in Energy and Sustainability Policy. For both University Park and World Campus, Penn State also offers many activities and resources on sustainability through the Center for Sustainability and the Institutes of Energy and the Environment.
This broad focus makes geography a challenging and exciting discipline. Geography intersects with many other disciplines across the natural and social sciences, engineering, and the humanities. For example, biogeography intersects with biology; political geography intersects with political science.
One hallmark of geography is place-based inquiry. Geographers recognize that natural and social conditions are often unique to a specific region. In order to better understand a place's unique or unusual characteristics, geographers often perform field research, meaning that they go to a place and observe the natural and social conditions in that place. The place need not be remote. You can conduct field research simply by observing the place that you live in.
Geography today is a vibrant academic and professional discipline.
Geographers today work in a wide range of settings, including research, government, technology companies, and non-profits. Some specific examples can be found on the Geography Department's What Geographers Do page. Please scan this page to get a sense of the breadth of options available to geographers.
Reading Assignment: "MapQuest: Office of the Geographer Makes Information Visual"
The United States Department of State is responsible for managing international relations. It contains an Office of the Geographer that provides a range of geographic services in support of the State Department's international relations mission. To learn more about what the Office of the Geographer does, please read the article "MapQuest: Office of the Geographer Makes Information Visual." The article is on pages 30-33 of the March 2009 State Magazine.
As you read this, consider the following questions. What does the Office of the Geographer do? What types of geography does it use? What skill sets must its employees have? What international relations issues and incidents has it been involved in? Why is geography important to international relations?
Scale
Scale
One of the central concepts in geography is scale. In very rough terms, scale refers to how big or small something is. That "something" could be an event, a process, or some other phenomenon. In geography, we often focus on spatial scale. Spatial scale is the extent of an area at which a phenomenon or a process occurs. For example, water pollution can occur at a small scale, such as a small creek, or at a large scale, such as the Chesapeake Bay. Spatial scale also refers to the area or spatial extent at which data about a phenomenon are aggregated to be analyzed and understood. For example, while there are differences in levels of pollution in different areas of the Chesapeake Bay, one may choose to aggregate water quality measurements to make a general statement about pollution in the bay as a whole.
Geographers not only are interested in the patterns of physical or social processes on the Earth at a given level of spatial organization (e.g., local, regional, or global), but they also want to know the interactions and feedbacks across different spatial scales. Geographers sometimes also discuss temporal scale, which is the duration or time length of a thing or process. Some examples can help us understand scale. Consider air pollution. This often exists at the scale of a city or metropolitan area. The city will have cars, factories, power plants, and other things that cause air pollution, and the air pollution will affect people who live in the city and breathe the air there. People elsewhere may not be significantly affected. (Note that sometimes the wind sends air pollution further away.) In contrast, climate change largely exists at the global scale. (We'll discuss climate change in greater detail later in the course.) This is because climate is a process that covers the whole planet. When we change the climate somewhere, we change it everywhere. Scale matters in understanding the interactions between humans and the environment.
A nice depiction of scale can be found in the following video (9:01):
PRESENTER: The picnic near the Lakeside in Chicago is the start of a lazy afternoon, early one October. We begin with a scene one meter wide, which we view from just one meter away. Now every 10 seconds, we will look from 10 times farther away, and our field of view will be 10 times wider. This square is 10 meters wide. And in 10 seconds, the next square will be 10 times as wide. Our picture will center on the picnickers, even after they've been lost to sight.
100 meters wide, a distance a man can run in 10 seconds. Cars crowd the highway. Powerboats lie at their docks. The colorful bleachers are Soldier Field. This square is a kilometer wide, 1,000 meters. The distance a racing car can travel in 10 seconds. We see the great city on the lake shore. 10 to the fourth meters, 10 kilometers, the distance a supersonic airplane can travel in 10 seconds.
We see first the rounded end of Lake Michigan, then the whole great lake. 10 to the fifth meters, the distance an orbiting satellite covers in 10 seconds. Long parades of clouds. The day's weather in the Middle West. 10 to the sixth, a one with six zeros. A million meters.
Soon the Earth will show as a solid sphere. We are able to see the whole Earth now, just over a minute along the journey. Earth diminishes into the distance, but those background stars are so much farther away. They do not yet appear to move.
A line extends at the true speed of light, in one second it half crosses the tilted orbit of the moon. Now we mark a small part of the path in which the Earth moves about the sun. Now the orbital paths of the neighbor planets, Venus and Mars, then Mercury. Entering our field of view is the glowing center of our solar system, the sun.
Followed by the massive outer planets, swinging wide and their big orbits. That odd orbit belongs to Pluto. A fringe of a myriad comets too faint to see completes the solar system. 10 to the 14th. As the solar system shrinks to one bright point in the distance, our sun is plainly now only one among the stars.
Looking back from here, we know four Southern constellations still much as they appear from the far side of the Earth. This square is 10 to 16th meters, one light year. Not yet out to the next star. Our last 10 second step took us 10 light years further. The next will be 100. Our perspective changes so much in each step now, that even the background stars will appear to converge.
At last we pass the bright star Arcturus, and some stars of the Dipper. Normal but quite unfamiliar stars and clouds of gas surround us as we traverse the Milky Way galaxy. Giant steps carry us into the outskirts of the galaxy. And as we pull away, we begin to see the great flat spiral facing us. That time and path we chose to leave Chicago has brought us out of the galaxy along a course nearly perpendicular to its disk.
The two little satellite galaxies of our own are the clouds of Magellan. 10 to the 22nd power, a million light years. Groups of galaxies bring a new level of structure to the scene. Glowing points are no longer single stars, but whole galaxies of stars seen as one. We passed the big Virgo cluster of galaxies among many others, 100 million light years out. As we approach the limit of our vision, we pause to start back home.
This lonely scene, the galaxies like dust, is what most of space looks like. This emptiness is normal. The richness of our own neighborhood is the exception. The trip back to the picnic on the lakefront will be a sped up version, reducing the distance to the Earth's surface by one power of 10, every two seconds. In each two seconds, we'll appear to cover 90% of the remaining distance back to Earth.
Notice the alternation between great activity and relative inactivity, a rhythm that will continue all the way into our next goal, a proton in the nucleus of a carbon atom beneath the skin on the hand of a sleeping man at the picnic. 10 to the ninth meters, 10 to the eighth. Seven, six, five, four, three, two, one. We are back at our starting point. We slow up at 1 meter, 10 to the zero power.
Now we reduce the distance to our final destination by 90% every 10 seconds. Each step much smaller than the one before. At 10 to the minus 2, one one-hundredth of a meter, one centimeter, we approach the surface of the hand. In a few seconds we'll be entering the skin, crossing layer after layer from the outermost dead cells into a tiny blood vessel within. Skin layers vanish and turn, an outer layer of cells, felty collagen.
The capillary containing red blood cells in a roughly lymphocyte. We enter the white cell, among its vital organelles, the porous wall of the cell nucleus appears. The nucleus within holds the heredity of the man in the coiled coils of DNA. As we close in, we come to the double helix itself, a molecule like a long twisted ladder, whose rungs of paired bases spell out twice in an alphabet of four letters, words of a powerful genetic message.
At the atomic scale, the interplay of form and motion becomes more visible. We focus on one commonplace group of three hydrogen atoms bonded by electrical forces to a carbon atom. Four electrons make up the outer shell of the carbon itself. They appear in quantum motion as a swarm of shimmering points. At 10 to the minus 10 meters, one angstrom, we find ourselves right among those outer electrons. Now we come upon the two inner electrons held in a tighter swarm.
As we draw toward the atom's attracting center, we enter upon a vast inner space. At last, the carbon nucleus, so massive and so small, this carbon nucleus is made up of six protons and six neutrons. We are in a domain of universal modules. There are protons and neutrons in every nucleus. Electrons in every atom. Atoms bonded into every molecule out to the farthest galaxy.
As a single proton fills our scene, we reach the edge of present understanding. Are these some quarks at intense interaction? Our journey has taken us through 40 powers of 10. If now the field is one unit, then when we saw many clusters of galaxies together, it was 10 to the 40th, or one and 40 zeros.
The video shows the same point in space on a broad range of scales, from the subatomic to the astronomical. In geography, we tend to focus on human scales, which are the scales of the world as we experience it. So, you will not need to know any particle physics or astronomy for Geog 30N, even though some of it may be relevant!
It is important to appreciate that phenomena can be considered or observed at multiple scales. For example, we can observe climate change at the global scale, since climate is a global process. However, we can also observe climate change at local scales. Climate change is caused by, among other things, many individual decisions to burn fossil fuels. Also, climate change impacts people and ecosystems in specific local places across the world. The causes and impacts are different in different places. If we only observed climate change at the global scale, we would miss this variation from one location to another. It's important to observe climate change - and many other important phenomena - at many scales so that we can fully understand what's going on.
Another example important to Geog 30N is deforestation. As with climate change, it helps to consider deforestation on many scales. An individual living in the Brazilian Amazon might decide to cut down a tree to collect firewood, to sell the wood, or to clear land for farming. If we think of deforestation just at this local scale, then we might understand it as a local event. However, the decision to cut down the tree can be connected to other political, economic, cultural, and environmental processes that operate at national, regional and international scales. For example, the decision to cut the tree is shaped in part by external economic markets: whether the tree could be sold for money, or whether the person could make money from engaging in other activities that require clearing patches of forest, such as raising cattle for beef. Trade agreements between Brazil and other countries shape the systems of economic exchange, and international demand for hardwoods such as mahogany (in the United States and Europe in particular) create incentives to deforest tropical rainforests. Therefore, the simple act of cutting down a tree in Brazil needs to be seen as connected to other economic and political processes that intersect and move across multiple scales.
The deforestation example highlights the important concept of globalization. Globalization is a hotly debated concept, but it is generally understood as the increasing integration of societies around the world through improvements in transportation and communication technologies. The integration can be economic, political, or cultural. Here are some examples:
* Economic Integration: Global freight shipping permits Brazilian trees to be sold to European consumers.
* Political integration: American environmental policies may limit the types or quantities of trees that can be imported from Brazil.
* Cultural integration: Globalized tastes for food can lead people from around the world to desire food products that can be grown in Brazil.
Globalization has impacted societies around the world as the sharing of products has contributed to the perception that cultures are losing their individuality.
One way to approach understanding relationships across scales is through commodity chains. A commodity chain contains the links between the collection of resources to their transformation into goods or commodities and, finally, to their distribution to consumers. Commodity chains can be unique depending on the product types or the types of markets (agriculture versus textiles for example). Different stages of a commodity chain can also involve different economic sectors or be handled by the same business. Figure 1.1 visualizes a simplified commodity chain for the seafood industry.
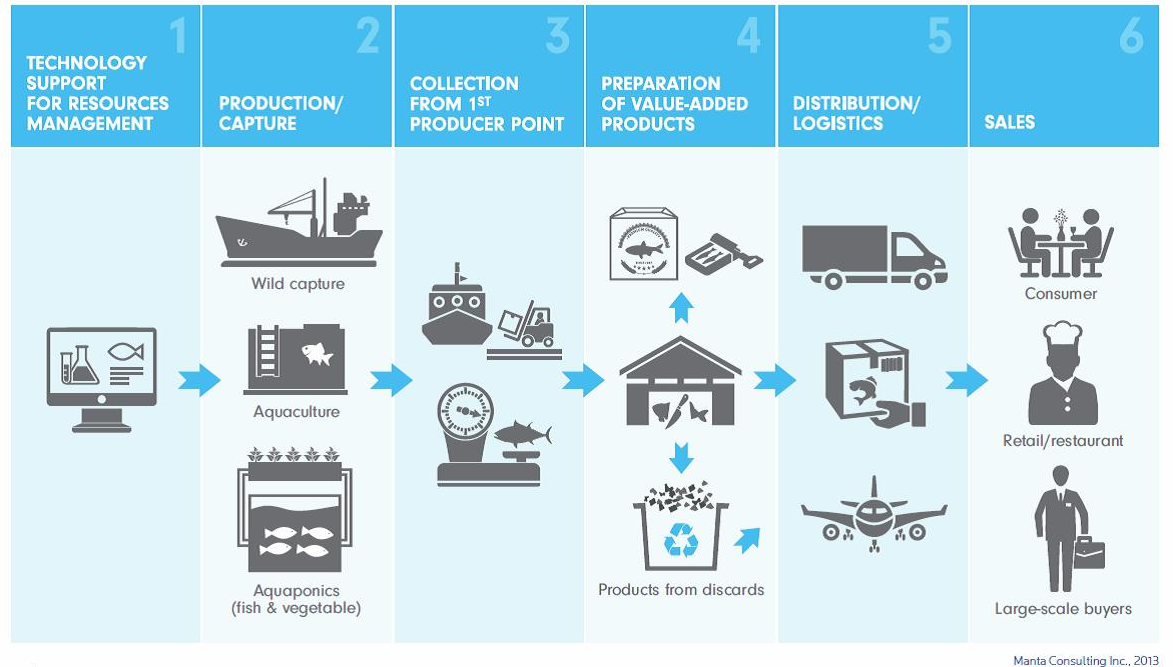
Click here to see a text version of Figure 1.1
Flowchart of the seafood supply chain:
1. Technology support for resources management leads to
2. Production/Capture: wild capture, aquaculture, aquaponics (fish & vegetable) leads to
3. Collection from 1st producer point leads to
4. Preparation of value-added product (ex. Butchering, packaging and waste) leads to
5. Distribution/Logistics (ex. Truck, plane etc) leads to
6. Sales: consumer, retail/restaurant/large-scale buyers.
Understanding the path that fish took on its way to our plates as it moves across the commodity chain allows us to think about the interconnections between capture/production (wild fisheries vs. aquaculture), generation (converting whole fish to other product forms such as fish fillets or canned fish), distribution and sales (transferring products to locations for consumption and selling products to consumers).
Consider This:
When you buy seafood, do you ask yourself, "Where does my seafood come from and how does it get to me?" Look at Figure 1.1 and try to place yourself on this supply chain. Where do you exist in terms of the production and consumption of seafood?
As we'll discuss in later modules, the global rise in seafood demand has caused the depletion of fish stocks. Unsustainable overfishing has emerged as a global issue and has its severe and irreversible impacts on human lives and marine biodiversity. As with fishermen catching more fish than the population can replace through natural reproduction, we need to think about our individual decisions and local patterns that contribute to sustainable practice. Our decisions and food choice are also linked to political and economic processes at multiple scales, but we need to think about the types of impacts our individual decisions have for the natural world.
Visualization
Visualization
Geography is regularly identified as the discipline that makes maps. While geography is, of course, much more than this, geographers do create maps to show how processes play out across space at various scales. Why maps? It's because maps are very effective at helping us see what's happening within some region. When spatial patterns are important - and they very often are - then looking at maps can be much more efficient and effective than looking at paragraphs of text or tables of data.
For example, suppose we want to learn the presidential election results by county in a given year, The animated map below shows the information. By displaying the information geographically, the map helps us learn what we want to know. In particular, the map makes it easier to identify the patterns in the data across space and over time. Throughout Geog 30N, we will view and even create maps to visualize spatial information.
See the raw data.
Cartographic Projection
The world is round, but maps are flat. A projection is a scheme for converting points on the round world to points on a flat map. There are many different types of projections, each with advantages and disadvantages. Some projections make it easy to see what is north, south, east, and west. Some projections make it easy to see how large a given land mass is. Some projections make it easy to navigate ships on the ocean. (Cartography has a long history of association with navigation.) Finally, some projections can even be used to advance political agendas, as this excerpt from the TV show The West Wing shows (four minute video):
[CJ]: hi, I'm sorry
[Dr. John Fallow]: oh?
[CJ]: sorry to be late
[Dr. John Fallow]: Not a problem
[CJ]: I'm CJ Cregg
[Dr. John Fallow]: of course you are I’m Dr. John Fallow with Dr. Cynthia Sales and Professor Donald Hyuk
[CJ]: Hyuk?
[Dr. John Fallow]: Hyuk
[CJ]: okay and you are the organization of cartographers for social equality
[Dr. John Fallow]: well we're from the OCSE we have many members.
[CJ] how many?
[Dr. John Fallow] 4,300 dues-paying members
[CJ]: what are the dues?
[Dr. John Fallow]: Now $20 a year for the newsletter
[CJ]: let's start
[Josh Lyman]: wait I want to see
[CJ]: this is Josh Lyman
[Dr. John Fallow]: Indeed you are
[CJ]: Josh this is Dr. Fallow and his Merry Men
[Dr. John Fallow]: yes
[CJ]: should we begin
[Dr. John Fallow]: yes. Plain and simple uh we'd like President Bartlet to aggressively support legislation that would make it mandatory for every public school in America to teach geography using the Peters projection map instead of the traditional Mercator
[Josh Lyman]: give me 200bucks and it's done
[Professor Donald Hyuk]: really?
[CJ]: No why are we changing maps
[Dr. Cynthia Sales]: because CJ the Mercator projection has fostered European imperialist attitudes for centuries and created an ethnic bias against a third world
[CJ]: really?
[Dr. John Fallow]: the German cartographer Mercator originally designed this map in 1569 as a navigational tool for European sailors. The map enlarges areas at the poles to create straight lines of constant bearing or geographic direction
[Dr. Cynthia Sales]: so it makes it easier to cross an ocean
[Dr. John Fallow]: but
[CJ]: yes
[Dr. John Fallow]: it distorts the relative size of nations and continents
[CJ]: are you saying the map is wrong
[Dr. John Fallow]: oh dear yes now look at Greenland
[CJ]: okay
[Dr. John Fallow]: now look at Africa
[CJ]: okay
[Dr. John Fallow]: the two land masses appear to be roughly the same size
[CJ]: yes
[Dr. John Fallow]: would it blow your mind I told you that Africa is in reality 14 times larger
[CJ]: yes
[Dr. Cynthia Sales]: here we have Europe drawn considerably larger than South America when it's six point nine million square miles South America is almost double the size of Europe's 3.8 million
[Professor Donald Hyuk]: Alaska appears three times as large as Mexico when Mexico is larger by 0.1 million square miles
[Dr. Cynthia Sales]: Germany appears in the middle of the map when it's in the northernmost quarter of the earth
[Josh Lyman]: Oh wait relative size is one thing but you're telling me that Germany isn't where we think it is
[Dr. John Fallow]: nothing's where you think it is
[CJ]: where is it?
[Dr. John Fallow]: I'm glad you asked. The Peters projection
[Dr. Cynthia Sales]: it has fidelity of axis
[Professor Donald Hyuk]: fidelity of position
[Dr. Cynthia Sales]: east-west lines are parallel and intersect north-south axes at right angles
[CJ]: what hell is that?
[Dr. John Fallow]: it's where you've been living this whole time should we continue?
[CJ]: uh-huh
[Dr. John Fallow]: so you're probably wondering what all of this has to do with social equality
[CJ]: no I'm wondering where France really is
[Josh Lyman]: guys we want to thank you very much for coming in
[CJ]: hang on we're gonna finish this
[Dr. John Fallow]: okay what do maps have to do with social equality you asked?
[Josh Lyman]: she asked
[Professor Donald Hyuk]: Salvatore Anatoly of the National Council for social studies argues in our society we unconsciously equate size with importance and even power
[Josh Lyman]: I'm going to check in on Tommy if these guys find Brigadoon on that map you'll call me right
[CJ]: probably not
[Josh Lyman]: okay
[Dr. John Fallow]: when third world countries are misrepresented they're likely to be valued less when Mercator maps exaggerate the importance of Western civilization when the top of the map is given him northern hemisphere and the bottom is given to the southern then people will tend to adopt top and bottom attitudes
[CJ]: but wait where else could you put the northern hemisphere but on the top
[Dr. Cynthia Sales]: on the bottom
[CJ]: how
[Dr. John Fallow]: like this
[CJ]: yeah but you can't do that
[Dr. John Fallow]: why not?
[CJ]: cuz it's freaking me out
Which of the projections shown in the video do you think should be used? Why? Note that the video claims that a certain projection is wrong. Technically, all projections are in some ways wrong, in the sense that they do not accurately portray the world. The only way to achieve accuracy is to use a spherical object - a globe. A projection should be chosen to fit the purpose of the map, so the best projection to use will depend on the circumstances of the map.
Some maps don't even try to have an accurate projection. They distort distances in ways that are geographically inaccurate but useful for other purposes. A classic example of this is the map of the London subway system, which is known as the London Underground or the Tube and operated by a government agency called Transport for London. Here is a portion of the standard system map:
The full map can be found on the Transport for London website. This map is beautifully designed and user-friendly. The mix of colors and layout of the different subway lines on the map make it easy to interpret. However, the map is very geographically inaccurate, meaning the relative distances between the different stops are not shown. In fact, the center of the map (which is downtown London) shows the stops at some distance from each other when in reality they are very close to each other. Alternatively, the stops further out from the city (in the corners of the maps) are some distance away from each other. This makes it impossible to know how long a particular trip will be from the map. So while the map aids in the comprehension of the different lines and stops, it sacrifices accuracy in terms of distances. Maps, therefore, are imperfect documents that can distort or omit information, and, in some cases, bias our understandings of spatial patterns and processes.
Here is a geographically accurate Tube map, produced independently of Transport for London:
If you were riding the Tube, which map would you rather have?
Human-Environment Interactions
Human-Environment Interactions
One of the central contributions of the geographic discipline is its examination of the interactions between social and ecological systems. Thinking about these interactions requires addressing several key questions.
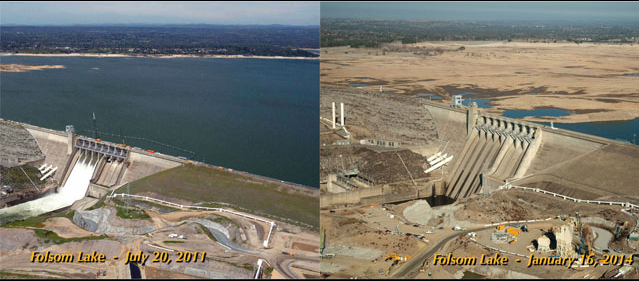
The first question is how does the natural environment shape, control, and constrain human systems? One way this is understood is in terms of natural hazards, which are natural events that disrupt human activity. For example, the ongoing and persistent drought in California (2012-Present, Figure 1.5) has resulted in devastating effects on ecosystems and human society. The threat of wildfire is greatly increased by the continued dryness and wildlife and people are suffering from severe water shortage. The dry conditions also have taken a heavy toll on agriculture, tourism, and recreational industries.
The second key question about human-environment interactions is how human decision-making and processes shape and change the natural environment, including ecosystems, river systems, vegetation, and climate. Humans have caused such significant environmental change that Nobel Prize-winning scientist Paul Crutzen suggested in 2000 that we have entered a new era known as the Anthropocene.
There is great concern about whether social and ecological systems can coexist in a sustainable manner. This has helped advance the concept of sustainability, which seeks to understand how human activities can exist without disrupting the ability of natural ecosystems to function. The sustainability concept will appear in various modules for this course, including coupled human-environmental systems, ethics and democracy, development, and individual responsibility. You will work through how sustainability is understood and the different ways that it is addressed.
An important consideration to sustainability is the concept of governance. Studies of governance consider how people make decisions and how they are constrained by external forces and structures to limit their range of options. An understanding of human-environment interactions attends to environmental governance in the ways that the ability of people to make decisions regarding the natural environment is shaped in part by external factors. As an example of this, the farmer in Brazil that we already discussed participates in governance decision-making with other stakeholders (the Brazilian government, other community members, etc.), state policies, and markets. The decisions that result in terms of transforming the natural environment are influenced by the governance mechanisms that shape the range of options available to particular actors. Environmental governance, which is in essence how natural resources are interpreted and managed by different stakeholders, connects to questions of sustainability. For example, one way of governing natural resources is through common property systems whereby individual actors are allowed access but with certain restrictions. Another example is exclusionary protected areas that restrict the movement of human populations and extraction of natural resources. These are two types of environmental governance strategies that have different impacts on social and ecological systems.
Finally, many of these discussions include concerns for ethics, as they involve how we prioritize human needs at the expense of non-human needs, how some human populations benefit from industrial development more than others, and what are the ecological costs of human-driven environmental change. The next course module, Coupled Human-Environment Systems, addresses these questions in more detail.
Social Science Perspectives
Social Science Perspectives
Geog 30N is, among other things, a social science course about the natural environment. At first glance, this might seem a bit odd. If the environment is a natural phenomenon, shouldn’t the study of it be more of a natural science?
Natural science is unquestionably important to understanding the natural environment. But, as we hope becomes clear in this course, social science is very important too. Here are some reasons why.
Human impacts on the environment. Human society has very large impacts on the natural environment. We are changing the makeup of Earth’s surface and atmosphere, depleting a variety of natural resources, changing the global climate, and even causing many other species to go extinct. These impacts are unprecedented in the entire course of Earth’s history. Natural science can help us understand the nature of these environmental impacts, but social science is needed to understand why and how human society is causing them.
Environmental impacts on humanity. Just as human society impacts the environment, so, too, does the environment impact humanity. Indeed, the environment has played a large role in the contours of human society throughout its entire history. Today, as the environment changes from human activity, these environmental changes are coming back around to impact humanity, often quite profoundly. Understanding how the environment impacts society requires social science.
Environmental policy. Given the importance of the impacts of humanity on the environment and the environment on humanity, society’s policies towards the environment are also important. This includes our policies on how we impact the environment and policies on how we respond to environmental conditions and changes in these conditions. The word “policy” here should be interpreted broadly to include the policies of governments but also the policies of businesses, schools, non-profit organizations, and even households and individual people. Understanding the environmental policies found throughout these portions of human society requires social science.
Geog 30N covers all of these ways social science is important to the environment. In the process, we’ll learn some core social science perspectives, many of which also appear in social science disciplines outside geography, such as economics, history, political science, and psychology. One advantage of studying the environment in a geography course is that geography is a diverse discipline that is very comfortable with including ideas from other disciplines. Indeed, some of the content for this course comes from natural science, the humanities (in particular ethics), and the design-oriented disciplines such as architecture, business, engineering, and policy. Different academic disciplines bring different perspectives, but, ultimately, the disciplines are all studying the same world. Our goal is to understand the world and society’s place within it. We will use whatever perspectives can help us achieve this.
Summary
Summary
This first module was designed to introduce you to major concepts within the geographic discipline, to understand how geographers examine and work in the world. While geography literally means “to describe the Earth,” geography is not just locating places on maps but understanding how those places are created and change over time. Understanding where places exist is essential to success in today’s world, especially because of globalization’s increasing economic and political integration of countries all over the world. Geographers thus pay a lot of attention to the spatial and temporal scales in which globalization and other processes play out. To help us visualize and understand these processes and the patterns they produce, geographers make maps and utilize Geographic Information Systems (GIS). Finally, geographers study human-environment interactions. This includes both how the environment affects humans and how humans affect the environment. Human impact on the environment in recent years has been very large, leading to big questions about what the future of life on Earth will be. Module 1 began with these concepts because we will be exploring them in even greater depth for the rest of the course.