Module 5 - Development
Introduction
About Module 5
In Modules 1-4, we learned key concepts that appear throughout the course and in human-environment interactions in general. Module 1 introduced the geographer’s perspective on the world and explained why we would study the natural environment in a social science course. Module 2 introduced systems thinking, which is invaluable for mentally managing the complexity of human-environment systems. Module 3 introduced ethics, which underlies all decisions concerning what we should do about the environment. Module 4 introduced individual and collective action to help us understand how we can successfully make a difference.
In Module 5, we transition from a more abstract discussion of concepts towards a more applied discussion of select human-environment topics by covering the concept of development. We begin by considering what development is. We then examine development around the world both today and throughout history. We then consider some downsides to development and conclude with a discussion of sustainable development.
What will we learn in Module 5?
By the end of Module 5, you should be able to:
- explain the meanings of and differences between each of several definitions of development;
- describe major trends in development around the world;
- explain the environment's role in human development throughout history and today;
- define the concept of environmental determinism and discuss its merits and limitations;
- discuss advantages and disadvantages of various forms of development;
- define sustainable development.
What is due for Module 5?
There are a few required readings in this module. There is no Written Assignment with this Module; although the Written Assignment in the next module will require you to engage material from this module.
| Requirement | Location | Submitting Your Work |
|---|---|---|
| Reading Assignment: Did the BP Oil Spill Increase US GDP? | What is Development? | No submission |
| Health Disparities in Black and White | Development's Downsides | No submission |
Questions?
If you have any questions, please post them to our Course Q & A discussion forum in Canvas. I will check that discussion forum often to respond. While you are there, feel free to post your own responses if you, too, are able to help out a classmate. If you have a more specific concern, please send me a message through Inbox in Canvas.
What is Development?
What is Development?
As a geographically literate scholar and citizen, you should be following current events around the world. If you do this, you will undoubtedly hear many discussions of development. You’ll hear discussions of some countries that are “developing” and other countries that are “developed.” You might also hear terms like “First World” and “Third World.” You’ll also hear about how well development in the United States or other countries is going at any given time. Finally, you’ll hear discussions of certain types of development, such as sustainable development. But what does all this mean?
It turns out that “development” does not have one single, simple definition. There are multiple definitions and multiple facets to any one definition. There are also multiple, competing opinions on the various understandings of what “development” is. Often, “development” is viewed as being a good thing, and it is easy to see why. People in “developed” countries tend to have longer lives, more comfortable housing, more options for careers and entertainment, and much more. But whether or not “development” is good is ultimately a question of ethics. Just as there are multiple views on ethics, there are multiple views on whether or not “development” is good. Later in this module, we’ll see some cases in which “development” might not be considered to be good.
The simplest and most common measures for development are those based on monetary statistics like income or gross domestic product (GDP, which measures in monetary terms how much an economy is producing). These monetary statistics are readily available for countries and other types of places across the world and are very convenient to work with. Likewise, it is easy to find a good map of these statistics, such as this one of GDP:
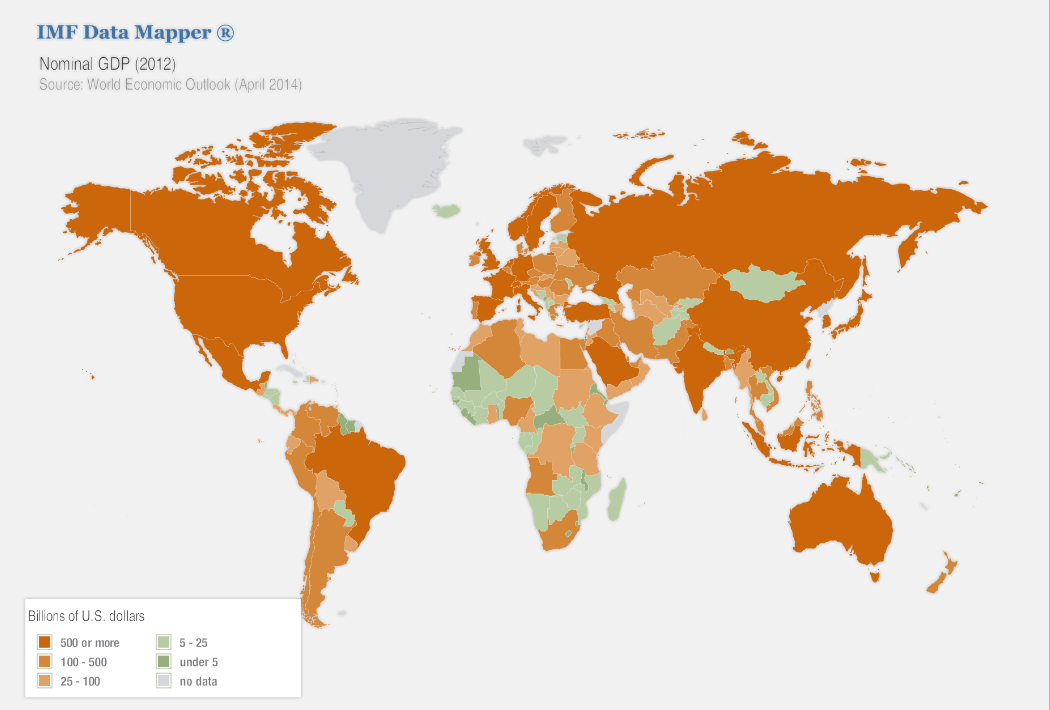
Take a quick glance at the map in Figure 5.1. What do you see? Does anything interesting stand out? We’ll revisit the map later in the module.
But statistics like income and GDP are controversial. One can have a high income or GDP and a low quality of life. Simply put, there’s more to life than money. Furthermore, monetary statistics often overlook important activities that don’t involve money, such as cooking, cleaning, raising children, and even subsistence farming. These activities are often performed by women, so a focus on monetary statistics often brings large underestimates of the contributions of women to society. Finally, high incomes and GDPs are often associated with large environmental degradation. From an ecocentric ethical view, that is a problem.
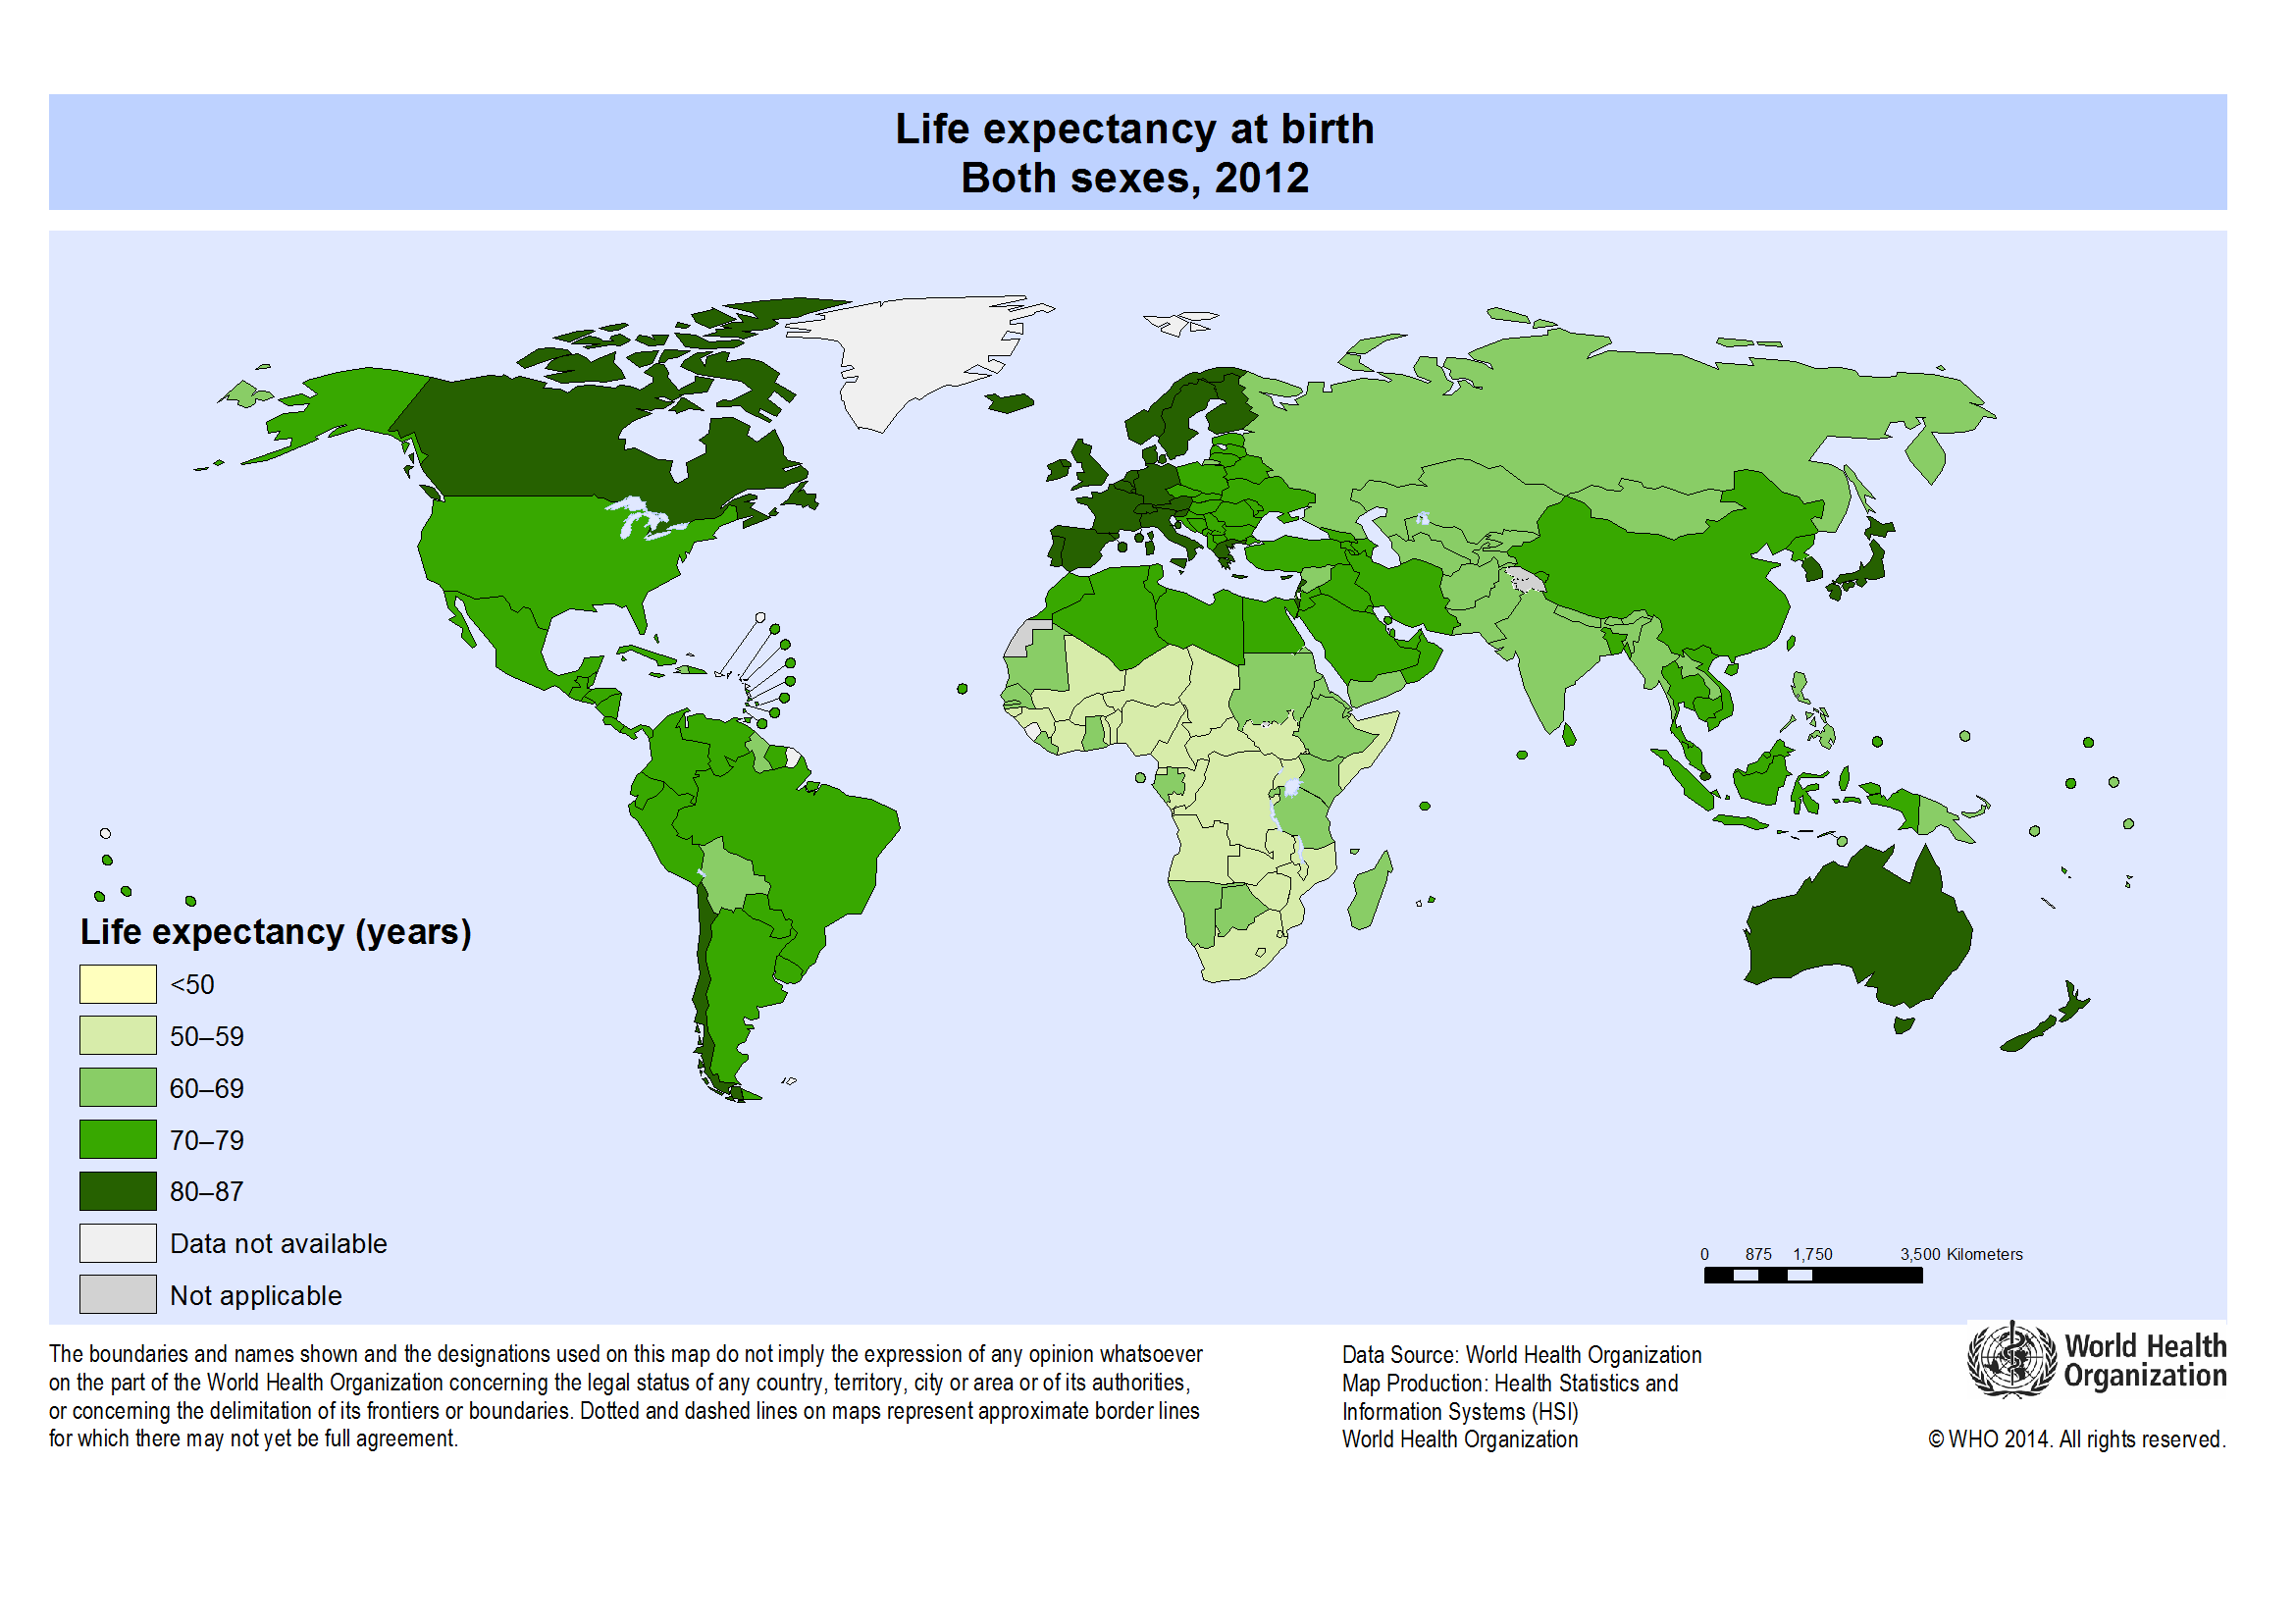
Another way of looking at development is one based on health statistics such as life expectancy or child mortality. These statistics show another facet of development. In many cases, those with a lot of money also have better health. But this trend does not always hold. Take a look at this life expectancy map:
How does the Life Expectancy map in Figure 5.2 compare to the GDP map (Figure 5.1)? What patterns are similar? Is there anything different? Why might this be?
A third way of looking at development is one based on end uses. End uses are the ultimate purposes of whatever our economies are producing. For example, the end uses of agriculture are proper nutrition, tasty eating experiences, and maybe a few other things like the socializing that occurs during meals. The end uses of the construction of buildings involve things like having places for us to be in that are comfortable, productive, and beautiful. For transportation, end uses are being in the places we want to be.
Take a look at the following undernourishment map: How does this map compare to the GDP and Life Expectancy maps? What patterns are similar? Is there anything different? While most of the world's undernourished live in low-income countries, is there an exception?

Reading Assignment: Did the BP Oil Spill Increase US GDP?
Please look at the article “Oil Spill May End Up Lifting GDP Slightly” by Luca Di Leo of the Wall Street Journal.
Unless you have a subscription to the WSJ, you will only be able to read the first couple paragraphs, but that is enough to start thinking about the different understandings of what “development” is, in particular, monetary statistics and end uses. Which understandings are better? Is development a good thing? What is it that society should aim for?
At the core of this discussion of development is one very fundamental question: What is it that we ultimately care about as a society? If we ultimately care about money, then the monetary statistics are good representations of development, and we should be willing to make sacrifices of other things in order to get more money. Or, if end uses are what we ultimately care about, then it is important to look beyond monetary statistics and consider the systems of development that bring us the end uses that we want. Modules 6 and 7 do exactly that.
Consider This: A Note On Terminology
Before continuing, let’s pause for a brief note on terminology. Though they are often used as such, the terms First World and Third World are actually not intended to be development terms. Instead, they are a legacy of the Cold War. The First World was the group of major capitalist countries, led by the United States. The Second World was the group of major communist countries, led by the Soviet Union. The collapse of the Soviet Union explains why we don’t hear the term Second World much anymore. Finally, the Third World was everyone else, who were viewed as relatively unimportant to the Cold War. These days, the terms First World and Third World are often used not for the politics of the Cold War but for conversations about development. This use of the terms is inappropriate and should be avoided. Another common set of terms is the developing world and the developed world. These terms fit better, though they’re still not perfect. In particular, no part of the world has stopped developing, so, in some sense, all countries are developing countries. Finally, there are no clear divides between the more-developed countries and the less-developed countries, and there are also multiple ways of defining and measuring development. So, a safer choice is to use terms that precisely describe the type of development you intend, such as "high-income countries" and "low-income countries."
World Development Today
World Development Today
Let’s begin by viewing a video (about 20 minutes) about global demographics.
Consider This: Hans Rosling, Rockstar Demographer
Hans Rosling is a Swedish demographer and teacher who has gained global fame through lively videos about global demographics, in particular at the TED conferences. If you’re not already familiar, TED is a wonderful resource of entertaining and informative talks from a great variety of people. Here’s a TED talk from Rosling (20:35):
HANS ROSLING: About 10 years ago, I took on the task to teach global development to Swedish undergraduate students. That was after having spent about 20 years, together with African institutions, studying hunger in Africa. So I was expected to know a little about the world. And I started, in our medical university, currently in [INAUDIBLE] Institute, an undergraduate course called Global Health.
But when you get that opportunity, you get a little nervous. I thought, these students coming to us actually have the highest grade you can get in Swedish college systems. So I thought maybe they know everything I'm going to teach them about. So I did a pretest when they came.
And one of the question, from which I learned a lot, was this one-- which country has the highest child mortality of these five pairs? And I put them together so that in each pair of country, one has twice the child mortality of the other. And this means that it's much bigger, the difference, than the uncertainty of the data. I won't put you at a test here, but it's Turkey, which is highest there, Poland, Russia, Pakistan, and South Africa.
And these were the results of the Swedish students. I did it so I got a confidence interval, which was pretty narrow. And I got happy, of course-- at one point, eight right answer of the five possible. That means that there was a place for a professor of international health and for my course.
[LAUGHTER]
But one late night, when I was compiling the report, I really realized my discovery. I have shown that Swedish top students know statistically significantly less about the world than the chimpanzees.
[LAUGHTER]
Because the chimpanzee would score half right. If I gave them two bananas with Sri Lanka and Turkey, they would be right half of the cases. But the students are not there. The problem for me was not ignorance. It was preconceived ideas. I did also an unfair, unethical study of the professors of the [INAUDIBLE] that hands out the Nobel Prize in medicine, and they are on par with the chimpanzee there.
[LAUGHTER]
So this is where I realized that there was really a need to communicate. Because the data of what's happening in the world and the child health of every country is very well aware. So we did the software which displays it like this. Every bubble here is a country. This country over here is-- this is China. And this is India. The size of the bubble is the population.
And on this axis here, I put fertility rate. Because my students, what they said when they looked upon the world, and I asked them, what do we really think about the world? Well, I first discovered that their textbook was Tintin mainly. And they said the world is still we and them. And we is Western world, and them is third world. And what do you mean with Western world? I said. Well, that's a long life and small family. And third world is short life and large family.
So this is what I could display here. I put fertility rate here-- number of children per woman, one, two, three, four, up to about eight children per woman. We have very good data since 1962, 1960 about, on the size of families in all country. The error margin is narrow. Here, I put life expectancy at birth from 30 years, in some countries, up to about 70 years.
And in 1962, there was really a group of countries here that was industrialized countries. And they had small families and long lives. And these were the developing countries. They had large families, and they had relatively short lives.
Now, what has happened since 1962? We want to see the change. Are the students right, it's still two types of countries? Or have these developing countries got smaller families, and they live here? Or have they got longer lives and live up there? Let's see. We start the world. And this is all the UN statistic that has been available.
Here we go. Can you see there? In China, they're moving against better health. They're improving there. All the green Latin American countries--
[LAUGHTER]
--they are moving toward smaller families. Your yellow ones here are the Arabic countries, and they get larger families, but they-- no, longer live, but not larger families. The Africans are the green, down here. They still remain here. This is India. Indonesia is moving on pretty fast. And in the '80s, here, you have Bangladesh still among the African countries there.
But now Bangladesh, it's a miracle that happens in the '80s.
[LAUGHTER]
The moms start to promote family planning, and they move up into that corner. And in '90s, we have the terrible HIV epidemic, that takes down the life expectancy of the African countries. And all the rest of them all moves up into the corner, where we have long lives and small family, and we have a completely new world.
[APPLAUSE]
Let me make a comparison directly between United States of America and Vietnam. 1964-- America had small families and long life. Vietnam had large families and short lives. And this is what happens-- the data during the war indicate that, even with all the death, there was an improvement of life expectancy. By the end of the year, the family planning started in Vietnam, and they went for smaller families. And the United States, up there, is getting for a longer life, keeping family size.
And in the '80s now, they give up Communist planning, and they go for a market economy. And it moves faster even in social life. And today, we have, in Vietnam, the same life expectancy and the same family size, here in Vietnam, 2003, as in the United States, 1974, by the end of the war. I think we all, if we don't look in the data, we underestimate the tremendous change in Asia, which was in social change before we saw the economic change.
So let's move over to another way here in which we could display that distribution in the world of the income. This is the world distribution of income of people-- $1, $10, or $100 per day. There's no gap between rich and poor any longer. This is a myth. There's a little hump here, but there are people all the way. And if we look where the income ends up, the income-- this is 100% of world's annual income, and the richest 20%, they take out of that about 74%. And the poorest 20%, they take about 2%.
And this shows that the concept developing countries is extremely doubtful. We sort of think about aid like these people here giving aid to these people here. But in the middle, we have most of world population. And they have now 24% of income. We heard it in other forms. And who are these? Where are the different countries?
I can show you Africa. This is Africa-- 10% of world population most in poverty. This is OECD, the rich country, the country club of the UN, and they are over here on this side; and quite an overlap between Africa and OECD. And this is Latin America. It has everything on this earth, from the poorest, to the richest, in Latin America.
And on top of that, we can put East Europe. We can put East Asia, and we could South Asia. And how did it look like, if we go back in time, to about 1970? Then there was more of a hump. And we have most who lived in absolute poverty were Asians. The problem in the world was the poverty in Asia.
And if I now let the world move forward, you will see that, while population increased, there are 100s of millions in Asia getting out of poverty and some others get into poverty. And this is the pattern we have today. And the best projection from the World Bank is that this will happen. And we will not have a divided world. We will have most people in the middle. Of course, it's a logarithmic scale here.
But our concept of economy is growth with percent. We look upon it as a possibility of percent of increase. If I change this, and I take GDP per capita instead of family income, and I turn these individual data into regional data of gross domestic product, and I take the regions, down here, the size of the bubble is still the population. And you have the OECD there, and you have sub-Saharan Africa there.
And we take off the Arab states there, coming both from Africa and from Asia, and we put them separately. And we can expand these axes. And I can give it a new dimension here by adding the social values, the child survival. Now I have money on that access, and I have the possibility of children to survive there. In some countries, 99.7% of children survive to 5 years of age, others only 70.
And here, it seems that there is a gap between OECD, Latin America, East Europe, East Asia, Arab states, South Asia, and sub-Saharan Africa. The linearity is very strong between child survival and money. But let me split sub-Saharan Africa. Health is there and better health is up there. I can go here, and I can split sub-Saharan Africa into its countries. And when it bursts, the size of each country bubble is the size of the population-- Sierra Leone down there, Mauritius up there.
Mauritius was the first country to get away with trade barriers. And they could sell their sugar, they could sell their textiles, on equal terms as the people in Europe and North America. There's a huge difference between in Africa. And Ghana is here in the middle; in Sierra Leone, humanitarian aid; here in Uganda, development aid; here, time to invest; there, you can go for holiday. It's a tremendous variation within Africa, which we very often make that it's equal everything.
I can split South Asia here. India is the big bubble in the middle, but huge difference between Afghanistan and Sri Lanka. And I can split Arab states. How are they? Same climate, same culture, same religion-- huge difference, even between neighbors; Yemen's civil war, United Arab Emirates money, which was quite equal and well used, not as the myth is. And that includes all the children of the foreign workers who are in the country.
Data is often better than you think. Many people say that data is bad. There is an uncertainty margin, but we can see the difference here-- Cambodia, Singapore. The differences are much bigger than the weakness of the data. East Europe, Soviet economy, for a long time, but they come out of the 10 years very, very differently. And there is Latin America. Today we don't have to go to Cuba to find a healthy country. In Latin America, Chile will have a lower child mortality than Cuba within some few years from now.
And here, we have high income countries in the OECD. And we get the whole pattern here of the world, which is more or less like this. And if we look at it, how it looks, the world, in 1960, it starts to move. 1960-- this is Mao Zedong, he brought health to China. And then he died. And then Deng Xiaoping came and brought money to China and brought them into the mainstream again.
And we have seen how countries move in different directions like this. So it's sort of difficult to get an example country which shows the pattern of the world. But I would like to bring you back to about here, at 1960. And I would like to compare South Korea, which is this one, with Brazil, which is this one-- the label went away from me here-- and I would like to compare Uganda, which is there.
And I can run it forward like this. And you can see how South Korea is making a very, very fast advancement, whereas Brazil is much lower. And if we moved back again here, and we put on trails on them, like this, you can see, again, that the speed of development is very, very different. And the countries are moving, more or less, in the same rate as money and health.
But it seems you can move much faster if you are healthy first than if you are wealthy first. And to show that, you can put on the way of United Arab Emirates. They came from here, a mineral country. They catch all the oil. They got all the money. But health cannot be bought at the supermarket. You have to invest in health. You have to get kids into schooling. You have to train health staff. You have to educate the population.
And Sheik Sayad did that in a fairly good way. And in spite of falling oil prices, he brought this country up here. So we got a much more mainstream appearance of the world, where all countries tend to use their money better than they used in the past.
Now, this is more or less if you look at the average data of the countries. They are like this. Now, that's dangerous, to use average data, because there's such a lot of difference within countries. So if I go and look here, we can see that Uganda, that today is where South Korea was 1960. If I split Uganda, there's quite a difference within Uganda. These are the quintiles of Uganda. The richest 20% of Ugandans are there. The poorest are down there.
If I split South Africa, it's like this. And if I go down and look at Niger, where there was such a terrible famine lastly, it's like this. The 20% poorest of Niger is out here, and the 20% richest of South Africa is there. And yet, we tend to discuss on what solutions there should be in Africa. Everything in this world exists in Africa.
And you can't discuss universal access to HIV for that quintile up here with the same strategy as down here. The improvement of the world must be highly contextualized. And it's not relevant to have it on a regional level. We be much more detail.
We find that students get very excited when they can use this. And even more, policymakers and the corporate sectors would like to see how the world is changing. Now, why doesn't this take place? Why are we not using the data we have? We have data in the United Nation, in the national statistical agencies, and in universities in other non-governmental organization. Because the data is hidden down in the databases.
And the public is there, and the internet is there, but we have still not used it effectively. All that information we saw changing in the world does not include publicly-funded statistics. There are some web pages like this, but they take some nourishment down from the databases. But people put prices on them, stupid passwords, and boring statistics.
[LAUGHTER]
And this won't work.
[APPLAUSE]
So what is needed? We have the databases. It's not a new database you need. We have wonderful design tools, and more and more are added up here. So we started a nonprofit venture, which we called linking data to the design. We call it Gapminder, from London Underground, where they warn you, mind the gap. So we thought Gapminder was appropriate.
And we started to write software which could link the data like this. And it wasn't that difficult. It took some person years. And we have produced animations. You can take a dataset and put it there. We are liberating UN data. Some few UN organizations, some countries, accept that their databases can go out on the world. But what we really need is, of course, a search function, a search function where we can copy the data up to a searchable format and get it out in the world.
And what do we hear when we go around? I've done anthropology on the main statistical units. Everyone says it's impossible, this can't be done. Our information is so peculiar indeed, so that cannot be searched as other can be searched. We cannot give the data free to the students, free to the entrepreneurs, of the world. But this is what we would like to see, isn't it?
The publicly funded data is down here, and we would like flowers to grow out on the net. And one other crucial point is to make them searchable, and then people can use the different design tool to animate it there. And I have a pretty good news for you. I have good news that the present new head of UN statistic, he doesn't say it's impossible. He only says, we can't do it.
[LAUGHTER]
And that's a quite clever guy, huh?
[LAUGHTER]
So we can see a lot happening in data in the coming years. We will be able to look at income distributions in completely new ways. This is the income distribution of China, 1970. This is the income distribution of the United States, 1970-- almost no overlap, almost no overlap. And what has happened? What has happened is this-- that China is growing. It's not so equal any longer, and it's appearing here, overlooking the United States, almost like a ghost, isn't it? It's pretty scary.
[LAUGHTER]
But I think it's very important to have all this information. We need really to see it. And instead of looking at this, I would like to end up by showing the internet users per 1,000. In this software, we access about 500 variables from all the countries quite easily. It takes some time to change for this. But on the axises, you can quite easily get any variable you would like to have.
And the thing would be to get up the databases free, to get them searchable, and with a second click, to get them into the graphic formats, where you can instantly understand them. Now, the statisticians doesn't like it, because they say that this will not show the reality. We have to have statistical analytical methods. But this is hypothesis generating.
I end now with the world-- there, the internet are coming. The number of internet users are going up like this. Is the GDP per capita. And it's a new technology coming in, but it amazingly how well it fits to the economy of the countries. That's why the $100 computer will be so important.
But there's a nice tendency. It's as if the world is flattening off, isn't it? These countries are lifting more than the economy, and will be very interesting to follow this over the year, as I would like you to be able to do with all the publicly funded data. Thank you very much.
NARRATOR: What if great ideas weren't cherished? What if they carried no importance or held no value?
There is a place where artistic vision is protected, where inspired design ideas live on, to become ultimate driving machines.
Rosling makes several important points in this video:
- Many of us have misperceptions about global demographic data such as child mortality.
- The variation within regions (such as sub-Saharan Africa) and within countries can be larger than the variation between different regions or countries.
- The divide between the more-developed and less-developed countries no longer exists. Instead, there is a continuum of development around the world with no gap in the middle.
- Quality visualization is essential for understanding and communicating demographic data.
All of these points are important for Geography 30.
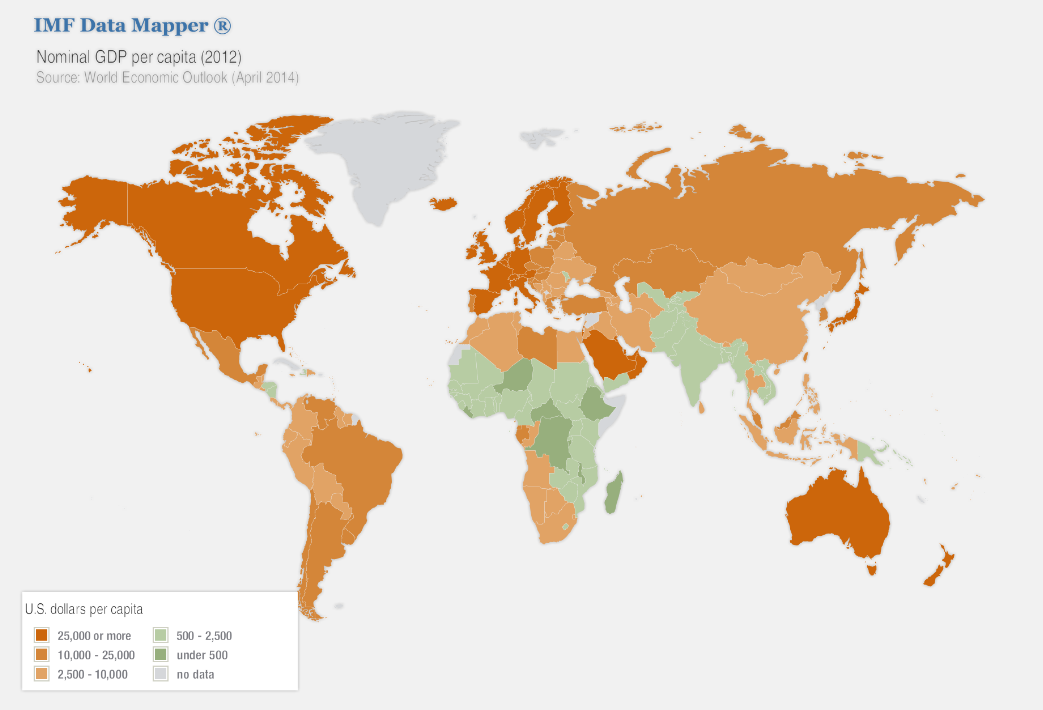
Now, let's take a look at the map of GDP per capita, of course bearing in mind the limitations of the GDP statistic.
Click link to expand for a text description of Figure 5.4
A few points are worth making about this map. First, the map shows GDP per capita, i.e., per person. Per capita statistics are usually more helpful for showing what’s going on in a place. Recall the map of world GDP from the previous page. That map would show, for example, that China has a much larger GDP than, say, Switzerland. But that is because China has a much larger population than Switzerland, not because China has reached a more advanced level of development. Most people would consider Switzerland to be more developed than China.
Second, the wealthier areas are North America, Western Europe, Australia, New Zealand, Japan, South Korea, and a few countries in the Middle East. These are the countries that are commonly considered to be “developed.” The rest of the countries are commonly considered to be “developing.” But there is no clear divide between “developed” and “developing” visible on this map. Instead, there are countries at all points along the continuum from “developed” to “developing.”
Third, there are a few places on the map that are colored gray. These are places where no data is available. Usually, there is an interesting reason for data as basic as GDP to be unavailable. The map here uses data from the International Monetary Fund (IMF), so the gray represents places that the IMF has no data for. Here are probable reasons for why some data is unavailable for this map: Greenland is not an independent country but is a territory of Denmark. French Guiana (in northern South America) is also not an independent country but is a territory of France. Western Sahara is a disputed territory fighting for independence from Morocco. Somalia has dysfunctional government and probably didn’t report data to the IMF. Finally, Cuba and North Korea are not part of the IMF. GDP statistics are available for most of these regions from sources other than the IMF.
Note that Cuba left the IMF when Fidel Castro came to power, claiming that the IMF was too slanted in favor of US capitalism. It is an interesting case worth considering further.
Consider This: How Developed is Cuba?
Cuba is an interesting case of development. To illustrate, Cuba's 2015 GDP per capita is $7,602, far behind the United States' 2015 GDP per capita of $56,207. Since Cuba isn’t in the IMF, the data here comes from the World Bank, which is an excellent resource for demographic and other data. Meanwhile, Cuba's life expectancy as of 2015 is 79.55 years, which is significantly higher than the world average of 71.66 years and slightly higher than the United States’ life expectancy of 78.74. Cuba’s high life expectancy can be seen on the life expectancy map on the previous page.
Why is it that Cuba performs so much better in a health statistic like life expectancy than with a monetary statistic like GDP?
The answer is the unusual nature of Cuba’s economy. Cuba has a socialist economy with a high degree of central planning. It is also relatively isolated from the globalized economy, especially now that the Soviet Union no longer exists. Because of this, its government has emphasized healthcare, education, and other social development practices instead of activities that would generate a large GDP. While Cuba lacks the expensive medical facilities found in the United States and other wealthy countries, it has universal healthcare and the most doctors per person of any country in the world.
Recently, there was a fuss in the media to report that diplomatic relations had finally been established between Cuba and United States as of July 20, 2015. This means that up until July 2015, US citizens had not been allowed to even travel to Cuba. The relations between the two countries had been poor ever since the Castro regime tied Cuba to the Soviet Union. Relations remained poor for a long time even after the dissolution of the Soviet Union, in part because of disagreements about economic issues and in part because of US concern about Cuba’s limited political freedoms. Regardless of what your view of Cuba is, it is important to recognize and learn from its unique approach to development.
World Development Throughout History
There is one more point to consider about the GDP map shown earlier: It only shows one point in time. The map tells us something about development around the world today, but it doesn’t explain how we got here. Even the Rosling video, which shows an animation over time, doesn’t offer much in the way of explanation. This leaves out the important question: Why is it that some countries are more developed – or at least have more money – than others?
Understanding the patterns of development we see today requires understanding the history of development around the world. Historical geography is the study of the historical dimensions of our world and is very important here. It turns out that certain aspects of the environment have played important roles in the history of development on Earth. This is a very old story, and it’s worth starting at the beginning: at the origin of agriculture. Agriculture is an important starting point for development because the increased food supplies enable larger populations and enable some people to devote their time to tasks other than producing food. This labor specialization is necessary for the diverse other human activities required for development.
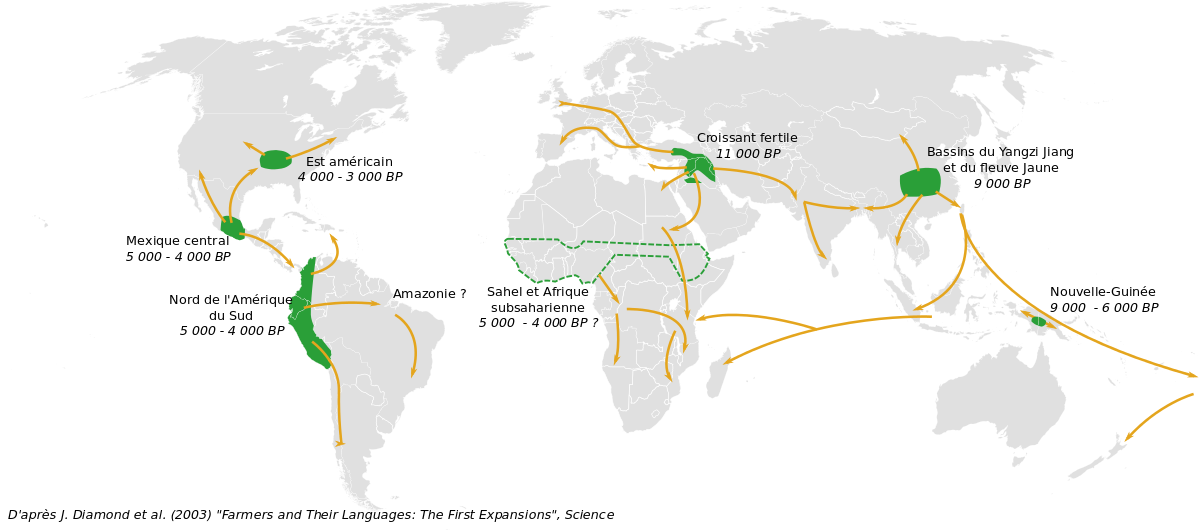
Agriculture originated independently in several regions around the world. In the map below, the green areas are regions where agriculture originated and the arrows show directions that agriculture spread from its areas of origin.
But all agriculture is not equal. Some agriculture is more productive than others. Likewise, some of these regions where agriculture originated are likely to develop more successfully than others. Key factors include the region’s growing conditions (including temperature, precipitation, latitude, and soils) and the types of plants and animals available for planting and domestication. Many regions had good growing conditions, but of all the regions in the world, one had especially rich plants and animals to use. That region is the Fertile Crescent, which is located in the Middle East as seen on the map above.
Consider This: The Fertile Crescent’s “Geographic Luck”: Guns, Germs, and Steel
Guns, Germs, and Steel is a Pulitzer Prize-winning book written by geographer and physiologist Jared Diamond. In the book, Diamond seeks to answer a question posed to him by a man in Papua New Guinea: Why does Diamond have so much more “cargo” than the Papua New Guineans? “Cargo” here essentially means “stuff,” including advanced stuff like helicopters. Note that Papua New Guinea has had agriculture for a long time – it is the green space located just north of eastern Australia on the map above. Why didn’t Papua New Guinea’s agriculture lead to advanced civilization as it did elsewhere? The explanation that Diamond comes up with is that Papua New Guinea had less “geographic luck:” It had less in the way of resources conducive to successful agriculture, in particular, plants and animals. In contrast, the Fertile Crescent had better resources.
In order to learn more about Diamond’s ideas, please watch part of the National Geographic video made based on Guns, Germs, and Steel. Please begin at Episode 5, at time 4:30. Then watch Episode 6 from the beginning through time 8:25. As you watch the videos, consider this: What are the major parts of Diamond’s arguments? What are critiques that others have made? How does Diamond respond? Is his response successful?
Video: Guns, Germs, and Steel Part 5 of 18 (4:30-9:18, 4 minutes and 48 seconds)
Presenter (4:30): The big four livestock animals—cows, pigs, sheep, and goats—were native to the Middle East, the very same area that was home to some of the best crops in the world. It was also home to some of the best animals. Little wonder that this area became known as the Fertile Crescent. The people of the Fertile Crescent were geographically blessed with access to some of the best crops and farm animals in the ancient world, giving them a huge advantage. What had begun with the sowing of wheat and the penning of goats was leading toward the first human civilization.
The archaeological site of Göbekli Tepe in southern Jordan is 9,000 years old, but it has all the hallmarks of a town. A few hundred people lived there in rows of houses that were a wonder of technology. Every time I visit, I am amazed by what those people were doing. Some of the houses had a kind of air conditioning—this window here is for controlling the air coming from the street inside the house. The walls and the floors of the houses were covered with plaster from the inside, at least. People were starting to move toward the concept of homes—not just places to sleep, but proper homes. They began decorating the houses from the inside. People started investing in their homes, as plaster was time-consuming, effort-consuming, and expensive to apply.
As villages grew bigger, there were more people to work the land. More people could produce more food more efficiently, enough to support specialists within the community. Freed from the burden of farming, some people were able to develop new skills and technologies. Making plaster from limestone was a major technological breakthrough. The stones had to be heated for days at a time at a temperature of 1,000°. While it may seem insignificant today, understanding how to work with fire was the first step toward forging steel, a technology that would transform the world.
By contrast, places like New Guinea never developed advanced technology. Even today, some people in the highlands are working in ways that have barely changed for centuries. When I first came to New Guinea in the 1960s, people were still using stone tools like axes in parts of the island. Before European arrival, people were using stone tools everywhere in New Guinea. So, why didn’t New Guinea develop metal tools on its own? Eventually, I realized that in order to have metal-working specialists who could figure out how to smelt copper and iron, the rest of society, the farmers, would need to generate enough food surpluses to feed them. But New Guinea’s agriculture was not productive enough to generate those food surpluses, and the result was no specialists, no metalworkers, and no metal tools.
Video: Guns, Germs, and Steel Part 5 of 18 (0:00-8:25, 8 minutes and 25 seconds)
Presenter: The way of life in New Guinea was perfectly viable; it had survived intact for thousands of years. But according to Diamond, people didn't advance technologically because they spent too much time and energy feeding themselves. Then Westerners arrived and used their technology to colonize the country.
Yet for all its advantages, the Fertile Crescent is not the powerhouse of the modern world, nor is it the breadbasket it once was. How did it lose its head start? Within a thousand years of their emergence, most of the new villages of the Fertile Crescent were abandoned. Ironically, the region had a fundamental weakness. Despite having some of the most nutritious crops on the planet, its climate was too dry and its ecology too fragile to support continuous, intensive farming. People were destroying the environment. The waters had been over-exploited, the trees had been cut, and this is what happened when you face a dilemma. You are facing the wall. You will end with a landscape like that—few trees, no grass, and less water. So what we are looking at today is the outcome of exploiting the environment. Unable to farm their land, entire communities were forced to move on. The advantages they had accrued from centuries of domestication might have been lost, but again, geography was on their side.
The Fertile Crescent is in the middle of a huge landmass—Eurasia. There were plenty of places for farming to spread, and crucially, many of those places were to the east and west of the Fertile Crescent, at roughly the same line of latitude. Why is that so important? Because any two points of the globe that share the same latitude automatically share the same length of day, and they often share a similar climate and vegetation. Crops and animals domesticated in the Fertile Crescent were able to prosper at other places along the east-west axis of Eurasia. Wheat and barley, sheep and goats, cows and pigs all spread from the Fertile Crescent east toward India and west toward North Africa and Europe. Wherever they went, they transformed human societies. Once the crops and animals of the Fertile Crescent reached Egypt, they caused an explosion of civilization.
Suddenly there was enough food to feed the pharaohs and generals, the engineers and scribes, and the armies of people required to build the pyramids. The same is true of European civilization. From ancient times until the Renaissance, the crops and animals of the Fertile Crescent fed the artists, inventors, and soldiers of Europe. In the 16th century, the same crops and animals were taken by Europeans to the New World. At the time, there was not a single cow or ear of wheat in all the Americas. Now, there are 100 million cattle in the U.S. alone, and Americans consume 20 million tons of wheat a year. Modern industrialized America would be unthinkable without the spread of farming from the Fertile Crescent.
There are some who think Jared Diamond's argument is too neat and easy. Can the distribution of wealth and power really be reduced to cattle and wheat? What about culture, politics, and religion? Surely they've been just as important. Diamond's been criticized for being too deterministic, for ignoring the part people have played in shaping their own destiny. My years in New Guinea have convinced me that people around the world are fundamentally similar. Wherever you go, you can find people who are smart, resourceful, and dynamic. No society has a monopoly on those traits. Of course, there are huge cultural differences, but they’re mainly the result of inequality, not its root cause. Ultimately, what's far more important is the hand that people have been dealt—the raw materials they've had at their disposal. New Guineans acquired pigs from Eurasia, but not cows, sheep, goats, horses, wheat, or barley. They didn’t develop in the same way as Europeans and Americans because they didn’t have the same raw materials.
I'm not saying that those divisions of the world are set in stone and can’t be changed. It’s quite the opposite. The towns of Papua New Guinea are becoming bigger and more developed, populated by modern New Guineans trying to catch up with the rest of the world. Unfortunately for them, there's still a big gap to overcome. “Why do white men have so much cargo and we New Guineans have so little?” Yali caught me by surprise 30 years ago. I had no idea what to say to him then, but now I think I know the answer. It wasn’t for lack of ingenuity that your people didn’t end up with modern technology. They had the ingenuity to master the difficult New Guinea environments. Instead, the whole answer to your question was geography. If your people had enjoyed the same geographic advantages as my people, your people would have been the ones to invent helicopters.
[Required transcript end at 8:25]
Environmental Determinism
The idea that the outcomes of civilization were determined entirely by environmental factors is known as environmental determinism. This idea has been heavily critiqued. Even though environmental factors like plants and animals for agriculture can help explain some major patterns in development, such as why advanced civilization developed in Eurasia but not in Papua New Guinea, it cannot explain everything. For example, it cannot explain the major differences in development found today between adjacent countries such as the Dominican Republic (richer) and Haiti (poorer) or South Korea (richer) and North Korea (poorer). The distinction between the Dominican Republic and Haiti is even visible from space. Environmental determinism assumes that the environment determines all development and difference, but some patterns, like what we observe between the Dominican Republic and Haiti, are not explainable by environmental factors alone.
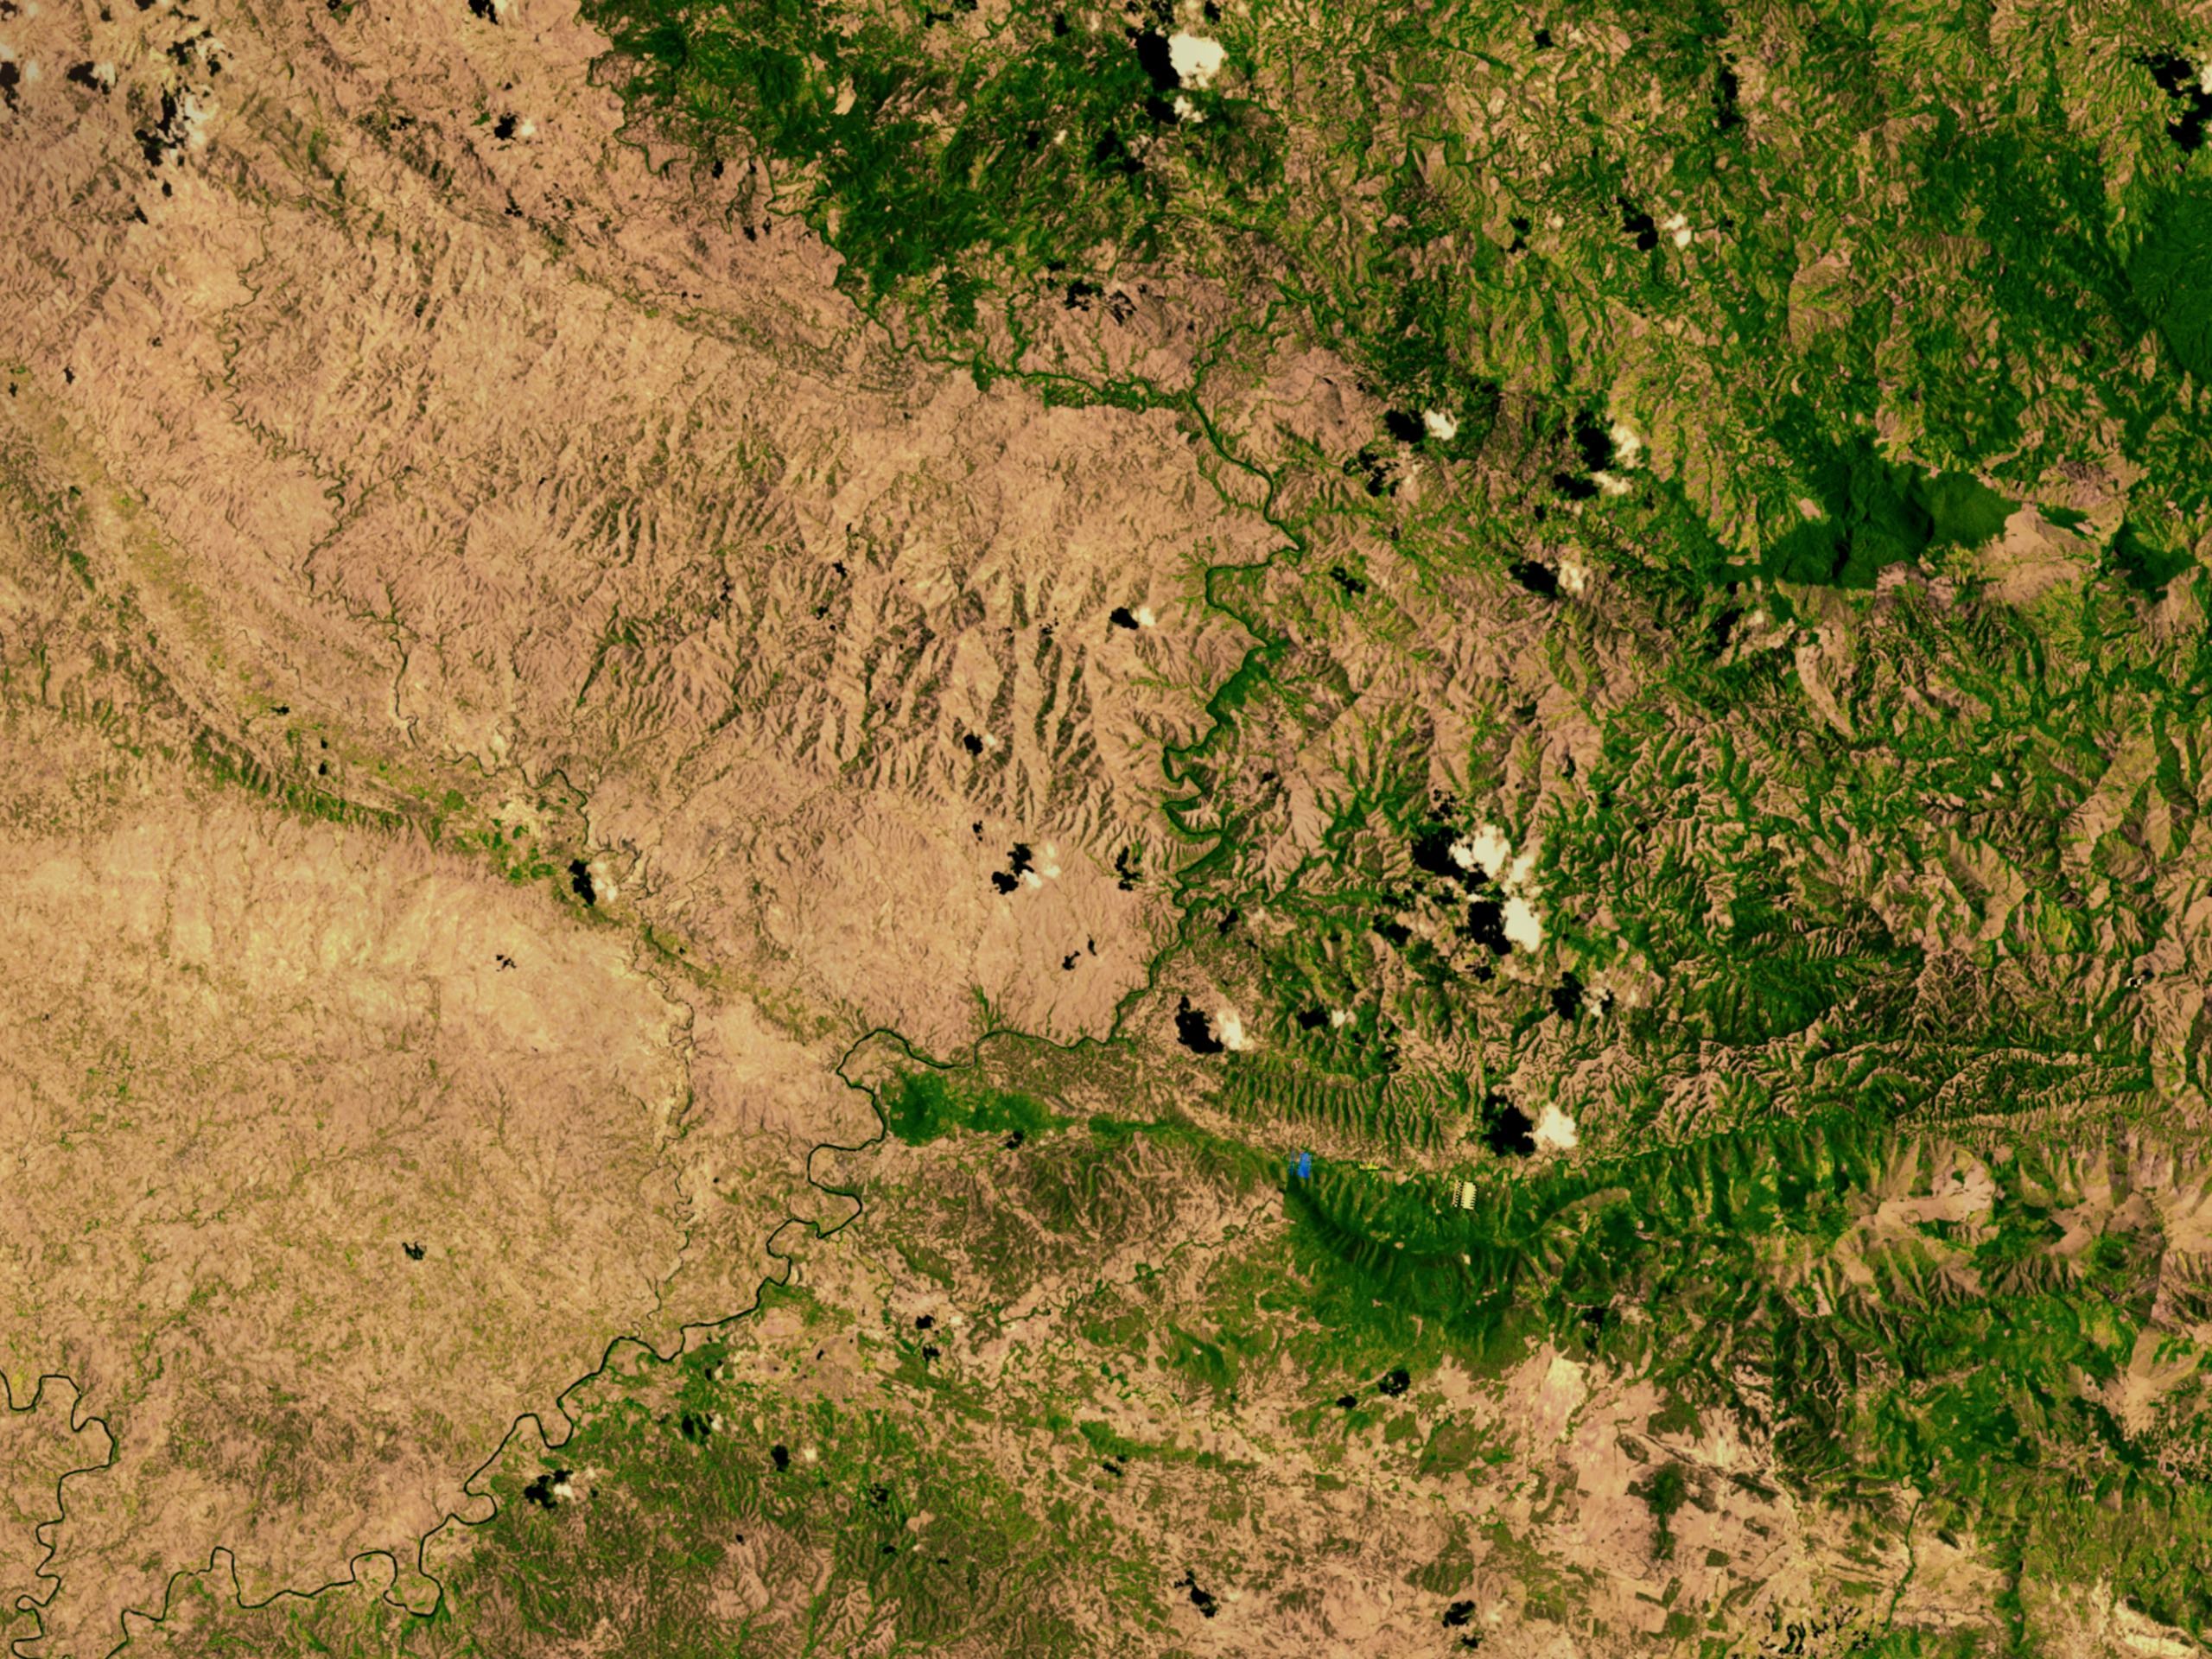
In this image, Haiti is on the left and the Dominican Republic is on the right. This part of Haiti is almost completely deforested, as is much of the rest of the country, but the deforestation ends abruptly at the political border. From our systems perspective, this is clearly humanity impacting the environment, not the environment impacting humanity. What is important to understand is that the patterns of development that we see have both environmental and social causes. The environment can explain some of why advanced civilization emerged on Eurasia instead of elsewhere, but only social factors can explain why, for example, the Dominican Republic is richer than Haiti or South Korea is richer than North Korea. In other words, environmental resources can contribute to development trajectories, just like many other geographic factors such as culture, climate, topography, proximity to major waterways, etc. But no single one of those components is ever the determining factor.
Environmental determinism came to prominence in the early twentieth century, but its popularity declined over time. This is partly due to its shortcomings, and also a recognition that it was often used as a justification for colonial conquest and slavery. In contrast to the unidirectional conceptualization of human-environment relationships, environmental possibilism arose as a concept in which environmental constraints are still recognized but the freedom and capability of humans to change and structure the environment are highlighted. Environmental determinism and possibilism represented geographers’ first attempts at generalizing what accounts for the pattern of human occupation of the Earth’s surface in modern times.
Development’s Downsides
Development’s Downsides
Thus far in the module, we've seen several examples in which development has increased health and quality of life. However, development can also reduce health and quality of life. Oftentimes, when development has these downsides, it is for reasons related to the environment. When development impacts the environment in ways that harm certain groups of people, it raises issues of environmental justice.
First, let's consider some connections between economic development, human health, and justice by completing the following reading assignment:
Reading Assignment: Walker, "Health Disparities in Black and White"
Walker, Bailus Jr. 2007. "Health Disparities in Black and White." Crisis (July/August).
A scanned copy of the article with images can be downloaded as a PDF here: Walker, Health Disparities in Black and White
An easier-to-read text only html version of this article is also available through the Penn State Library system.
Here are some questions to consider as you read this article:
- What are some of the main causes of poor health within the United States?
- What are some of the relationships (correlations) between health and race and class in the United States?
- What are some pieces of legislation that have been passed to try to deal with these patterns?
- While the correlations between health and race are clearly understood, what are some of the challenges in showing causation (proving that African American communities are targeted to live with these facilities, for example)?
The fact that poor, and often minority, populations are more likely to live within close proximity to facilities that have negative health effects has helped establish the environmental justice movement. Research on environmental justice has shown that political and economic systems structure the conditions that contribute to poor health and help explain variations within societies in the rates of non-communicable chronic diseases such as diabetes or cancer.
Within the United States, the environmental justice movement has worked to show how the byproducts of development, such as chemical factories, waste facilities, and toxic chemicals, create hazardous conditions for people living near them. Here's one example of environmental justice in the United States; watch this video about Fighting for Safe Water in Flint (13:25 minutes):
Melissa Mays: The first time we heard that they were thinking of switching to the Flint River, we laughed. We thought it was a joke. Because there's a ton of cars in there, shopping carts, and we knew that industry had dumped in the river for 100 years and didn't clean it up.
[Crowd] Three, two, one.
Mays: When they actually pushed the button, it was on TV, and we were shocked that we were actually going to be forced to drink from the Flint River. Here's to Flint. Here's to Flint.
[Crowd] Here, here!
Mays: About a month later, people were complaining about orange and brown water. You would watch the news, and they would say, Well, river water is a little bit harder to treat than lake water, and we've got it under control. It's just a bump in the road.
Pastor Overton: When I really recognized that Flint has switched is one early morning that I heard on 10 or 12 News, that General Motors had begun to switch from the Flint River water back on to the Detroit water because it was corroding their products. Flint city officials insist Flint River water is good enough to drink, but it's been causing problems with issues at General Motors. And I just knew, common sense told me that if it's messing up their automotive parts, it has to be a problem for consumption. So that's when I got up and got mobilized and got engaged to find out what was going on with this water. This church was where we spearheaded a group called the Coalition for Clean Water, bringing together other community groups that were out working to fight this water crisis.
Dimple Chaudhary: NRDC started to understand the magnitude of the crisis in Flint back in the summer of 2015. The ACLU of Michigan started to suspect that there may be potential litigation related to the environmental issues, the safety of the drinking water. They reached out to NRDC because they knew that we have expertise and a deep knowledge of safe drinking water laws and how to bring these types of environmental citizens' suits.
Dr. Mona Hanna-Attisha: Pediatricians know lead. We know what lead can do. Every agency tells us, from the CDC to the American Academy of Pediatrics, that there's no safe level of lead. When I heard of the possibility that there was lead in the water, it was a call to action. We decided to look at the lead levels just in our clinics. So the Hurley Children's Clinic sees the most Flint kids, and we compared lead levels before the water switch to lead levels after the water switch, and we did see this increase in the percentage of children with elevated lead levels. And we were absolutely heartbroken. We had to share this information as soon as possible. So we decided to hold a press conference. This research is concerning. These results are concerning. To alert our families to stop using this water, to use bottled water, to use filters and to hopefully get the water source changed back to Detroit. Right after we shared this information, my science was dismissed, the research was dismissed, the state came out publicly stating that I was wrong, that I was causing near hysteria. So, I shouldn't have been surprised, because for 18 months, the heroic people of Flint had been dismissed- the moms, the activists, the pastors, the journalists, the scientists.
Chaudhary: After we realized that there was data that could confirm that there were widespread elevated lead levels in Flint- so a real serious concern about toxic lead in people's water- we knew that the ultimate fix for a lead problem is to get the lead pipes out of the ground. So that was the central and primary goal of the case.
Sarah Tallman: In our lawsuit, we brought claims against the city of Flint and state officials claiming that they violated the Safe Drinking Water Act in several ways. The first major violation was called "a failure to optimize corrosion control treatment," which means the city and state failed to treat the drinking water appropriately to make sure that they were minimizing the amount of lead that was leaching from the pipes into drinking water. And the second violation was that they failed to monitor tap water for lead appropriately. Because they failed to do the right kinds of testing, they failed to uncover a problem for months and months, which exacerbated the crisis.
Anjali Waikar: After we filed our lawsuit, we started hearing a lot of concerns from the community about people not being able to access basic bottled water and filters that the city and state were providing.
Chaudhary: The state had set up some distribution points around the city, but it was very clear to us that that was inadequate.
Tallman: And the state really expected individual residents of Flint to have to go out and find water day in and day out every day for months and months. And that was frustrating and appalling and shocking, really.
Jared Knicley: Flint is a very poor city; one in five households doesn't have access to a vehicle, and requiring residents to go carry multiple cases of water home a day- it's just extremely burdensome on anyone. Particularly if you have any sort of disability or if you don't have a car. The same was true for filters. Every household in Flint was provided with a filter early on in the process, but they weren't taught how to install filters, they weren't taught how to maintain filters.
Chaudhary: What do you do when in a given moment, people don't have access to safe water? How can we, as attorneys, as advocates, try to help them? And so we started to think about how can we put in place kind of a temporary emergency solution? Something that could ensure that people had ready access to safe drinking water day to day until these larger issues, until they could be addressed.
Tallman: The case that we were trying to make was about how the lack of water was affecting people's everyday lives. And so we had to talk to people and get to know them and develop relationships with them so that they would be willing to share their story in a federal court, which is a scary thing and not an easy thing to do.
Waikar: Ten or twelve of us would come out into Flint over the course of several weekends. We went out in teams of two, literally walking down streets and knocking on doors, and identifying those people who are most in need.
Tallman: It was those stories and those experiences that were ultimately persuasive to the court.
Mays: So we wake up in the morning, and we go to brush our teeth; you have to use bottled water for that. I have three teenage boys who have to use bottled water to wash their face or they break out. Then you take your fast showers, and you move through your day making sure the kids have bottles of water to pack to take to school with them, making sure that we have enough bottled water for whatever I plan to cook that night. Over Thanksgiving, it took 58 bottles of water just to make Thanksgiving dinner. We give bottled water to the dogs, the cat because otherwise, we don't know what would happen. Then at the end of the day, you better make sure you've gotten to the point-of-distribution site if you're going to run out of water. The points-of-distribution centers are open noon to six, Monday through Saturday. My husband and I both work, so a lot of times it's one of us going on our lunch hour, or in between my husband's two jobs to go pick up water really quickly. Because by the time we get done with work, they're closed. So you can go pick up 10, sometimes 14, cases depending on what they'll give you; each site is a little bit different. Then you have to fill up the giant recycling bags and take them out, and you fill up a bag that holds 120 bottles awfully quickly in a family of five. What I do is at night, I make sure that I've refreshed the bottles of water in the bathroom for the boys. The only thing we do now in our home now is we flush our toilets and we shower.
Pastor Overton: The churches have been a big part of this entire recovery process in this crisis. This community worked together to get the people the water, to get the people the filters. Go into homes; I can't even count the number of homes that I went into to install filters. We were in crisis mode. It was a real tough time. You had people that had become very depressed because they felt they had failed their children. So you had parents who felt that they had neglected their children, no fault of their own, just a situation they had been placed into. And now we're trying to heal and recover. Trust is a big issue in this community. Most folks won't even say they're from Flint. They'll say they're from somewhere else, because they don't want the stigmatism that their children have been poisoned.
Knicley: The first big moment in the case was when the judge denied the state and the city's motions to dismiss in the summer of 2016.
Chaudhary: The judge issued a ruling that was incredibly comprehensive and ruled for us on every single issue and said, No, there's enough here for this case to continue. This community has raised some really serious questions about the safety of their water that deserve to be heard. And I think that was that moment when we felt like, OK, we have something here.
Knicley: And that set the stage for us moving forward, taking bottled water delivery and filter installation and maintenance.
Chaudhary: This order came requiring the city and state to make sure that people had safe water in the interim while the case was pending. The city and the state sought to overturn that order. By the end of December, it was clear that they were not going to be successful. Both our judge and the Sixth Circuit Court of Appeals had said, No, there's a real concern for public safety and for public health, and there needs to be more done. At that point, the governor of Michigan requested that the parties be convened for a mediation, and the judge ordered that, and then we all sat down at a table to talk.
Knicley: Once we had a settlement that all the parties were agreed upon, we submitted it to the court for its consideration and approval.
Chaudhary: We went to the courthouse in Detroit. Our clients were there, lots of members from the community were there. I stood up in front of the judge and said, Here's what we've been working on. Here's what we're asking you to approve, and the judge accepted the settlement and entered it and it was an incredible moment. Today is a great win for the city of Flint and an unprecedented outcome in a case like this. Our clients were thrilled. They worked so hard for this result. They're such an inspiring community. We were just so happy and honored that we could help them with this.
Mays: Flint proved that even while poisoned, even while worried about surviving, that we're not just victims, we are fighters.
Tallman: The settlement agreement means that there's an enforceable commitment on the part of the city and state to replace the lead and galvanized steel pipes in the city within three years. And that the state will commit up to $97 million to make that happen. In addition, the state is committing to make sure that every resident in Flint has a properly installed filter in the meantime so that they'll have safe water to drink while all this pipe removal is happening. The settlement also provides that the city and state will conduct robust tap water monitoring to make sure that lead levels in the city continue to go down over time. Everybody should be walking out of here with a water-testing kit.
Mays: We're sitting in the courtroom and I'm sitting next to Pastor Overton and I was like, "Did we just win?" And he was like, "I think so." And we just sat there. Both of us just sat there like, Is this real? Did we actually just get the state to agree to replace pipes? And then we just sat there in shock and then the attorneys turned around and everybody started hugging each other and it was just surreal. That all this work, the year and a half we'd been working on this lawsuit, that it had come to a settlement that was actually helpful for Flint residents.
Pastor Overton: And that was the no. 1 thing that we wanted to do was to get those service lines removed. And we accomplished that. We're now working to get all the lead service lines removed from the city of Flint.
Chaudhary: There's still a lot to be done. We have this great agreement, but it has to be honored and enforced, and so we're going to be watching every step of the way to make sure that the city and state comply with their obligations, and if they don't, we'll be back in court.
Rhea Suh: I hope that the story that comes out of Flint is a story about citizens taking matters into their own hands, utilizing partnerships with organizations like NRDC to seek the justice and the outcome that they deserve. It was the activity of individual people, normal people standing up and advocating for their rights, for their families, for their communities.
Waikar: Flint is an example of how every community can hold government officials accountable, especially when they are simply not doing their job or disregarding the public health and disregarding, frankly, their moral and ethical obligations to ensure the safety of an entire community.
Knicley: For communities that find themselves in a situation similar to Flint, I think this case provides a ray of hope. It shows that courts are a viable option for those communities to enforce their rights to safe drinking water even when it seems like everyone else is against them.
Mays: The state of Michigan didn't expect what happened, which is for all of us to stand up, become educated and become organized, and fight back.
But environmental justice is not just a domestic American issue. It is also a global issue. The globalized nature of our economy and our environment causes pollution and other environmental harms to become concentrated in certain world regions. Quite often, these regions are made up of the world's poorest and least powerful people. This can be seen in the following video on e-waste (or electronic waste) in Accra, Ghana's capital city (4 minutes):
Narrator/Reporter: Recycling West Africa style consumer electronics smashed sorted and the valuable metals extracted. This is Agbogbloshie, Accra where technology goes to die. Workers here are smelting feeding fires with TV casings and fridge interiors, a heat fierce enough to burn the insulation of electrical cables. A fingertip search through the ashes glean scraps of metal that are then sold on take-home pay between five and seven euros. The men boys working here and they range between 13 and 35 years old they're not from Accra they come from the north of the country. And they came here on a sort of gold rush promised riches from waste, but the riches turned out to be a pittance and the gold turned out to be lead, cadmium, and other heavy metals lodged in their bodies and slowly poisoning them.
Hanna Inusah, E-waste Processor: We have problems because if you didn't bathe or maybe bad finish until we just we been in your body unless you get some get some medicine.
Narrator/Reporter: Hanna is just 17 years old taking medicine to work in an environment so toxic that even some of the boys here refused to touch the river running through the site.
Vincet Kyere Nartey, Environmental Specialist: And you could see the smoke also. The smokes is also traveling at any place that in deposit this heavy metals or this the people there can be contaminated. The soil itself, the soil itself, you could see is hugely contaminated just by your sight.
Narrator/Reporter: Time to leave Agbogbloshie and head with Vincent to Ghana's Atomic Energy Commission. The lab has performed a battery of tests on soil from the site they found cadmium 30 times over acceptable levels it can cause cancer kidney failure bone disease levels of lead which attacks the nervous system topped 100 times the recommended maximum dose.
Doctor in Agbogbloshie: You wouldn't live here. I will not advise anybody to live there. Meanwhile this place has been classified as one of the most polluted or contaminated sites in the world.
Narrator/Reporter: The processing at Agbogbloshie she is fed by the illegal traffic of e-waste into Ghana. Today used TVs from Australia and Spain are being loaded onto waiting trucks there's nothing wrong with importing used Tek if it works. If it doesn't, its hazardous waste and it shouldn't be here.
So how many of these TVs actually work? They all work?
Man #1: Yeah 100 percent. About ninety nine percent.
Narrator/Reporter: How big is one percent?
Ghana is working on legislation to prevent illegal e-wastes imports but it's taking time as legislators don't want to curb the legitimate trade in used tech.
Thomas Naada, Ghanian Journalist: We do have some of the equipment that functions when it is imported into the country. So what the tests are seeking to do is to ensure that they don't end up preventing the valuable trade and use electric and electronic equipment.
Narrator/Reporter: In the meantime, young men and boys will continue to stoke the fires at Agbogbloshie and pay a heavy price with their health for a handful of change.
When you no longer want an electronic device that you own, what do you do with it? Where does it end up? Does it end up causing harm to other people? Who are these people? Do they deserve to be harmed by your e-waste? And what can you do about it? These are all difficult questions raised by our ownership of electronic devices. Similar questions are raised by other items that we own and activities that we pursue.
Finally, it is noteworthy that environmental justice is not only about which populations suffer from the burdens of economic development (also known as environmental bads), but also about who has access to environmental goods that contribute to human health. For example, poor communities and populations of color are often denied access to parks, open space, full service grocery stores, and hospitals. The environmental justice movement, therefore, has expanded to ask critical questions about which human populations suffer the burdens of economic development, and which benefit the most from it.
Consider This: Mapping Environmental Justice
Scientists, activist organizations, and stakeholders from different arenas have been working together to map out global environmental justice. The Atlas of Environmental Justice, for example, is a platform that visualizes hotspots of environmental justice across a wide range of fields (e.g., coal extraction and processing, landfills, deforestation, etc.). It is also a database of case studies of communities that grapple with and struggle against the disproportionate distribution of environmental “goods” and “bads.”
Sustainable Development
Sustainable Development
The ideas behind sustainable development can be traced back to early works of scholars such as Rachel Carson's Silent Spring (1962), Garrett Hardin's Tragedy of the Commons (1968), and Paul Ehrlich's Population Bomb (1971). Despite the different focuses of these classic works related to population and environment, all raised public concerns over environmental problems resulting from human activities and highlighted the importance of systems thinking.
Consider This: Sustainable Development Timeline
In Module 3, we learned that there is no single definition of sustainability or sustainable development. The most famous definition is from the United Nations Brundtland Commission Report Our Common Future (1987):
"Sustainable development is development which meets the needs of the present without compromising the ability of future generations to meet their own needs."
So what progress have we made in the decades since the idea of sustainable development was popularized?
Read the Sustainable Development Timeline authored by IISD (International Institute for Sustainable Development) and think about your answers to the question.
Note: The timeline was published in 2012. A few more milestones have been reached since then. One salient milestone is the Paris Agreement on climate change, which was signed in 2015 and entered into force in 2016. Among other things, the Paris Agreement requires all signatory parties (regardless of their industrial development status) to commit to a nationally determined goal of reducing emissions of greenhouse gases. You will read more about international climate change negotiations in Module 9.
Some tremendous efforts and notable achievements have been made towards sustainable development, but is our contemporary civilization sustainable? It turns out that in many ways, it is not. The basic idea of unsustainable development is that there are some things that we are doing today that we cannot continue doing forever. Much of our development depends on natural resources that either cannot be replaced or are not being replaced as fast as we are depleting them. Some major examples are:
- fossil fuels (oil, coal, and natural gas) used for energy
- fresh water supplies used for irrigation and drinking
- minerals used for manufacturing
- trees used for construction and fuel
- fish used for food
Each of these resources is becoming increasingly scarce. We cannot continue using them as we do today. Either we will need to shift away from them on our own, or shortages will force us to change our ways.
There are other reasons why some aspects of contemporary development may be considered unsustainable. Development is changing the global climate system and affecting biodiversity in ways that could have very perilous consequences. We’ll learn about these topics towards the end of the course, but, for now, just note that if we try to continue with development as we have been, then the ensuing changes to climate and biodiversity could eventually prevent us from maintaining our state of development. Finally, as we saw on the previous page, development even today is not necessarily something to be desired. On the other hand, development involves much of what is important to us and thus is not something we can easily walk away from. Achieving development that is both desirable and sustainable is a major goal for our lives and our society.
In the next two modules, we’ll examine some important aspects of sustainable development in greater detail.
Summary
Summary
This module was designed to introduce to you the idea of development, including sustainable development, and give an overview of development around the world. Development is a complex and contested concept, lacking a single universally accepted definition. But we can still recognize some general features of development, whether measured via monetary, health, end uses, or other indicators. We can see that today the world is unevenly developed and that this contemporary pattern is not solely determined by the natural environment but the product of both social and environmental factors that have been going on throughout human history. It is this development that enables us to enjoy the comforts and conveniences of our time and place, such as the opportunity to take online courses. But development has its downsides and, for better or worse, these downsides frequently affect the nation's and the world's poorest and least powerful. Finally, our contemporary development depends on certain natural resources that will not last forever, raising questions about the sustainability of our development.