Assignment 3.1: Freshwater sources Part 2 – Groundwater.
Diagram a generalized hydrologic cycle for a large watershed or river basin, preferably in your geographic location or region. Your report should consist of 5 PPT slides. A template is provided, but you can alter to suit your artistic style (Hydrologic Cycle template). Include:
- a title slide with the name of the watershed, your name, Assignment #, date;
- a location map of the watershed, appropriately labeled with scale and north arrow;
- hydrologic cycle - use the illustration provided in slide 3, with blank labels to name the appropriate components and some measure of their relative contributions to the hydrologic cycle (e.g., slide 12 from Lecture 2.1 PPT displays thousands of cubic kilometers, whereas slide 13 displays in cubic miles per year; other units are possible, such as %);
- add methodology indicating how you arrived at your calculations. NOTE: Flows should be expressed in terms of volume using comparable, per-time units, e.g.: cubic meters per-year, cubic-feet per year, or liters per year, gallons per year, etc.
- short background information about the watershed (size, geology, Köppen climate, land use, unique fact, etc.)
- citations for data sources.
| Description | Full points | Partial points | No points | Points total |
|---|---|---|---|---|
| Presentation slides | All 5 slides are included. | 1 or more slides are missing. | 3 | |
| Content | Good overview. Contribution values are accurate for the watershed. Metric units are used. Maps and images are easy to read. | Good overview. However, 2-3 contribution values are wrong or missing for the watershed. Metric units are not used. Maps and images are easy to read. | Overview lacks detail and 3+ contribution values are wrong or missing for the watershed. Metric units are not used. Maps and images are difficult to read. | 20 |
| College-level writing | No grammar or spelling mistakes. Content is organized well. | 2-3 grammar or spelling mistakes. Flow and organization of content could be improved. | 3+ grammar or spelling mistakes. Content does not flow and is unorganized. | 5 |
| Citations | Included a complete works cited page. All information is in the student’s own words and appropriately cited. | Works cited page is incomplete. Some information is not written in the student’s own words. | 2 |
Note
I am looking for creativity in how individual students find and select information to use for their hydrologic cycle, and how they choose to display this information. Thus, I do not include detailed directions or an exact template. The sources of hydrologic information are no less than staggering – so do the best you can, and at least investigate several of the sources listed below – there are many more. If you cannot seem to find suitable quantitative data, then look for a published example for somewhere near your geographic location. Alternatively, choose a watershed where data is available.
- Centralized services for hydrologic data – takes some practice
- Agency site – fairly easy to navigate.
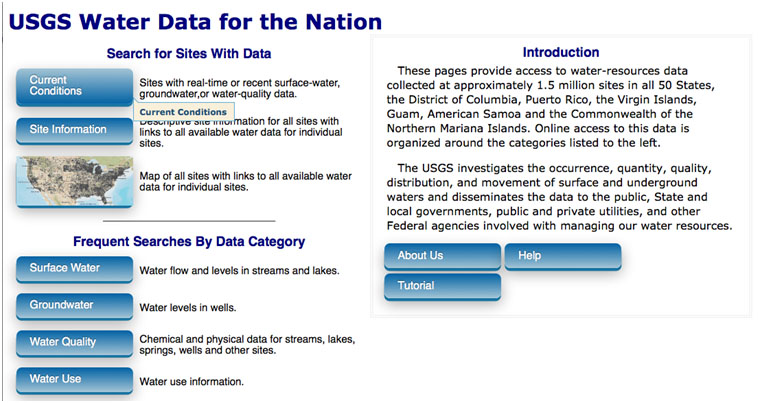
See example screenshot of a USGS stream gauging station from a link to this site at the end of this lesson, and Figure 3.1 below, showing data from the USGS water portal menu.
Refer to the Lecture 2.1 PPT, slide 40, for a listing of HUC watersheds areas. Choose one with the general area of a river basin (HUC-6, 1,000s of mi2) or a subbasin (HUC-8, 100s of mi2). You can define your location by specific longitude and latitude, as a watershed within an ecoregion, or political unit (e.g., 40°47'34”N 77°52'0”W; or Centre County, Pennsylvania; or the glaciated Pocono Region of northeastern Pennsylvania; or the Spring Creek watershed). An illustrative template slide for the hydrologic cycle is provided, which you can modify as needed. I'm using the local watershed where the University Park Campus of Penn State is located.
The level of detail and specificity of numerical values for components of the hydrologic cycle is flexible. You can use whatever sources are available (remember to cite them on the last PPT slide of your assignment).
Deliverable
Please submit your paper using the Assignment 3.1 Hydrologic Cycle Microsoft PowerPoint drop box under Lesson 3 in Canvas. (See the Calendar in Canvas for specific due dates.)