Lessons
The links below provide an outline of the material for this course. Click on any of the lesson names below to begin reading the lesson content.
Lesson 1: What Is Fresh Water?
The links below provide an outline of the material for this lesson. Be sure to carefully read through the entire lesson before returning to Canvas to submit your assignments.
Overview
This lesson will give you an overview of the physical and chemical properties of water, and some insight into how those properties define aquatic ecosystems and influence society's use of water. Read through Lesson 1 material, then review the Lecture 1.1 Microsoft PowerPoint. This Microsoft PowerPoint provides an introduction to Lesson 1 and the overall course. It includes definitions, a brief course outline, an introduction of water uses through time, and some visual impressions of water in art and aquatic ecosystems.
Learning Outcomes
After completing this lesson, you should be able to:
- compare the physical and chemical properties of water in three different phases;
- explain how the physical and chemical properties of water define aquatic ecosystems;
- identify how the properties of water influence society's use of water.
Lesson Roadmap
This lesson is one week in length. Please refer to the Course Calendar in Canvas for specific time frames and due dates. To finish this lesson, you must complete the activities listed below.
| Requirements | Assignment Details | Access/Directions |
|---|---|---|
| To Watch |
Watch/Read through the Lecture 1.1 - Introduction PowerPoint file. |
Registered students can access the Microsoft PowerPoint file under Lesson 1 in Canvas. |
| To Read |
|
|
| To Do |
Complete and submit your synopsis of a historic use of water (2 pages). |
Submit your synopsis in the Assignment 1.1 - What is freshwater? dropbox under the Lesson 1 module in Canvas. |
Questions?
If you have any questions, please post them to our Questions? discussion forum located under Orientation and Resources in Canvas. While you are there, feel free to post your own responses if you, too, are able to help out a classmate.
Background
If there is magic on this planet, it is contained in water.
The Immense Journey by Loren Eiseley (1907-1977), anthropologist and author.
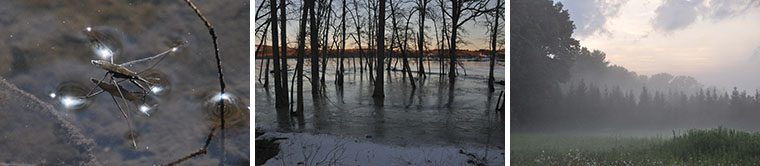
Loren Eiseley's quote says much about the amazing attraction of watery environments for humans, and much about the unique physical properties of water, too. The surface tension of liquid water allows water striders to dance across the film. The crystalline structure of ice, solid water, is less dense that of water as a liquid, so those of us in cold, wintry climatic regions can ice skate on the surface of a pond. The mysterious approach of fog, condensing water in a gaseous form, fascinates us in the dim light of dawn or dusk; and in some parts of the world, fog provides the only source of nourishing moisture (e.g., coastal reaches of the Atacama and Namib deserts in Chile and Namibia, respectively, both geographically located in the southern hemisphere near cold ocean currents flowing northward to the equator).
The common occurrence of water on Earth in three distinct physical states – liquid, solid, and gas – is fundamentally important to most life on our Blue Planet, including humans. This simple molecule consisting of two positively-charged hydrogen atoms bonded with one negatively-charged atom of oxygen creates the many forms of water we experience. This type of molecular attraction allows the cohesion of water molecules, whereas another type of chemical bond attraction leads to adhesion, the property that makes water a so-called “universal solvent” capable of dissolving many more substances than other liquids.
Our dependency on water in daily life – making coffee or tea, storing frozen foods in a freezer, negotiating constantly changing weather conditions when we travel – has made us all familiar with the key temperatures at which water freezes (0°C, 32°F) or boils (100°C, 212°F) at the benchmark pressure of sea level. Perhaps less known is the temperature at which water becomes most dense (4°C, 39°F), yielding ice-covered lakes and ponds, floating icebergs and iceflows, and even floating ice cubes in a chilled beverage. Another confounding, but influential, characteristic is water's high specific heat whereby much heat is absorbed before the temperature rises, and the slow release of that absorbed heat to the surrounding environment. Those dwelling in coastal regions or by large lakes will recognize this “marine or coastal influence” that moderates temperature fluctuations on adjacent lands.
In Lessons 4 and 5, we will delve further into how aquatic ecosystems are classified, and where and why they are distributed unevenly around the planet, respectively. As can be seen in Figure 1.2, freshwater comprises a small proportion, less than 3%, of all water on Earth -- the great majority of that, about 69% of the freshwater proportion, existing as a solid in ice caps, glaciers, and permafrost. About 30% of the freshwater occurs as liquid groundwater. Only 1% of the total amount of freshwater exists as a liquid in our rivers, lakes, and wetlands, soil moisture, and living organisms, leaving only a tiny bit in gaseous form as part of the atmosphere.
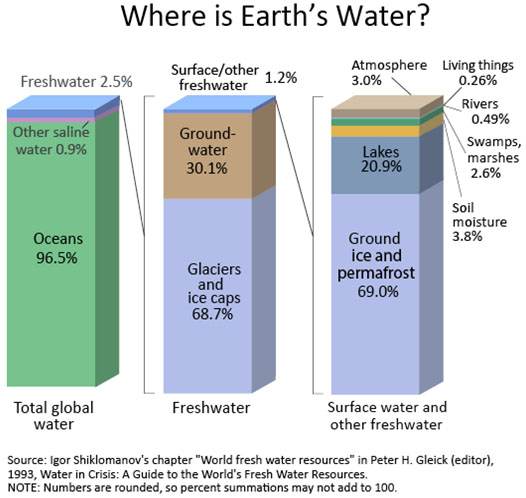
Total global water
-
Oceans 96.5%
-
Other saline water 0.9%
-
Freshwater 2.5%
-
Glaciers and ice caps 68.7%
-
Groundwater 30.1%
-
Surface/other freshwater 1.2%
-
Ground ice and permafrost 69.0%
-
Lakes 20.9% Soil moisture 3.8%
-
Atmosphere 3.0%
-
Swamps, marshes 2.6%
-
Rivers 0.49%
-
Living things 0.26%
-
-
“Not man apart” – a quotation from John Robinson Jeffers (1887-1962), an American poet. This brief expression is taken from his poem, The Answer (1936), and was adopted by environmental leaders and organizations, particularly the Sierra Club and Friends of the Earth in the 1960s and 1970s, as a way to stimulate action on environmental issues. David Brower, a founder of the Sierra Club and Friends of the Earth, published a Sierra Club book of photographs and Jeffers' quotes about Big Sur along the California coast. It makes the point that “we” have been dependent upon water throughout our existence. At a minimum, we use the oceans for food, transportation, and recreation, but our links to freshwater are essential.
From the beginning of time, animals, including humans, that depend on freshwater have searched for, gathered by, and managed water resources for their benefit. These primary ecosystem services, as we now refer to them, involved drinking, bathing, cooking, and irrigating crops, for our basic needs. Over time, as the principles of physical science and engineering knowledge have accumulated, management and manipulation of water resources by human societies have become nothing short of amazing. In this exercise, we will investigate and share examples of how humans have supplied freshwater to meet their basic needs. Each student gets to choose the time period and the specific example to describe, thus providing all of us with a series of relevant, successful (or perhaps unsuccessful) stories of how cultures around the world and through time have managed water resources.
Readings
Now that you have read the background material for the lesson, you should watch my Lesson 1 Microsoft PowerPoint, read Chapter 1 from the course textbook, and familiarize yourself with the material on the USGS Water Science website.
The Lecture 1.1 Microsoft PowerPoint is designed to give an overview of water resources and review topics/assignments for GEOG 431. We begin with What is water? and Where is water? using a variety of images to supplement Chapter 1 of the text. The latter sections cover uses of water - past and present - as a way to stimulate your thinking about which historic period you'd like to research for Assignment 1.1. We finish with water themes in art, and a few of my photographic images on water and aquatic ecosystems.
Required Viewing
GEOG 431 Lecture 1.1 What is freshwater? The Pennsylvania State University, University Park, PA, USA.
Registered students can access the GEOG 431 Lesson 1 Lecture 1.1 PowerPoint file located under Lesson 1 in Canvas.
Note: The PowerPoint files for this course are not annotated voice-over video lectures. They are a series of slides that contain important information to supplement the readings.
The first reading is Chapter 1 from the Holden text, where he describes the physical and chemical properties of water in more detail than the Lecture 1.1, and introduces us to water issues throughout the world. A few new terms are introduced here - they are highlighted - but many more will be covered in Lesson 2 and Chapter 2 of the text.
Required Reading
Chapter 1 – Water Basics (p.1-19)
This reading is from the required course text (Holden 2020).
The U.S. Geological Survey is the federal agency in the USA most responsible for understanding and assessing water quantity. They are a science-based agency with little or no regulatory authority. Their websites and publications offer a wealth of information about the basic characteristics and measurement of water that is applicable to freshwater anywhere is the world. Become familiar with their educational website now, and I'm sure you will revisit it during the course when you either need a bit more information about a term or topic or you are just curious about some aspect of freshwater.
Required Reading
USGS Water Science School website [1] is a tremendous source of information.
Lesson 1, Activity
In the Lecture 1.1 Microsoft PowerPoint, you were introduced to a few achievements and uses of freshwater. The text also covers various historic and current water uses. Your assignment for Lesson 1 is to investigate a historic provisioning of freshwater by earlier civilizations, preferably well before 1800, but absolutely before 1900. Thus, you have a 4,000-year “window” from which to gaze upon the past! Choose a place and time period (e.g., a particular phase in a civilization’s history) and document and synthesize their approach to water management. Prepare a 2-page paper, including graphics and citations about your chosen moment in time. Be sure to adequately cite all resources used, including images and maps.
| Description | Full points | Partial points | No points | Points total | |
|---|---|---|---|---|---|
| Topic selection | Appropriate time period selected (pre-1900) and focused on water management. | Appropriate time period (pre-1900) selected but lacks focus on water management. | Inappropriate time period selected and no acknowledgement of water management. | 5 | |
| Content | Thoroughly provides details on 2+ aspects of water management. Demonstrates an understanding of its role in the civilization’s history. | Talks about 2+ aspects of water management. However, details are vague and do not demonstrate an understanding of its role in the civilization’s history. | Only 1 aspect of water management discussed. However, details are vague and do not demonstrate an understanding of its role in the civilization’s history. | No discussion of water management. | 15 |
| College-level writing | No grammar or spelling mistakes. Content is organized well. | 2-3 grammar or spelling mistakes. Flow and organization of content could be improved. | 3+ grammar or spelling mistakes. Content does not flow and is unorganized. | 5 | |
| Citations | Included in-text citations and a complete works cited page. All information is in the student’s own words and appropriately cited. | Missing 2-3 in-text citations or works cited page is incomplete. Some information is not written in the student’s own words. | Missing 3+ in-text citations or works cited page is incomplete. Most information is not written in the student’s own words. | 5 | |
Deliverable
After you have gathered enough information, compose a 2-page paper about historic provisioning of freshwater by earlier civilizations. Please submit your paper using the Assignment 1.1 - What is freshwater? drop box under Lesson 1 in Canvas. (See the Calendar in Canvas for specific due dates.)
Summary and Final Tasks
Summary
You have now completed Lesson 1 and should have gained further understanding about the physical and chemical properties of freshwater that make it essential to our existence. You need to have basic knowledge of the three phases of water - what are they?! In the next several lessons, we will explore surface water and groundwater in much more detail, and then use that information to look at how we classify freshwater and how water of all phases and types strongly influences the Earth's weather and climate.
Reminder - Complete all of the Lesson 1 tasks!
You have reached the end of Lesson 1! Double check the to-do list on the Lesson 1 Overview page [3] to make sure you have completed all of the activities listed.
Lesson 2: Freshwater Sources. Part 1. – Precipitation and Surface Flows
The links below provide an outline of the material for this lesson. Be sure to carefully read through the entire lesson before returning to Canvas to submit your assignments.
Overview
The emphasis on precipitation and surface flows in Lesson 2 is necessary to gain familiarity with how these sources are generated and how they become essential resources for both aquatic ecosystems and human use. The lesson and readings will present information about precipitation and surface flows, especially for rivers, as two of the three major water sources. The lesson will also help you become familiar with basic hydrologic terms, so you can explain the movement of water through the hydrologic cycle, and as the driver of dynamism in rivers, including floods and droughts.
Learning Outcomes
By the end of this lesson, you should be able to:
- define and explain several terms related to freshwater sources;
- explain the importance of climate variability and extremes on the water cycle;
- explain the importance of climate variability and extremes on the provisioning of freshwater to society;
- describe and diagram the main hydrologic pathways from land surfaces into rivers and lakes;
- describe and diagram the dynamic aspects of undammed rivers and streams, floodplain formation, and processes of flooding.
Lesson Roadmap
This lesson is one week in length. Please refer to the Course Calendar in Canvas for specific time frames and due dates. To finish this lesson, you must complete the activities listed below.
| Requirements | Assignment Details | Access/Directions |
|---|---|---|
| To Watch |
Watch/Read through the following PowerPoint files.
|
Registered students can access the Microsoft PowerPoint files under Lesson 2 in Canvas. |
| To Read |
|
|
| To Do |
|
|
Questions?
If you have any questions, please post them to our Questions? discussion forum located under Orientation and Resources on Canvas. While you are there, feel free to post your own responses if you, too, are able to help out a classmate!
Background
…nearly everybody has a creek gurgling through their memories, a confiding waterway that rose in the spring of youth.
Peter Steinhart, The meaning of Creeks. Audubon, May 1989, p.22-23
Gaining an understanding the sources of water is fundamental to learning about water resources. Lessons 2 and 3 focus on the three primary sources of freshwater; precipitation and surface flows (Lesson 2), and groundwater (Lesson 3). In reality, of course, these sources comprise a highly integrated system known as a hydrologic cycle, which is a conceptual model representing both storage of water (referred to as reservoirs or pools), and the flows or exchanges between those reservoirs.
In Chapter 2 of the text, the important terms evapotranspiration, interception, and condensation are described. Formal definitions can be found in the text's glossary, beginning on p.351. Further information is available from the USGS weblink listed in Lesson 1 [1].
Water vapor in the atmosphere modulates the adsorption and emission of infrared radiation, representing the heat generated by solar radiation. As we will see in Lesson 5 on climate types, the tropics receive about twice the amount of solar radiation as polar regions, and thus, the natural global energy budget flows from the tropics along the equator toward both poles. Circulation patterns of water vapor in the atmosphere are the major driver of that energy cycle (60%), along with oceanic currents (40%) (Stevens 2011, from Sitch and Drake 2014, Chapter 2).
As we learned in Lesson 1, the phase changes among the liquid, solid, and gaseous states of water govern these processes. When water evaporates from the surfaces of soil, vegetation, or liquid water, energy is absorbed. When the reverse process occurs through condensation, energy is released as water vapor reverts to liquid water (a characteristic known as the latent heat of vaporization, Sitch and Drake 2014). When surfaces cool, water vapor condenses, producing dew (changing from a gas to a liquid). When this occurs in the atmosphere, the condensing water vapor eventually becomes a form of precipitation (i.e., rain, snow, sleet, etc.). As precipitation falls, it may be intercepted by plant or land surfaces before flowing across the ground to a body of water, or infiltrate into shallow or deep groundwater.
Differential patterns of precipitation across the Earth's surface, driven by these complex interactions between energy and water, create weather and ultimately define climate (further considered in Lesson 5). Climate variability, then, ranges between fairly predictable temperature and precipitation conditions and less predictable extremes, such as horrific storms and severe drought. Although not a major topic for this course, water vapor's influence on the natural greenhouse effect, estimated to be 60% (Kiehl and Trenberth 1997, from Sitch and Drake 2014), is exacerbated by release of human-generated greenhouse gases, primarily from burning of fossil fuels. Refer to the most recent reports of the Intergovernmental Panel on Climate Change [5] (IPCC, 2022, http://www.ipcc.ch/ [5]) for additional information.
Evapotranspiration is comprised of two interacting processes, the physically-based evaporation of water from surfaces, and the biologically-mediated transpiration of water loss from the stomata (specialized cells) of vascular plants that allow the “escape” of liquid water to water vapor as a means of cooling leaf surfaces (see Lecture 2.1 PPT). Again, once water vapor from any source accumulates sufficiently in the atmosphere, precipitation occurs, returning liquid water to the oceans and land surfaces.
Why is this critically important to patterns of freshwater use (coming up in Lessons 7 and 8)? Because over 50% of the world's potable water comes from rivers – the water people consume. So, let's turn our attention to Chapter 3, to examine the hydrologic behavior of flowing waters in rivers and streams.
Rivers and streams, and their associated floodplains, are common delivery systems for moving freshwater across a landscape to receiving bodies of water, basins, or the oceans. Thus, we will focus more on riverine systems than lacustrine (lakes) or palustrine (vegetated wetlands) systems. The readings and Lectures 2.1 and 2.2 PPTs were chosen to familiarize you with how river systems function across the globe. They provide important habitats for a tremendous variety of species of plants and animals, fish being perhaps the most obvious water-dependent group. They also serve human needs by providing water supplies for drinking, agriculture, wastewater, energy and industrial needs, transportation, and recreation. Extreme events, such as floods and droughts, unfortunately, cause destruction to natural ecosystems, property damage, and loss of human life. Floods are created by high volume rainstorms or snowmelts, or by ocean-generated storms such as hurricanes and typhoons. Droughts, essentially a severe shortage of rainfall or snowmelt over extended periods of time, can damage the same systems, but in different ways. The Lecture 2.2 PPT provides an overview.
The importance of the headwater portions of watersheds to the overall health of aquatic ecosystems in many regions cannot be overemphasized. For example, in the Mid-Atlantic Region of U.S., in the area surrounding Washington, DC, headwaters typically comprise about 67–75% of the contributing area of any given watershed. That is, the combined areas of terrestrial habitats, wetlands, floodplains, and headwater streams occupy two-thirds to three-quarters of the total area of the drainage basin for larger rivers (Brooks et al. 2013). Given this influence on downstream portions of large river watersheds, understanding the impacts of human activities on the ecological structure and function of headwater or tributary portions of watersheds is foundational for optimizing their conservation and management. It is also critically important to understand the linkages and contributions of headwaters to the downstream portions of watersheds where large rivers and broader floodplains dominate.
Increasingly during the past decade, ecologists and hydrologists have moved toward integrating the traditional studies of the upstream–downstream gradient of rivers to produce a more comprehensive view of all the aquatic components of watersheds, and their interactions with terrestrial areas (Fig. 2.1, Brooks et al. 2013). The dimensions of these systems include: longitudinal or first dimension, river channel, streambanks) with lateral or second dimension (e.g., floodplains, riparian corridors, wetlands) and vertical or third dimension (e.g., groundwater flows, hyporheic zone) portions. As you work through the materials, try to visualize how water flows through this ecosystem from a 3-dimensional spatial perspective, and with regard to time. When you are in the field, near a stream, lake, or wetland, try to conceptually imagine how water is supporting and flowing through that system. As you begin to understand the principles that explain surface and groundwater flows between the river channel and other components of the riverine ecosystem, your understanding of how hydrological and ecological processes operate in rivers, and how they affect human use of these vital resources, will come into focus.
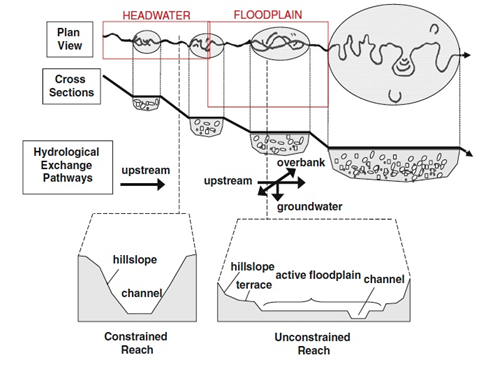
The separation of aquatic components of watersheds is common in regulatory and management contexts where streams and rivers are treated as separate entities from lakes, wetlands, and estuaries. In the past, such a separation was more for the convenience of defining and managing these units, than it was based on any ecological principles. There are important hydrological and ecological linkages between streams, rivers, and their adjacent floodplains and wetlands, together, comprising a riverine ecosystem. When the interactions with terrestrial components are considered, a holistic aquatic landscape or watershed can be visualized. Increasingly, syntheses in the literature have begun to move beyond the stream or river channel alone, to incorporating linkages between rivers and the landscapes in which they flow, thus recognizing longitudinal, lateral, and vertical aspects of the riverine network (Brooks et al. 2013). We begin focusing on this theme of integrating waters here in Lesson 2, and we will further develop it in Lesson 3, especially for Assignment 3.1.
Perusing the readings for Lesson 2, in the order listed, will have you progress from how precipitation and surface flow sources are generated, and how they are manifested in riverine systems (Chapters 2 and 3 of Holden, 2014). Chapter 4 covers surface water quality in some depth. It can be skimmed to become familiar with the types of stressors that degrade water quality. The last reading covers the integration of waters, primarily for the Mid-Atlantic Region of the U.S., but it provides a thorough background, and extensive literature citations, for comprehending current thinking about riverine systems, especially with regard to hydrology, energy flow, and the three components of water quality – physical, chemical, and biological.
Readings
The readings for Lesson 2 are substantial; please budget your time carefully and allow sufficient time.
Chapter 2 of the text by Sitch and Drake provides a global perspective on our water cycle. Note that Figure 2.1 - a global hydrologic cycle - is similar to the more local hydrologic cycle you will attempt to construct for Assignment 3.1 in Lesson 3. All of the readings and PowwerPoint files for Lessons 2 & 3 are aimed at helping you do just that!
Required Reading
Holden (2020) – Sitch and Drake, Chapter 2 – The changing water cycle (p.23-52)
This reading is from the required course text.
Chapter 3 of the text provides more water hydrology and flow characteristics with which you should be familiar.
Required Reading
Holden (2020) – Holden, Chapter 3 – Surface water hydrology (p.61-94)
This reading is from the required course text.
The Lecture PPTs 2.1. and 2.2 are designed to cover the primary sources of water and lead you to an solid understanding of a hydrologic cycle - something that is relatively easy to conceive of, but much, much harder to measure. The Lecture 2.1 PPT introduces you to the surface water portion of the hydrologic cycle. Water budgets are briefly illustrated, but you will not be expected to compute a budget. A series of concepts and terms are introduced following along with the Background and Chapter 2 of the text. Watersheds (and HUCs) are described and illustrated with an emphasis on the dynamic nature of rivers and streams. We finish up with the climate predictions affecting water from the IPCC 6th Assessment reports (Reports — IPCC [6]). Remember to refer to the text's glossary and/or the USGS website for clarifying or supplementary information on these topics.
Required Viewing
Lesson 2 – Lecture 2.1 – Surface Water and Precipitation - Brooks.
Registered students can access the GEOG 431 Lesson 2 Lecture 2.1 file located under Lesson 2 in Canvas.
Lecture 2.2 PPT covers the extremes of the water sources - floods and droughts - using lots of images and illustrations.
Required Viewing
Lesson 2 – Lecture 2.2 – Floods and Droughts - Brooks)
Registered students can access the GEOG 431 Lesson 2 Lecture 2.2 file located under Lesson 2 in Canvas.
The Brooks et al. 2013 chapter provides you with an integrated view of aquatic habitats, not only the physical and structural attributes, but through processes and functions as well. There is quite a bit of ecological information packed into this reading, the details of which I would not expect you to master from this one chapter. The emphasis is on headwater systems in the upper reaches of watersheds, but much of the information is pertinent to freshwater resources in general, even though the subject matter is the Mid-Atlantic Region. Other chapters of this book, and similar ones, are available to you through Google Scholar and Penn State's arrangements with major publishers like Springer.
Required Reading
Brooks, RP, C Snyder, MM Brinson. 2013. Aquatic Landscapes: the importance of integrating waters. Chapter 1 (p. 1-37) in RP Brooks and DH Wardrop (eds.) Mid-Atlantic Freshwater Wetlands: Advances in science, management, policy, and practice. Springer Science+Business Media, 491+xiv pp.
The Brooks, Snyder, Brinson reading is available through Google Scholar [4]. Search for "Aquatic Landscapes: the importance of integrating waters." Registered students can access this reading in the Lesson 2 module in Canvas.
Chapter 4 of the text focuses on the chemistry aspects of water quality, particularly for major stressors on and threats to water resources. I suggest skimming this chapter and only delving into detail on topics that interest you.
Required Reading
Holden (2020) – skim Chapman et al., Chapter 4 – Surface water quality (p.99-142)
This reading is from the required course text.
Lesson 2, Activity
Deliverables
There are no deliverables for Lesson 2. Please focus your time on the readings for the week and on your discussion post.
Summary and Final Tasks
Summary
The emphasis in Lesson 2 on precipitation and surface flows was to gain familiarity with how these sources are generated, and how they become essential resources for both aquatic ecosystems and human use. Having completed the readings and reviewed the PPT lectures, circle back to the introductory page of Lesson 2 and make sure you can explain the basic aspects listed under Learning Outcomes, as well as the bolded terms through the lesson.
It's now time to move on to Lesson 3 and continue to assimilate additional knowledge about freshwater sources - this time, focusing on groundwater. For Assignment 3.1, you'll be applying your knowledge about precipitation, surface water, and groundwater and using it to create a hydrologic cycle for a geographic area near to your home base.
Reminder - Complete all of the Lesson 2 tasks!
You have reached the end of Lesson 2! Double check the to-do list on the Lesson 2 Overview page [7] to make sure you have completed all of the activities listed there before you begin Lesson 3.
Lesson 3: Freshwater Sources. Part 2. – Groundwater
The links below provide an outline of the material for this lesson. Be sure to carefully read through the entire lesson before returning to Canvas to submit your assignments.
Overview
Images are worth a thousand words...
Learning Outcomes
After reading through Lesson 3, reading Chapter 5 from the text, plus reading the Winter et al. 1998 report, you should be able to:
- distinguish between the roles of surface flows and groundwater in the hydrologic cycle;
- define and explain the following terms: recharge, discharge, aquifer, water table, hydraulic head (and related terms and concepts);
- explain Darcy's Law (text, p.161-162). (Note: you will not need to compute flows.)
Lesson Roadmap
This lesson is one week in length. Please refer to the Course Calendar in Canvas for specific time frames and due dates. To finish this lesson, you must complete the activities listed below.
| Requirements | Assignment Details | Access/Directions |
|---|---|---|
| To Watch |
Watch/Read through the Lecture 3.1 – Groundwater PowerPoint file. |
Registered students can access the Microsoft PowerPoint files under Lesson 3 in Canvas. |
| To Read |
|
|
| To Do |
Assignment 3.1 will be to create a Microsoft PowerPoint presentation containing a diagram of a generalized hydrologic cycle for your location or region. |
Submit your PowerPoint in the Assignment 3.1 Hydrologic Cycle PowerPoint drop box under Lesson 3 in Canvas. |
| To Do |
Take Quiz 1 which will cover material from lessons 1, 2, and 3. |
Registered students can access Quiz 1 under Lesson 3 in Canvas. |
Questions?
If you have any questions, please post them to our Questions? discussion forum under Orientation and Resources in Canvas. While you are there, feel free to post your own responses if you, too, are able to help out a classmate.
Background
As we learned in Lesson 1, the storage reservoirs of groundwater greatly exceed those of atmospheric water vapor and precipitation, and the amount found in bodies of freshwater, such as rivers. About 22% of the world's population relies solely on groundwater for their daily needs, accessed primarily through dug or drilled wells (West and Odling 2014). However, there is a lot more to understand about groundwater than drilling a well and finding water!
As the term groundwater indicates, this source lies below the Earth's surface and, therefore, is more difficult to visualize and access. When precipitation or surface water infiltrates into deeper layers of soil or rock, this is known as recharge because the aquifer is gaining more volume. Conversely, when groundwater seeps or flows out onto the surface, or into a body of water, the term used is discharge. The origin, storage, and flow of groundwater are covered extensively in Chapter 5 of the text, so they will not be elaborated on here. Studying the diagrams concerning groundwater in Chapter 5 and in the Lecture 3.1 PPT will be especially useful for visualizing what is often a hidden and mysterious feature beneath the Earth's surface.
When people seek access to groundwater reserves, they most often dig (shallow) or drill (much deeper) a well. Qanats, the ancient water-yielding tunnels from the Middle East (Harvesting Water and Harnessing Cooperation: Qanat Systems in the Middle East and Asia | Middle East Institute (mei.edu) [8]), demonstrate the level of sophistication possible in designing and engineering a complex infrastructure in arid regions, which was developed over 3,000 years ago. The drilling of wells in modern times requires a substantially different, but effective, technology.
Readings
The readings for Lesson 3 are substantial. Please allow sufficient time.
The PowerPoint file for Lecture 3.1 Groundwater is fairly brief, providing the basics and covering a few points not mentioned in text Chapter 5 (by West and Sinha), which is quite thorough. As you go through the slides and the readings, be thinking about how surface waters and groundwater are really parts of an overall hydrologic system. Lessons 2 and 3 combined will help position you for "conquering" Assignment 3.1.
Required Viewing
Brooks, RP. 2014. GEOG 431 Lecture 3.1 Groundwater.
Registered students can access the GEOG 431 Lec 3.1 Groundwater PowerPoint file under Lesson 3 in Canvas.
Chapter 5 from the text covers the topics of groundwater well. The chemistry and contaminant portions that begin on p.173 provide a good summary of these phenomena, but the details are somewhat beyond the intent of this course. Be familiar with the concepts, but do not memorize the chemical equations - at least for this course.
Required Reading
Holden (2020) – West and Sinha, Chapter 5 – Groundwater (p.152-173, skim Groundwater Chemistry 173-189)
This reading is from the required course text.
The Winter et al. (1998) reading - a classic - does exactly what we are trying to do here, that is to think holistically about the interactions between hydrologic events on the surface and those below ground. In essence, this is the background behind any hydrologic cycle. At this point, you should be ready to work on your choice of a hydrologic cycle. A PPT template for Assignment 3.1 can be found in Lesson 3 on Canvas. Delete my examples for Spring Creek, and insert your own.
Required Reading
Winter, TC, JW Harvey, OL Franke, and WM Alley. 1998. Ground water and surface water – a single resource. U.S. Geological Survey Circular 1139. 87pp.
Registered students can access a copy of the reading under Lesson 3 in Canvas.
Lesson 3 Activity
Assignment 3.1: Freshwater sources Part 2 – Groundwater.
Diagram a generalized hydrologic cycle for a large watershed or river basin, preferably in your geographic location or region. Your report should consist of 5 PPT slides. A template is provided, but you can alter to suit your artistic style (Hydrologic Cycle template). Include:
- a title slide with the name of the watershed, your name, Assignment #, date;
- a location map of the watershed, appropriately labeled with scale and north arrow;
- hydrologic cycle - use the illustration provided in slide 3, with blank labels to name the appropriate components and some measure of their relative contributions to the hydrologic cycle (e.g., slide 12 from Lecture 2.1 PPT displays thousands of cubic kilometers, whereas slide 13 displays in cubic miles per year; other units are possible, such as %);
- add methodology indicating how you arrived at your calculations. NOTE: Flows should be expressed in terms of volume using comparable, per-time units, e.g.: cubic meters per-year, cubic-feet per year, or liters per year, gallons per year, etc.
- short background information about the watershed (size, geology, Köppen climate, land use, unique fact, etc.)
- citations for data sources.
| Description | Full points | Partial points | No points | Points total |
|---|---|---|---|---|
| Presentation slides | All 5 slides are included. | 1 or more slides are missing. | 3 | |
| Content | Good overview. Contribution values are accurate for the watershed. Metric units are used. Maps and images are easy to read. | Good overview. However, 2-3 contribution values are wrong or missing for the watershed. Metric units are not used. Maps and images are easy to read. | Overview lacks detail and 3+ contribution values are wrong or missing for the watershed. Metric units are not used. Maps and images are difficult to read. | 20 |
| College-level writing | No grammar or spelling mistakes. Content is organized well. | 2-3 grammar or spelling mistakes. Flow and organization of content could be improved. | 3+ grammar or spelling mistakes. Content does not flow and is unorganized. | 5 |
| Citations | Included a complete works cited page. All information is in the student’s own words and appropriately cited. | Works cited page is incomplete. Some information is not written in the student’s own words. | 2 |
Note
I am looking for creativity in how individual students find and select information to use for their hydrologic cycle, and how they choose to display this information. Thus, I do not include detailed directions or an exact template. The sources of hydrologic information are no less than staggering – so do the best you can, and at least investigate several of the sources listed below – there are many more. If you cannot seem to find suitable quantitative data, then look for a published example for somewhere near your geographic location. Alternatively, choose a watershed where data is available.
- Centralized services for hydrologic data – takes some practice [9]
- Agency site – fairly easy to navigate [10].
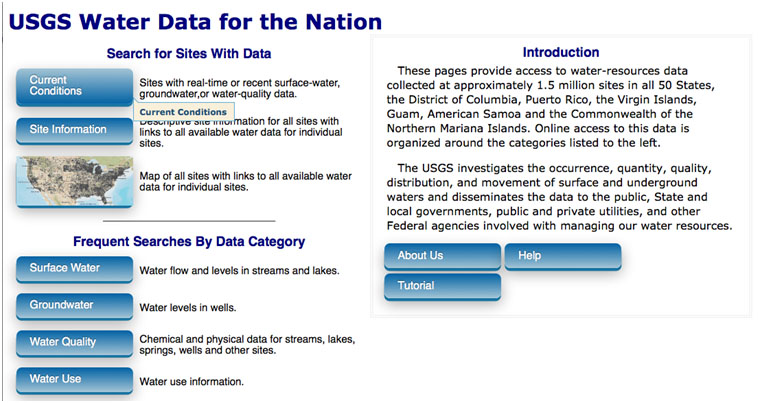
See example screenshot of a USGS stream gauging station from a link to this site at the end of this lesson, and Figure 3.1 below, showing data from the USGS water portal menu.
Refer to the Lecture 2.1 PPT, slide 40, for a listing of HUC watersheds areas. Choose one with the general area of a river basin (HUC-6, 1,000s of mi2) or a subbasin (HUC-8, 100s of mi2). You can define your location by specific longitude and latitude, as a watershed within an ecoregion, or political unit (e.g., 40°47'34”N 77°52'0”W; or Centre County, Pennsylvania; or the glaciated Pocono Region of northeastern Pennsylvania; or the Spring Creek watershed). An illustrative template slide for the hydrologic cycle is provided, which you can modify as needed. I'm using the local watershed where the University Park Campus of Penn State is located.
The level of detail and specificity of numerical values for components of the hydrologic cycle is flexible. You can use whatever sources are available (remember to cite them on the last PPT slide of your assignment).
Deliverable
Please submit your paper using the Assignment 3.1 Hydrologic Cycle Microsoft PowerPoint drop box under Lesson 3 in Canvas. (See the Calendar in Canvas for specific due dates.)
Summary and Final Tasks
Summary
You should now have a solid understanding of key hydrologic concepts and terms regarding how freshwater moves through a cycle between atmospheric, terrestrial, and aquatic ecosystems. Finding the data to complete a hydrologic cycle will be challenging, but put some effort into it and let's see what appears. If you do not find the specific data that you seek, at the very least describe where you looked for it and what hurdles you cleared or obstacles you faced. I look forward to reviewing your hydrologic cycles.
Deliverable - Quiz 1
Don't forget to complete Quiz 1. The quiz will cover material from lessons 1, 2, and 3, so you should take the quiz after completing all of the activities for Lesson 3. Registered students can access Quiz 1 under Lesson 3 in Canvas. (See the Calendar in Canvas for specific due dates.)
Reminder - Complete all of the Lesson 3 tasks!
You have reached the end of Lesson 3! Double check the to-do list on the Lesson 3 Overview page [11] to make sure you have completed all of the activities listed there before you begin Lesson 4.
Lesson 4: Defining and Classifying Aquatic Ecosystems
The links below provide an outline of the material for this lesson. Be sure to carefully read through the entire lesson before returning to Canvas to submit your assignments.
Overview
In this lesson, you will learn how to define and classify waters (aquatic ecosystems) in your geographic vicinity using regional, national and/or international classification systems. For Assignment 4.1, each student will choose two aquatic classification systems that they want to explore, which will allow a comparison between them. Using the two selected classification systems, you will locate and classify five aquatic features, then prepare a 3-5 page report. A sample report is available to guide you in the preparation of your report.
Learning Outcomes
By the end of this lesson, you should be able to:
- define and classify aquatic ecosystems in your geographic vicinity using regional, national and/or international classification systems;
- compare two aquatic classification systems;
- locate and classify different aquatic features.
Lesson Roadmap
This lesson is one week in length. Please refer to the Course Calendar in Canvas for specific time frames and due dates. To finish this lesson, you must complete the activities listed below.
| Requirements | Assignment Details | Access/Directions |
|---|---|---|
| To Do | Read the Overview section and work through the material of Lesson 4. | You are on the overview page of the Lesson 4 online content now. Use the links at the bottom of the page or the Lessons menu to proceed to the next page. |
| To Read |
Classification System Resources:
|
This list of resources can be used to help identify the classification system(s) you may want to use to complete the assignment for Lesson 4. — Skim each resource as needed.
Registered students can access the resources under Lesson 4 in Canvas. |
| To Do |
Use a regional, national, and/or international classification system (see resources listed above) to prepare a 3-5 page report in which you define and classify aquatic ecosystems in your geographic vicinity using regional, national, and/or international classification systems. |
Submit your report using the Assignment 4.1 - Classifying Aquatic Ecosystems drop box under Lesson 4 in Canvas. |
Questions?
If you have any questions, please post them to our Questions? discussion forum located under Orientation and Resources in Canvas. While you are there, feel free to post your own responses if you, too, are able to help out a classmate.
Background
In general, the more one augments the number of divisions of the productions of nature, the more one approaches the truth, since in nature only individuals exist, while genera, orders, and classes only exist in our imagination.Comte Georges-Louis Leclerc de Buffon (1707-1788)
French naturalist, author, artist Histoire Naturelle (1749),
trans. by John Lyon, The 'Initial Discourse' to Buffon's
Histoire Naturelle: The First Complete English Translation,
Journal of the History of Biology, 9(1), 1976, 164.
No classification system can capture effectively all of the inherent variability in natural systems, nor can it provide a foolproof determination given the different experiences of users. Most classification systems used internationally or regionally are designed to distinguish among major types aquatic ecosystems with recognizable differences. Some are directed at a specific type, such as wetlands or streams, but many are designed to address all fresh and marine waters for the geographic area of interest. The following classification systems, although focused on wetlands, address a broader set of aquatic ecosystems (Cowardin et al. 1979, Brinson 1993, Warner and Rubec 1997, Ramsar 2009, 2013, Brooks et al. 2011). Whatever the intent and potential use of the classification system, it is critical that users consider the landscape and hydrologic contexts of each type. How large an area is being classified? A river channel and the associated floodplain on both sides of the channel, or just the wetland associated within a property on the upland edge of a floodplain? Context really matters, and should be carefully and succinctly documented.
When seeking to classify a body of water, the most fundamental question the user must ask is, ’How was it formed?” which can be stated as, “What is the origin of this body of water?” If this question is thoughtfully answered and described in a brief narrative, then the actual label assigned to the type matters less, because the user will have considered where and how the water fits in a given landscape and hydrologic setting. Obviously, this is more relevant for regions where aquatic ecosystems do not form the dominant matrix of a landscape (e.g., coastal salt marshes, bottomland hardwood forests). For example, is it a depression that is isolated during drier times of the year, but located in a floodplain setting? Or is it isolated from all riverine influences, receiving only a combination of groundwater and precipitation? Clearly, these types of wetland depressions are distinctively different in many of their attributes and functions, but they could have the same morphometric dimensions.
Many waters have characteristics of multiple types, warranting a dual label (e.g., depression/slope) just as National Wetland Inventory (NWI) mapping for the U.S. recognizes mixed vegetation classes (e.g., forested/scrub-shrub, FO/SS). Thus, it is important to recognize these distinctive elements and document the reasons for labeling the water as a specific type. This is especially important when addressing types that occur along a broad hydrologic gradient and when a group of microhabitats occur in a cluster. Thoughtful selection of classes supported by careful documentation will make any classification system more consistent among users (Brooks et al. 2011).
Lesson 4 Activity
Assignment 4.1
Explore and use National Wetlands Inventory [12] (NWI) (accessed 6-21-14) with the Wetland Mapper feature.
To complete Assignment 4.1, you will choose two aquatic classification systems —that you want to explore— which will allow a comparison between them, and classify five aquatic features (i.e., wetlands, river, lake, estuary, etc.), which occur in an area you designate (e.g., ecoregion, state, county, etc.). It might be best to do this in an area with which you are familiar, or even better, one you can physically visit, so you can view and explore the wet places you are classifying. The Reference Materials page of this lesson lists a number of readings that describe some common classification systems. Alternative classification systems are available for geographic regions outside the U.S. - Please contact instructor.
The intent, then, is to use the NWI’s Wetland Mapper to zoom in on an area of your choosing, locate five aquatic features, and either record their designated type, or preferably, try to classify them yourself. If you use Cowardin et al. (1979), which is featured in the Wetland Mapper, then record the types for your five features, and then reclassify them using an alternative system (e.g, Brinson, Ramsar, etc.). If you live outside the U.S., or wish to classify systems elsewhere, then use Google Earth (or Google Maps [13], clicking on the “Earth” button in the lower left to reveal aerial imagery) to locate an area, zoom in to view and choose five aquatic features, and then classify them based on two of the systems mentioned.
You can compare among more than two systems if you so choose. It is suggested that students from the U.S. choose to compare the Cowardin et al. (1979) system, which is widely used, and the system used for NWI mapping, with the hydrogeomorphic (HGM) system of either Brinson (1993, freshwater types only for the U.S.) or Brooks et al. (2011, fresh and marine types of the Mid-Atlantic region of the U.S.). Other systems recommended include Ramsar 2009 (suitable for worldwide use) or Warner and Rubec (1997) for Canada.
You should read through the listed manual, document, or web instructions for each of the systems you choose to become familiar with the terminology, and how the classification system works. Most are hierarchical. That is, you start with the most general (e.g., system for Cowardin et al. 1979, class for Brinson 1993 or Ramsar 2009/2013), and move down through increasingly detailed subclasses. Note that many of the systems use terms that may seem unusual – riverine upper perennial is used in NWI to indicate a headwater stream and wetland. This is to avoid using local terms that are not universally known by most people. For example, vernal pool (a small pond used for breeding by some species of amphibian) can be called or labeled as a “temporary pond” or “isolated depression”, with a hydrologic modifier such as “ephemeral” or “seasonal” (because many of them dry out during the summer or dry season), and a vegetation designation of “forested” or “emergent” (the latter being grass-like plants that emerge above the surface of the water).
To get started with Wetlands Mapper of the National Wetlands Inventory (NWI):
- click on Wetland Mapper link on the NWI home page [14];
- read through the instruction manual and/or Frequently Asked Questions (FAQs);
- in step #3, click on "Wetland Mapper V2" thumbnail;
- if you are having problems accessing the Wetland Mapper V2 site, try the following URL: https://www.fws.gov/wetlands/data/Mapper.html [15]
- you should see a map of the U.S.
You can choose an area in several ways. You can provide an address, landmark, or latitude-longitude (fill in FIND LOCATION box in upper right), but it is easiest to use the zoom bar on the left, and then click and drag on the map to locate your area of interest. Once you are in the vicinity, you can click on the Available Layers on the right to highlight features of interest. SPOILER ALERT: The default layer is wetlands, so when you zoom in, you will see the type label. If you would rather try to classify the visible types yourself, click off the wetlands layer first, then click it on later to check your results.
If you want some assistance initially, I recommend just using the default wetlands option, but riparian areas can also be selected (this is a relatively new addition to the system, and will not appear in the original Cowardin et al. (1979) reference). If you do click on the wetlands option, and zoom in close enough, you will see the type designation chosen by the aerial photo-interpreter. They have essentially already done your work for you. There is, however, more to learn about the code and characteristics behind it. Click on any of the code, and it will provide additional data and an explanation (see Figure 4.1 below).
Remember, you still need to classify the five features you chose using another system. Once you choose your area of interest, you should take a screen shot and convert it to a JPEG file that you can label with the types for the two systems (see Fig. 2 in SAMPLE). You should also make a comparison table in your assignment report (see SAMPLE ASSIGNMENT – 4.1 Brooks, R. - Classifying Aquatic Ecosystems). The report should be 3-5 pages, with graphics.
| Description | Full points | Partial points | No points | Points total |
|---|---|---|---|---|
| Classification system | 2 aquatic classification systems are discussed. | Only 1 aquatic classification system is discussed. | No aquatic classification systems are discussed. | 5 |
| Aquatic features | All features are appropriately classified. | 2-3 features are misclassified. | 3+ features are misclassified. | 5 |
| Content | Detailed comparison of the two classification systems that demonstrates an understanding of their similarities and differences. | An overview of each classification system is provided. However, details on similarities and differences are either vague or missing. | No comparison or discussion about the two classification systems. | 10 |
| College-level writing | No grammar or spelling mistakes. Content is organized well. | 2-3 grammar or spelling mistakes. Flow and organization of content could be improved. | 3+ grammar or spelling mistakes. Content does not flow and is unorganized. | 5 |
| Citations | Included a complete works cited page. All information is in the student’s own words and appropriately cited. | Works cited page is incomplete. Some information is not written in the student’s own words. | Works cited page is incomplete or missing. Most information is not written in the student’s own words. | 5 |
Deliverable
Please submit your 3-5 page report using the Assignment 4.1 - National Wetland Inventory drop box under Lesson 4 in Canvas. (See the Calendar in Canvas for specific due dates.)
Reference Materials
Background Materials and References:
You should consider using any or all of the following materials when working on the assignment for Lesson 4. (Registered students can access all of the following reference materials under Lesson 4 in Canvas.)
Brinson, M.M. 1993. A hydrogeomorphic classification for wetlands. WRP-DE-4. Vicksburg, MS: U.S. Army Engineer Waterways Experiment Station. 79pp+app
Brinson, M.M. 1996. The HGM approach explained. National Wetlands Newsletter November/December 17(6):7-13.
Brooks, RP, MM Brinson, KJ Havens, CS Hershner, RD Rheinhardt, DH Wardrop, DF Whigham, AD Jacobs, and JM Rubbo. 2011. Proposed hydrogeomorphic classification for wetlands of the Mid-Atlantic Region, USA. Wetlands 31(2):207-219.
Brooks, RP, MM Brinson, DH Wardrop, and JA Bishop. 2013. Hydrogeomorphic (HGM) classification, inventory, and reference wetlands. Pages 39-59, Chapter 2 in RP Brooks and DH Wardrop (eds.) Mid-Atlantic Freshwater Wetlands: Advances in science, management, policy, and practice. Springer Science+Business Media, 491+xiv pp.
Cowardin, LM, V Carter, FC Golet, and ET LaRoe. 1979. Classification of wetlands and deepwater habitats of the United States. U.S. Fish and Wildlife Service FW/OBS-79/31, Washington, DC.
Dahl, T.E. 2011. Status and trends of wetlands in the conterminous United States 2004 to 2009. U.S. Department of the Interior; Fish and Wildlife Service, Washington, D.C. 108 pp.
Ramsar Convention Secretariat. 2009. Strategic Framework and guidelines for the future development of the List of Wetlands of International Importance of the Convention on Wetlands (Ramsar, Iran, 1971). [Note: The classification for Ramsar wetlands begins on page 64 of the documented cited.]
or
Ramsar Convention Secretariat, 2013. The Ramsar Convention Manual: a guide to the Convention on Wetlands (Ramsar, Iran, 1971), 6th ed. Ramsar Convention Secretariat, Gland, Switzerland. [Note: The classification for Ramsar wetlands begins on page 55 of the documented cited.]
Warner, BG, and CDA Rubec (eds.). 1997. The Canadian wetland classification system. 2nd ed. Wetlands Research Centre. University of Waterloo, Waterloo, Canada.
Summary and Final Tasks
Summary
By locating and classifying 5 waterbodies, hopefully in a geographic area familiar to you, you will have gained some familiarity with the art and science of classifying hydrological and ecological features. As in many inventory and assessment methods, there are elements of human intuition involved, regardless of how precisely the classification criteria are presented. With some practice, however, multiple users of a system can converge on identifying types, and thus provide consistency. Through this exercise, you have gained some experience using the major classification schemes for aquatic ecosystems in the U.S., and/or around the world.
Reminder - Complete all of the Lesson 4 tasks!
You have reached the end of Lesson 4! Double check the to-do list on the Lesson 4 Overview page [16] to make sure you have completed all of the activities listed there before you begin Lesson 5.
Lesson 5: Climate Types
The links below provide an outline of the material for this lesson. Be sure to carefully read through the entire lesson before returning to Canvas to submit your assignments.
Overview
Understanding where climate types are located is critically important for understanding the distribution patterns of freshwater on Earth. First, read through Lesson 5 and explore the listed web links, which will further your understanding of five drivers of climate. Then, review the accompanying Lecture 5.1 - Climate Types.
The Microsoft PowerPoint presentation provides a summary of the characteristics of the six major climate types, as defined by the Köppen system, with photographs to illustrate most types. From this PPT, you should learn generally where the major climate types occur, and what factors influence their locations. Refer to the Köppen map to help visualize their latitudinal positions relative to the equator. You need to grasp the general location and influence of global atmospheric and oceanic currents which, when combined with the five drivers, determine where to find these major climate types. Figures 1 and 2, and Table 1 provide supplementary information that will help you visualize how climate types are formed and where they occur.
Note:
The course text, Holden 2020, does not cover this topic, so use the following text and the listed websites to learn about the Köppen Climate System.
Learning Outcomes
By the end of this lesson, you should be able to:
- explain the importance of latitude, temperature, precipitation, topography, and soil as drivers of hydrology based on Köppen climate types on Earth.
- explain the effects of atmospheric oceanic circulation and currents, and continental features on worldwide distribution of freshwater, driven in part by Hadley Cells and the Inter-Tropical Convergence Zone.
Lesson Roadmap
This lesson is one week in length. Please refer to the Course Calendar in Canvas for specific time frames and due dates. To finish this lesson, you must complete the activities listed below.
| Requirements | Assignment Details | Access/Directions |
|---|---|---|
| To Do | Read the Overview section and work through the material of Lesson 5. | You are on the overview page of the Lesson 5 online content now. Use the links at the bottom of the page or the Lessons menu to proceed to the next page. |
| To Watch |
Watch/Read through the Lesson 5 – Climate Types PowerPoint file. |
Registered students can access the PPT files under Lesson 5 in Canvas. |
| To Read | As noted above, the course text does not cover this topic, so use the lesson text and the listed websites to learn about the Köppen Climate System. |
The lesson text contains links to websites you can use to learn about the Köppen Climate System. |
| To Do |
Discussion #2 - Water Science Communication |
Submit your post and replies under Discussion #2 in Canvas |
Questions?
If you have any questions, please post them to our Questions? discussion forum located under Orientation and Resources in Canvas. While you are there, feel free to post your own responses if you, too, are able to help out a classmate.
Credits
GEOG 431 Lesson 5 – Climate Systems - Authored by Jenna Thomas and Robert P. Brooks, Ph.D., Department of Geography, The Pennsylvania State University, 2014. Material adapted *Elemental Geosystems* by Robert Christopherson, and information gleaned from the websites listed.
Background
Climate is what you expect, weather is what you get.
Mark Twain
(Samuel Clemens, 1835-1910)
American author and humorist

Climate controls the biomes of our world. It explains why we have luscious, green tropical rainforests in some regions and arid, barren deserts in others. Climate is the variability and variation in weather for a particular region over time. This includes regular weather conditions as well as extremes. Temperature and precipitation are two of the main factors influencing climate, but latitude, topography, and soil also affect climate. Climate helps to explain the distribution of plants, animals, and soils around the world, and is obviously critically important for understanding the distribution patterns of freshwater on Earth.
The Köppen Climate Classification System divides the world into five major climate types based on average monthly temperatures, average monthly precipitation, and total annual precipitation. It is the most widely used system for climate classification. The five major types of climates are designated by the capital letters, A, B, C, D, E, or H. A - represents humid tropical climates, B - represents dry climates, C - represents mild mid-latitude climates, D - represents severe mid-latitude climates, E - represents polar climates, and H – represents highlands or mountainous areas, where climate can vary due to elevation or slope aspect differences. These categories are then subdivided based on temperature and precipitation, and borders between regions represent transition zones between climate types (see Table 1 at the end of the lesson for detailed subtypes).
The German climatologist and amateur botanist Wladimir Köppen(1846-1940) introduced this system in 1928, which was co-authored with his student Rudolph Geiger. Köppen continued to update their system until his death. It remains the primary climate classification system in use in the world today. Kottek et al. (2006) provides a recent update (Figure 5.1).
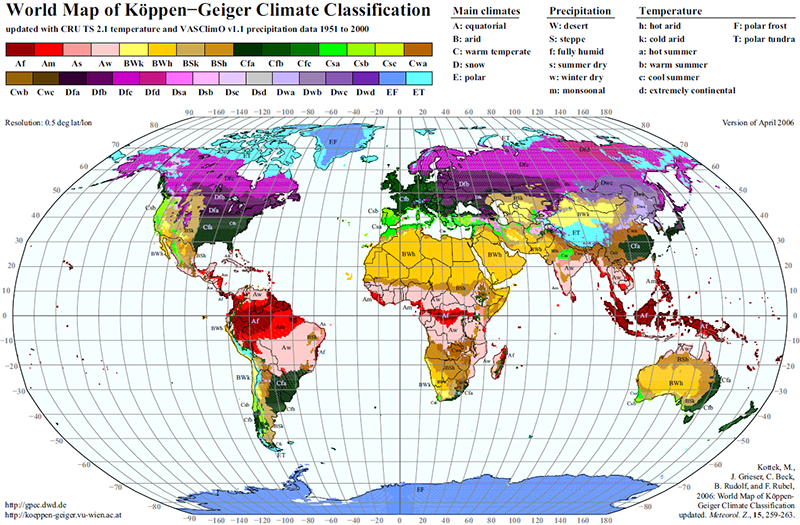 [17]
[17]
World Map of the Köppen-Geiger climate classification updated.
Meteorol. Z., 15:259-263. DOI: 10.1127/0941-2948/2006/0130.)
To further understand how the Köppen climate types are formed, it is important to become familiar with global atmospheric and oceanic currents. Global winds drive the surface ocean currents, which also are influenced by the Coriolis Force caused by Earth’s rotation. The Inter-Tropical Convergence Zone (ITCZ) is a part of the global circulation system that generates large amounts of precipitation. It is a low- pressure zone near the equator that is caused by the convergence of trade winds. This convergence results in a stagnation of winds, even though the actual location of the ITCZ varies from year to year. This shifting in location helps to create the wet and dry seasons of the tropics. It is sometimes known as the thermal equator. The systems that create these trade winds are known as Hadley Cells. These cells are formed when warm air rises near the equator and moves towards the poles. This warm air is a result of the sun’s uneven insolation, so the tropical regions absorb more heat than they reflect, compared to the surrounding regions (Figure 5.2).
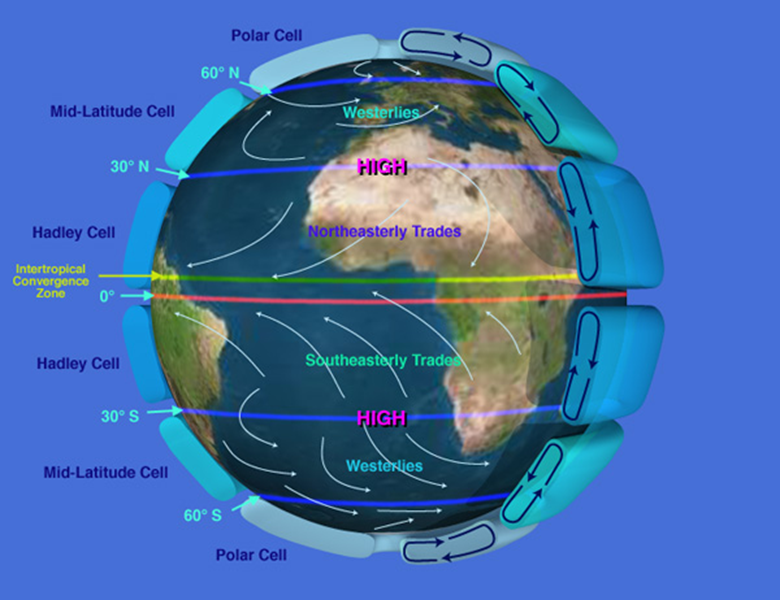
In Figure 5.2, the Earth is rotating left to right, or eastward, in this figure, creating the Coriolis Force, which drives, in part, the “spin” of these currents. This can be seen by the directional movement of the trade winds in both the northern (clockwise, right) and southern (counterclockwise, left) hemispheres. The ITCZ varies in its position around the equator by season and as a consequence of atmospheric and oceanic currents. The Hadley Cells form as hot, moist air rises in the vicinity of the equator. Other cells, somewhat weaker, set up similar patterns toward the poles. More information can be found on the web links on the following Resource Material page.
Resource Material
As mentioned on the Lesson 5 overview page, the course text, Holden 2014, does not cover the Köppen Climate System topic, so use the following material and the listed websites to learn about the Köppen Climate System.
Köppen Climate System
- PhysicalGeography.net - Climate Classification and Climatic Regions of the World [19]
- Köppen Climate Classification System | National Geographic Society [20]
or
Registered students can access the KoppenClimateClassification(elmhurst).pdf file under Lesson 5 in Canvas.
Hadley cells and the Inter-tropical Convergence Zone (ITCZ)
Weather / Climate
Weather is the condition of the atmosphere at any given place and time, and the variability of this weather over time is climate. Climates greatly influence ecosystems, and these ecosystems are grouped together to form biomes. Each biome has associated plant, soil, and animal communities. The various climate components include insolation, temperature, air pressure, air masses, and precipitation. Temperature is mainly controlled by latitude, altitude/elevation, and cloud cover.
Climatology is the study of climates and it analyzes weather patterns over time and space. There are six basic climate categories:
- Tropical = equatorial and tropical latitudes
- Desert = permanent moisture deficits
- Mesothermal = midlatitudes and mild winter
- Microthermal = mid- and high latitude, cold winter
- Polar = high latitudes and polar regions
- Highland = lower temperatures compared to lowlands at same latitude
Köppen
The Köppen system uses capital letters (A,B,C,D,E,H) to designate climatic categories from the equator to the poles. Categories A, C-H are based off of thermal characteristics, and B is based off of moisture as well. Within each climate classification lowercase letters signify temperature and moisture conditions. See table 5.1 below.
- A = Tropical
- B = Desert (arid, dry)
- C = Mesothermal
- D = Microthermal
- E = Polar
- H = Highland
The link below shows the different Köppen climate types around the globe. You can select a region of interest to learn more about the climate type that you chose.
- NASA interactive map [22]
Required Viewing
An illustrated Microsoft PowerPoint presentation (GEOG 431 Lesson 5 PPT) is provided to introduce you to the places and appearance of the major climate regions (Brooks 2014).
Registered students can access the GEOG 431 Lesson 5 PPT file in Canvas.
Köppen uses average monthly temperatures, average monthly precipitation, and total annual precipitation to devise its spatial categories and boundaries. These boundaries serve as transition zones of gradual change between two climate systems. Drawbacks of the modified Köppen system include that it does not consider wind, temperature extremes, precipitation intensity, quantity of sunshine, cloud cover, or net radiation.
Climographs
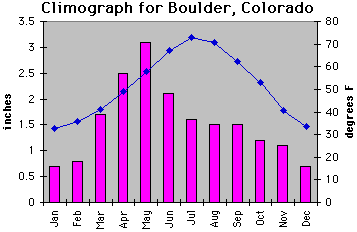
A climograph shows the monthly temperatures and precipitation over a typical year, subdivided into months. Also, it can provide location coordinates, average annual temperature, total annual precipitation, elevation, the local population, annual temperature range, annual hours of sunshine, and a location map. For examples of temperature and precipitation graphs for the various climate categories, visit the site below. The temperature and precipitation graphs can be found below the description of the five major climatic types. Use these graphs, or similar ones, for addressing Assignment 5.1.c.
The differential heating patterns
The differential heating patterns on Earth’s surface cause winds, which circulate heat and moisture. These winds do not blow exactly in a north-south direction; instead they appear to be deflected toward the east or west by the Coriolis Force. This effect results in the tendency of moving objects to veer to the right in the Northern Hemisphere and to the left in the Southern Hemisphere. The winds approaching the equator from the Horse Latitudes appear to be deflected west and are called northeast or southeast trade winds.
These surface winds also impact and influence the major ocean currents. Ocean currents move in great circular gyres—clockwise in the Northern Hemisphere and counterclockwise in the Southern Hemisphere. Warm currents flow from the tropics along eastern continental margins; as they reach high latitudes, they are cooled, producing cold currents that flow down the western margins. Warmer currents can absorb increasing amounts of evaporated water. By later cooling and condensing this water clouds are formed. The following links below provide good visual illustration of different wind circulation patterns.
Example of one of many global oscillation patterns that influence weather and climate
Climate studies show that precipitation fluctuates on a five to seven-year cycle. Fluctuations appear to be triggered by an event in the vast tropical Pacific Ocean—El Niño Southern Oscillation, or ENSO. As the westerly winds pass over warm water, they pick up moisture and transport it to the adjacent continents, causing heavy precipitation in the winter when the land is colder than the offshore waters. This phenomenon is known as El Niño. ENSO events are also characterized by reduced coastal upwelling, which results in dramatic reductions in nutrients and ultimately affects the entire food chain of oceanic communities. The link below provides additional details on El Niño as well as graphs illustrating the changes in sea surface temperature.
| Type | Type Name |
Sub Type | Sub Type Name |
Characteristics |
|---|---|---|---|---|
| A | Tropical Humid | Af | Tropical wet | No dry season |
| — | — | Am | Tropical monsoonal | Short dry season; heavy monsoonal rains in other months |
| — | — | Aw | Tropical savanna | Winter dry season |
| B | Dry | BWh | Subtropical desert | Low-latitude desert |
| — | — | BSh | Subtropical steppe | Low-latitude dry |
| — | — | BWk | Mid-latitude desert | Mid-latitude desert |
| — | — | BSk | Mid-latitude steppe | Mid-latitude dry |
| C | Mild Mid-Latitude | Csa | Mediterranean | Mild with dry, hot summer |
| — | — | Csb | Mediterranean | Mild with dry, warm summer |
| — | — | Cfa | Humid subtropical | Mild with no dry season, hot summer |
| — | — | Cwa | Humid subtropical | Mild with dry winter, hot summer |
| — | — | Cfb | Marine west coast | Mild with no dry season, warm summer |
| — | — | Cfc | Marine west coast | Mild with no dry season, cool summer |
| D | Severe Mid-Latitude | Dfa | Humid continental | Humid with severe winter, no dry season, hot summer |
| — | — | Dfb | Humid continental | Humid with severe winter, no dry season, warm summer |
| — | — | Dwa | Humid continental | Humid with severe, dry winter, hot summer |
| — | — | Dwb | Humid continental | Humid with severe, dry winter, warm summer |
| — | — | Dfc | Subarctic | Severe winter, no dry season, cool summer |
| — | — | Dfd | Subarctic | Severe, very cold winter, no dry season, cool summer |
| — | — | Dwc | Subarctic | Severe, dry winter, cool summer |
| — | — | Dwd | Subarctic | Severe, very cold and dry winter, cool summer |
| E | Polar | ET | Tundra | Polar tundra, no true summer |
| — | — | EF | Ice Cap | Perennial ice |
| H | Highland | — | — | — |
Lesson 5 Activity
Deliverable
No assignments for lesson 5, focus on writing your discussion post.
Summary and Final Tasks
Summary
The purpose of Lesson 5 was to introduce you to climate types throughout the world, which are closely tied to moisture levels, and hence, freshwater resources. Working your way through this lesson, do you think you gained a new appreciation for the diversity of climate types and how places and people are influenced by those physiographic characteristics? I hope so, because having an appreciation for the availability of water resources in a specific geographic area can provide insight into business opportunities, environmental challenges, and ecosystem characteristics.
Reminder - Complete all of the Lesson 5 tasks!
You have reached the end of Lesson 5! Double check the to-do list on the Lesson 5 Overview [28] page to make sure you have completed all of the activities listed there before you begin Lesson 6.
Lesson 6: Aquatic Ecosystems: Characteristics, Functions, and Ecosystem Services
The links below provide an outline of the material for this lesson. Be sure to carefully read through the entire lesson before returning to Canvas to submit your assignments.
Overview
In Lesson 6, you will just begin to appreciate the valuable and valued biodiversity dependent upon freshwater aquatic ecosystems. Assignment 6.2 will lead you through the myriad of ecosystem services provided to us – mostly free of charge – by healthy aquatic habitats.
Learning Outcomes
By the end of this lesson, you should be able to:
- describe basic ecological principles pertaining to all ecosystems, with a focus on aquatic ecosystems;
- explain the diversity of freshwater-dependent animals;
- explain the methodological approach of the Millennium Ecosystem Assessment team;
- apply the methodological approach to a specific ecosystem.
Lesson Roadmap
This lesson is one week in length. Please refer to the Course Calendar in Canvas for specific time frames and due dates. To finish this lesson, you must complete the activities listed below.
| Requirements | Assignment Details | Access/Directions |
|---|---|---|
| To Read |
Required
Optional
|
|
| To Do |
|
|
Questions?
If you have any questions, please post them to our Questions? discussion forum located under Orientation and Resources in Canvas. While you are there, feel free to post your own responses if you, too, are able to help out a classmate.
Background
… the status of living systems provides the most direct and most effective measure of the "integrity of water," the resource on which all life depends."
James R. Karr and Ellen W. Chu, 1997
Biological Monitoring…
Aquatic ecosystems are some of the most amazing habitats on Earth. Their species and communities are staggeringly diverse. Lesson 6 is but a brief introduction into the complexities of biological communities that are dependent upon freshwater. Trained as a biologist, I have observed, investigated, and experienced aquatic ecosystems all of my life, and still I know there is so much more to learn. For this lesson, my advice is to sample the fascinating species and vital services provided by these systems, and maybe it will provide a springboard of interest into their natural history and their never-ending diversity. I hope you enjoy this part of the journey.
Readings
Chapter 6 of the text provides a simple, but reasonably complete overview of the characteristics of aquatic ecosystems, how they function, and their relationship to ecosystem services.
Required Reading
Holden (2020) – Brown et al., Chapter 6 – Aquatic ecosystems (p.195-232)
The Millennium Ecosystem Assessment of 2005 was a seminal synopsis of the values and services of waters from which we all benefit. Although this set of assessments was begun before the turn of the millennium, this part took five more years to complete. Still, it forms the basis of how many free services are provided to us from healthy aquatic ecosystems.
Required Reading
Millennium Ecosystem Assessment (2005). Ecosystems and human well-being: Wetlands and water. Synthesis. World Resources Institute, Washington, DC. 80pp.
Registered students can access a copy of this reading under Lesson 6 in Canvas.
The following reference describes a novel and thorough approach to considering and measuring the economic value of wetlands, broadly defined, and other waters. It provides the next steps in thinking about valuing ecosystem services. You can use it as one of the required references for Assignment 6.2. I heartily recommend you review the document, but it will not be included as part of any evaluation for this course.
Optional Reading
Russi D., ten Brink P., Farmer A., Badura T., Coates D., Förster J., Kumar R. and Davidson N. (2013). The Economics of Ecosystems and Biodiversity for Water and Wetlands. IEEP, London and Brussels; Ramsar Secretariat, Gland.
Registered students can access a copy of the reading under Lesson 6 in Canvas.
Lesson Activity 6.1
To go beyond just a list of ecosystem services, Assignment 6.1 asks you to delve deeper into the service of your choice and briefly describe the function (what ecosystems do) or service (a function with direct benefit to humans) and potential threats to that function or service from anthropogenic stressors (e.g., excess nutrients, habitat fragmentation, etc.). You'll need to locate and incorporate information from two references (properly cited) beyond the Millennium report - I suggest using Google Scholar with keywords, or another scientific or technical search engine. Good luck!
Assignment 6.1
Choose a specific ecosystem service from the Millennium Ecosystem Assessment Report for Water and Wetlands (2005), and define and describe this ecosystem service or function, and discuss any potential threats to it. Make sure your report explains how the ecosystem service or function is threatened through a threat to the aquatic ecosystem or to its ability to perform the function or service. Cite at least two primary references (i.e., journal articles or technical reports) beyond the Millennium Report to support your work in a no more than single spaced 2-page report. Here is a summary of the services covered by the report. (Registered students can access a copy of the Millennium Ecosystem Assessment (2005) report under Lesson 6 in Canvas.)
Simplified list of ecosystem services from the Millennium Report (2005):
Provisioning
- Food/shelter - plants (rice culture, crops, marsh Arabs, thatching, ornamentals)
- Food – fauna (hunting, trapping, fishing (finfish & shellfish), birding)
- Fiber & fuel - wood products, fuel wood, peat mining, forage & fodder
- Medicines and pharmaceuticals - derivatives from natural products
Regulating
- Natural hazard - flood storage and desynchronization (inland, freshwater systems)
- Natural hazard - storm protection (coastal systems)
- Erosion regulation - retention of soil and sediments
- Water purification - retention, removal and transformation of nutrients (N & P)
- Water supply & flow regulation - surface flows, groundwater (discharge & recharge)
- Waste treatment - design and operation of constructed wetlands for waste removal
- Climate regulation - source & sink for greenhouse gases, influencing local weather
Supporting
- Biodiversity - biogeography & plant communities (endangered, threatened, rare species)
- Biodiversity - fish & aquatic macroinvertebrates (insects, crustaceans, mollusks, etc.)
- Biodiversity - water birds (waterfowl, shorebirds, songbirds, raptors; migration)
- Biodiversity - other vertebrates (aquatic and semi-aquatic mammals, amphibians, reptiles)
Cultural
- Economic - approaches for estimating value for wetland ecosystems
- Educational - opportunities and approaches used for all ages
- Aesthetic & artistic - art, music, literature, scenic, etc.
- Spiritual and inspirational - cultural and religious values & differences for wetlands
| Description | Full points | Partial points | No points | Points total |
|---|---|---|---|---|
| Ecosystem service selection | Appropriate ecosystem service selected from Millennium Report. | An appropriate ecosystem service is selected, but it is a service not included in the Millennium Report. | No ecosystem service is discussed. | 5 |
| Content | Great definition and description of the ecosystem function or service. Potential threats to it are discussed. Narrative is detailed and demonstrates that the content was well researched. | Definition and description of the ecosystem service provided. Potential threats are discussed. However, details are vague and narrative could be expanded to include more content. | Narrative is missing either definition/description of the ecosystem service or discussion of potential threats. Content is brief and lacks detail. | 15 |
| College-level writing | No grammar or spelling mistakes. Content is organized well. | 2-3 grammar or spelling mistakes. Flow and organization of content could be improved. | 3+ grammar or spelling mistakes. Content does not flow and is unorganized. | 5 |
| Citations | Included a complete works cited page. All information is in the student’s own words and appropriately cited. | Works cited page is incomplete. Some information is not written in the student’s own words. | Works cited page is incomplete or missing. Most information is not written in the student’s own words. | 5 |
Deliverable
Please submit your no more than 2 page paper using the Assignment 6.1 - Ecosystem Description drop box under Lesson 6 in Canvas. (See the Calendar in Canvas for specific due dates.)
Summary and Final Tasks
Summary
Lesson 6 was designed to introduce you to the primary beneficiaries, besides us, of healthy aquatic ecosystems - that is, diverse animal and plant communities that are dependent upon water. Obviously, there is much more to learn about the biological diversity of these systems, such as how to identify and recognize species, their role in the functioning of these ecosystems, and how they can be used in monitoring programs to assess the health or condition of aquatic habitats. As stated by Karr and Chu (1997) at the beginning of this lesson, “… the status of living systems provides the most direct and most effective measure of the "integrity of water," the resource on which all life depends.”
Deliverable - Quiz 2
Don't forget to complete Quiz 2 by 11:59 pm EST on Sunday, July 3rd. The quiz will cover material from lessons 4, 5, and 6 so you should take the quiz after completing all of the activities for Lesson 6. Registered students can access Quiz 2 under Lesson 6 in Canvas. (See the Calendar in Canvas for specific due dates.)
Reminder - Complete all of the Lesson 6 tasks!
You have reached the end of Lesson 6! Double check the to-do list on the Lesson 6 Overview [29]page to make sure you have completed all of the activities listed there before you begin Lesson 7.
Lesson 7: Patterns of Freshwater use. Part 1 – Water Supply: Drinking, Irrigation, Industrial
The links below provide an outline of the material for this lesson. Be sure to carefully read through the entire lesson before returning to Canvas to submit your assignments.
Overview
Lessons 7 and 8 cover numerous topics concerning infrastructure for water – drinking water, dams, irrigation, wastewater, and general water demand by human activities. The materials in Microsoft PowerPoint lectures and readings from the text are somewhat blended and overlapping.
In Lesson 7, you will learn about patterns of freshwater use for drinking, dams, irrigation, and industrial enterprises by reviewing the lesson background material below, two Microsoft PowerPoint lectures (7.1 and 7.2), and reading Chapters 8 and 9 of the text. There is a substantial amount of material to cover, so my recommendations for Lesson 7 are somewhat different than for other lessons – focus on the background material below first, then the lectures. Follow that up by getting more background from the text chapters. Use the Microsoft PowerPoint lectures to guide you in studying what terms and concepts to master for the quizzes.
Learning Outcomes
By the end of this lesson, you should be able to:
- describe modern water management systems;
- contrast solutions to water issues from places across the U.S.
Lesson Roadmap
This lesson is one week in length. Please refer to the Course Calendar in Canvas for specific time frames and due dates. To finish this lesson, you must complete the activities listed below.
| Requirements | Assignment Details | Access/Directions |
|---|---|---|
| To Watch |
Watch/Read through the following PowerPoint files.
|
Registered students can access the Microsoft PowerPoint files under Lesson 7 in Canvas. |
| To Read |
|
The readings come directly from the course textbook (Holden 2020). |
| To Do |
|
|
Questions?
If you have any questions, please post them to our Questions? discussion forum located under Orientation and Resources in Canvas. While you are there, feel free to post your own responses if you, too, are able to help out a classmate.
Background
There is still enough water for all of us – but only so long as we keep it clean, use it more wisely, and share it fairly.
Ban Ki-moon, former UN Secretary General
(United Nations 2012, as quoted in Holden 2014)

The majority of the world’s population are facing water quantity and quality issues. Over 70% of our blue planet’s surface is covered with water, yet a scarce 3% is fresh, and much less than 1% is available for human use as surface water or groundwater. More than 780 million people lack access to an improved water source (about one in nine people) (water.org [30]). The water infrastructure of the U.S. is fast becoming obsolete, endangering our access to clean water and good health (e.g., Liquid Assets [31], WPSU 2006). The “free” ecosystem services provided by Earth’s waters that benefit human populations are being degraded. Thus, equitable access to water supplies, water security, and conservation of aquatic ecosystems are recognized as significant global issues (Roundtable and Council 2004, Vorosmarty et al. 2010, World Water Council 2012). The situation has become more urgent regionally and continentally.
As was stated from the outset, “Demand for water is not evenly distributed in space and time.” In Lesson 5 on the Köppen Climate System, we learned about the natural distribution of water in space and time. When the demands of human consumption are imposed on these natural systems, shortages and scarcity become even more acute. One can examine relevant data in a variety of ways – by activity, by nation, per capita. For example, the greatest demand for water is from agriculture, primarily irrigation, where water is needed throughout the growing of and processing of food. Geographic areas with abundant water may use water inefficiently, because they can, whereas those in arid regions must conserve to exist. Table 1.2 (p.14) of the text (Holden 2020) compares water-rich and water-poor countries. Figure 9.5 (p. 335), again from the text (Holden 2020), illustrates levels of water scarcity and stress worldwide, with North Africa and the Middle East among those under the most dire of circumstances.
Readings
Chapter 8 of the textbook provides a brief summary of both the treatment of potable water and treatment of wastewater. The emphasis is on the technology used to purify water for drinking and treating "used" or contaminated water before it is discharged back into the environment.
Chapter 9 of the textbook offers a concise discussion of water demands worldwide. Be sure to examine the global scarcity issues by region/nation in the figures.
Required Reading
Holden (2020) – Horan, Chapter 8 – Potable water and wastewater treatment (p.290-319)
This reading is from the required course text.
Holden (2020) – McDonald and Mitchell, Chapter 9 – Water demand planning and management (p.323-348)
This reading is from the required course text.
Extra Video Material
If you are curious, view a few stories about water from the Water Blues, Green Solutions website [32] and watch The Water Blues Green Solutions introduction video [33]. “Water Blues” was a 2014 film production by Penn State Media's WPSU, with an accompanying website of video clips and audio interviews that are constantly being expanded.
Lesson 7 Activity
Assignment 7.1
Write a peer review critique of a scientific, engineering, or technical journal article concerning water resources (e.g., river restoration, life cycle of aquatic organism, international water policy review) or a hydrologically-related issue (e.g., proposed dam, summary of historic flow records). You can draw upon topics that were relevant to Lessons 2, 3, 6, or 7. You can choose the topic, the source, and the specific journal article. Your critique can be in outline form, about 2 pages in length; include a full citation of the article you review. Remember, a critique need not be negative. You can be complimentary if the article is well-written. Conversely, you can be constructive if improvements would make it a better product.
Note: A journal article is a publication about scientific research in a specialized journal. This excludes news articles, books, policy briefs, and magazine articles. Also, although often publisehd in scientific journals, book reviews are not journal articles and should not be the focus of this assignment.
The following reference is a good source for guidance about writing a critique. (Registered students can access the Guidance for Writing a Critique resource under Lesson 7 in Canvas.)
- Peer Review Guidance
From the science publisher Springer (with some extra notes), two pages, easy to follow suggestions.
| Description | Full points | Partial points | No points | Points total |
|---|---|---|---|---|
| Selection | Appropriate journal article selected. | Did not select an appropriate journal article. | 5 | |
| Content | Critique addressed WHY the research question is well defined, the data is sound, the methods are appropriate, etc. Demonstrated an understanding of the journal article. | Critique only states if the research question is well defined, the data is sound, the methods are appropriate, etc. No explanation of WHY. Demonstrated an understanding of the journal article. | Critique is brief and lacks detail. Only states if the research question is well defined, the data is sound, the methods are appropriate, etc. Lack of understanding about the journal article. | 15 |
| College-level writing | No grammar or spelling mistakes. Content is organized well. | 2-3 grammar or spelling mistakes. Flow and organization of content could be improved. | 3+ grammar or spelling mistakes. Content does not flow and is unorganized. | 5 |
| Citations | Included in-text citations and a complete works cited page . All information is in the student’s own words and appropriately cited. | Missing 2-3 in-text citations or works cited page is incomplete. Some information is not written in the student’s own words. | Missing 3+ in-text citations or works cited pag e is incomplete or missing. Most information is not written in the student’s own words. | 5 |
Deliverable
Please submit your 1 page paper using the Assignment 7.1 - Journal Article Critique drop box under Lesson 7 in Canvas.
(See the Calendar in Canvas for specific due dates.)
Summary and Final Tasks
Summary
With Lesson 7, we entered the second half of the course. The focus of the remainder of the course is how humans around the world use freshwater resources. This lesson is the first of two that summarize the dominant use of water by society.
Reminder - Complete all of the Lesson 7 tasks!
You have reached the end of Lesson 7! Double check CANVAS for further information on the Lesson 7 assignment before you begin Lesson 8.
Lesson 8: Patterns of Water Use. Part 2 – Wastewater, Energy, Transportation
The links below provide an outline of the material for this lesson. Be sure to carefully read through the entire lesson before returning to Canvas to submit your assignments.
Overview
In Lesson 8, there is one primary Learning Objectives and one Assignment (8.1) beyond the required readings. You will continue to review aspects of water infrastructure, with a focus on wastewater treatment. With the second Learning Objective, you will choose a scientific or technical paper or report and conduct a peer-review critique. As mentioned in Lesson 7, Quiz 3 will evaluate your understanding of the water infrastructure systems covered, as well as the use and demand of water by sometimes competing human needs.
Learning Outcomes
By the end of this lesson, you should be able to:
- explain a range of wastewater treatment approaches and technologies;
- describe the distribution and basic impact of selected pollutants;
- critique a scientific or technical paper concerning water resources.
Lesson Roadmap
This lesson is one week in length. Please refer to the Course Calendar in Canvas for specific time frames and due dates. To finish this lesson, you must complete the activities listed below.
| Requirements | Assignment Details | Access/Directions |
|---|---|---|
| To Watch |
Watch/Read through the Lecture 8.1 - Wastewater PowerPoint File. |
Registered students can access the Microsoft PowerPoint files under Lesson 8 in Canvas. |
| To Read |
|
|
| To Do |
|
|
Questions?
If you have any questions, please post them to our Questions? discussion forum located under Orientation and Resources in Canvas. While you are there, feel free to post your own responses if you, too, are able to help out a classmate.
Background
Can we afford clean water? Can we afford rivers and lakes and streams and oceans, which continue to make life possible on this planet? Can we afford life itself? … These questions answer themselves.
Senator Edmund Muskie (1972)
as quoted by James R. Karr and Ellen W. Chu
The three seemingly unrelated topics addressed in Lesson 8 do have some connections. The one that comes to mind is the historic perspective. Humans have always used natural waters to help dispose of their wastes. The phrase – the solution to pollution is dilution – comes to mind. We’ve used energy, initially fire, to cook food and sterilize water to make it potable. And, bodies of water have always provided us ways to transport people and things from place to place, or from source to market. But setting history aside momentarily, let’s consider current and future aspects of the three topics. The informational materials provided focus on competing demands and searching for efficiencies as we consider the future of freshwater demands and uses.
Wastewater Treatment
In Lesson 7, you learned about treating water sufficiently to make it potable. In Lesson 8, another set of treatment options for wastewater are available to decontaminate water once it has been used. Again, numerous options are available, some standard, some specialized, depending on the type and degree of contamination. You should be able to recognize and describe briefly the more common methods for treating wastewater. The readings from the text and the Lecture 8 - Wastewater Lecture (PPTX) will cover those processes. Additioanlly, you will understand key methods for water demand and water management.
Required Reading
Holden (2020) –Horan, Chapter 8 – Potable water and wastewater treatment (p.290-322)
Holden (2020) – McDonald & Mitchell, Chapter 9 - Water Demand planning and Management (p.323-350)
Required Viewing
GEOG 431 Lesson 8 – Wastewater Lecture (PPT)(Registered students can access a copy of the Microsoft PowerPoint file under Lesson 8 in Canvas.)
Water-Energy Nexus
There are sources beyond the text to provide you with current perspectives on how the production of energy is intensely dependent upon water – primarily freshwater withdrawals. I have listed two of those sources on this page. The objective here is not to become energy experts, but to become aware of the often conflicting demands we place on limited supplies of freshwater. First, quickly review the Microsoft PowerPoint (converted to a PDF file) prepared by Diana Glassman (2011) as a summary of her report for the World Policy Institute on the water-energy nexus. It provides good visuals on the demands that energy production places on water resources. Next, peruse the U.S. Department of Energy report (2014, Executive Summary). I call your attention to Figure 2 (p.3), which plots freshwater withdrawals over time for energy versus other major uses (irrigation and livestock, public and domestic supplies, industrial uses). Also, examine the complex, two-page Figure 6 (p.6-7) that portrays energy flows through various systems. Finally, Figure 9 (p.10) is an impressive attempt to integrate water-energy-land dynamics – certainly “food” for thought.
Required Reading
Glassman, D. et al. 2011. The water-energy nexus. World Policy Institute.(Registered students can access a copy of the presentation under Lesson 8 in Canvas.)
Required Reading
U.S. Department of Energy (DOE). 2014. The Water-Energy Nexus: Challenges and Opportunities – Overview and Summary.(Registered students can access a copy of the report under Lesson 8 in Canvas.)
Water for Transportation
As I have mentioned before, humans have used natural waterways to transport themselves and their goods since our beginnings. Watercraft like non-motorized rafts, canoes, and primitive sailing vessels were used long before roads and railroads were built. In modern times, barges ply rivers with heavy loads, and supertankers haul phenomenal tonnage across the oceans from harbor to harbor.
The objective for this section is simply to become aware of the extensive infrastructure and engineering expertise needed to maintain waterways for commercial and industrial transport. All I ask of you for this section is to explore the website of the U.S. Army Corps of Engineers, one of the oldest governmental agencies in the U.S., and be familiar with their navigation mission. That is the only quiz question I will ask you on this topic.
Summary and Final Tasks
Summary
Once freshwater is used for a particular purpose, it often needs to be considered as wastewater and treated to water quality standards. Thus, for this lesson, you have become familiar with multiple treatment strategies to "clean" contaminated waters. Water uses often involve tradeoffs and competition. You should be able to explain the basics of these treatment approaches.
Deliverable - Quiz 3
Don't forget to complete Quiz 3. The quiz will cover material from lessons 7 and 8, so you should take the quiz after completing all of the activities for Lesson 8. Registered students can access Quiz 3 under Lesson 8 in Canvas. (See the Calendar in Canvas for specific due dates.)
Reminder - Complete all of the Lesson 8 tasks!
You have reached the end of Lesson 8! Double check the to-do list on the Lesson 8 Overview [36] page to make sure you have completed all of the activities listed there before you begin Lesson 9.
Lesson 9: Water Law, Regulation, and Policy
The links below provide an outline of the material for this lesson. Be sure to carefully read through the entire lesson before returning to Canvas to submit your assignments.
Overview
In Lesson 9, students will review the intent and chronology of major U.S. laws and international policies concerning water and wetlands. A one-page assignment will introduce you to a complex case (Rapanos v. United States) from the U.S Supreme Court that sought to address connectivity among waters. The case, decided in 2006, continues to make legal, technical, and political waves today in the U.S.
Learning Outcomes
By the end of this lesson, you should be able to:
- discuss the laws and policies, and their underlying scientific and legal principles pertaining to water law, regulation, policy, and management;
- arrange the chronology of major U.S. laws and international treaties and policies concerning water;
- describe the basic intent of international treaties, laws, and institutions that are used to address and resolve water conflicts.
Lesson Roadmap
This lesson is one week in length. Please refer to the Course Calendar in Canvas for specific time frames and due dates. To finish this lesson, you must complete the activities listed below.
| Requirements | Assignment Details | Access/Directions |
|---|---|---|
| To Watch |
Watch/Read through the Lecture 9.1 - Water Law Regulation & Policy PowerPoint file. |
Registered students can access the Microsoft PowerPoint files under Lesson 9 in Canvas. |
| To Read |
Required
Optional
|
|
| To Do |
|
|
Questions?
If you have any questions, please post them to our Questions? discussion forum located under Orientation and Resources in Canvas. While you are there, feel free to post your own responses if you, too, are able to help out a classmate.
Credits: GEOG 431 Lesson 9 – Water law, regulation, and policy. Authored by Robert P. Brooks, Ph.D., Department of Geography, The Pennsylvania State University, 2014. Material adapted from the text, references cited, and information gleaned from the websites listed.
Background

…jurisdiction over wetlands depends upon the existence of a significant nexus between the wetlands in question and navigable waters in the traditional sense.
Justice Kennedy (2006),
Legal decision from the Rapanos v. United States case
Laws and policies (at the national and state level, or international treaties among nations) determine which waters are protected and which are not. Laws and policies, and the institutions that implement them, are tailored to meet the unique needs of the nation, state, or local jurisdiction from which they originate. Despite inherent differences, there are commonalities among the laws, regulations, policies, and guidance that govern water. As stated in the text, the history of water rights – addressing “the use of and right to use water” – has evolved through time from Roman law. Today, most governance systems concerning water apply one of two rights: 1) riparian water rights, or 2) prior appropriation water rights. Riparian rights allocate water based on the proximity of those who own (or manage) the land adjacent to the water in question, whereas prior appropriation is based on a first-use basis. In the U.S., the eastern states tend toward riparian rights (allowing more public access). The western states, settled later, use a system of prior appropriation, where private ownership and access is determined by who got there first (Fig. 9.1).
As new challenges arise (such as climate change’s effect on freshwater systems), and new knowledge arrives (such as the contribution of small and isolated wetlands to nutrient cycling or animal life history), so must laws and policies evolve to be responsive.
In the U.S., the federal Clean Water Act (CWA) declares a goal to “restore and maintain the chemical, physical, and biological integrity of the nation’s waters,” (33 U.S.C. §1251(a)). This comprehensive law, passed in its current form in 1972, continues to be the primary means of restoring and maintaining water quality in the U.S. Along with the Safe Drinking Water Act of 1974, focusing on supplying potable water, water quality, in general, has improved over time. In addition, various state laws are aimed at protecting the waters of each state, or specifically at preventing pollution or degradation of those waters. Typical forms of regulation include permit requirements for certain activities (such as dredging or filling of streams, lakes, or wetlands), but just as typically contain exceptions and exclusions (frequently for practices associated with agriculture and forestry). Other nations with comprehensive environmental protections and programs have similar mechanisms in effect.
Readings
Chapter 10 is the text discusses water economics which is important for the understanding of water conflicts. Chapter 11 of the text addresses both water conflicts and law/governance. We'll get to issues of conflict in Lesson 10. Focus on gaining background on the origins of water rights, followed by how they are expressed internationally, especially with regard to what the U.N. seeks for water governance among all nations.
Required Reading
Holden (2020) - Teelucksingh et al., Chapter 10 - Water Economics (ONLY p.353-365)
Holden (2020) – Tongper and Barua, Chapter 11 Water conflict, law and governance
With Chapter 11, we are focusing on water law and regulations at the federal level in the U.S. You'll read about protections both historically and under present rules. Focus on the intent of the Clean Water Act. This will lead into the recent water-related cases decided by the U.S. Supreme Court, especially Rapanos v. United States. Discussion #4 addresses this case and its aftermath.
Required Reading
McElfish, JM, Jr., and RP Brooks. 2013. Policy and regulatory programs affecting wetlands and waters of the Mid-Atlantic Region. Pages 441-462 [Chapter 13 in RP Brooks and DH Wardrop (eds.) Mid-Atlantic Freshwater Wetlands: Advances in science, management, policy, and practice.]
This brief "white paper" explains some of the issues associated with the Rapanos decision. Additional readings are recommended for those that find these applied aspects of implementing a law fascinating.
Required Reading
Rapanos White Paper: Brooks and Havens 2014, Proposal to USEPA
Lesson 9 Activity
Your assignment for Lesson 9 is to review scientific, legal, policy, and guidance documents concerning the “fallout” from the U.S. Supreme Court decision, Rapanos v. United States 547 U.S. 715 (2006), and write a two-page opinion paper that summarizes reactions to the outcomes of this “fallout,” addressing relevant scientific and ecological principles as you understand them, and your personal predictions regarding any changes to the law in the near future.
If you are interested in pursuing this topic further, then you should keep following the continuing saga of USEPA’s efforts to forge new guidance for defining the legal jurisdiction over waters, especially wetlands and their relative connectivity to downstream streams and rivers. In a nutshell, USEPA through its Science Advisory Board (SAB) is releasing a science report, Connectivity of Streams and Wetlands to Downstream Waters [37]. The original author of Geography 431 was one of about two dozen experts who reviewed and commented extensively on this report (Summer of 2014). Simultaneously, the USEPA and Army Corps of Engineers released a guidance document, Definition of ‘‘Waters of the United States’’ Under the Clean Water Act [38], to explain what waters are subject to federal jurisdiction in the U.S., and how to identify them. The final science report ultimately will inform the guidance document. The pair of documents, however, has generated significant angst from various interest groups that will be or think they will be affected by this guidance. To put it mildly, the blogosphere has been active. Have a look.
| Description | Full points | Partial points | No points | Points total |
|---|---|---|---|---|
| Reaction summary | Established several reactions (supported by evidence) to the fallout from Rapanos v. US. | Only focused on one reaction about Rapanos v. US. Supporting evidence is vague or missing. | No summary or only focused on one reaction about Rapanos v. US. Supporting evidence is vague or missing.erent reactions. | 10 |
| Addressed scientific/ ecological principles | Clear understanding of ecological processes and/or scientific principles. Used knowledge to support different reactions to Rapanos v. US. | Talks about some ecological processes and/or scientific principles. However, key points are misunderstood or missing. | Does not address ecological processes and/or scientific principles related to Rapanos vs US. | 5 |
| Future predictions | Established clear personal predictions on the effects of Rapanos v. US. Thoughtful and well defined. | Personal predictions are brief. More content needed. | No personal predictions on the effects of Rapanos v. US. | 5 |
| College-level writing | No grammar or spelling mistakes. Content is organized well. | 2-3 grammar or spelling mistakes. Flow and organization of content could be improved. | 3+ grammar or spelling mistakes. Content does not flow and is unorganized. | 5 |
| Citations | Included a complete works cited page. All information is in the student’s own words and appropriately cited. | Missing 2-3 in-text citations or works cited page is incomplete . Some information is not written in the student’s own words. | Missing 3+ in-text citations or works cited page is incomplete or missing. Most information is not written in the student’s own words. | 5 |
Deliverable
Please submit your paper using the Assignment 9.1 - Opinion paper on Rapanos v. United States drop box under Lesson 9 in Canvas. (See the Calendar in Canvas for specific due dates.)
Summary and Final Tasks
Summary
The objectives of Lesson 9 were to introduce you to the complexity of water laws, regulations, and rights spanning from local protection through U.S. federal approaches, and finally, international perspectives. You should know the basic origins of water laws and protections, and the approximate chronology for when protections were put in place. Be cognizant of the two primary U.S. federal laws that protect freshwater: Clean Water Act (1972) and Safe Drinking Water Act (1974). Finally, you should appreciate the ramifications of the Supreme Court’s (SCOTUS) decision in the Rapanos case.
Reminder - Complete all of the Lesson 9 tasks!
You have reached the end of Lesson 9! Double check the to-do list on the Lesson 9 Overview [39]page to make sure you have completed all of the activities listed there before you begin Lesson 10.
Lesson 10: Conflicts Over Water
The links below provide an outline of the material for this lesson. Be sure to carefully read through the entire lesson before returning to Canvas to submit your assignments.
Overview
In Lesson 10, students will explore current and historical water conflicts from any part of the world. After reading Chapter 11 of the text, gaining insight into how water conflicts arise, you will choose a water conflict to profile in a case study. Two sample case studies are provided to help guide your own development of a case study.
Learning Outcomes
By the end of this lesson, you should be able to:
- identify the differences between the four types of water conflicts;
- describe the social issues that arise from water rights and conflicts;
- outline the resolution of international and transboundary conflicts over access to and use of water resources.
Lesson Roadmap
This lesson is one week in length. Please refer to the Course Calendar in Canvas for specific time frames and due dates. To finish this lesson, you must complete the activities listed below.
| Requirements | Assignment Details | Access/Directions |
|---|---|---|
| To Watch |
Watch/Read through the Lecture 10.1 – Water and Wetlands Law & Policy PowerPoint File. |
Registered students can access the Microsoft PowerPoint files under Lesson 10 in Canvas. |
| To Read |
|
|
| To Do |
|
|
Questions?
If you have any questions, please post them to our Questions? discussion forum located under Orientation and Resources in Canvas. While you are there, feel free to post your own responses if you, too, are able to help out a classmate.
Credits: GEOG 431 Lesson 10 – Conflicts over water. Authored by Robert P. Brooks, Jason Pollack, and Jenna Thomas, Ph.D., Department of Geography, The Pennsylvania State University, 2014. Material adapted from the text, references cited, and information gleaned from the websites listed.
Background
…half of the world's population will probably be living in areas that suffer from severe shortages of fresh water, meaning that management of natural resources will be a crucial component of global national security efforts.
Thom Shanker,
New York Times, 12-10-2012,
article about 2012 report by the U.S. National Intelligence Council with prediction for 2030

Water conflicts are widespread, and as climate changes further impact freshwater resources and human populations place increasing demands on water use, conflicts are expected to increase and expand. Water conflicts involve disputes over access to water resources by nations, states, or groups of people. Chapter 11 of the text describes four types of water conflict: consumptive use, pollution, relative distribution, and absolute distribution. Examples of each are provided in the text. In addition, two case studies (one affecting transboundary conditions of the Nile and one about the Amazon concerning indigenous people in Brazil) are provided as examples of how to proceed with your own review of a water conflict for Assignment 10.1.
Readings
This portion of Chapter 11 addresses some aspects of water governance. Consider the type of conflict that you will address in your assignment. (This chapter was asignment in Lesson 9, so it should just be a review)
Required Reading
Holden (2020) – Tongper and Barua, Chapter 11 Water conflict, law and governance (p.382-404)
Here is one of two examples of conflict over water to consider in your choice of a case study.
Required Reading
Case Study #1 – Conflict over the Nile River (Registered students can access the case study under Lesson 10 in Canvas.)
Here is the second of two examples of conflict over water to consider in your choice of a case study.
Required Reading
Case Study #2 – Brazil's Belo Monte Dam Project (Registered students can access the case study under Lesson 10 in Canvas.)
Peruse this list of possible conflicts over water, and choose a case study for your assignment (or find a comparable example from other sources).
Required Reading
Pacific Institute's - The World's Water - Water Conflict Chronology [40]
Optional Reading
Sultana, F. and A. Loftus. 2015. The human right to water
Lesson 10 Activity
Your assignment for Lesson 10 is to write a 2-page essay (3-page maximum) suggesting possible solutions to a case study about water conflicts. You can select a water conflict from any source, but the Pacific Institute's - The World's Water - Water Conflict Chronology [40] has an extensive list from which to choose. Another good source is the Environmental Justice Atlas [41]. Describe and analyze the conflict and determine the environmental impacts, people involved in the conflict, role of governments, and any positives that have resulted from the conflict. Also provide at least one possible solution to the conflict.
Note: If you use the The World's Water - Water Conflict Chronology [40], do NOT choose a "weapon" or "casualty" type of water conflict. These are not really water conflicts; they're just conflicts that involve water in an indirect way and are not ideal for this assignment.
Deliverable
Please submit your paper using the Assignment 10.1 - Water Conflict Essay drop box under Lesson 10 in Canvas. (See the Calendar in Canvas for specific due dates.)
The following rubric will be used to score your assignment.
| Description | Full points | Partial points | No points | Points total |
|---|---|---|---|---|
| Case study | Discussed all topics: type of conflict, environmental impacts, people involved in the conflict, role of governments, any positives outcomes, and potential solution(s). | Does not discuss 1-2 topics: type of conflict, environmental impacts, people involved in the conflict, role of governments, or any positives outcomes. | Does not discuss 3+ topics: type of conflict, environmental impacts, people involved in the conflict, role of governments, or any positives outcomes. | 5 |
| Content | Great overview. Narrative is detailed and demonstrates that the content was well researched. | Good overview. However, details are vague and narrative could be expanded to include more content. | Content is brief and lacks detail. Does not demonstrate an understanding of the water conflict. | 15 |
| College-level writing | No grammar or spelling mistakes. Content is organized well. | 2-3 grammar or spelling mistakes. Flow and organization of content could be improved. | 3+ grammar or spelling mistakes. Content does not flow and is unorganized. | 5 |
| Citations | Included complete works cited page. All information is in the student’s own words and appropriately cited. | Works cited page is incomplete. Some information is not written in the student’s own words. | No primary sources included. Works cited page is incomplete or missing. Most information is not written in the student’s own words. | 5 |
Summary and Final Tasks
Summary
As you can see from the readings and your investigation of a water conflict, societies have argued and fought over access to water resources since civilization began, and probably before that time. Usually, in places where water availability is most threatened by arid conditions, conflicts are most intense, but not always. There are plenty of examples of conflict from temperate and tropical regions as well, where water availability is not the issue. As environmental conditions shift based on the predictions for climate change, the expectations are that conflicts over water will flare up more often and perhaps with more intensity. The United Nations is concerned, as are the military and national security planners in many nations. The goal, of course, is to decrease the number and extent of these conflicts by seeking reasonable solutions for all parties, and to sustainable freshwater supplies for all involved, such that human health and survival, plus ecological integrity, is maintained indefinitely.
Reminder - Complete all of the Lesson 10 tasks!
You have reached the end of Lesson 10! Double check the to-do list on the Lesson 10 Overview [42] page to make sure you have completed all of the activities listed there before you begin Lesson 11.
Lesson 11: Conservation of Freshwater and Future Needs
The links below provide an outline of the material for this lesson. Be sure to carefully read through the entire lesson before returning to Canvas to submit your assignments.
Overview
In Lesson 11, many of the concepts learned in prior lessons become highly relevant, especially our three principles from the course introduction:
- Water is unevenly distributed in quantity and quality (and the reasons why).
- Water is transient and does not respect human-imposed borders.
- Demand for water is not evenly distributed in space and time.
In this lesson, you will learn about virtual water and compute a personal water footprint. You will also select and profile a nation likely to be affected by global climate change. You will gain an appreciation for the complexities of conserving and managing freshwater resources. Additional information on future threats on freshwater resources will provide insights on changing demands and uses of freshwater in the years to come.
Learning Outcomes
By the end of this lesson, you should be able to:
- describe virtual water;
- summarize how water usage varies by individual and by country;
- explain the complexities of measuring the demand and use of freshwater on a global scale.
Lesson Roadmap
This lesson is one week in length. Please refer to the Calendar in Canvas for specific time frames and due dates. To finish this lesson, you must complete the activities listed below.
| Requirements | Assignment Details | Access/Directions |
|---|---|---|
| To Read |
|
The readings come directly from the course textbook (Holden 2020). |
| To Do |
Assignment 11.1 - Water Footprint Report Submit a 2-3 page report summarizing the numeric results and your reaction to your personal water footprint and the water footprint of the nation you chose to investigate. |
Submit your essay to the Assignment 11.1 - Water Footprint Report drop box under Lesson 11 in Canvas. |
Questions?
If you have any questions, please post them to our Questions? discussion forum located under Orientation and Resources in Canvas. While you are there, feel free to post your own responses if you, too, are able to help out a classmate.
Credits: GEOG 431 Lesson 11 – Conservation of freshwater and future needs. Authored by Jason Pollack and Robert P. Brooks, Ph.D., Department of Geography, The Pennsylvania State University, 2014. Material adapted from the text, references cited, and information gleaned from the websites listed.
Water Footprints and Virtual Water
There is a water crisis today. But the crisis is not about having too little water to satisfy our needs. It is a crisis of managing water so badly that billions of people - and the environment - suffer badly.
World Water Vision Report, 2000
An ecological footprint calculates the land that is needed for the products that sustain a nation as well as the waste needed to contain the waste of that population. A water footprint is an illustrative tool to measure total freshwater consumption for countries, states, counties, cities, organizations, or even a single person. A water footprint can be broken into three different sub-areas.
- Green water – consumption of water or rainfall that is stored in the soil or plants.
- Blue water – consumption of clean water resources from surface or underground sources where the water does not return as clean.
- Grey water – water used in dealing with pollution and is defined as the volume of freshwater needed to bring the water to a quality that is capable and clean enough to be placed back into a natural setting.
- Most water that is consumed comes from green water sources (primary production).
- Manufactured products use mostly grey/blue water resources.
- North American, European, Northern African, and Oceanic nations have higher water footprints.
- Virtual water is all of the water used in the production of a product or service. This water can be traced among routes of supply and use worldwide.
Future Threats to Freshwater Resources
The quote at the beginning of this lesson is an unfortunate representation of freshwater management in the present. There are enough freshwater resources globally to support human populations; however, allocating the water to at-risk populations is where freshwater scarcity comes into play. A key example of this quote can be seen in the map below (Figure 11.1). Nations like Norway have enormous water resources that could support a population much larger than itself, while nations like Yemen on the Southern Arabian Peninsula have hardly enough freshwater to support their population.
The changing global climate is expected to greatly impact available water resources. According to NOAA, “Records and research show that sea level has been steadily rising at a rate of 1 to 2.5 millimeters (0.04 to 0.1 inches) per year since 1900. This rate may be increasing. Since 1992, new methods of satellite altimetry (the measurement of elevation or altitude) indicate a rate of rise of 3 millimeters (0.12 inches) per year” (Figure 11.2). If the rate of 3 mm (0.12 inches) per year remains steady, it is possible that by 2100 the ocean will be at a height of 300 mm (12 inches) or one foot higher than it was in 2000. If the ocean were a foot higher in elevation, many island nations throughout the world would be forced to abandon their homeland and become environmental refugees in foreign nations. Coastal cities throughout the world would have to spend billions of dollars to prevent the ocean from encroaching on their boundaries.
At this rate of 3 mm (0.12 inches) per year of increased elevation, human populations should be concerned. As global temperatures rise, places like Greenland, which have trillions of gallons of freshwater stored in ice and glaciers, will begin to experience a decrease in the mass of their snow cover as they melt, adding to the rising sea elevation. Besides the expanding ocean taking away valuable land where humans live upon, it can also have other devastating impacts. Storm surges or even high tides would be capable of bringing the saline ocean water into rivers, groundwater, and reservoirs as the ocean expands. These freshwater resources will mix ocean water with freshwater, creating brackish, undrinkable water. Changing climate also will have an impact on freshwater resources. Larger fluctuations in rainfall will result in longer periods of drought, which could drain groundwater and riverine resources. Rainfall fluctuations will also cause stronger floods and storms, which could cause increased saltwater intrusion and pollution of freshwater resources.
Population growth is expected to increase in the coming century with global populations reaching nearly 8.1 billion by 2025, 9 billion by 2050, and nearly 11 billion people by the century's end. Such a rapidly increased global population is expected to place additional stress on freshwater resources. Peoples from water-stressed regions of the world will become environmental refugees. They will be forced to migrate to countries that possess an excess of freshwater, most likely places like the United States or North/Central Europe. In order to protect remaining freshwater resources in the face of decreasing land space and a rapidly increasing global population, effective conservation policies must be developed.
Conservation Policies
In order to protect the world's remaining freshwater resources, effective conservation policies need to be created. California, a state with ample freshwater in the northern part of the state and a deficit of water in the heavily-populated southern part of the state, has become a national leader in creating strong conservation policies. The Association of California Water Agencies (ACWA) is promoting water conservation statewide to combat one of the longest recorded droughts in the state. Most of the general policies can be applied universally throughout the world.
- One way to protect water resources is to put financial resources into building newer, larger reservoirs that have the capability to hold water in an indoor environment to prevent it from evaporating or dropping to the water table.
- Protecting sensitive environments that are integral to the water resource. From the source to the river delta, policies need to be put in place that prevent excessive withdrawal, development, and contamination. There need to be substantial punishments for violating laws. These punishments would deter businesses, industries, and individuals from breaking water policy laws. A no-build zone should be established for the appropriate area around extremely important areas such as the source or where tributaries meet.
- Tax-incentives and grants should be given to industries that use less freshwater-intensive technologies. Grants should be given to universities, think-tanks, governmental institutions and private companies who are researching and creating technologies that require less water.
- Water conservation will be managed by locally elected members of the community to protect their area's resources. People will have a greater sense of attachment and care more about saving their local area's habitat rather than somewhere at the other end of the state. State governments will work together with local groups to protect their water resources. Federal money should be invested in statewide projects to bring water to those areas most in need.
- Pricing for water should be more heavily regulated to reflect the use, necessity, amount, and location of the buyer in relation to a water resource. Greater accountability towards governments and people should be enforced to ensure that water resources are protected and not exploited.
- Programs should be incentivized to encourage people to follow water policies.
- “Actions that reduce applied water use but do not result in net water supply benefits to the water basin may be justified if they can be shown to advance other local policy objectives, including stream flow, water quality, ecosystem restoration, energy, or flood control.”
- Previous water rights need to be respected and only altered for the necessity of the water resource's preservation.
- Urban water use and agricultural water policies need to become more efficient through technological increases. Irrigation/urban practices should reuse, recycle, or use less of a water resource.
- Water conservation practices need to be taught to children at young ages and persistent advertising/ incentive policies need to be directed towards adults to change the mindset of the populations towards water resources. People need to realize how important and integral water resources are to their lifestyle.
If you are interested in reading more about the subject of conservation, you can access the full Association of California Water Agencies' report on Water Conservation Policy Principles [45] (accessed 7-23-14):
Other ways to enhance water resources could include creating a new governmental body specific to water, give greater authority to the UN to implement water-related laws, invest in technology to access deep groundwater resources, and further develop desalination technology. Extensive lists and further information can be found on any or all of these web pages.
Readings
The final readings of this course provides background on and a rationale for having people compute their Water Footprint. There are some excellent graphics providing perspectives on how different nations use freshwater resources. The concept of virtual water is discussed and illustrated. Finally, the last chapter of the text ends with a discussion of water challenges of the future.
Required Reading
Holden (2020) - Chapter 12 - Virtual water (p. 405-425)
Holden (2020) - Chapter 13 - The future of water (p. 427-445)
Assignment
Assignment 11.1 involves using the Water Footprint Assessment Tool to compute your personal (or family) usage of water (select Your Water Footprint). If you don't have a precise answer, just estimate a value. This website is also where you will access the data for investigating the water footprint for an entire country (select National Water Footprints). Remember to answer the questions about your chosen nation from the perspective of leader in a water resources agency for that country. Metric-to-English equivalents are listed below to help your translations of usage to the metric system used by the calculator.
Use the Water Footprint Assessment Tool [43] from The Water Footprint Network to calculate water footprints. There are tools available, but this one works well and has excellent resources. I encourage you to explore their website, including case studies of calculating and discussing water footprints for products, nations, and the world.
Note: The calculator provides footprint estimates in kilograms (kg). Here are a couple of handy conversions for you:
- there are about 2.2 lb/1 kg
- 1 lb = 0.454 kg; for volume
- 1 m3 = 35 ft3
Lesson 11 Activity
Assignment 11.1 - Water Footprint Report Part A
Read about water footprints in the Water Footprint Network website [48]. Then, compute your personal water footprint using the Water Footprint Calculator [49], briefly discuss the results, and comment on whether you would or would not voluntarily change your behavior concerning water consumption, broadly speaking, and if so, how you would accomplish this. Be sure to demonstrate an understanding of the concept of water footprints. Hint: your water footprint includes both direct and indirect water use.
Note: Do NOT include the fraction of your personal water footprint based on industrial goods consumption. This measure is not very accurate, since it uses income as a proxy for consumption of industrial goods. In addition, I do not intend to know your annual income. Therefore, when you describe your water footprint, please discount the footprint attributable to industrial goods consumption.
Assignment 11.1 - Water Footprint Report Part B
Choose a country that is likely to be dramatically affected by global climate change with respect to its freshwater resources. How should this country adapt considering its economy, politics, resources, and global actions? As a leader of this country's water resources agency, what actions would you implement for water conservation? NOTE: The maps on pages 340-341 of the Holden text may suggest which country would be of interest for you to investigate.
Summarize the findings and comments for Parts A and B in a 2-3 page written report that includes the both numeric results of your personal (or family) water footprint and those of the country you've chosen.
Deliverable
Please submit your report using the Assignment 11.1 - Water Footprint Report drop box under Lesson 11 in Canvas. (See the Calendar in Canvas for specific due dates.)
The following rubric will be used to score your assignment.
| Description | Full points | Partial points | No points | Points total |
|---|---|---|---|---|
| Personal Water Footprint | Results presented and discussed whether or not you would voluntarily change behaviors. | Presented results, but did not discuss whether you would voluntarily change behaviors. And vice versa. | Did not present results nor discuss whether or not you would voluntarily change behaviors. | 5 |
| Vulnerable Country Water Conservation | Discussed adaptation strategies and gave specific recommendations on actions for water conservation. | Discussed adaptation strategies, but did not give specific recommendations on actions for water conservation. And vice versa. | Did not discuss adaptation strategies, nor provide specific recommendations on actions for water conservation. | 5 |
| Content | Thoughtful narrative overall. Demonstrated an understanding of how choices (at the individual and national level) impact water conservation. | Narrative is thoughtful, but could be more specific. Demonstrated an understanding of how choices (at the individual and national level) impact water conservation. | Narrative is too vague. Does not demonstrate an understanding of how choices (at the individual and national level) impact water conservation. | 10 |
| College-level writing | No grammar or spelling mistakes. Content is organized well. | 2-3 grammar or spelling mistakes. Flow and organization of content could be improved. | 3+ grammar or spelling mistakes. Content does not flow and is unorganized. | 5 |
| Citations | Included a complete works cited page. All information is in the student’s own words and appropriately cited. | Works cited page is incomplete. Some information is not written in the student’s own words. | Works cited page is incomplete or missing. Most information is not written in the student’s own words. | 5 |
Summary and Final Tasks
Summary
Congratulations! If you have completed Assignment 11.1 on computing water footprints, you've have completed your last major assignment for the course, and you are 98% of the way to the finish line. Hopefully, you've gained new perspectives on how precious our freshwater resources are and have learned about the complexities of conserving and managing them into the future. In Lesson 12, you will have 3 simple tasks to complete: 1) take Quiz 4 covering Lessons 10 & 11; 2); view the Lecture 12 Microsoft PowerPoint, which is a collage of photographs I've taken with connections to waters - just for fun!; and 3) complete a course evaluation. I value your input on what worked and what did not, and if the course was stimulating and useful to you and your future or current career and activities. All the best, and see you on the water!
Reminder - Complete all of the Lesson 11 tasks!
You have reached the end of Lesson 11! Double check the to-do list on the Lesson 11 Overview [50]page to make sure you have completed all of the activities listed there before you begin Lesson 12.
Lesson 12: The Final Lesson
The links below provide an outline of the material for this lesson. Be sure to carefully read through the entire lesson before returning to Canvas to submit your assignments.
Overview
The intent of Lesson 12 is three-fold: 1) complete Quiz 4, 2) enjoy a photographic journey through waters, and 3) help the instructor improve the course for future offerings by commenting on lessons. With completion of these activities you have finished GEOG 431 - Geography of Water Resources.
Learning Outcomes
By the end of this lesson, you will have:
- completed all quizzes and assignments;
- reflected on the many types of waters we have investigated during the course through a Microsoft PowerPoint of images;
- evaluated lessons completed to assist with future course enhancements; and
- enjoyed the accomplishment of completing a Penn State World Campus course on the Geography of Water Resources - CONGRATULATIONS!
Lesson Roadmap
This lesson is one week in length. Please refer to the Course Calendar in Canvas for specific time frames and due dates. To finish this lesson, you must complete the activities listed below.
| Requirements | Assignment Details | Access/Directions |
|---|---|---|
| To Watch |
Watch/Read through the Lecture 12.1 - Final Images PowerPoint File. |
Registered students can access the Microsoft PowerPoint file under Lesson 12 in Canvas. |
| To Read |
There are no reading assignments for Lesson 12. |
|
|
To Do |
Take Quiz 4 which will cover material from lessons 9, 10, and 11. |
|
|
To Do (optional) |
Provide constructive feedback about the course. This is optional and anonymous. |
Registered students can access a link to the survey under Lesson 12 in Canvas. |
Questions?
If you have any questions, please post them to our Questions? discussion forum located under Orientation and Resources in Canvas. While you are there, feel free to post your own responses if you, too, are able to help out a classmate.
Background
Be sure to review the lecture PowerPoint in CANVAS.
Lesson 12 Activity
As you viewed the lecture with the photographic journey through the waters that surround us, hopefully you have reflected on any new understanding you have gained by completing the lectures, readings, and assignments of GEOG 431. Whether near your home or during travels anywhere in the world, water is fundamental to human life, and aquatic ecosystems are fascinating environments. You carry new knowledge to appreciate what you observe and share with those that you meet.
Deliverable
Complete Quiz 4 and review the water Microsoft PowerPoint. Optional: Complete the anonymous course evaluation. (See the Calendar in Canvas for specific due dates.)
Summary and Final Tasks
Summary
Congratulations! You have completed this online course! Thank you for your participation in and contributions to GEOG 431 - Geography of Water Resources. All the best!
Reminder - Complete all of the Lesson 12 tasks!
You have reached the end of Lesson 12! Double check the to-do list on the Lesson 12 Overview [51]page to make sure you have completed all of the activities listed there.