
Let's break the US transportation sector down in more detail to get a better look at where these emissions originate:
- Light-duty vehicles - those are the passenger cars, trucks, and SUVs we all drive. Want to know more about what that really looks like? Check out EPA's GHG Emissions from a Typical Passenger Vehicle.
- Medium and heavy-duty trucks - construction vehicles and tractor-trailers and the sort fall into this category.
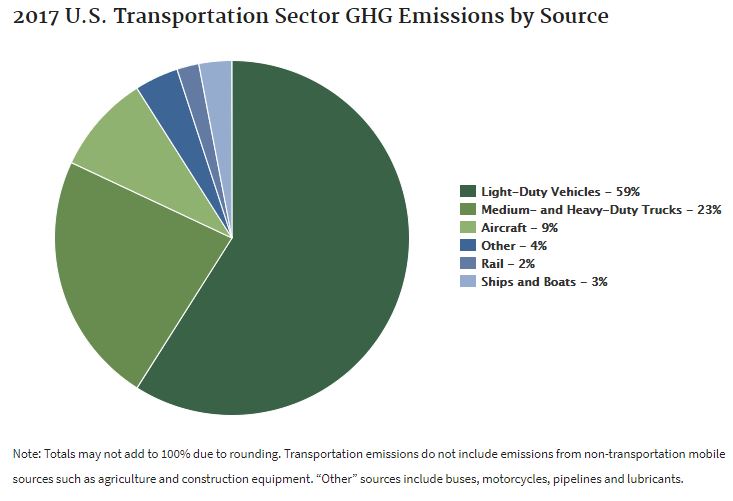
U.S. transportation greenhouse emissions by source, 2017. If you wish to see the most recent data, click the link in the credit.
Click here for a text version of this image
The image is a pie chart described in a four tables below.
| Type of Vehicle | Percentage of total transportation greenhouse emissions |
|---|---|
| Light-Duty Vehicles | 59% |
| Medium- and Heavy-Duty Trucks | 23% |
| Aircraft | 9% |
| Other (buses, motorcycles, pipelines, and lubricants) | 4% |
| Rail | 2% |
| Ships and Boats | 3% |
Credit: 2017 U.S. Transportation Sector GHG Emissions by Source by the US Environmental Protection Agency (2019). (Public Domain)