
While we spend a lot of effort thinking about the role of livestock production as agricultural emissions, crop production also plays a significant role in several ways.
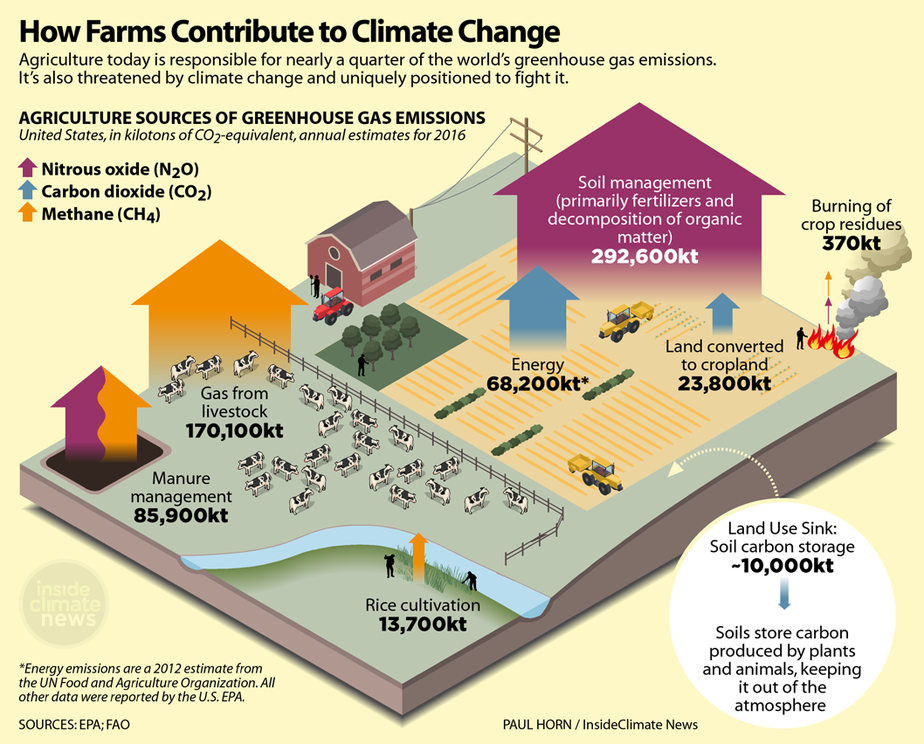
Image Reads: How Farms Contribute to Climate Change
Agriculture today is responsible for nearly a quarter of the world’s greenhouse gas emissions. It’s also threatened by climate change and is uniquely positioned to fight it.
Agriculture Sources of Greenhouse Gas Emissions: US, in kilotons of CO2-equivalent, annual estimates for 2016
Manure Management: Methane and Nitrous Oxide – 85,900kt
Gas from livestock: Methane – 170,100kt
Rice Cultivation: Methane – 13,700kt
Energy: Carbon Dioxide – 68,200kt
Land Converted to Cropland: Carbon Dioxide – 23,800kt
Burning of crop residue: Nitrous oxide and methane – 370kt
Soil Management (primarily fertilizers and decomposition of organic matter): Nitrous Oxide – 292,600kt
Land Use Sink: Soil Carbon ~-10,000kt. Soils store carbon produced by plants and animals, keeping it out of the atmosphere!
- conversion of land to cropland - changing land uses alter that area's ability to sequester carbon. Forests in the US are sequestering about 13% of our annual greenhouse gas emissions (USDA, n.d.). Cropland isn't nearly as productive for sequestration.
- fertilizer use - nitrogen-based fertilizer leads to increases in nitrous oxide emissions (UC Berkeley, 2012). Nitrous oxide's global warming potential is roughly 265-298 times that of carbon dioxide - yikes! (EPA, n.d.).
- energy use in crop production - it takes energy to grow our food - take a look at this chart. If we were in class together, before I showed you this chart, I'd ask for a show of hands - Who thinks it takes more energy to raise livestock? Ok, who thinks it takes more energy to raise crops? I'm guessing most of you would have raised your hand for livestock (and I might have been included in that group myself!). But it turns out, the direct energy consumption for raising crops is more. But, if you go to the EIA discussion of this graph, you'll see that they caveat it that this livestock number does not include the energy it takes to grow livestock feed - that's an indirect energy use not captured here. This is a good example of why it's always important to make sure you understand the data you're looking at.
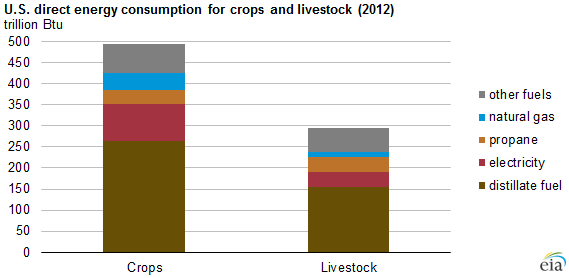
| Energy Source | Trillion Btu's for Crops | Trillion BTU's for LiveStock |
|---|---|---|
| Distillate Fuel | 265 | 155 |
| Electricity | 85 | 40 |
| Propane | 32 | 32 |
| Natural Gas | 40 | 12 |
| Other Fuels | 60 | 55 |