Lessons
1: The Science of Climate Change
WAIT!
Have you completed the Course Orientation in Canvas yet? You'll need to read over the orientation material carefully and then successfully complete a quiz in Canvas to unlock full functionality of the course.
What will we learn?
By the end of this lesson, you should be able to:
- explain what the climate system is;
- explain what we mean by the human causes of climate change;
- explain what we mean by the human consequences of climate change;
- define and differentiate between key terms related to the human dimensions of climate change;
- discuss how reasons for concern about climate change risks are increasing.
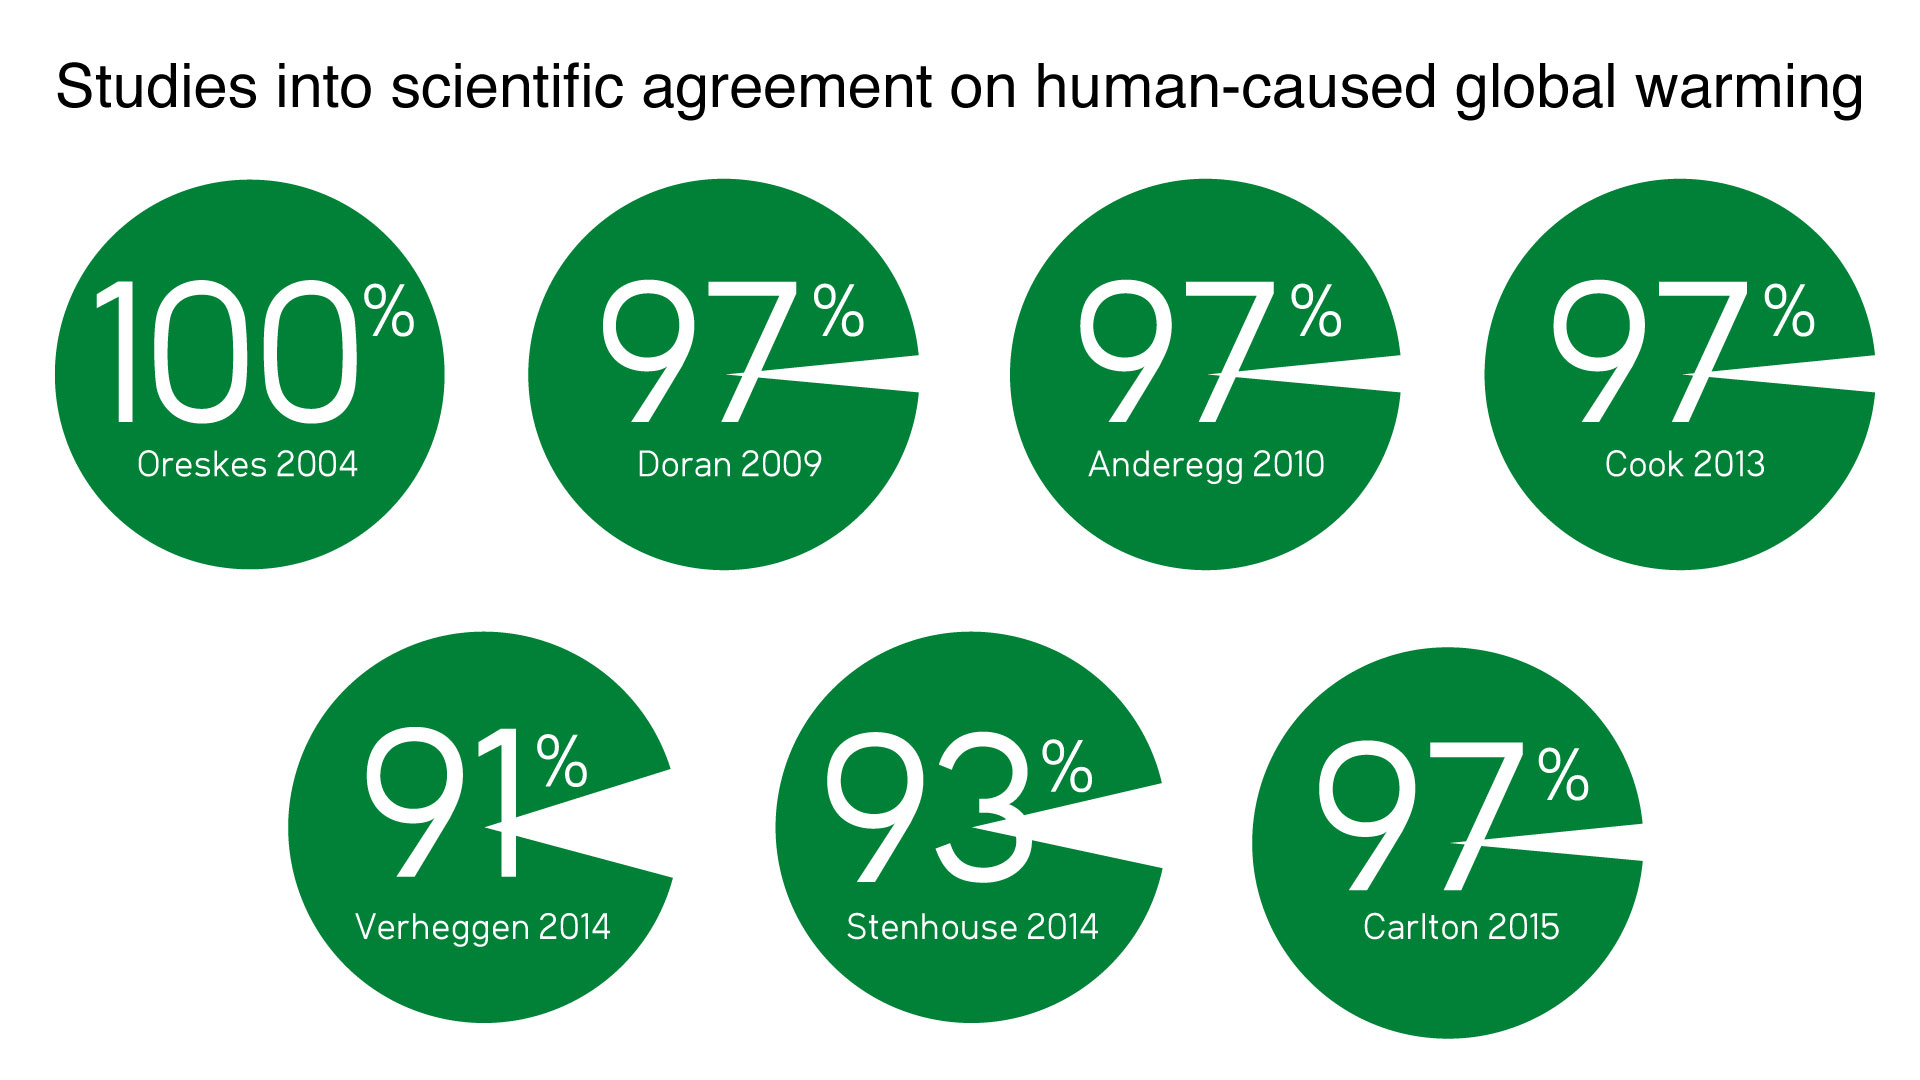
The scientific consensus [1] demonstrates that climate change in the 21st century is a human problem. People are causing climate change through their everyday actions and through the socioeconomic forces underlying those actions. At the same time, people are feeling the consequences of climate change through various impacts on things they value and through the responses they are making to address climate change.
In this first lesson, we will explore the science of climate change and look very broadly at causes and consequences. We need to develop a framework for understanding the relationships between humans and climate. Start thinking about the various scales of space and time involved in the human dimensions of climate change.
What is due this week?
This lesson will take us one week to complete. Please refer to the corresponding module in Canvas for specific assignments, deliverables, and due dates.
Questions?
If you have questions, please feel free to post them to the "Have a question about the lesson?" discussion forum in Canvas. While you are there, feel free to post your own responses if you, too, are able to help a classmate.
The Science Context
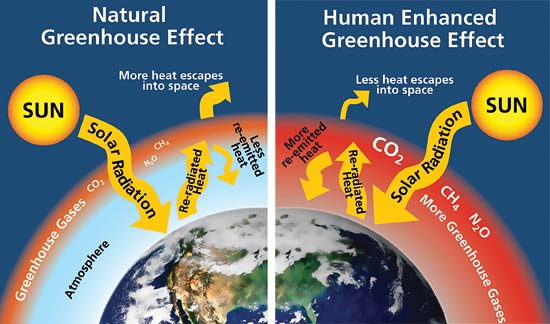
The greenhouse effect is a natural and necessary part of the climate system. Without it, the average surface temperature, which is about 59 °F (15 °C), would be about 0 °F (-18 °C), drastically changing life, as we know it, on Earth. The problem today is that human activities are amplifying the natural greenhouse effect. And in this case, too much of a good thing is the opposite of great.
The greenhouse effect works because solar radiation (i.e., sunlight) passes through the atmosphere relatively unobstructed. The atmosphere, clouds, and surface reflect some of that sunlight; atmospheric particles scatter a small portion of it back to space, and the atmosphere and clouds absorb another fraction. Still, about half of the sunlight reaches Earth’s surface. After absorbing the sunlight, the surface warms and reradiates longer wavelengths of light. A small proportion of this longwave radiation passes unimpeded through the atmosphere into space, but the greenhouse gases (GHGs) – which allow sunlight to pass but not the longer wavelengths of light – absorb most of it, effectively trapping this energy in the lower few miles of the atmosphere and raising the temperature of this layer. As noted, this natural process raises Earth’s surface temperature to levels needed to sustain life. The balance is delicate, and increases in the atmospheric concentrations of the GHGs trap more outgoing longwave radiation and result in rises in air temperature.
Because the climate system is a complex interconnection of the atmosphere and the various subsystems that make up the surface (that is, the soil and rock, ocean, vegetation, and ice cover), heating of the atmosphere’s lower few miles results in changes that propagate throughout the climate system. The ocean also warms, raising sea levels and releasing water vapor through evaporation. The continental surface warms, causing even more evaporation. The additional atmospheric water vapor results in more precipitation, although the distribution is uneven and some places get wetter while others get much drier. Sea ice, permafrost, seasonal snow cover, and glaciers melt under these warmer conditions, with glacier melt further raising sea levels; losing these bright, white surfaces reduces surface reflection and increases the absorption of incoming sunlight, further raising temperatures. There are many, many more changes that take place, but the point is that increasing the greenhouse effect means that the entire climate system must adjust to compensate; hence, scientists prefer the term “climate change” instead of the more popular “global warming.”
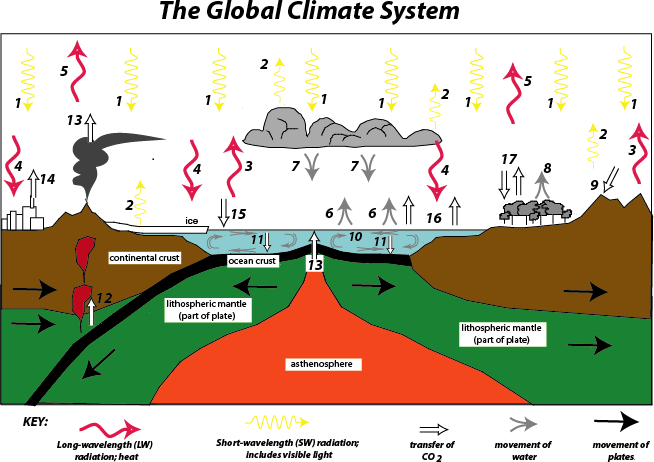
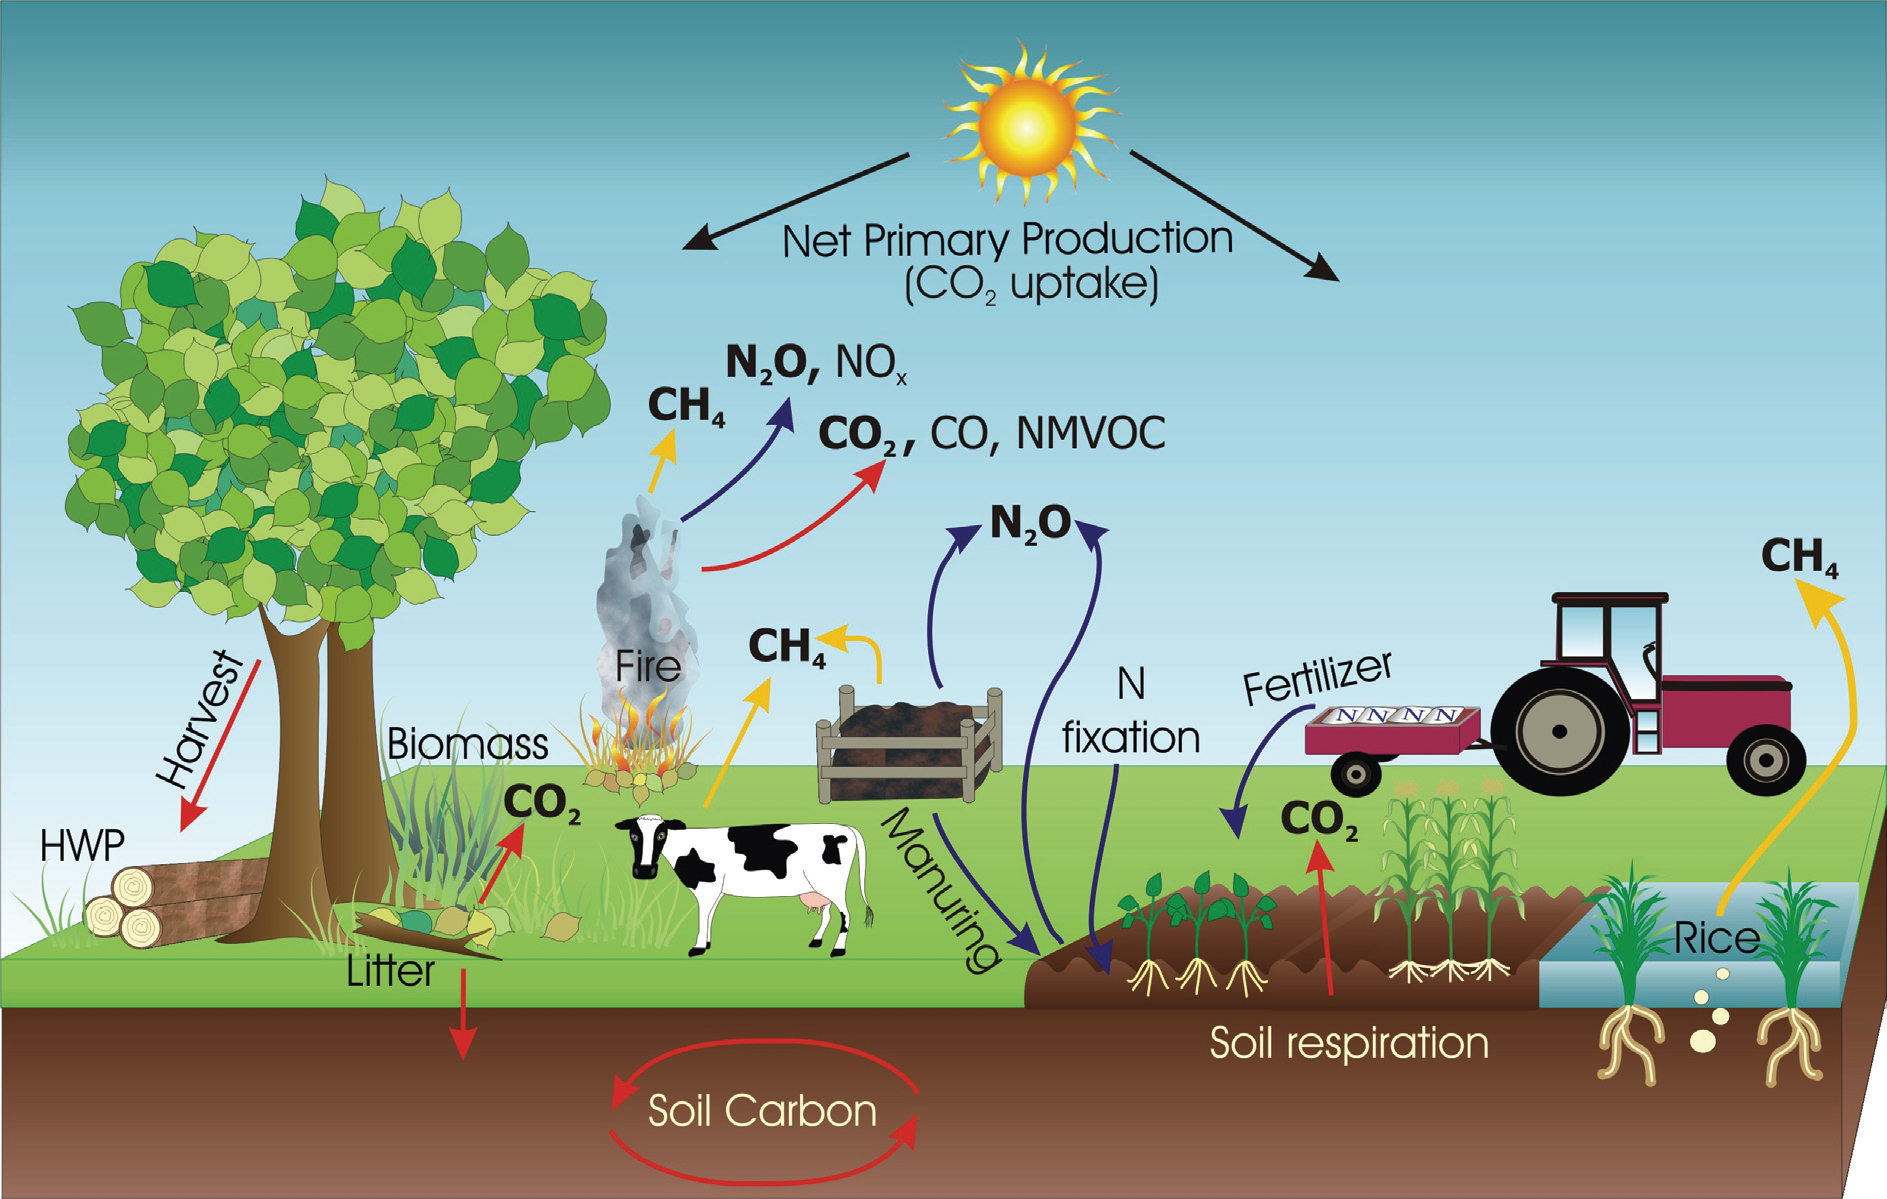
Basics of the global climate system showing the flows of energy, water, and CO₂ that are important in controlling the climate. Solar energy drives the global climate, but clouds, plants, volcanoes, ice, and the oceans all play important roles in regulating the Earth’s greenhouse and determining what happens to solar energy. CO₂ and water are the principal greenhouse gases that absorb heat emitted from the surface and then re-radiate the heat back to the surface; this process maintains the Earth’s temperature at a comfortable level. The numbers in this figure refer to the following key.
- Incoming short-wavelength solar radiation
- Reflected short-wavelength solar radiation
- Emission of long-wavelength radiation (heat) from surface
- Absorption of heat by greenhouse gases and emission of heat from the atmosphere back to surface (the greenhouse effect)
- Emission of surface heat not absorbed by the atmosphere
- Evaporation cools the surface, adds water to the atmosphere
- Condensation of water vapor releases heat to the atmosphere, precipitation returns water to the surface
- Evapotranspiration by plants cools the surface
- Chemical weathering of rocks consumes atmospheric CO₂
- Oceans store and transfer thermal energy
- Sedimentation of organic material and CaCO3 transfers carbon to sediment on the ocean floor
- Melting and metamorphism of sediments sends carbon back to surface
- Emission of CO₂ from volcanoes
- Emission of CO₂ from burning fossil fuels
- Cold oceans absorb atmospheric CO₂
- Warm oceans release CO₂ to the atmosphere
- Photosynthesis and respiration of plants and soil exchange CO₂ between atmosphere and biosphere
- yes, CO2 concentrations have fluctuated over time
- the current concentrations are much higher than anything in the geologic record
Critical Interfaces between Humans and the Climate System
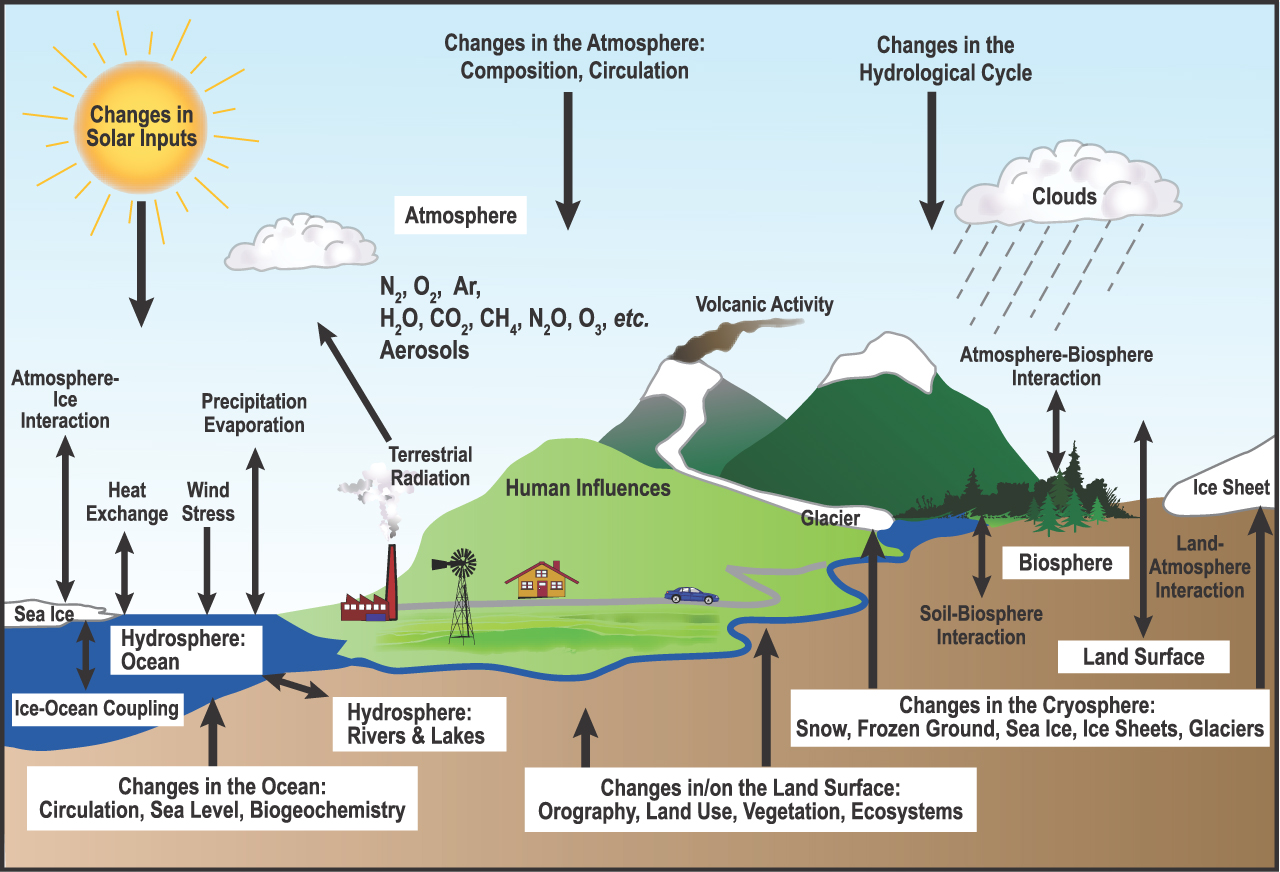
Schematic view of the components of the global climate system, their processes and interactions and some aspects that may change. This information is presented in a series of lists
Components of the Global Climate System
-
Atmosphere (N2, O2, Ar, H2O, CO2, CH4, N2O, O3, aerosols, etc.)
-
Processes and Interactions
-
Atmosphere-Ice Interaction (between the atmosphere and the Sea Ice)
-
Heat Exchange (between atmosphere and ocean)
-
Wind Stress (from atmosphere to the ocean)
-
Precipitation Evaporation (between the atmosphere and the ocean)
-
Terrestrial Radiation (from Human Influences to the Atmosphere)
-
Atmosphere-Biosphere Interaction (between the atmosphere and the biosphere)
-
Land-Atmosphere Interaction (between the Land and the atmosphere)
-
-
Aspects that may change in the atmosphere
-
Composition
-
Circulation
-
Solar Inputs
-
-
-
Biosphere
-
Processes and Interactions
-
Atmosphere-Biosphere interaction (between the atmosphere and the biosphere)
-
Soil - Biosphere Interaction
-
-
-
Land Surface
-
Processes and Interactions
-
Land - Atmosphere Interaction (between the land and the atmosphere)
-
-
Changes in/on the Land Surface
-
Orography
-
Land Use
-
Vegetation
-
Ecosystems
-
-
-
Cryosphere: Sea Ice, Ice Sheets, Glaciers
-
Hydrosphere: Rivers and lakes
-
Processes and Interactions
-
between the Hydrosphere: Rivers and Lakes and the Hydrosphere: Ocean
-
-
-
Hydrosphere: Ocean
-
Processes and Interactions
-
Atmosphere-Ice Interaction (between the atmosphere and the Sea Ice)
-
Heat Exchange (between atmosphere and ocean)
-
Wind Stress (from atmosphere to the ocean)
-
Precipitation Evaporation (between the atmosphere and the ocean)
-
Ice-Ocean Coupling (between the sea ice and the ocean)
-
Hydrosphere: Ocean and Hydrosphere: Rivers and Lakes
-
-
-
Aspects that may change in the Ocean
-
Circulation
-
Sea Level
-
Biogeochemistry
-
-
Human Influences
-
Processes and Interactions
-
Terrestrial Radiation (from Human Influences to the atmosphere)
-
-
The climate system is comprised of five natural components:
- the atmosphere - the envelope of gases that surrounds Earth, including the naturally occurring greenhouse gases that warm the planet’s surface
- the hydrosphere - includes all of Earth’s liquid water and gaseous water (water vapor), whereas the cryosphere includes all frozen water (ice)
- the cryosphere - technically part of the hydrosphere, but climate scientists usually treat it as a separate component of the climate system because its physical properties differ from those of water and water vapor
- the land surface - (does not include water- or ice-covered surfaces) consists of all other vegetated and non-vegetated surfaces
- the biosphere - the realm of life and is found in all of the other natural components, especially the hydrosphere and land surface. In fact, the biota is made up of and requires the presence of air, water, and mineral matter—that is, material from the atmosphere, hydrosphere, and land––to exist
Several external forces influence the five climate system components, with radiation from the sun being most important. Climate scientists consider the impact of human activities on the climate system another example of external forcing.
Proximate Causes of Climate Change
The Human Activities That Cause Climate Change
Proximate causes are the human activities that directly cause climate change.
The human causes of climate change fall into two categories: proximate causes and driving forces.
Proximate causes are the human activities that directly cause climate change. There are two overarching categories of proximate causes: land transformation and industrial processes. People transform the land surface in many ways, with some important types being deforestation, agriculture, urbanization, mining, reservoir building, land draining, and transportation network building. Industrial processes include energy production, transportation, manufacturing, construction, waste disposal, petrochemical, mineral, and food processing, and many other activities. All of these activities change the flux of energy and mass to the climate system.
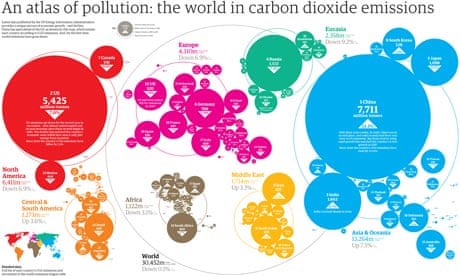
In other words, proximate causes are the emissions and the land use changes that occur because of human activity. We'll take a look at emissions by sector and the geography of emissions later in this unit. While the graphic below is a static image, if you click the link to its home on WRI's site, you'll find that it's part of an interactive tool they've created called the Climate Data Explorer. This allows you to drill down into a country's emissions profile and see what sectors and places are really most responsible for our changing climate. As you take a look at the image below, what do you notice?
- Which countries have the bigger pieces of the global emissions pie?
- Looking at any individual country, which sector or sectors are contributing the most to their emissions profiles?

There are two overarching categories of proximate causes: land transformation and industrial processes. People transform the land surface in many ways, with some important types being deforestation, agriculture, urbanization, and transportation network building. Industrial processes include energy production, transportation, manufacturing, waste disposal, and many other activities. Note that land transformation and industrial processes are not always distinct. For example, building a road transforms the land but requires powerful industrial equipment, mined materials, and processed chemicals. Once the road is built, vehicles traveling on it are manufactured using energy, petrochemicals, and mined materials, and are run by burning mined and processed petroleum products.
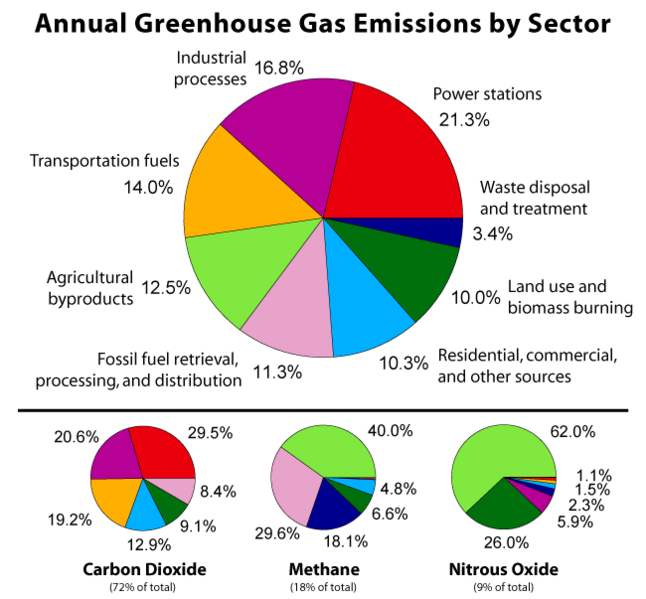
Human activities release GHGs to the atmosphere at unprecedented levels, trapping more of the longwave radiation for longer periods and forcing the surface temperature to rise. The gases most responsible for warming are three naturally occurring gases,carbon dioxide (CO2), methane (CH4), and nitrous oxide (N2O). The manufactured chemicals are collectively called the halocarbons and include chlorofluorocarbons (CFCs), hydrofluorocarbons (HFCs), perfluorocarbons (PFCs), and others. Focusing on the portion of warming caused by the natural gases released by human activity, carbon dioxide is responsible for 72 percent of the warming, methane for 18 percent, and nitrous oxide for 9 percent.
| Process | Percentage of gas emitted |
|---|---|
| Industrial processes | 16.8% |
| Power stations | 21.3% |
| Waste disposal and treatment | 3.4% |
| Land use and biomass burning | 10.0% |
| Residential, commercial, and other sources | 10.3% |
| Fossil fuel retrieval, processing, and distribution | 11.3% |
| Agricultural byproducts | 12.5% |
| Transportation fuels | 14.0% |
| Process | Percentage of gas emitted |
|---|---|
| Industrial processes | 20.6% |
| Power stations | 29.5% |
| Fossil fuel retrieval, processing, and distribution | 8.4% |
| Land use and biomass burning | 9.1% |
| Residential, commercial, and other uses | 12.9% |
| Transportation fuels | 19.2% |
| Process | Percentage of gas emitted |
|---|---|
| Agricultural byproducts | 40.0% |
| Residential, commercial, and other uses | 4.8% |
| Land use and biomass burning | 6.6% |
| Waste disposal and treatment | 18.1% |
| Fossil fuel retrieval, processing, and distribution | 29.6%< |
| Industrial processes | 0.9% |
| Process | Percentage of gas emitted |
|---|---|
| Agricultural byproducts | 62.0% |
| Power stations | 1.1% |
| Land use and biomass burning | 26.0% |
| Industrial processes | 5.9% |
| Waste disposal and treatment | 2.3% |
| Residential, commercial, and other uses | 1.5% |
| Transportation fuels | 1.2% |
Driving Forces of Climate Change
The Underlying Human Factors Driving the Proximate Causes
The driving forces of climate change embody a complex, interactive set of actions and rationales that give rise to the proximate causes. In other words, driving forces are the underlying reasons why people engage in various activities. Understanding the driving forces helps to answer questions such as, why do people drive cars to work (a proximate cause of climate change) when they could walk, ride a bike, or take a bus?
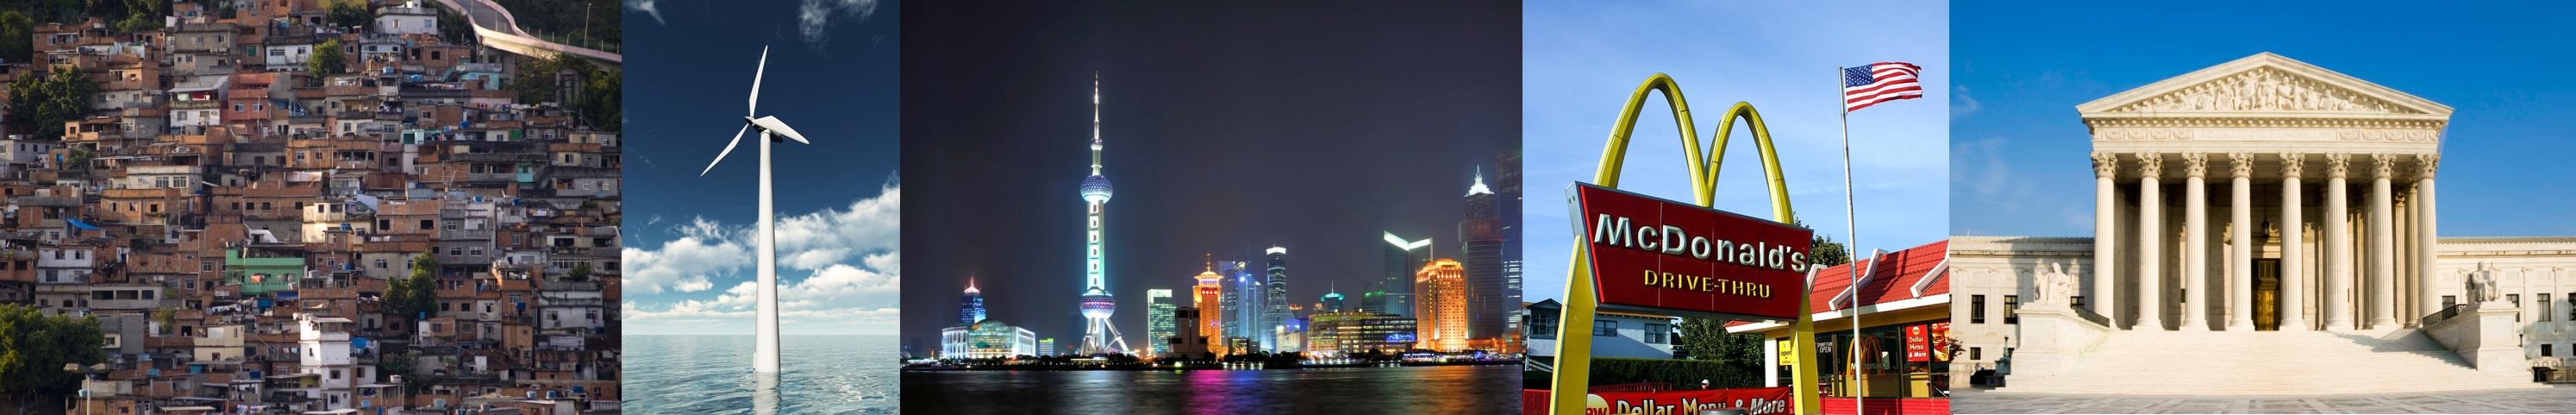
There are five driving forces:
- population growth,
- technological development,
- economic growth,
- institutions, and
- attitudes and beliefs.
The five driving forces are represented in the photo, below: population growth is represented by innumerable houses; technological development is represented by a driver of climate mitigation, a wind turbine; economic growth is represented by the explosive economic development of Shanghai, China; attitudes and beliefs are represented by a cultural icon, McDonald’s golden arches, which denotes attitudes and beliefs about food, convenience, and more; and institutions are represented by the Supreme Court building in Washington, DC.
Population growth - No matter whether they represent agrarian, industrial, or high-tech post-industrial societies, growing populations demand more energy, materials, and room. Human population growth has been explosive, going from 1 billion, less than two hundred years ago, to just over 7 billion today. While this rapid population growth, coupled with the other four driving forces, is at the root of climate change, ascribing the 'blame' for climate change to a growing human population is overly simplistic [20]. Certainly, more people place more demands on the planet's resource, but those demands are unevenly distributed. If you look at CO2 emissions per capita, a very different story emerges. My child born into the United States inherently has a larger carbon footprint than one born into virtually anywhere else in the world. If we look at Africa and some parts of Asia where population growth rates are currently highest, we see that their per capita emissions are the lowest (China of course being the very big exception to this rule).
Technological change has also been quick. Looking at energy and attendant technologies, most energy needs were provided by biomass until the Industrial Revolution, but in many regions, fossil fuels replaced biomass in the 19th and 20th centuries, and nuclear and renewable energy emerged in the latter 20th century. Turning to high technology, computers were unknown before the 1950s, but dominated economies, bureaucracies, educational systems, and even social networks by the first decade of the 21st century. Rapid changes in technology, coupled with soaring populations lead to immense demand for energy and materials — all driving climate change. Ironically, one hope for decreasing the human forcing of climate change involves developing and adopting advanced energy and computer-controlled technologies.
This interactive graphic shows adoption rates, measured as the percentage of households in the US using particular technologies. Data is given for the change in use between the years of 1860 and 2019 for technologies such as flush toilets, computers, telephone landlines, automobiles, washing machines, etc. Please see the text above the image.
Economic growth (including “negative growth”) can also be rapid and can have a tremendous influence on climate forcing. The fall of the Soviet Union and its satellites is a good example. The Soviet political system promoted growth-at-any-cost economic policies. The industries of this empire used outdated, dirty fossil fuel-based technologies, resulting in massive greenhouse gas emissions. With the collapse of the Soviet political and economic system in the late 1980s and early 1990s, greenhouse gas emissions from these countries plummeted and global carbon dioxide emissions actually decreased for a short time. Similarly, but in the opposite direction, the recent explosive growth of the Chinese economy, with its 1.3 billion people and heavy reliance on coal, has resulted in soaring global carbon dioxide concentrations—concentrations that exceed the worst-case scenarios envisioned by climate scientists.
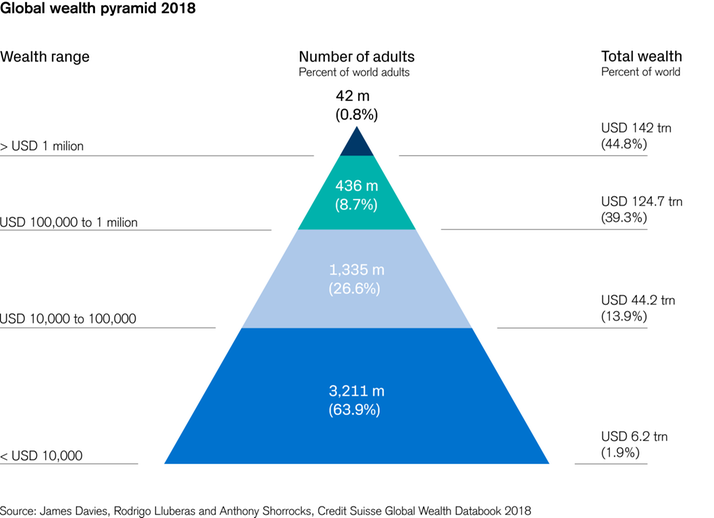
It's important as we are thinking about issues related to equity to take a look at the shape of our global economy. Here, the global wealth pyramid illustrates that just 0.8% of the population holds almost 45% of the world's wealth. This has enormous implications for our responses to climate change, both as individuals and as a society.
Legal, governmental, economic, academic, and other institutions can drive human activities causing climate change. For instance, American institutions tend to promote commuting by car and discourage mass transit. Low taxes on gasoline and cheap or free parking make it less expensive to drive to work than to take mass transit; higher gas taxes and expensive, limited parking would make it more cost effective to take mass transit. Extensive road networks, paid for by taxes, and massive parking lots, paid for by a combination of employers and governments, make it convenient and comfortable to drive. In contrast, walking to and from a distant bus stop and waiting for the bus in foul weather with no shelter makes taking the bus much less convenient and comfortable than driving. Ironically, it would be much cheaper for employers and governments to provide more bus stops with shelters than to build roads and parking lots. Many other institutions encourage Americans to drive to work rather than take mass transit.
Widely shared cultural attitudes and beliefs can also cause humans to engage in activities that contribute to climate change. Americans like the individual freedom provided by owning and driving a car, thus promoting the proliferation of vehicles on the road. Americans also prize comfort, convenience, utility, and feeling in-charge, which causes many of them to prefer large, inefficient sport utility vehicles (SUVs), minivans, and pickup trucks over commuting or small, efficient, and less showy compact and subcompact cars. Coupled with rising population, growing wealth, and support from institutions, characteristic American attitudes and beliefs have driven the explosive growth of the SUV, minivan, and pickup market over the last generation and have led to a surge in greenhouse gas emissions from transportation.
Climate Change Indicators
Seeing is believing. We'll spend a lot of time this semester looking at the impacts of a changing climate. We'll move our conversation out of the Arctic and into our own backyards. One of the most compelling ways we can be effective communicators of climate science is to contextualize it within familiar and valuable frameworks to our intended audience.
USDA and EPA have put together this Climate Change Indicators website, and it's quite good. Take a walk through the various metrics scientists use to understand the impacts of anthropogenic climate change. This site may end up being a useful resource to you as you pull together your Climate Change in My Community project this semester.
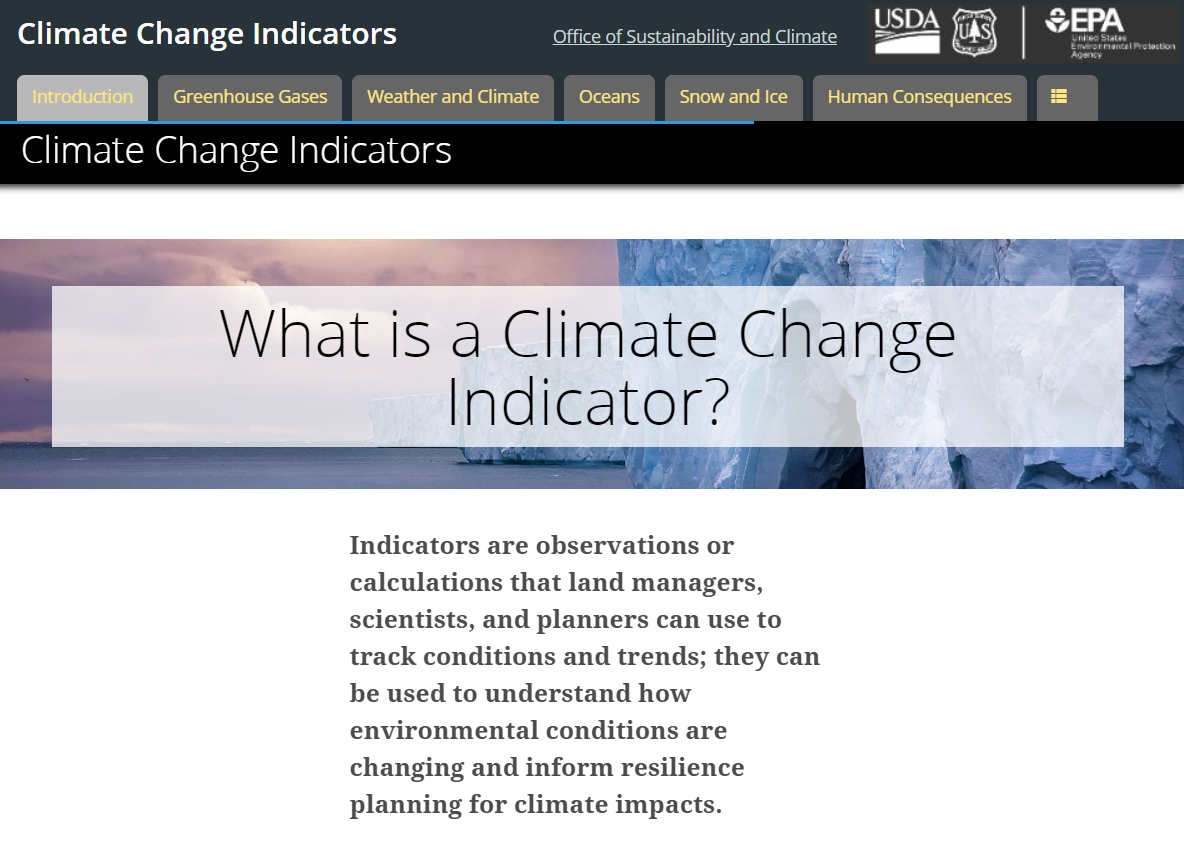
Image Reads:
What is a climate change indicator?
Indicators are observations or calculations that land managers, scientists, and planners can use to track conditions and trends; they can be used to understand how environmental conditions are changing and inform resilience planning for climate impacts.
Summary
This first lesson was intended to be a broad introduction to some topics we'll explore in more depth throughout the semester.
Key takeaways:
- Understanding of the science of the human causes of anthropogenic climate change (this is probably a review for most of you).
- The differences between proximate causes and driving forces of climate change.
- Familiarity with the IPCC terminology related to climate change.
Reminder - Complete all of the Lesson 1 tasks!
You have reached the end of Lesson 1! Double-check the lesson assignments in the corresponding lesson module in Canvas to make sure you have completed all of the tasks listed there.
2: Emissions By Sector
Now that we've established the scientific context for climate change and understand that its emissions that primarily drive these changes, let's take a closer look at these emissions by sector. As we work our way through this lesson, be thinking carefully about how these emissions sectors relate both to the proximate causes and driving forces of climate change we learned about last week.
What will we learn?
By the end of this lesson, you should be able to:
- understand the role of each emissions sector in the overall emissions profile;
- describe the growth in GHG emissions from these sectors;
- identify and explain differences in emissions sectors in various geographic areas.
What is due this week?
This lesson will take us one week to complete. Please refer to the corresponding module in Canvas for specific assignments, deliverables, and due dates.
Questions?
If you have questions, please feel free to post them to the "Have a question about the lesson?" discussion forum in Canvas. While you are there, feel free to post your own responses if you, too, are able to help a classmate.
Energy
To understand emissions sources, it's useful to categorize those emissions. One such way to do that is by sector. This lesson is going to look specifically at Energy, which is the biggest source of anthropogenic GHG emissions (by far!). More specifically, we are going to break down energy into a few subcategories: power generation, transportation, and industrial processes, as shown below. This lesson, we'll be focusing on the subset of that big almost-the-whole-piece-of-the-pie energy sector.
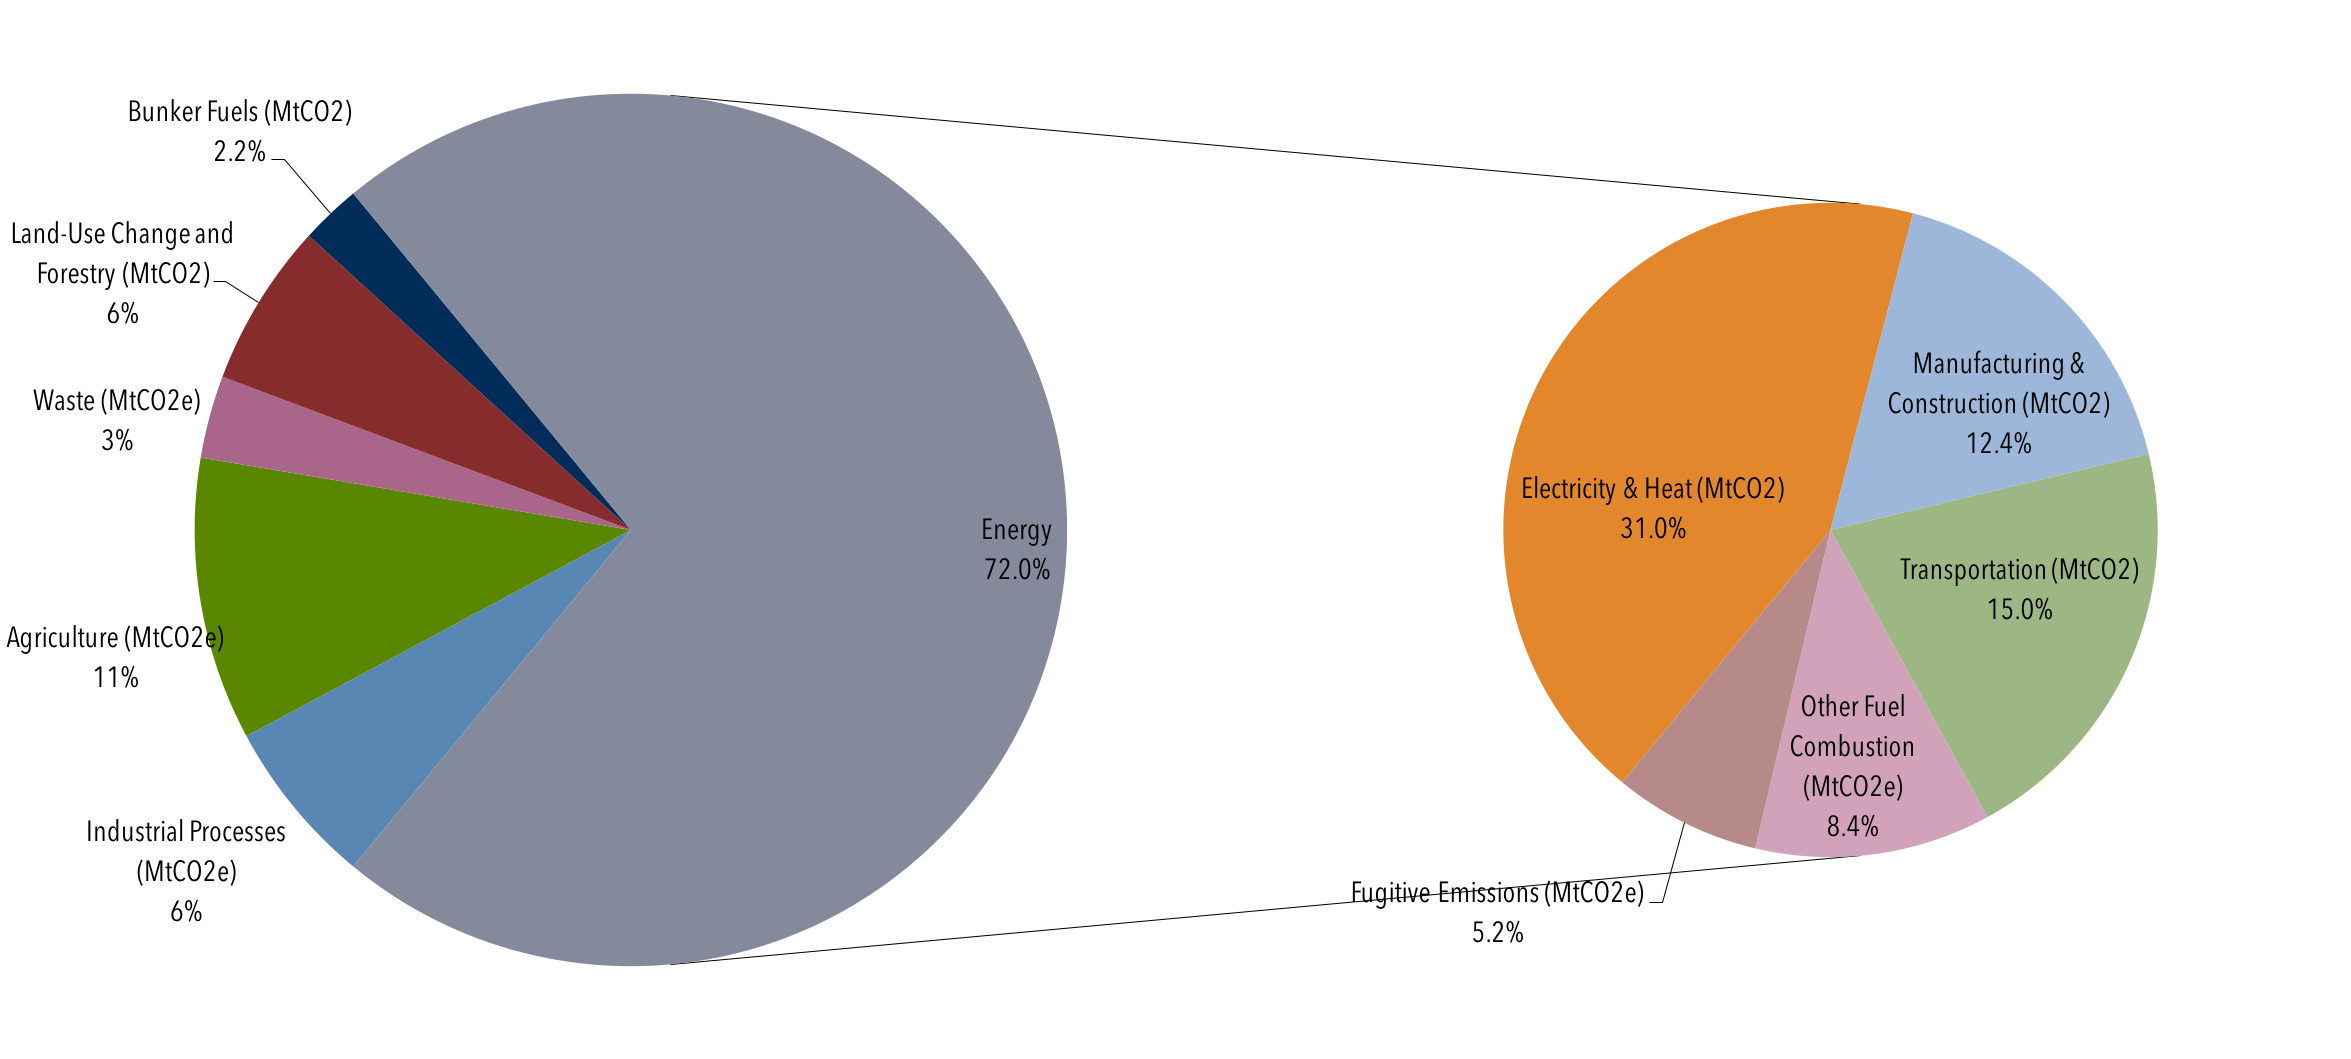
| Sector | Percentage |
|---|---|
| Energy | 72% |
| Agriculture (MtCO2e) | 11% |
| Industrial (MtCO2e) | 6% |
| Land Use Change and Forestry (MtCO2e) | 6% |
| Waste (MtCO2e) | 3% |
| Bunker Fuels(MtCO2e) | 2.2% |
| Source | Percentage |
|---|---|
| Electric and Heat (MtCO2e) | 31.0% |
| Transportation (MtCO2e) | 15% |
| Manufacturing and Construction (MtCO2e) | 12.4% |
| Other Fuel Combustion (MtCO2e) | 8.4% |
| Fugitive Emissions (MtCO2e) | 5.2% |
Energy use and consumption produce more GHG emissions than any other realm of human endeavor. A brief look at the socioeconomic drivers of energy use and consumption helps explain some of the reasons why. Current technologies for generating energy focus on GHG-intensive fossil fuels; the economic system favors producing the greatest amount of energy at the lowest cost and does not account for the environmental costs of energy production; political and legal institutions promote and protect fossil-fuel industries and typically fail to foster alternative energy sources adequately, and Western lifestyles are energy-intensive but many non-Westerners aspire to a Western lifestyle. Add to that the exponential growth of Earth’s human population and it is no wonder that GHG emissions continue to grow rapidly.
Introduction to the Energy Sector and Its Greenhouse Gas Emissions
Global GHG emissions from energy use and production far outweigh emissions from other activities. The industrial processes, agriculture, land-use change and forestry, and waste management sectors together account for 37 percent of all global GHG emissions in the accompanying pie chart. However, a significant proportion of the emissions from agriculture and from land-use change and forestry involve fossil fuel consumption, so the percentage of emissions from energy is greater than the graphic implies. Consequently, far more than two thirds of all GHG emissions result from energy use and production.
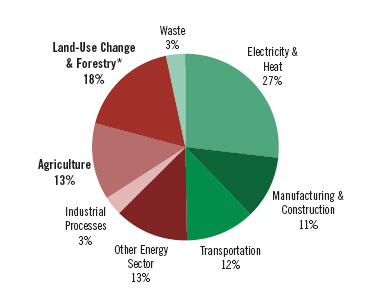
This is a pie chart showing the percent of GHG emission from various activities. Below it is represented as a table.
| Source of GHG Emission | Percent of total |
|---|---|
| Electricity and Heat | 27% |
| Manufacturing and Construction | 11% |
| Transportation | 12% |
| Other Energy Sector | 13% |
| Industrial Processes | 3% |
| Agriculture | 13% |
| Land-Use Change and Forestry | 18% |
| Waste | 3% |
In the pie chart, electricity and heat production is clearly the largest emitter of GHGs, being responsible for over one quarter of total emissions. Most of these emissions are attributable to society’s dependence on coal and secondarily on natural gas. The remaining energy categories –– manufacturing and construction, transportation, and “other” –– each contribute approximately equal proportions of the global GHG emissions.
Going beyond this particular graphic, when compiling the national GHG emissions inventory, the US breaks its energy sector emissions into three broad categories: mobile sources, stationary sources, and fugitive sources.
The stationary sources category is large and includes many activities.
- Most prominent in terms of GHG emissions is the electricity and heat generation subsector, mentioned above.
- Most of these emissions come from coal-fired power plants that generate electricity, heat, or both (through co-generation). Increasingly, because supplies are becoming cheaper and more plentiful, natural gas is replacing some of the generation capacity provided by coal, thereby reducing GHG emissions when there is a direct substitution of natural gas for coal.
- Power generation from natural gas emits about one half the emissions of coal, but is nevertheless still a potent source of GHGs.
- Moreover, developing countries such as China and India are building huge numbers of coal-fired power plants and –– although the newer ones use more advanced technologies that emit about one third fewer GHGs than old technologies –– are adding vast quantities of GHGs to the atmosphere.
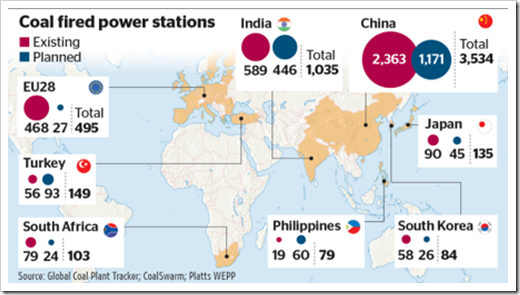
| Country | Existing | Planned | Total |
|---|---|---|---|
| EU28 | 468 | 27 | 495 |
| Turkey | 56 | 93 | 149 |
| South Africa | 79 | 24 | 103 |
| Philippines | 19 | 60 | 79 |
| South Korea | 58 | 26 | 84 |
| Japan | 90 | 45 | 135 |
| India | 589 | 446 | 1035 |
| China | 2363 | 1171 | 3534 |
There are many other important categories of GHG-producing activities:
- manufacturing and construction together are the second-largest emitters among the stationary sources behind electricity generation;
- mining (excluding coal mining) and the fossil fuel industries (including coal mining, petroleum and natural gas extraction, and fuel processing) are also major emitters;
- as noted earlier, agriculture and forestry consume fossil fuels;
- stationary sources involve food-processing and forest product-processing facilities, for instance;
- compared to the other stationary sources, commercial (e.g., corporate buildings, small businesses), institutional (e.g., government buildings, universities, prisons), and residential energy sources produce relatively modest quantities of GHGs through direct consumption of fossil fuels.
Even so, these enterprises consume huge amounts of electricity, and most of this electricity comes from fossil fuel-powered power plants, so these categories are indirectly responsible for a very large proportion of GHG emissions.
In addition to transportation and stationary sources, fugitive CH4 emissions from coalmines and from oil and natural gas drilling sites, as well as from natural gas pipelines, were thought to be a relatively small source of GHG emissions. Recent work, however, suggests that fugitive emissions may in fact be a major source of atmospheric CH4, so this part of the energy sector is coming under increased, intense scrutiny.
- Explained: Fugitive methane emissions from natural gas production [27](Carbon Brief, 2014) gives a nice overview of some of the more recent studies that have tried to answer this question.
- A close look at fugitive methane emissions from natural gas [28] (Bradbury and Obeiter, 2013) also gives a nice brief summary of the context of the problem and ways of trying to quantify its severity.
The relationships among energy production, energy storage and distribution, energy marketing, and energy demand and consumption are extremely complex. Thus, trying to pin GHG emissions to any one component in this complex web is arbitrary. Indeed, calculating emissions from the energy sector is fraught with error because of this complexity. It is best to think not in terms of exact proportions of GHG emissions from any one activity or subsector, but in terms of which categories are the big players.
Global Energy Demand and Consumption
The world consumes massive quantities of energy, with much of that energy embodied by GHG-emitting fossil fuels.[1] This image shows primary energy consumption by world region in 2015. Together, China and the United States represent 40% of global energy consumption. This is why our cooperation to solve climate change-related challenges is so pivotal.
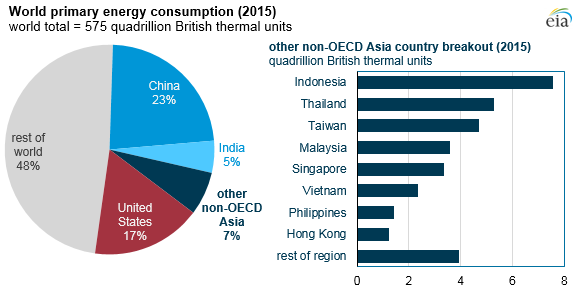
| United States | 17% |
|---|---|
| Other non-OECD Asia | 7% |
| India | 5% |
| China | 23% |
| Rest of the World | 48% |
| Country | Quadrillion British THermal Units |
|---|---|
| Indonesia | 7.5 |
| Thailand | 5.5 |
| Taiwan | 5 |
| Malaysia | 3.7 |
| Singapore | 3.5 |
| Vietnam | 2.5 |
| Philippines | 1.26 |
| Hong Kong | 1.2 |
| Rest of the Region | 4 |
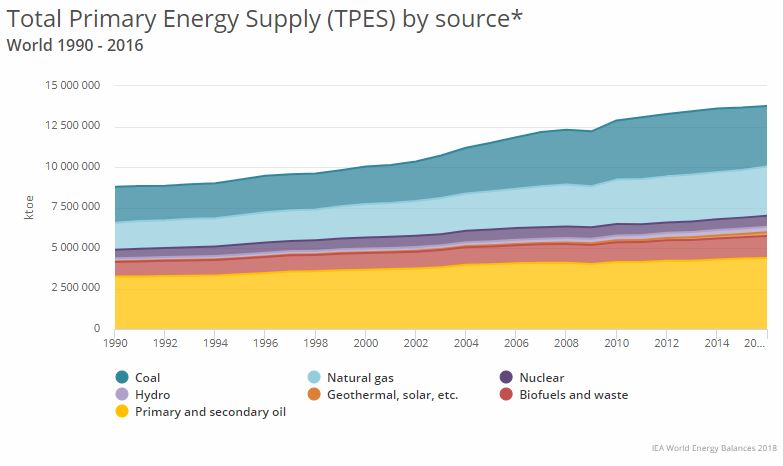
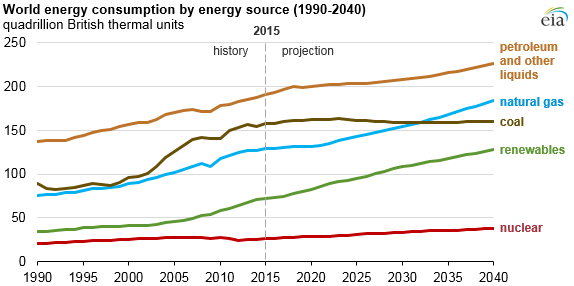
The next image shows a graph of global consumption by fuel type for 1990-2016. Overall consumption has almost doubled in this time period (and has more than doubled if we went back 40 years). The three fossil fuels (oil, coal, and natural gas) dominate, encompassing between 80 to 90 percent of energy consumption throughout the period. Oil provides the largest proportion of energy, but proportionally has lost ground to coal and especially natural gas (why might that be?). Coal has had an upsurge in the 21st century, especially after 2005, and may become the leading fossil fuel in the future as oil supplies drop and demand for energy increases in places such as China and India, with massive coal reserves but little oil and natural gas. Biomass and hydroelectric power grew a little. Other renewables are a trivial proportion of the global energy picture. Clearly, the grip of the GHG-producing fossil fuels on the world energy picture is strong.
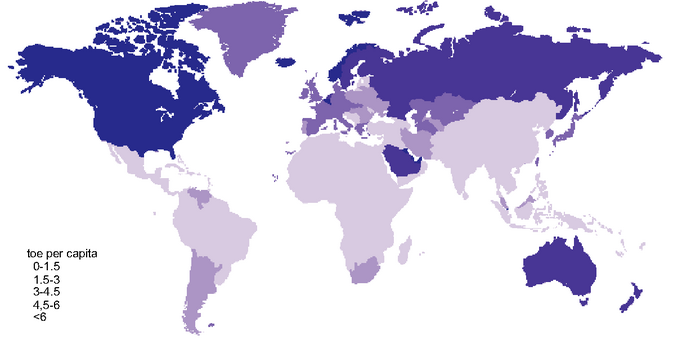
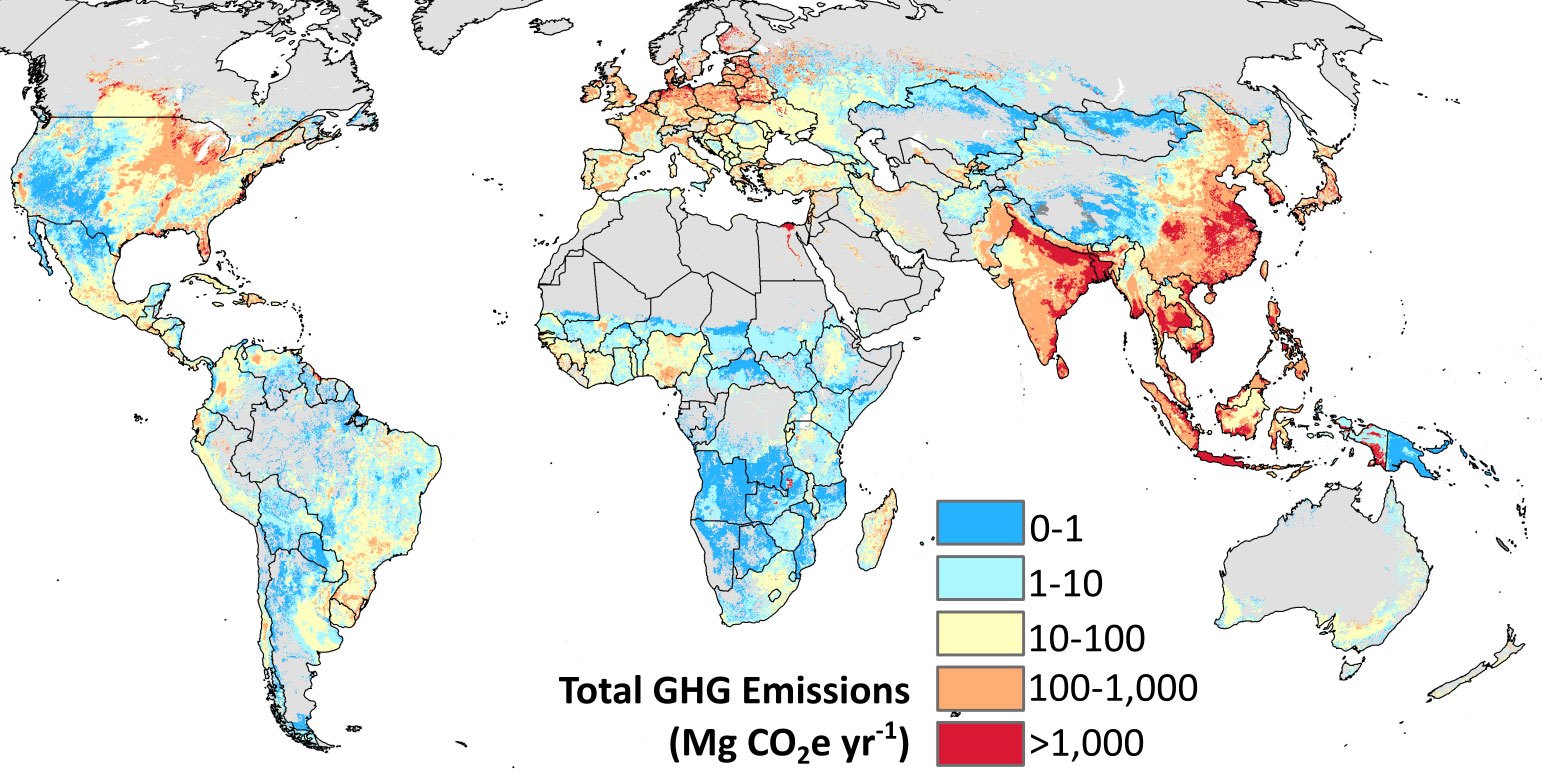
The next image shows a map of per capita energy consumption across the globe. An obvious general pattern emerges: low-latitude countries have very low per capita consumption –– and therefore low per capita GHG emissions –– while mid- to high-latitude countries have high per capita consumption and emissions. (Exceptions exist. For example, Saudi Arabia has anomalously high per capita energy consumption compared to surrounding countries because it is a wealthy, oil-rich country with a low population.) On the one hand, the pattern suggests that low-latitude countries with very low per capita energy consumption and very high populations such as China, India, and Indonesia, will become significant sources of GHGs as their per capita consumption figures rise. Indeed, China, which has the world’s largest population, has rapidly rising per capita energy consumption. Combined with its focus on coal as its primary energy source, China is now the world’s largest emitter of GHGs. India is hot on China’s heels, with a rapidly expanding coal-based economy. On the other hand, the pattern also suggests global inequities because the mid- to high-latitude countries have such very high per capita energy consumption figures. Opportunities exist for these countries to reduce per capita consumption by undertaking energy efficiency measures, adopting non-GHG-producing energy types, and modifying their energy-intensive lifestyles. This contrast between the low latitudes (the global South) and the mid- to high latitudes (the global North) is at the heart of the ongoing United Nations climate negotiations.
[1] Most of the remainder of this lesson is based on figures presented in Sims, et al., 2007. Energy supply. In: Climate Change 2007: Mitigation. Contribution of Working Group III to the Fourth Assessment Report of the Intergovernmental Panel on Climate Change [B. Metz, et al. (eds)], Cambridge University Press.
Greenhouse Gas Emissions from the Energy Sector
The next image shows CO2 emissions from fossil fuel combustion by country. In 2015, China's share was 28 percent of the world’s CO2, while the US share was 15 percent. The next closest country, India, emitted about 6 percent of the CO2. Clearly, to bring down global emissions from the energy sector, China and the US must lead the way.
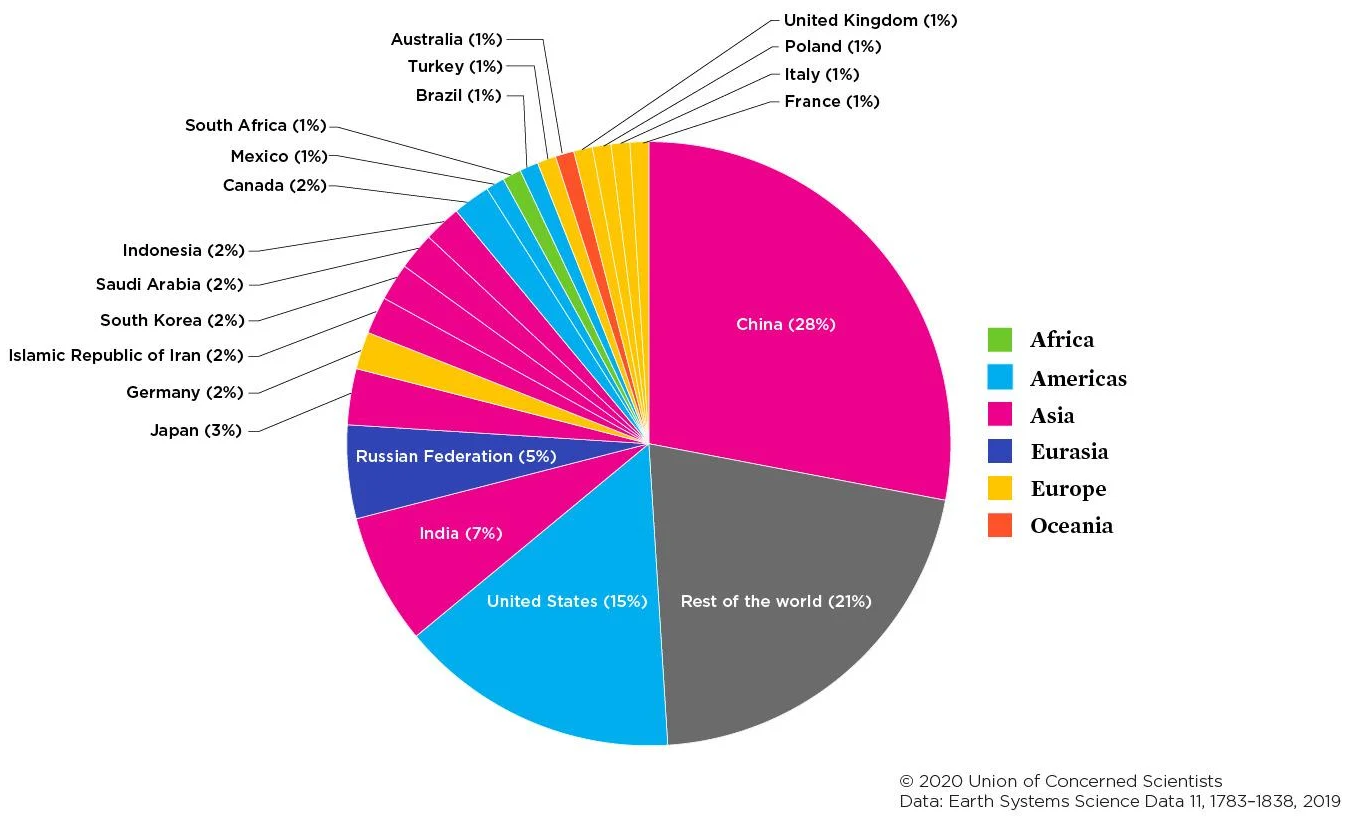
| Country | Percentage |
|---|---|
| China | 28% |
| USA | 15% |
| India | 7% |
| Russian Federation | 5% |
| Japan | 3% |
| Germany | 2% |
| South Korea | 2% |
| Iran | 2% |
| Canada | 2% |
| Saudi Arabia | 2% |
| Rest of the World | 30% |
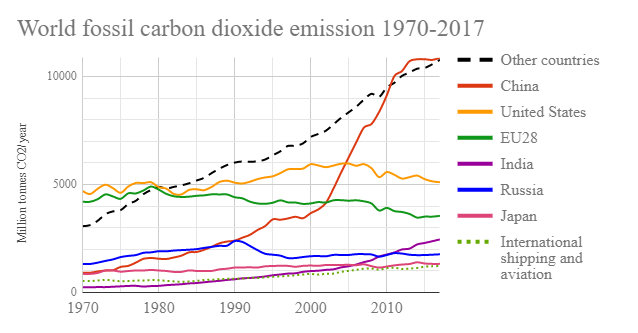
The next image is a graph depicting fossil fuel-based CO2 emissions for the US, China, several other key emitters, and the aggregate rest of the world between 1970-2017. What jumps out at you?
- China’s emissions rose sharply after the turn of the century, while the U.S. emissions started to flatten out and drop at the end of that same period. These trends have continued. It is important to note that estimates (Liu et al., 2013. Block, n.d.) attribute one-third of China’s emissions to their exports and 20 percent of those exports come to the U.S. Thus, this fact implies that U.S. CO2 emissions should be higher and China’s emissions lower. In any case, both nations dominate global carbon dioxide emissions.
The next image displays the GHG emissions from the various systems used to generate electricity. Clearly, coal and its close cousin lignite produce the most GHG per unit of energy produced. Fuel oil is the next most GHG-intensive generation system. Natural gas, which is often touted as the clean alternative to coal, certainly emits about half as many GHGs per unit of energy but is still extremely GHG-intensive compared to non-fossil fuel alternatives. Renewables and nuclear produce trivial quantities of GHGs compared to the three fossil fuel types –– coal, oil, and natural gas.
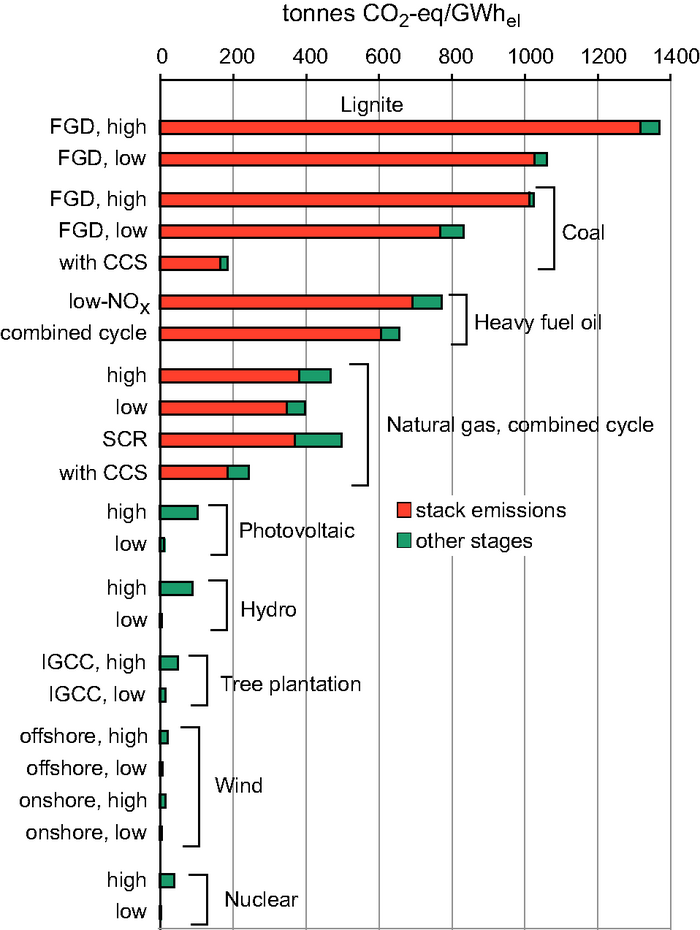
| Electricity Generation System | Stack Emissions (tonnes CO2-eq/GWhel) |
Other stages |
|---|---|---|
| Lignite (FGD, high) | 1300 | 1300-1350 |
| Lignite (FGD, low) | 1025 | 1025-1050 |
| Coal (FGD, high) | 1020 | 1020-1025 |
| Coal (FGD, low) | 750 | 750-825 |
| Coal (with CCS) | 150 | 150-175 |
| Heavy fuel oil (low-NOx) | 700 | 700-775 |
| Heavy fuel oil (combined cycle) | 600 | 600-650 |
| Natural Gas, combined cycle (high) | 375 | 375-500 |
| Natural Gas, combined cycle (low) | 350 | 350-400 |
| Natural Gas, combined cycle (SCR) | 375 | 375-500 |
| Natural Gas, combined cycle (with CCS) | 175 | 175-250 |
| Photovoltaic (high) | - | 125 |
| Photovoltaic (low) | - | 25 |
| Hydro (high) | - | 100 |
| Hydro (low) | - | 5 |
| Tree plantation (IGCC, high) | - | 50 |
| Tree plantation (IGCC, low) | - | 20 |
| Wind (offshore, high) | - | 25 |
| Wind (offshore, low) | - | 5 |
| Wind (onshore, high) | - | 20 |
| Wind (onshore, low) | - | 5 |
| Nuclear (high) | - | 50 |
| Nuclear (low) | - | 0 |
The final graphic in this section illustrates the fact that CO2 emissions go down as efficiency in burning fossil fuel in power generation goes up. For coal, new technologies improve efficiencies and reduce emissions –– but they are still exceptionally high compared to the alternatives. New natural gas power generation is about half as CO2-intensive as the best single-purpose coal-fired power plant. Cogeneration (also known as CHP, combined heat and power) is dual-purpose and drastically improves the efficiency of any fossil fuel power generating system, halving the efficiency of single-purpose systems.
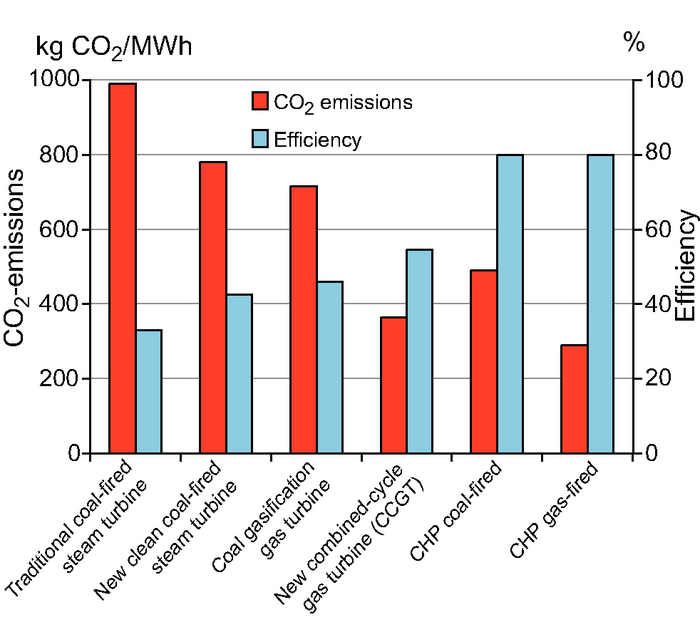
| Energy Generation System | CO2 Emissions (kg CO2/MWh | Efficiency (Percentage) |
|---|---|---|
| Traditional coal-fired steam turbine | 995 | 30 |
| New clean coal-fired steam turbine | 775 | 40 |
| Coal gasification gas turbine | 700 | 45 |
| New combined-cycle gas turbine (CCGT) | 375 | 55 |
| CGP coal-fired | 500 | 80 |
| CHP gas-fired | 275 | 80 |
Transportation
Transportation is a fundamental activity causing climate change. The transport sector includes air, sea, rail, road, and off-road transport and depends on petroleum for 95 percent of its energy. Consequently, it produces 23 percent of the energy-based GHGs, with 75 percent of those GHGs coming from road transport. Moreover, GHG emissions from this sector are the fastest-growing of all emissions. It is imperative that society figures out ways to reduce emissions from transport ––especially road transport –– in the near future.
Escalation of Global Transport Emissions
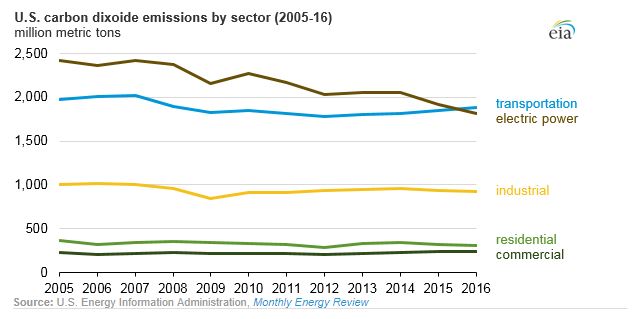
Transportation emissions have historically been the second-biggest sector for most countries (or other geographic scales of measurement), coming in only behind stationary energy sources. But, as the energy sector makes consistent strides in efficiency, these scales are tilting. Look at 2016 in the next image. Transportation emissions overtake emissions from electric power generation.
- Want to read more about this? Check out Yale Environment 360's Transportation Replaces Power in US as Top Source of CO2 Emissions [36] from December 2017.
CO2 emissions from historical and projected energy consumption by the transportation sector in the next image shows a five-fold increase in emissions between 1970 and 2050. Emissions growth from sea transport is relatively small, whereas air and road transport increases are bigger with the highest growth rates projected for air transport. However, despite the higher growth rates, road transport still maintains the vast majority of transportation-related emissions and therefore represents the biggest opportunities for reductions.
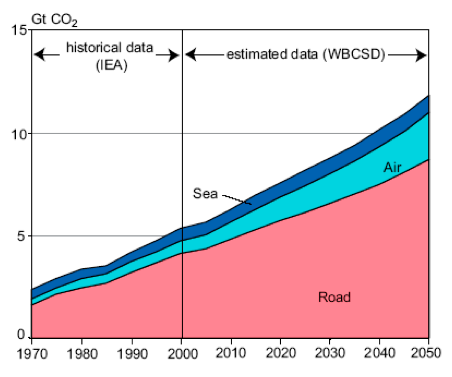
The image is a line chart described in text below. Numbers are approximate
- Road Sector
- Historical data from IEA (1970 - 2000), increase from 1.5 Gt CO2 to 4.5 Gt CO2
- Estimated data from (WBCSD) (2000 - 2050), increase from 4.5 Gt CO2 to 8 Gt CO2
- Air Sector
- Historical data from IEA (1970 - 2000), increase from 1.75 Gt CO2 to 4.75 Gt CO2
- Estimated data from (WBCSD) (2000 - 2050), increase from 4.75 Gt CO2 to 11 Gt CO2
- Sea Sector
- Historical data from IEA (1970 - 2000), increase from 2 Gt CO2 to 5.25 Gt CO2
- Estimated data from (WBCSD) (2000 - 2050), increase from 5.25 Gt CO2 to 12 Gt CO2
The US EIA finds that energy-related CO2 emissions in the transportation sector will remain relatively constant after 2030 because of little change in the carbon intensity of transportation fuels (EIA Annual Energy Outlook 2017 [39]).
- But what about the rapidly developing economies of the world?
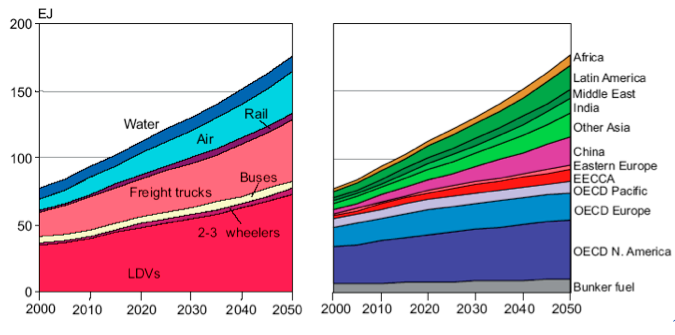
Projections of energy consumption (Figure 5.3) suggest that China will not be alone in its dash to institute private car ownership. Experts project that energy consumed for transport will more than double between 2000 and 2050. The strongest growth is expected to take place in the air, freight trucks, and light-duty vehicles (LDVs), which includes cars, pickup trucks, minivans, and sport utility vehicles (SUVs). That growth will be greatest in the developing countries, especially China, India, other areas of Asia, and Latin America. Note that this projection drastically underestimated the growth in China during the first decade of the millennium.
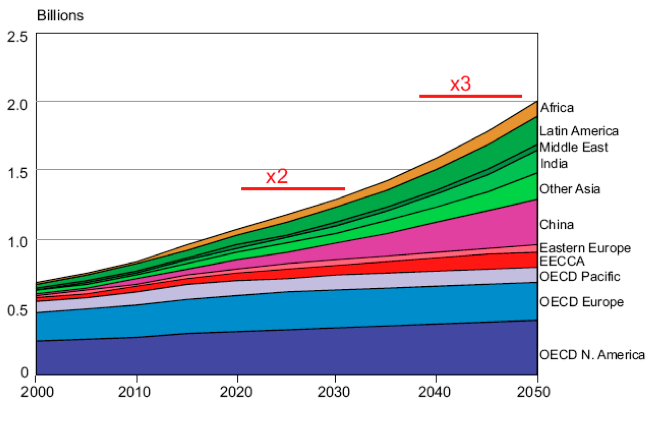
Focusing on LDVs in the next image, projections for the total stock see a doubling of LDVs in the 2020s and tripling of this vehicle type by mid-century. The least growth is projected to take place in developed countries, while robust increases are expected in developing countries. The biggest increases are projected for China, but those increases are happening now, so growth may be slower for that country later in the century.
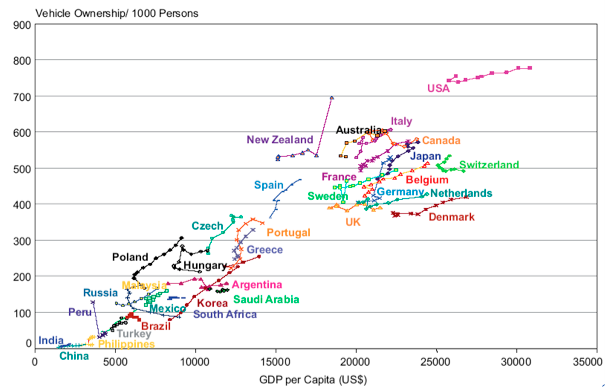
Vehicle ownership is a function of per capita income: as income goes up, rates of car ownership increase (Figure 5.5). The wealthiest major country –– the United States –– has much higher ownership rates than any other nation. Vehicle ownership is still very high among the next richest countries, essentially Canada, western and northern Europe, Japan, Australia, and New Zealand. Next comes southern and eastern Europe and Korea, followed by other developing countries around the world.
The take-home message from this series of graphs is that global energy consumption and GHG emissions from transport are increasing rapidly and are expected to continue grow significantly in the future. The largest subsector responsible for this growth is personal vehicles, which is projected to grow strongly over the coming decades as nations and their people emerge from poverty and are able to afford ownership.
The material for this section comes from Kahn Ribeiro, S., S. Kobayashi, M. Beuthe, J. Gasca, D. Greene, D. S. Lee, Y. Muromachi, P. J. Newton, S. Plotkin, D. Sperling, R. Wit, P. J. Zhou, 2007: Transport and its infrastructure. In Climate Change 2007: Mitigation. Contribution of Working Group III to the Fourth Assessment Report of the Intergovernmental Panel on Climate Change, B. Metz, O.R. Davidson, P.R. Bosch, R. Dave, L.A. Meyer (eds.), Cambridge University Press, Cambridge and New York.
US Transportation Emissions
Given car ownership rates for the U.S., transportation emissions are a major concern in this country. Transportation is responsible for 29 percent of the nation’s emissions as demonstrated in the next image. This sector is the fastest growing, accounting for almost half (48 percent) of the net increase in U.S. emissions since 1990. This rapid growth and sizeable portion of the overall emissions profile also means that there is ample opportunity for reductions.
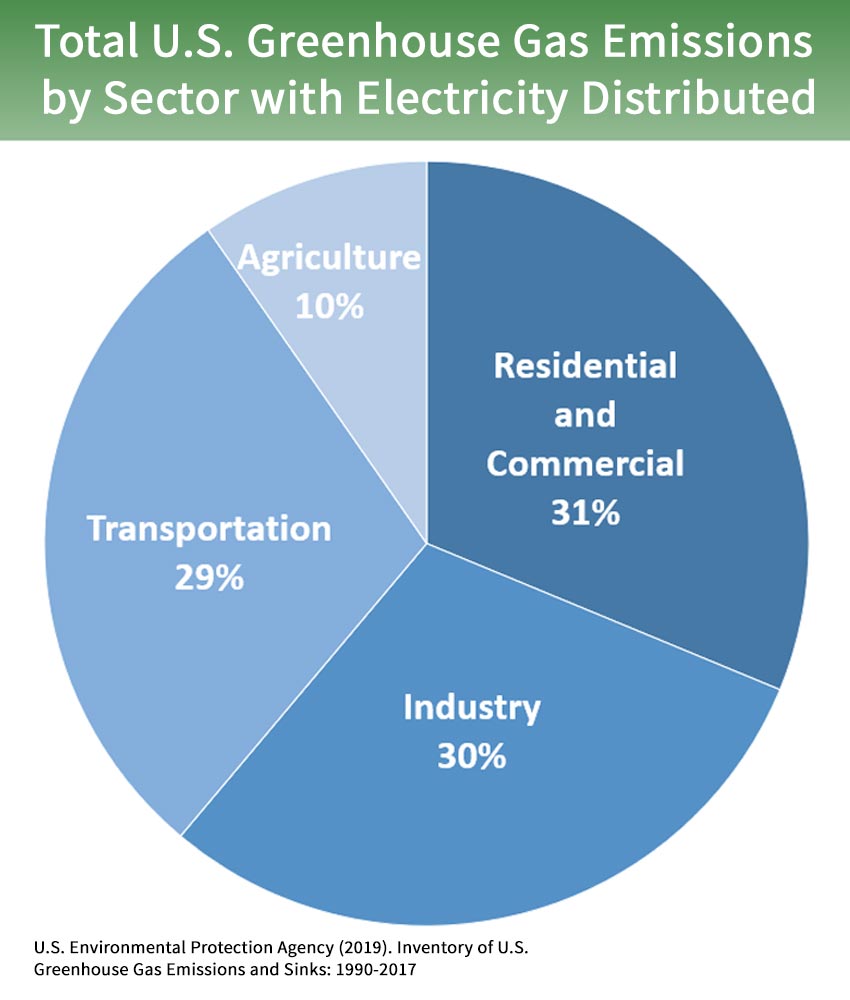
The image is a pie chart described in a table below
| Sector Producing GHG | Percentage |
|---|---|
| Residential and Commercial Electricity | 31% |
| Transportation | 29% |
| Industry | 30% |
| Agriculture | 10% |
Subsectors of Transportation Emissions
Let's break the US transportation sector down in more detail to get a better look at where these emissions originate:
- Light-duty vehicles - those are the passenger cars, trucks, and SUVs we all drive. Want to know more about what that really looks like? Check out EPA's GHG Emissions from a Typical Passenger Vehicle [41].
- Medium and heavy-duty trucks - construction vehicles and tractor-trailers and the sort fall into this category.
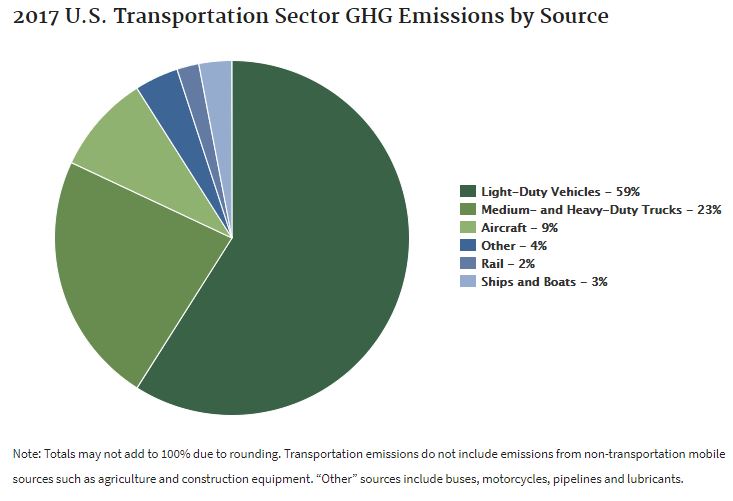
The image is a pie chart described in a four tables below.
| Type of Vehicle | Percentage of total transportation greenhouse emissions |
|---|---|
| Light-Duty Vehicles | 59% |
| Medium- and Heavy-Duty Trucks | 23% |
| Aircraft | 9% |
| Other (buses, motorcycles, pipelines, and lubricants) | 4% |
| Rail | 2% |
| Ships and Boats | 3% |
Global Transportation Emissions
According to the EPA [44], 95% of the world's transportation energy comes from fossil fuels. Ninety five percent! (That's higher than I expected, how about you?) This is predominantly comprised of gasoline and diesel for on-road use.
As global demand for personal transport goes up (World Economic Forum, 2016 [45]), we'll need to think creatively about how to reduce emissions while accommodating an increasingly mobile global population.
How do we handle twice as many cars worldwide in 2040 while also seeking to aggressively reduce global GHG emissions?
Reducing energy intensity and switching to low/no carbon fuel sources are just a few of the ways we might be able to achieve those goals. Check out some of the proposed solutions outlined in Project Drawdown's Transport Sector Summary [46].
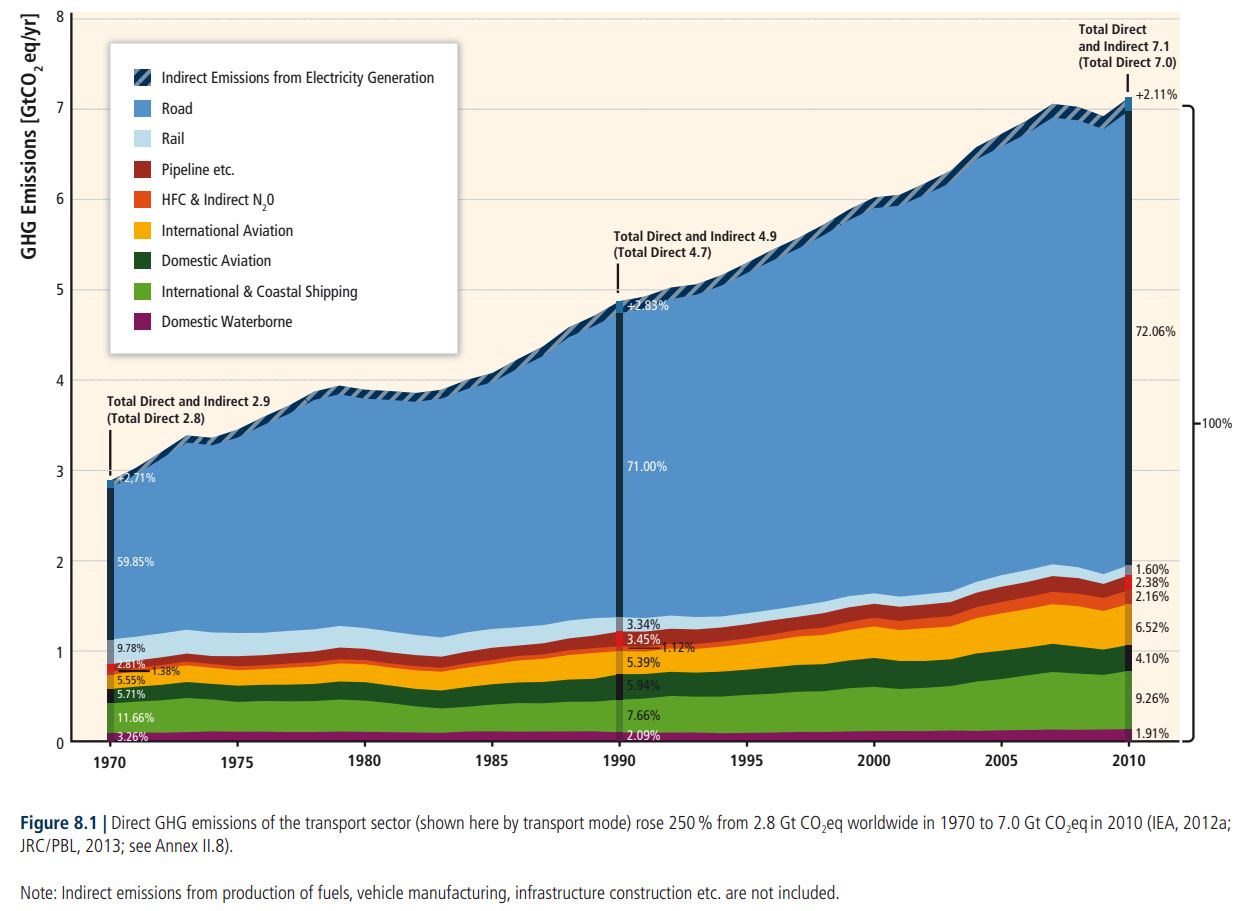
| Year |
Total Direct/Indirect (GTCO2 eq/yr) |
Total Direct (GTCO2 eq/yr) |
|---|---|---|
| 1970 | 2.9 | 2.8 |
| 1990 | 4.9 | 4.7 |
| 2010 | 7.1 | 7.0 |
| Year | Indirect | Road | Rail | Pipeline | HFC & Indirect N20 | International aviation | Domestic Aviation | International and Costal Shipping | Domestic Waterborn |
|---|---|---|---|---|---|---|---|---|---|
| 1970 | 2.71% | 59.85% | 9.78% | 2.81% | 1.38% | 5.55% | 5.71% | 11.66% | 3.26% |
| 1990 | 2.83% | 71.00% | 3.34% | 3.45% | 1.12% | 5.39% | 5.94% | 7.66% | 2.09% |
| 2010 | 2.11% | 72.06% | 1.60% | 2.38% | 2.16% | 6.52% | 4.10% | 9.26% | 1.91% |
The two takeaways from this graph are (1) transportation emissions have more than doubled since 1970 and are expected to continue increasing and (2) the vast majority of those emissions come from on-road sources (light duty vehicles and medium-heavy duty vehicles).
Are Electric Vehicles Really More Environmentally Friendly?
People often wonder, "But is an electric car really a better bet for the climate?" After all, we have to plug them in to charge them, and in many cases that electricity is generated with fossil fuels. And what about hybrid cars? Where do they stack up?
The video below from the Union of Concerned Scientists compares an average passenger car with a traditional internal combustion engine to that of an electric passenger car with an 84 mile range to answer this question. Take a look.
PRESENTER: Here's a question. How much cleaner are battery-electric cars compared to gasoline-powered cars? To find out, the Union of Concerned Scientists studied the total global warming emissions of each vehicle throughout every stage of its life, from manufacturing to driving to disposal. And there's a big difference.
Both cars start out on the assembly line with similar parts made of raw materials like steel and aluminum. For a gasoline car, this manufacturing and assembling stage generates about 7 tons of emissions. Battery-electric cars, meanwhile, are powered by-- you guessed it-- a large battery. This requires more energy and materials to produce for an 84-mile range battery-electric car, bringing its emissions tally up to roughly 8 tons.
But what happens when they hit the road? Gas-powered cars produced pollution with every gallon of gas they burn with even more emissions coming from extracting, refining, and transporting the fuel to gas stations. Electric cars, on the other hand, run on electricity, which can be much cleaner than gasoline depending on how the electricity is made.
2/3 of Americans live in regions where charging an electric car produces fewer global warming emissions than driving even a 50-mile per gallon gasoline car. By the end of their lives, the average gas car will rack up 57 tons of global warming emissions compared to 28 tons for a battery-electric car.
Disposing and recycling each car adds less than 1 ton of emissions. And remember that electric car battery? It can be recycled or reused. In the final tally, an 84-mile range battery-electric car cuts global warming emissions by more than 50% compared with a similar sized gas-powered car, making up for the batteries manufacturing emissions within one year of driving.
And as the country adds more and more renewable sources of electricity, driving electric will get even better. So there you have it straight from the engineers at the Union of Concerned Scientists. Electric cars-- clean and getting cleaner.
For more analysis of the charging emissions from electric vehicles, check out:
- Charging an Electric Vehicle is Far Cleaner Than Driving on Gasoline Everywhere in America [48] (Silvio Marcacci, 2018)
- Climate Explained: The Environmental Footprint of Electric Versus Fossil Cars [49] (Hasan and Chapman, 2019) - this is a nice summary broken down by phase - manufacturing, use, and recycling
The Department of Energy offers this handy tool [50]for consumers who want to understand the relative emissions if they buy (and charge) an EV where they live based on the fuel sources for electricity in their state.
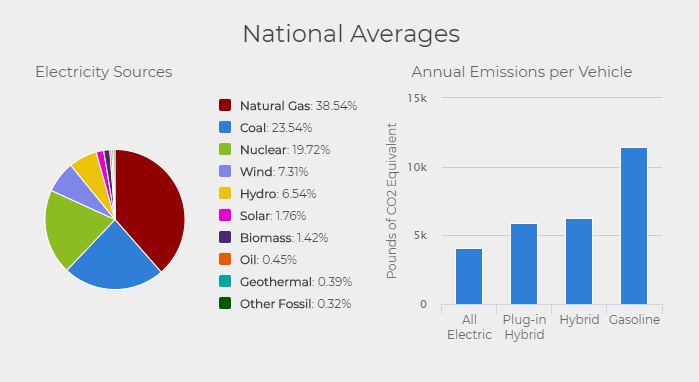
| Source | Percentage |
|---|---|
| Natural Gas | 38.54 |
| Coal | 23.54 |
| Nuclear | 19.72 |
| Wind | 7.31 |
| Hydro | 6.54 |
| Solar | 1.72 |
| Biomass | 1.42 |
| Oil | 0.45 |
| Geothermal | 0.39 |
| Other Fossil Fuels | 0.32 |
| Type | Thousands of Pounds of CO2 Equivalent |
|---|---|
| All electric | 4 |
| Plug-in hybrid | 6 |
| Hybrid | 7 |
| Gasoline | 12 |
Agriculture
When we talk about agricultural emissions, that can mean a lot of different things as these emissions are dependent on the type of activities occurring on a farm. For our purposes for this lesson, we'll look broadly at emissions from crop production and livestock production.
It can be tricky to understand the overall role agriculture plays in global emissions because of how some of these smaller sectors are grouped together sometimes. To take a closer look, we're going to take these pieces of pie and slice them even thinner.
The graphic below demonstrates that agriculture, land use, and forestry (often called AFOLU [52]) account for about a quarter of global greenhouse gas emissions.
- Of that quarter, about half of those emissions come from agriculture (most estimates are between 9-14%).
- If we keep drilling down, of that half of the quarter of global emissions (are you still with me, hang on!), more than half come from enteric fermentation, manure management, and fertilizer use.
We'll focus our attention this week on these bigger subsector areas. And then, to keep things fun, I've included food waste in this section too. It's not technically categorized as an agricultural emissions source here, but I think in the context of our thinking about where emissions are coming from and what we can do about them, it makes sense to talk about it here (and, we're also covering waste this week - so it fits nicely with that, too).
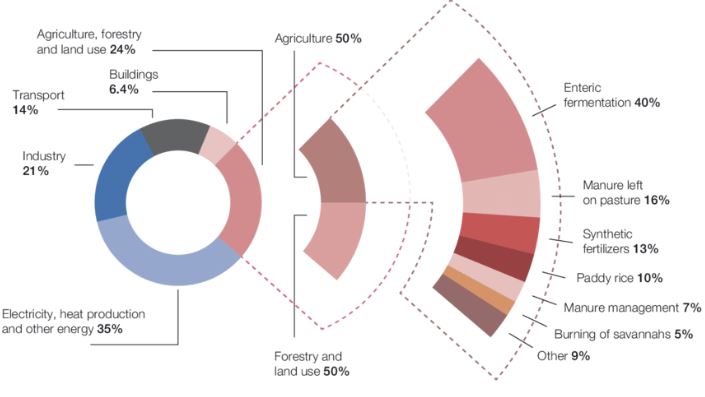
| Source | Percentage |
|---|---|
| Electricity, heat production, and other energy | 35% |
| Industry | 21% |
| Transport | 14% |
| Buildings | 6.4% |
| Agriculture | 12% |
| Forestry and Land Use | 12% |
| Source | Percentage |
|---|---|
| Enteric Fermentation | 40% |
| Manure Left on Pasture | 16% |
| Synthetic Fertilizers | 13% |
| Paddy Rice | 10% |
| Manure Management | 7% |
| Burning of savannahs | 5% |
| Other | 9% |
In the following video, Penn State Professor (and METEO 469 course author) Michael Mann discusses the systemic changes we need - primarily in agriculture but also in other contexts of our emissions behaviors (remember proximate causes and driving forces?). He talks about the need for both individual and collective action and how those efforts work together. (This video is required course content and fair game for the content quiz/exam 1.)
Christiane Amanpour: Welcome to the program, Michael Mann.
Michael Mann: Thanks, Christiane. It’s good to be with you.
Christiane Amanpour: So, I just want to pick up a little bit from where correspondent Bill Weir left off. Because he actually showed us some very hopeful innovation and hopeful farming methods that are already taking place. Let’s just talk about how that one farmer talked about being able to plant his land, allowing it to become a constant carbon sink, and you know, to be able to really even feed vast amounts of people. Tell us what good and what’s right about those sorts of farming methods right now.
Michael Mann: Sure, so the bad news, of course, is that our farming methods: agriculture, land use, deforestation are contributing substantially to the climate crisis as this report lays bare. But, at the same time, the good news is that there is ample room for mitigation. There are things that we can do to lower those carbon emissions from the agricultural sector, from the livestock and food production. Among those, as we’ve heard, is more careful methods of planting and agriculture, no-till agriculture, growing potentially different cultivars, feeding livestock different food. Different food sources can actually lower carbon emissions, methane emissions, for example, from cows and ruminants, so there is a lot of room to decrease those carbon emissions, which collectively are a little less than 25 percent. That means that this isn’t the bulk of the problem. The bulk of the problem remains our burning of fossil fuels for energy and transportation. But this is a significant piece of the pie. We need to focus on it, and there is ample opportunity for reducing those carbon emissions in a very win-win sense. Limiting deforestation, more productive agricultural methods that will feed more people can also help us sequester carbon so it doesn’t build up so quickly in the atmosphere.
Christiane Amanpour: So then tell me because you have contributed to other IPCC reports. Tell me what the significance is, in your view, of this latest report. We know that the first one which came out warned that we had until 2030 to get our act together as a world, to meet that 1.52-degree critical temperature rise. What is this one telling us, specifically?
Michael Mann: Yes, so these interim reports, this special report, for example, on land, that occurs between the major IPCC reports like the one that was published last year are important because they focus on specific topics which are of vital importance. In this case, this report focuses on land. That’s where seven and half-billion and growing people live. It’s where we live, and climate change is already having adverse impacts on that land. It is, for example, leading to a loss of coastal land because of sea-level rise and more devastating tropical storms that are inundating our coastlines. Because of the warming of the planet, a large part of the tropics is starting to become unliveably hot. And we have seen rampant wildfires in Eurasia, in the US, that, of course, are a threat to our infrastructure. So, we have these problems, these growing problems, associated with climate change, that threaten the amount of land that we have, at a time when we have a growing global population, again, of 7 and a half billion and growing, and, as we’ve already alluded to, the warming is having an impact, for example, on our ability to raise crops and livestock, and feed that 7 and a half billion and growing people. All of these things are intertwined; all of these challenges are intertwined.
Christiane Amanpour: Can I just ask you then. Again, let’s just go back to the farmer in Iowa who talked about how you don’t really even need more retraining like maybe other sectors of the economy might. You can make these and implement these changes without a massive overhaul. But, a lot of the overhaul that is necessary, according to the report, does require a lot of government resource, and a lot of, I mean, re-education, and making an awareness-raising of how you change your habits, the use of machinery, the intensity of the farming, etc., and just the wilding that the farmer was talking about. Tell us the challenges to the overhaul of the land production and use.
Michael Mann. Yeah, this gets at the heart of the problem, which is that is that any real solution, any comprehensive solution to the climate crisis is going to have to involve both individual behavior and collective and systemic change. There are many things that individuals, that we can do in our everyday lives, including changing our dietary patterns, changing our diets, that can lower our own personal carbon footprint. And in many cases, that makes us healthier, it saves us money, it makes us feel better. So, this is low-hanging fruit. These are things that we ought to do. But, at the same time, we need incentives, governmental incentives, policies, for example, to help shift us away from our reliance on fossil fuels to renewable energy. And that can take the form of a price on carbon, or explicit subsidies for renewable energy. That’s critical, because, again, the burning of fossil fuels is more than 2/3 of the problem. But we can also have policies that help farmers and help the agricultural industry adopt practices that are more carbon-friendly, that help us draw down that carbon from the atmosphere, which is an important part of the solution, while actually increasing agricultural productivity. We can’t do that without governmental incentives that sort of point us in the right direction, that shift the collective behavior the right direction. And, how do we achieve those policies? Well, we have to make sure that we elect politicians who will vote in our interest, who will act in our interest, rather than on the part of polluting interests who too often fund their campaigns, and have them in their hip pockets.
Christiane Amanpour: So, my thought in that regard. The farmer at the very end of Bill Weir’s report was quite poignant. Because on the one hand, you know, he didn’t want to talk about the politics. He didn’t want to admit or recognize that human(s) have an involvement in climate. He’s talking about deregulation. But then he says, “But look, you know, we’re doing the right thing and it’s important that we do the right thing. It helps.” And so, he’s kind of conflicted between, what’s the right way to farm, what is the right way to look at his land, and, what are the right politics around it? So, let’s just talk, because this report does focus mostly on land, and not so much on the fossil fuels that we’ve all heard of so much already. The whole business of consumption. So, the farmers will say, “Well, ok. Fine. You tell us to plant more whole foods, more grains, plant-based food. Cut back on our cattle. Cut back on the sheep. But, what if demand doesn’t change.” And let’s just remind people what demand is about. According to IPCC, food-calories per capita has increased by 1/3. Changes in consumption patterns contribute to 2 billion overweight adults. An estimated 821 million people are still undernourished, though. 25 to 30 percent of total food produced is lost or wasted. So, there are a lot of changes that need to be made. Not just going more into plant-based and whole foods.
Michael Mann: No. That’s absolutely right and, again, gets back to the heart of the matter. There are obviously things that we can do in our everyday lives. Being less wasteful of food, and in eating food that is less harmful to the environment, that is less carbon-intensive. And shifting away from meat is an important way of doing that, if it fits, you know, within the constraints of your lifestyle. That having been said, once again, we need incentives, educational efforts, government-funded and supported outreach in the form of public service announcements and programs, to inform people about the choices they make and how they can make healthier choices. And we come up once again against some pretty entrenched interests, for example, the fast-food industry. Of course, there are other challenges when it comes to our efforts to sort of transition to healthier diets, less, again, meat -and fat-intensive diets. That’s part of the problem, but to achieve that, we need changes. We need shifts in human behavior, and those shifts won’t happen on their own. They do require coordinated efforts, through educational programs by governmental and non-governmental entities.
Christiane Amanpour: Do you - before I want to play a little clip of an interview I had with Director James Cameron and his wife Susie, and they’ve come up with a book called OMD, essentially one meal a day, and it’s about being plant-based. But before I do that, I want to ask you. Is there a comparable shift in human behavior and habits that have occurred in the past with government help and public service announcements and all the rest of it – that has worked? Because that’s what everybody says. I mean, how are we going to shift human behavior in such a dramatic way?
Michael Mann: Yeah, well, we have seen efforts of this sort succeed in the past. When it comes to global, environmental problems like ozone depletion and acid rain. Ultimately, these problems arose from practices that do occur at the individual scale. In the case of ozone depletion, it was spray cans and old leaky refrigerators — refrigerators that used chlorofluorocarbons or freons, these chemicals that ultimately get into the stratosphere and destroy it. So it was individual behavior that was putting those chemicals into the atmosphere. And yet, what we saw was that a market-oriented program to place incentives that move the industry away from using those ozone-depleting chemicals ultimately did lead to the solution of the problem. We’ve seen massive recovery now of the ozone hole around Antarctica, because of those systemic changes that ultimately simply provided better choices to individuals and consumers, choices that don’t damage the planet.
Christiane Amanpour: I think that is really an optimistic and important reminder, that actually these things can work and can work in a way that is not just beneficial to the planet, but beneficial to individuals as well. It doesn’t cost them much. Here is what, though, on the planet and food and land issue that we are talking about particularly with this report, Director James Cameron and his wife told me a while ago.
Susie Cameron: What you’re putting on your plate actually makes a huge difference, towards not only climate change, but your health as well.
Director James Cameron: Um-hmm!
Interviewer: And, I guess….
Director James Cameron: And, the health of the planet. I …
Interviewer: Yeah. Go ahead…
Director James Cameron: Just the health of the planet. I mean, the quickest and easiest way for an individual to be, to feel empowered and to make a difference and to be able to look at their face in the mirror in the morning, and think: I’m making a difference, I’m doing something positive, not just for myself, my own health and my family’s health, but for the health of the planet, is to change how we eat.
Christiane Amanpour: So again, how does one shift populations? But you sort of indicated. Interestingly, in the report that we heard from Bill Weir, the farmers say, that the harsher the climate gets, the worse it is for them and for their land, and for their ability to make it economically. So, just wondering. We’ve had the hottest July on record here in Europe. You’ve got wildfires, a massive, massive amount, in Siberia. Even President Putin is talking about having to direct the state towards figuring out what to do. But of course, their economy kind of depends on fossil fuels. And so, I guess, how long do you think we have? And how? … You know, the ship of state, it says, is so difficult to turn around. How much effort and time is it going to take to just deal with the land issue?
Michael Mann: Yeah, and it’s important to realize that while there are economies that still rely on fossil fuels, the health of the planet relies on us getting off fossil fuels. And that’s of course, of far greater importance. We won’t have an economy to talk about if we don’t have a livable planet. So, you know, James Cameron makes some important points here. There is agency. There are things we can do in our everyday lives that do help solve this problem. And, by the way, they put us on a path. As we engage in these actions, we become more invested in solving this problem and more likely to participate in collective efforts, putting pressure on policy-makers, doing all those other things we can do to make sure that there is the systemic change that we need, that moves us away from fossil fuels, that moves us away from a carbon-intensive food system. There are all of these things we can do in our everyday lives, and changing your diet is one of the simplest things to do. I have chosen to not eat meat for a number of reasons, and I feel good about that choice. I feel healthier for having made that choice. But I don’t want to mandate other people’s choices. What I want to do is to provide them with the information necessary for them to make informed choices about their own individual actions, and more importantly to get them on that path of engagement, where they participate in the broader, collective action necessary for this dramatic systemic change that we need. By the way, as you allude to, over really just a decade, we need to bring those carbon emissions down by a factor of 50% and then down to near zero – 50% by 2030 and near 0 by 2050 if we are to avert the most catastrophic impacts of climate change.
Christiane Amanpour: OK
Michael Mann: But the good news there: the preliminary numbers are in for 2019. Obviously, 2019 isn’t finished yet, and there are lots of things that can happen. But based on the preliminary numbers, we’re seeing a significant drop of more than a percent in carbon emissions this year.
Christiane Amanpour: Wow!
Michael Mann: Another hint that maybe we’re starting to bend that curve downward, and we need to bend it down rapidly. But the first step is to bring those emissions to a plateau and start that decline…
Christiane Amanpour: That’s great!
Michael Mann: …towards 2030 and 2050 where we need to be.
Christiane Amanpour: That is very, very good news. And particularly what you say, Individuals can make a difference. And we’re obviously seeing it amongst young people, who put this issue of climate and environment at the very top of their political agenda. Michael Mann. Thank you very much indeed.
Crop Emissions
While we spend a lot of effort thinking about the role of livestock production as agricultural emissions, crop production also plays a significant role in several ways.
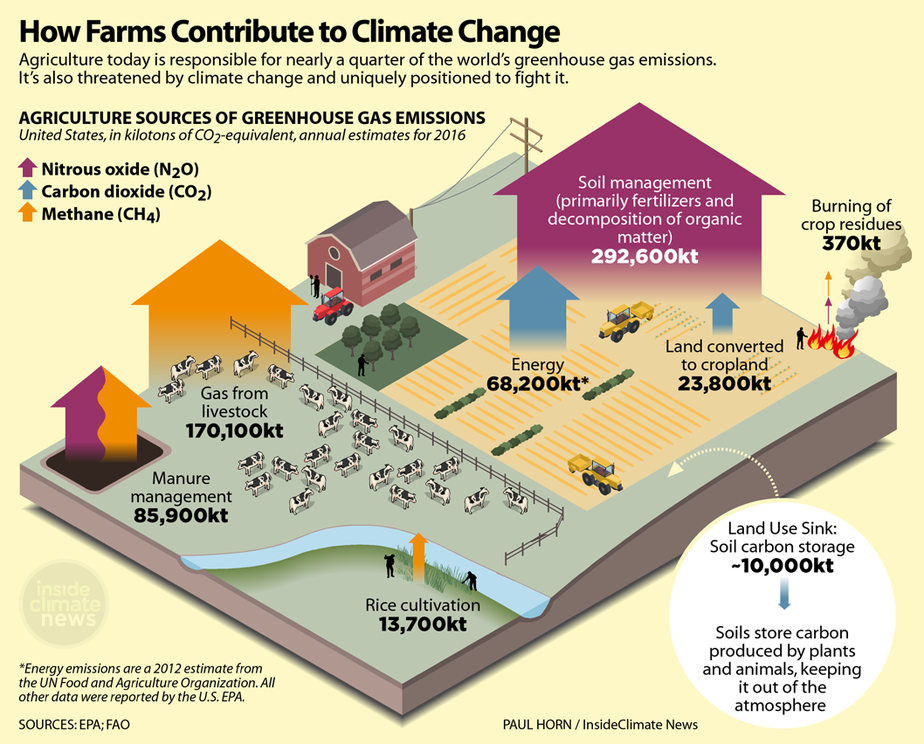
Image Reads: How Farms Contribute to Climate Change
Agriculture today is responsible for nearly a quarter of the world’s greenhouse gas emissions. It’s also threatened by climate change and is uniquely positioned to fight it.
Agriculture Sources of Greenhouse Gas Emissions: US, in kilotons of CO2-equivalent, annual estimates for 2016
Manure Management: Methane and Nitrous Oxide – 85,900kt
Gas from livestock: Methane – 170,100kt
Rice Cultivation: Methane – 13,700kt
Energy: Carbon Dioxide – 68,200kt
Land Converted to Cropland: Carbon Dioxide – 23,800kt
Burning of crop residue: Nitrous oxide and methane – 370kt
Soil Management (primarily fertilizers and decomposition of organic matter): Nitrous Oxide – 292,600kt
Land Use Sink: Soil Carbon ~-10,000kt. Soils store carbon produced by plants and animals, keeping it out of the atmosphere!
- conversion of land to cropland - changing land uses alter that area's ability to sequester carbon. Forests in the US are sequestering about 13% of our annual greenhouse gas emissions (USDA, n.d. [56]). Cropland isn't nearly as productive for sequestration.
- fertilizer use - nitrogen-based fertilizer leads to increases in nitrous oxide emissions (UC Berkeley, 2012 [58]). Nitrous oxide's global warming potential is roughly 265-298 times that of carbon dioxide - yikes! (EPA, n.d. [59]).
- energy use in crop production - it takes energy to grow our food - take a look at this chart. If we were in class together, before I showed you this chart, I'd ask for a show of hands - Who thinks it takes more energy to raise livestock? Ok, who thinks it takes more energy to raise crops? I'm guessing most of you would have raised your hand for livestock (and I might have been included in that group myself!). But it turns out, the direct energy consumption for raising crops is more. But, if you go to the EIA discussion of this graph, you'll see that they caveat it that this livestock number does not include the energy it takes to grow livestock feed - that's an indirect energy use not captured here. This is a good example of why it's always important to make sure you understand the data you're looking at.
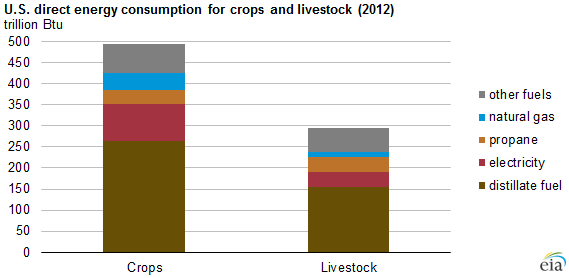
| Energy Source | Trillion Btu's for Crops | Trillion BTU's for LiveStock |
|---|---|---|
| Distillate Fuel | 265 | 155 |
| Electricity | 85 | 40 |
| Propane | 32 | 32 |
| Natural Gas | 40 | 12 |
| Other Fuels | 60 | 55 |
Livestock Emissions
The livestock we raise for meat and dairy consumption has a sizable impact on the global emissions profile.

Sometimes, the popular media likes to capitalize on the sensational nature of talking about cow burps and farts and greenhouse gas emissions (see Forbes article [63] for proof). And maybe this isn't all bad if it gets people talking (and possibly giggling) about the role our diet plays in the global climate crisis. (Did the instructor really use the word 'farts' in class? I think so...). And while that's certainly part of the puzzle, livestock-related emissions are much more complex and varied. We're going to take a look at several broad categories (as outlined by the Food and Agriculture Organization of the United Nations).

| Type | Percentage |
|---|---|
| Enteric, CH4 | 39.1 |
| Applied & Deposited manure, N2O | 16.4 |
| Feed, CO2 | 13.0 |
| Fertilizer & Crop Residues, N2O | 7.7 |
| LUC: pasture expansion, CO2 | 6.0 |
| Manure Management, N2O | 5.2 |
| Manure management, CH4 | 4.3 |
| LUC: soybean, CO2 | 3.2 |
| Postfarm CO2 | 2.9 |
| Direct Energy, CO2 | 1.5 |
| Feed: rice, CH4 | 0.4 |
| Indirect Energy CO2 | 0.3 |
The emissions profile for livestock production varies by species. For example, if you look at this graphic below, you'll notice that almost all of the emissions associated with beef production come from enteric fermentation (the often satirized burps and farts, if you will), while chickens - not ruminant animals like cows - have no emissions from enteric fermentation and instead, their emissions are coming exclusively from manure management.
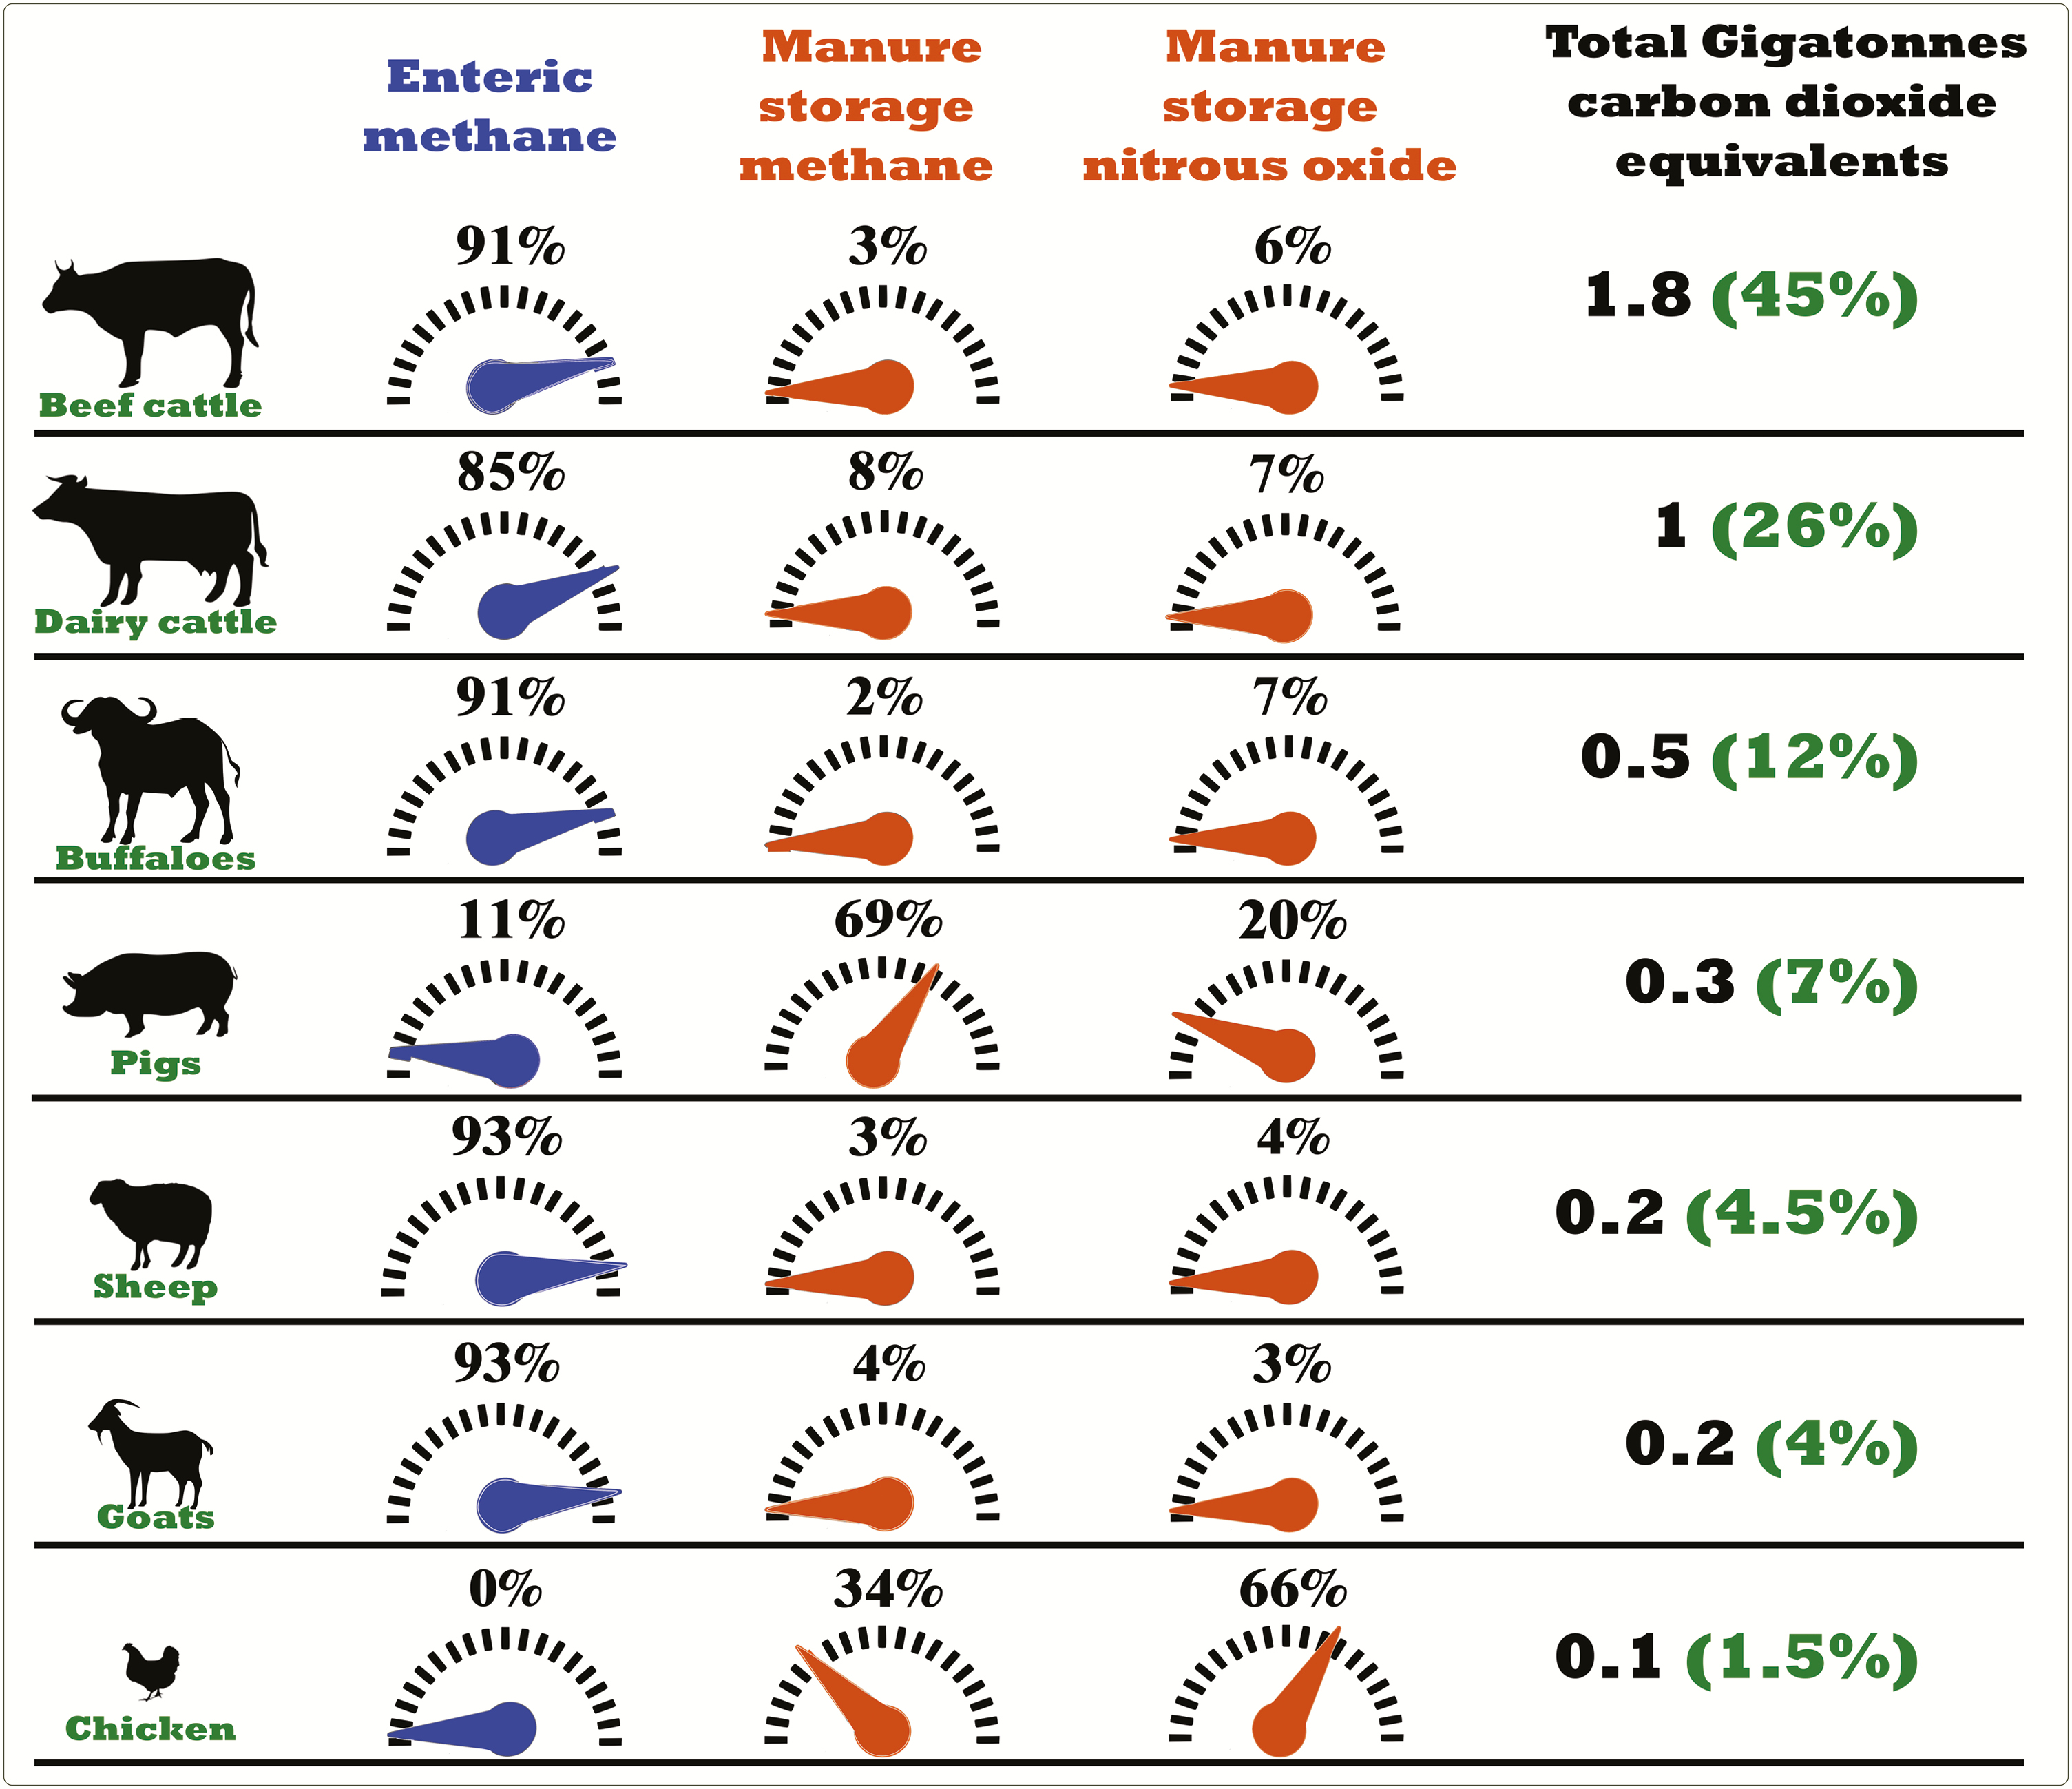
| Animal | Enteric Methane | Manure Storage Methane | Manure Storage Nitrous Oxide | Total Gigatonnes cO2 equivalents |
|---|---|---|---|---|
| Beef Cattle | 91% | 3% | 6% | 1.8 (45%) |
| Dairy Cattle | 85% | 8% | 7% | 1 (26%) |
| Buffalos | 91% | 2% | 7% | .5 (12%) |
| Pigs | 11% | 69% | 20% | 0.3 (7%) |
| Sheeps | 93% | 3% | 4% | 0.2 (4.5%) |
| Goats | 93% | 4% | 3% | 0.2 (4%) |
| Chickens | 0% | 34% | 66% | 0.1 (1.5%) |
Before returning to Penn State to teach in the ESP Program, I worked as a Policy Analyst and Account Manager for a greenhouse gas offset project developer called Environmental Credit Corp. (now ClimeCo). Most of the offset projects we developed were related to manure management on hog and dairy farms. So, while all this chatter about manure this week may seem a bit unconventional or even gross to you, I guess I'm just used to knowing more about animal poop than I ever imagined I might! I thought I'd share a little bit of that experience with you here, as it relates to reducing greenhouse gas emissions from manure management practices on large-scale farming operations.
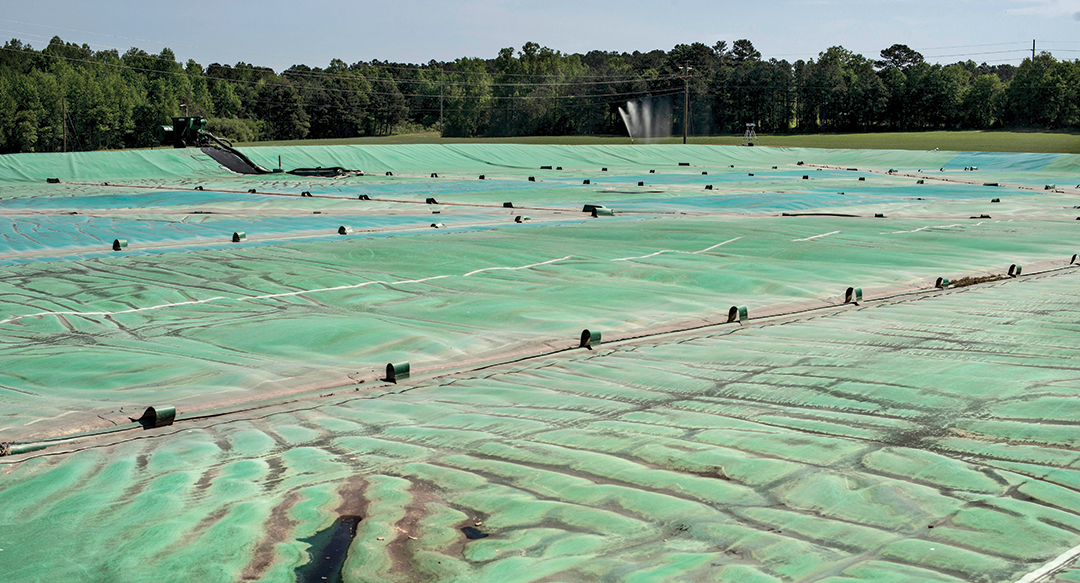
Many dairy and hog farmers use 'manure lagoons' for long-term storage of their manure. To put this bluntly, if you have a thousand (or in many cases way more than a thousand) anythings going to the bathroom every day, you need to figure out where all of that waste is going to go. For many farmers, manure lagoons offer a cost-effective and logical solution. They pump the manure into lagoons (they look like ponds, only you don't want to swim there!) and then several times a year, draw the manure out and land apply it to their fields as fertilizer. But, for the time, it's just sitting there, the manure is decomposing aerobically (with oxygen) and releasing methane directly into the atmosphere (and stinking up the neighborhood). The company I worked for partnered with USDA to offer farmers a simple alternative - covers for their manure lagoons. In the most simplistic of terms, we put tarps over these big ponds to capture the gas. In reality, it's a bit more complicated than that, and under those tarps (which are really 60 mm thick high density plastic), is a series of pipes to collect the gas. Now, the manure is decomposing anaerobically (because we took away the oxygen) and we can capture that gas.
What would we do with a bunch of captured methane? Well, there are a few options. The first, and less ideal option is simply to flare it. When it combusts, it combusts as carbon dioxide. So, there's still a greenhouse gas emission which occurs, but remember, its global warming potential is so much less than methane, there is a benefit to this. But it seems wasteful to just flare it when we can use it.
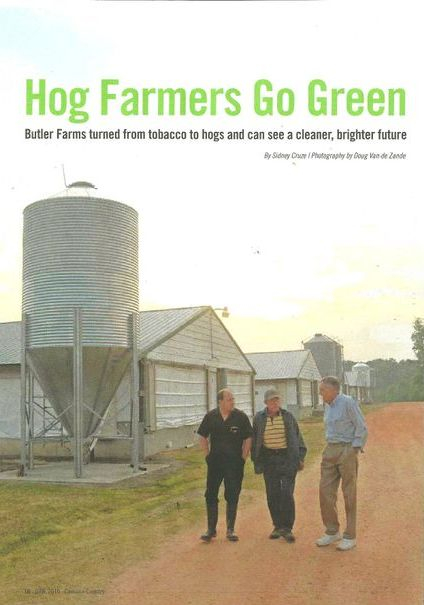
I'd like you to 'meet' Tom Butler. Tom was one of my favorite clients. He's a hog farmer in Lillington, NC and runs an 8,000 head feeder to finish operation. We covered Tom's manure lagoons in 2006 or thereabouts. Initially, we just flared the gas. But over the years, Tom has built a renewable energy empire on that hog farm, and he's now using all of his gas on-site to power his farm. How neat is that? And, lagoon covers offer some ancillary benefits worth noting, too. Think about Hurricane Dorian - do you want a hurricane's worth of rain dumping into a manure lagoon and possibly causing it to run over? No, you do not. With a covered lagoon, Tom doesn't have to worry about (increasingly more frequent) extreme weather events. Also, covered lagoons drastically reduce odor issues. I'll admit, I was nervous the first time I pulled up to Tom's farm. My husband had lived in North Carolina and assured me there was no smell quite like a hog farm. But, it actually was pretty tolerable.
Tom's a great example of a progressive farmer who is trying his best to do right by land, his animals, and the planet, and I thought it'd be nice to share this story with you, even if it is mostly about manure.
I couldn't dig up the picture, but I have a picture of me standing out on this lagoon. It's like standing on a water bed, only that's not water underneath the cover. Joking aside, Tom's crew and ours had to manage the cover very carefully - methane is highly combustible (obviously) and dangerous to work around. The life expectancy on a cover like this is 20-30 years, so Tom's still has a fair bit of life in it, and I'm excited to see what he'll do next. For perspective, this lagoon is over an acre in size.
Food Waste Emissions
We're choosing to look at emissions from food waste within the context of agriculture this lesson (though waste is also covered in Lesson 3), but ultimately, this is one that's hard to really pinpoint to a specific sector because it touches so many sectors. From land use, livestock, transportation, energy, and water - anytime we throw away food, we're throwing away all the embodied emissions in its production, harvest, processing, and transport to reach us. We could talk about food waste at very specific scales, but for our purposes in this lesson, we're going to think about food waste a bit more generally. It could be occurring during production, on its way to the grocery store, at the retail outlets, or in our own refrigerators (insert hand-raising emoji).
We don't hear much about food waste in the context of climate change, but it's really a sleeping giant. Take a look.
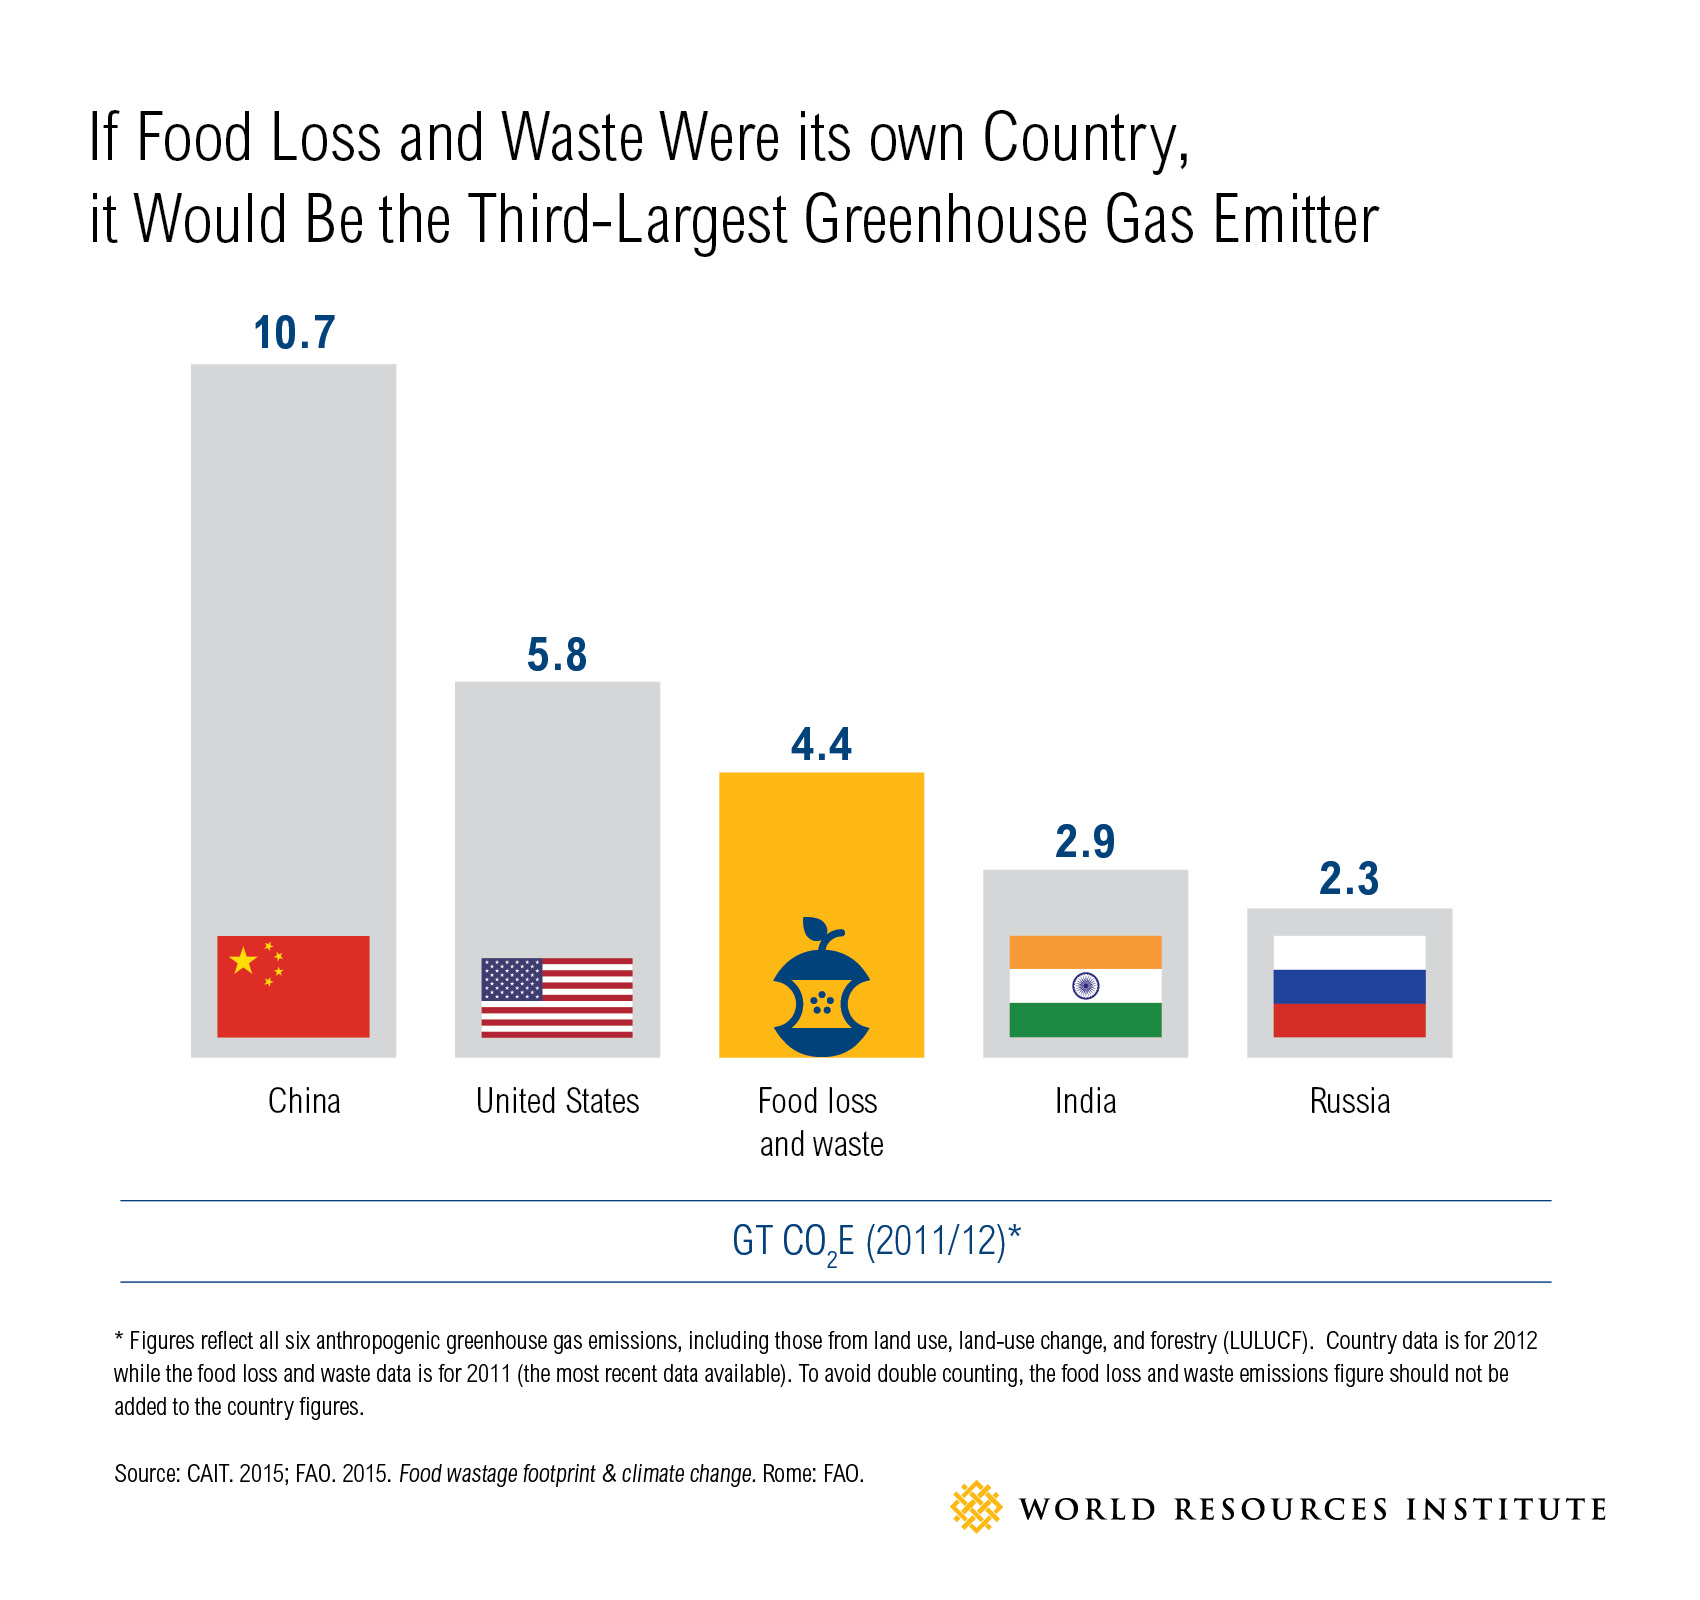
Land Use
Land use and land cover change affect our overall greenhouse gas emissions profile because some types of land use do a great job of pulling carbon out of the atmosphere and storing it away while other types of land use have just the opposite effect. Understanding how are decisions related to land use fit into the overall emissions profile helps us make informed decisions.
Just how big of a factor is land use? Let's take a look.
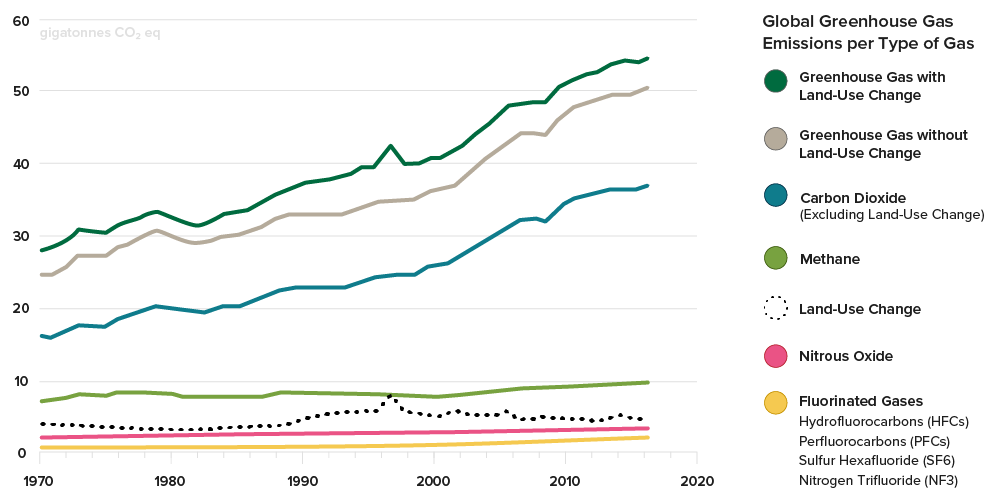
As the FA 2019 semester began, fires raged (and continue to rage) across the Amazon. While this problem is inherently complicated and tangled up in the politics of the region, it's also one highly relevant to the human dimensions of climate change. Obviously, fires burn more in dry seasons. This region isn't particularly dry right now (compared to recent years at the same time) and yet more fires are burning. This is due at least in part to intentionally set fires to clear the land for agriculture. As we're learning in this lesson, agricultural land isn't as effective at sequestering carbon, and of course agriculture carries with it its own set of emissions. Additionally, the Amazon rainforest is one of the most biodiverse regions in the world, and while that might not feel directly connected to climate change. It's often the case that we see the human dimensions of climate change in the news throughout the course of our semester together, so I thought it was worth talking a bit specifically about the wildfires in the Amazon burning right now and how that relates to our changing climate (both cause and consequence). Here are some useful resources about the situation if you're interested (though they are not required reading for the course):
- Media Reaction: Amazon Fires and Climate Change [70] (Carbon Brief, August 27, 2019)
- How Amazon Forest Loss May Affect Water - and Climate - Far Away [71] (National Geographic, August 27, 2019)
- Amazon Fires Could Accelerate Global Warming and Cause Lasting Harm to a Cradle of Biodiversity [72] (The Washington Post, August 22, 2019)
During the FA 2020 semester, we had several students enrolled in the course impacted by the fires burning across the western US.
Waste - there is no 'away' when we throw things away
Let's take a quick look at the emissions from our waste sector. Generally, we can break these down into four categories for direct emissions from waste:
- municipal landfills (81.9%)
- solid waste combustion (8.7%)
- industrial landfills (7.7%)
- wastewater treatment (1.8%)
Remember, these are just direct emissions from waste - so what you don't see captured here are the emissions from hauling waste to landfills, or collecting it from your front yard or the dumpster behind your apartment. Those are indirect emissions.
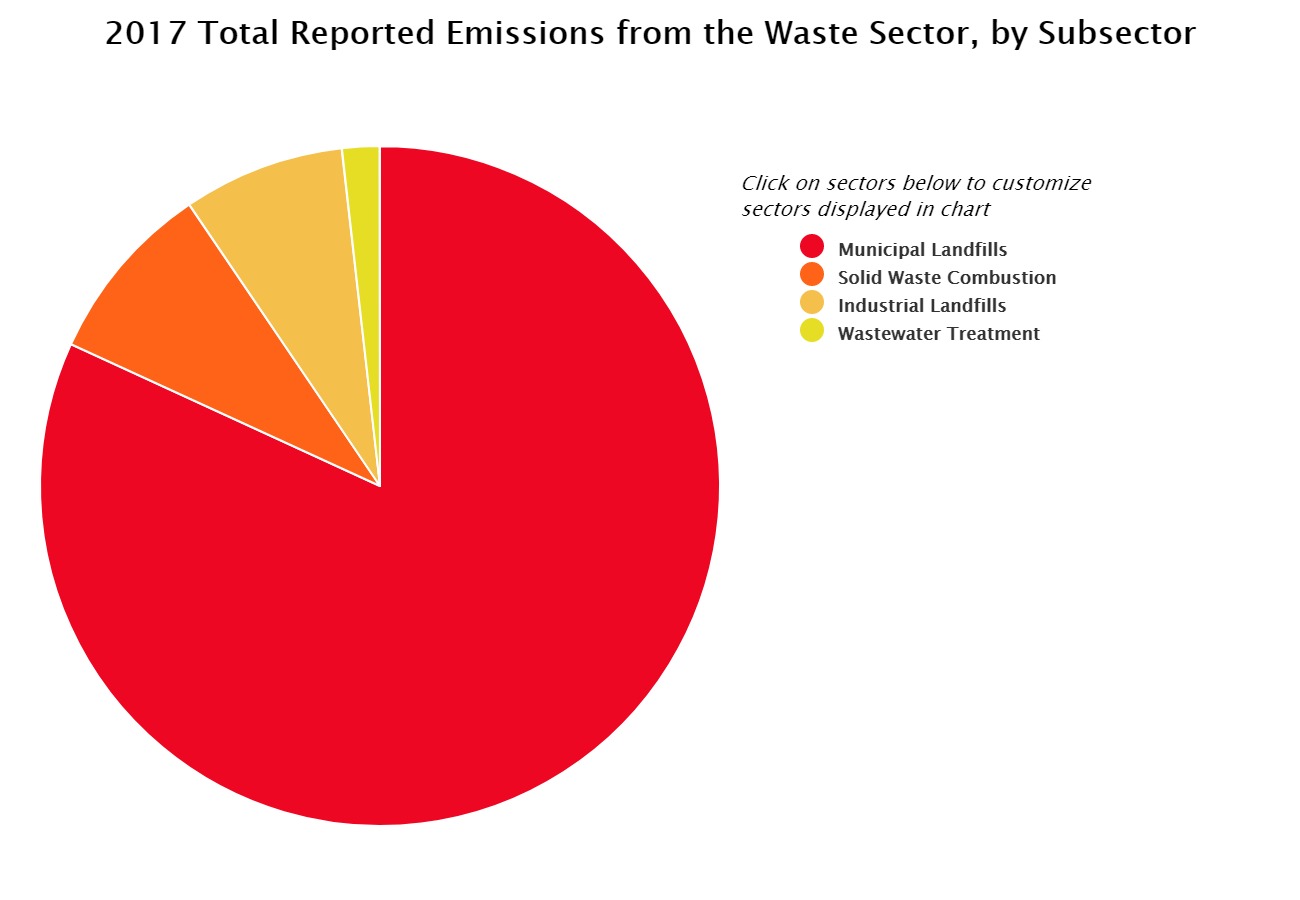
Since municipal landfills represent such an enormous piece of the waste sector pie, let's focus on what that looks like (so we can start thinking about what we might be able to do about it).
When we send our trash to the landfill, there's a fair bit of organic matter in the mix - things like food waste and yard waste. This organic matter will decompose anaerobically and release methane. Much like the lagoon covers we just talked about earlier in this lesson, there are a few options for what we can do to minimize those emissions. We can flare the gas, or the landfill can harness the gas and either use it on site or sell it back to the grid. But beyond that, we can work do divert that organic matter from ever reaching the landfill in the first place. Composting food waste and yard waste is a great place to start! Does your community offer organic waste collection or dropoff? You should check it out! Perhaps you can put your organics out for collection so even if you're not an aspiring backyard composter (I'm not), you can help keep it out of the landfill.
Take a close look at the biggest culprit of methane emissions from landfills on this bar graph from the Methane Landfill Initiative. This is 2010 data, so perhaps China is catching up to the US a bit, but for this snapshot in time, landfill emissions in the US were almost 3x that of the next closest country.
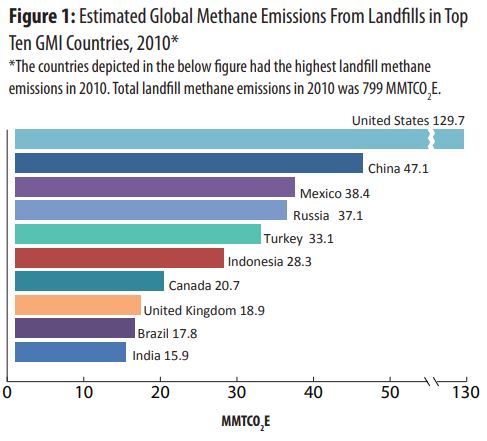
| Country | MMTCO2E |
|---|---|
| United States | 129.7 |
| China | 47.1 |
| Mexico | 38.4 |
| Russia | 37.1 |
| Turkey | 33.1 |
| Indonesia | 28.3 |
| Canada | 20.7 |
| United Kingdom | 18.9 |
| Brazil | 17.8 |
| India | 15.9 |
In the US, landfills over a certain size (containing 2.5 million metric tons of waste or 2.5 million cubic meters of waste) must capture their gas under Clean Air Act regulations. The EIA estimates that in 2017, about 370 landfills across the country were collecting their gas as part of this regulation (EIA, 2019 [76]). There are additional voluntary projects around the country as part of the Landfill Methane Outreach Program [77].
Summary
This lesson is devoted to understanding the emissions that drive climate change. We've broken them down by sector to try to understand how our actions result in a changing climate (we'll need to know this if we have any hope of doing something to solve it!). As you consider these emissions sectors, also think about the proximate causes [78] and driving forces [79] contributing to the emissions patterns. What do you see?
- Energy demand and consumption are growing rapidly, especially in many of the most heavily populated and underdeveloped areas of the globe. You saw that so-called clean coal technologies still produce huge quantities of GHGs and that natural gas generates significantly fewer GHGs, but that only non-fossil fuel technologies emit negligible amounts of GHGs. The energy sector contributes to climate change through power production and industrial processes. Because this sector contributes more GHGs to the atmosphere than any other, it's important for us to understand it thoroughly (as we'll see later this semester - it'll represent some of our biggest opportunities for turning this around).
- Transportation is a major and growing contributor to global GHG emissions. Road transport is the fastest-growing portion of this sector because rapidly increasing numbers of the world's population are becoming sufficiently affluent to afford cars and light trucks. Although it seems to have saturated its market potential, the United States is still the biggest contributor to global emissions from transportation, which is really no surprise when we consider the cultural values promoting the freedom of individual car ownership, the layout of our cities, and the relatively limited availability of affordable, reliable public transportation options.
- Agriculture is energy- and land-intensive, and this varies of course based on the type of crop or livestock being produced. There are direct emissions associated with livestock and crop production (ventilation in the barns, fuel for tractors, etc.) and there are indirect emissions (energy to produce animal feed or crop fertilizers).
- Various types of land use sequester carbon (some more efficiently than others), so this is a consideration for us as we think about land use change on a global scale. What type of land sequesters carbon the most? Forests! Agricultural soils also sequester carbon.
- Waste - even when we've discarded something, its emissions story is not over. Landfills produce a significant amount of greenhouse gas emissions (mostly methane) from the decomposition of organic matter like our food waste and yard waste.
Reminder - Complete all of the Lesson 2 tasks!
You have reached the end of Lesson 2! Double-check the lesson assignments in the corresponding lesson module in Canvas to make sure you have completed all of the tasks listed there.
3: Planetary Impacts
Climate and Weather
What will we learn?
In this lesson, we'll take a step back and look at what our increased emissions mean both for the climate and for extreme weather events.
By the end of this lesson, you should be able to:
- discuss the varied ways in which the Earth's climate is changing due to anthropogenic radiative forcing;
- understand why changes to our climate also create changes in extreme weather events;
- apply your understanding of the impacts on climate and extreme weather to your Climate Change in My Community project.
What is due this week?
This lesson will take us one week to complete. Please refer to the corresponding module in Canvas for specific assignments, deliverables, and due dates.
Questions?
If you have questions, please feel free to post them to the "Ask a question about the lesson?" discussion forum in Canvas. While you are there, feel free to post your own responses if you, too, are able to help a classmate.
Extreme Weather Events
We've briefly looked at extreme weather events already in the context of human health implications. But their impacts reach beyond just those felt by us. For a better understanding of the impact of extreme weather events, please read (assigned, required reading) the Center for Climate and Energy Solutions section on Extreme Weather and Climate Change [80]. They summarize these topics better than I can, so I'll save you my attempts at paraphrasing.
Pay special attention to the section:
Learn more about the links between climate change and:
- Drought
- Extreme Heat
- Extreme Precipitation
- Hurricanes
- Tornadoes
- Wildfires
Climate
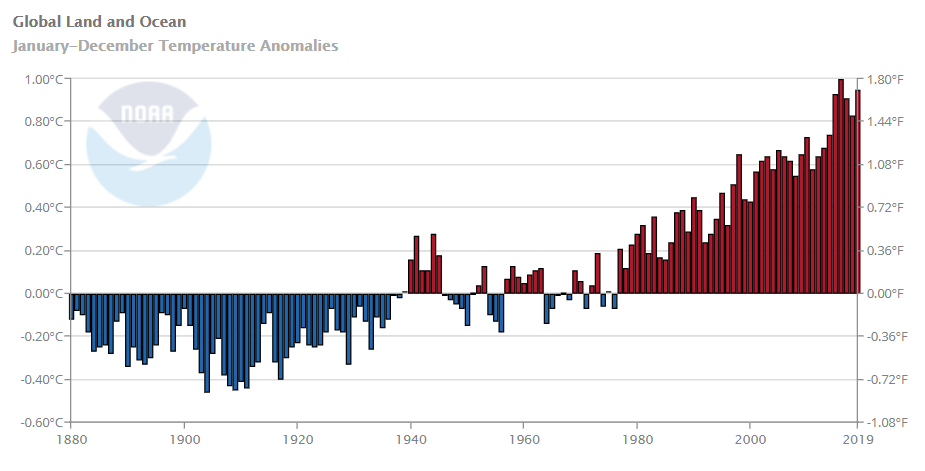
Visit the Climate at a Glance website [81] to explore this data in more detail and other visual applications or download it in its entirety.
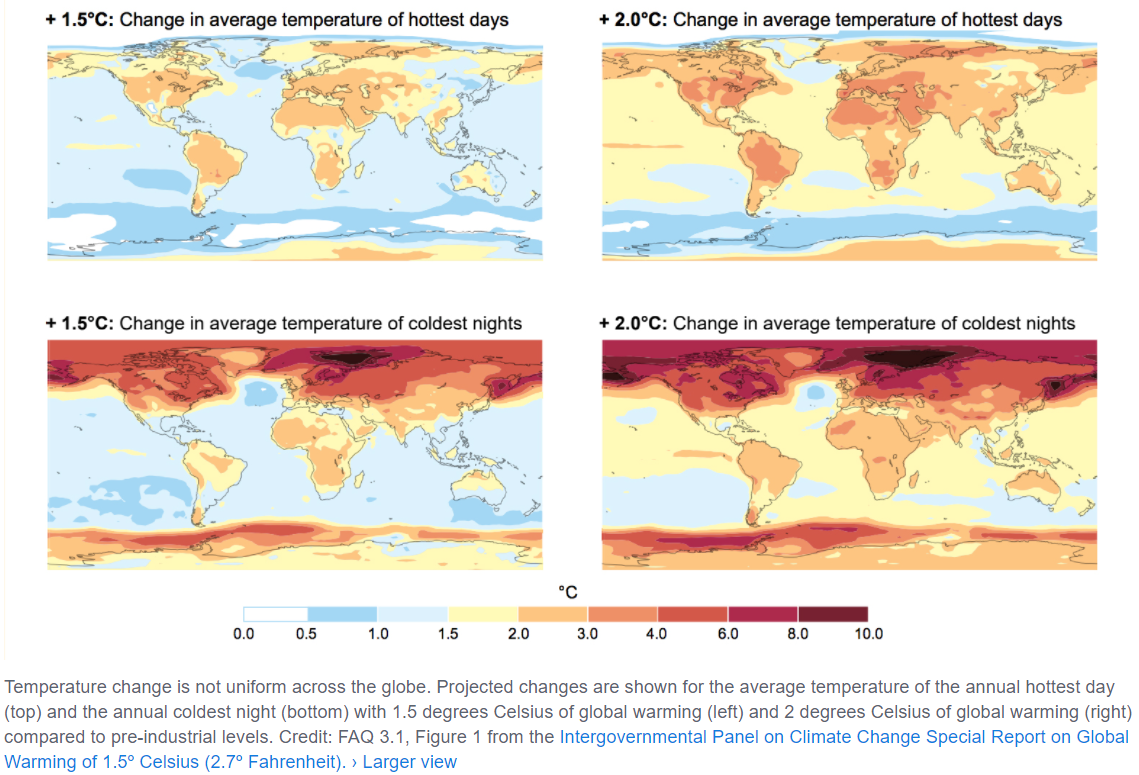
Summary
The Weather, The Climate, It's All Affected
This week, we took a quick look from 30,000 feet at the expected impacts on our weather and climate as a result of anthropogenic forcing of the climate system. We've seen that both our day-to-day weather patterns and our overall climate conditions both will continue to change as a result of human activity. Understanding these changes and preparing for them are critical components of building our adaptive capacity. Even if we stop emitting all the CO2 in the world right this minute, we're already committed to some level of continued change. How many of you are optimists? I try to find the good in things, and that goes for climate change impacts, too. However, the vast majority of impacts we can expect are negative. There's not much silver lining to this. We were pretty nicely suited to live in the climatic conditions we've enjoyed for most of human existence, and we're creating changes to that system that are fast (on a geologic time scale at least). We'll need to think strategically about how to maneuver through shifts in agriculturally productive lands, harnessing heavy precipitation events to prevent flooding, protecting vulnerable people from heat stress, and more. We'll look at some of those issues in depth a bit more when we get to Unit 3: Solutions.
Reminder - Complete all of the Lesson 3 tasks!
You have reached the end of Lesson 3! Double-check the lesson assignments in the corresponding lesson module in Canvas to make sure you have completed all of the tasks listed there.
4: Vulnerability
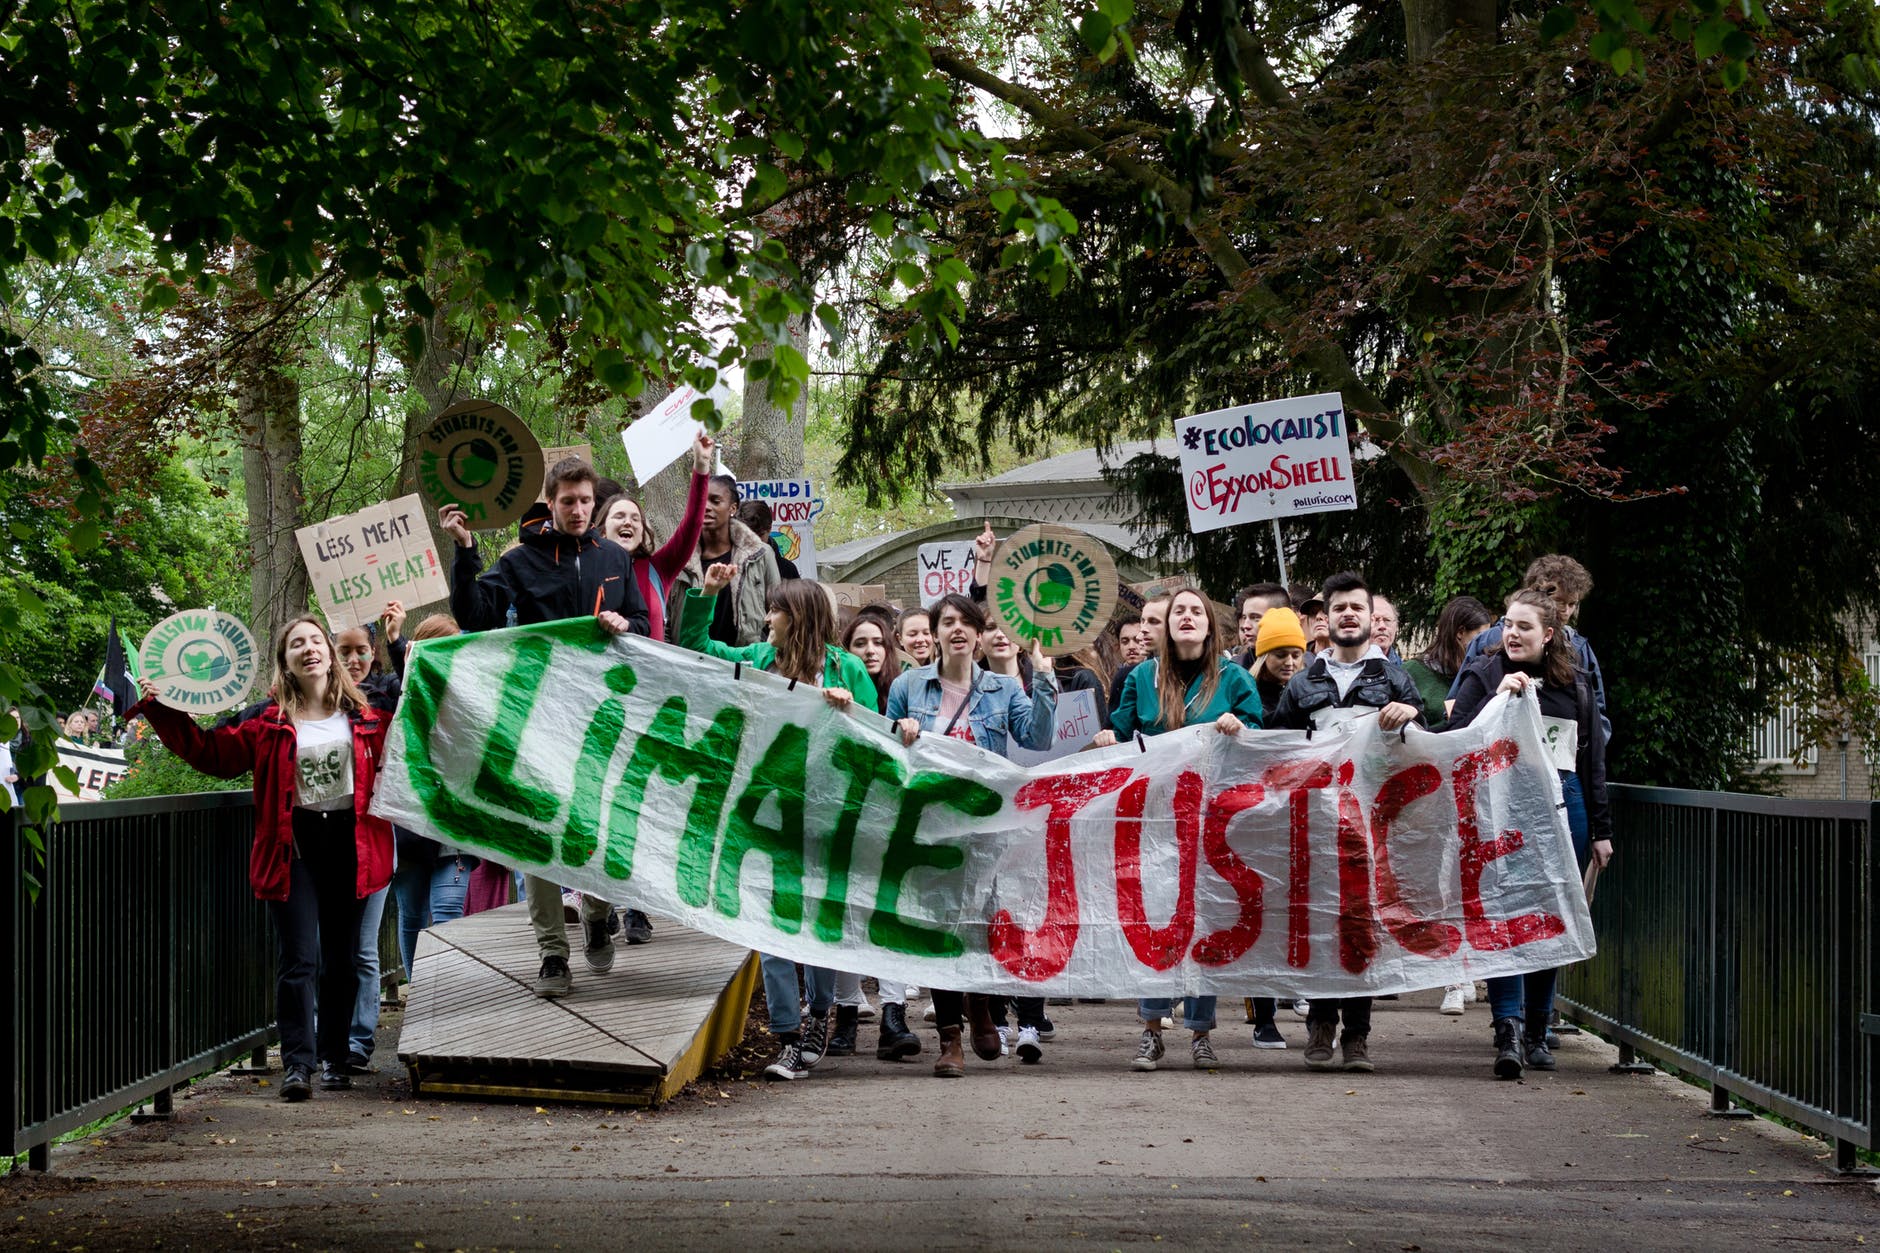
What will we learn?
By the end of this lesson, you should be able to:
- define impacts of climate change and explain the difference between direct and indirect impacts, giving examples;
- define vulnerability and explain the three dimensions of vulnerability, giving examples;
- explain how the same climate change impact creates winners and losers;
- explain what resilience to climate change is and how that relates to vulnerability;
- understand and articulate common risk factors for increased vulnerability to climate change impacts;
- describe climate justice.
What is due this week?
This lesson will take us one week to complete. Please refer to the corresponding module in Canvas for specific assignments, deliverables, and due dates.
Questions?
If you have questions, please feel free to post them to the Ask a Question about the Lesson forum. While you are there, feel free to post your own responses if you, too, are able to help a classmate.
Human Impacts of Climate Change
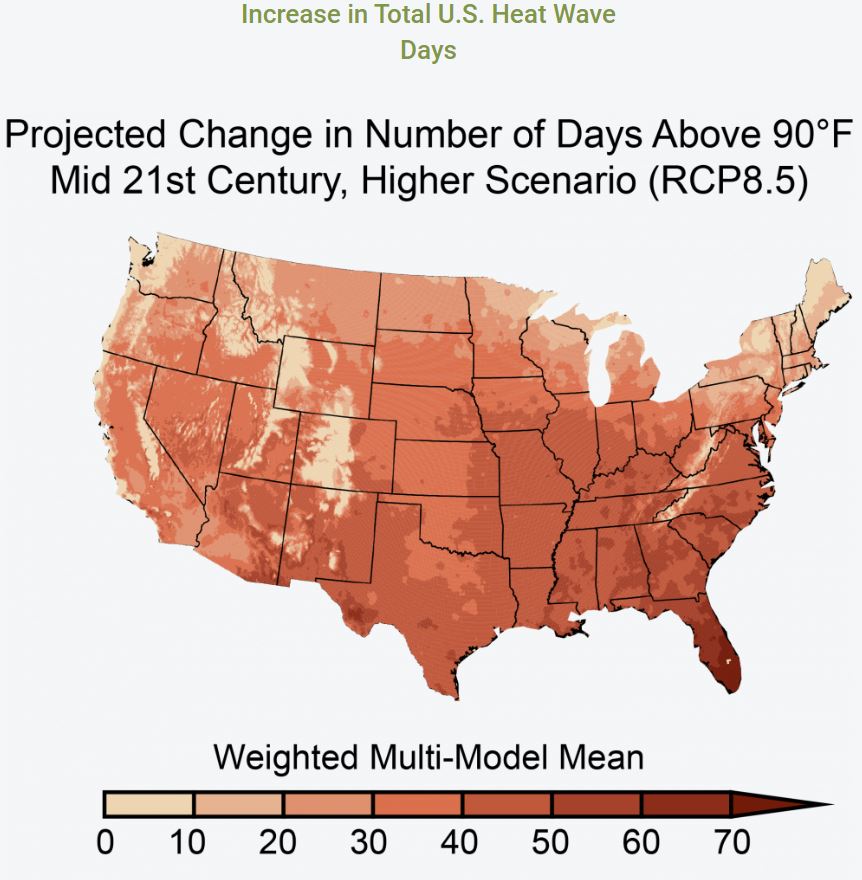
People feel the impacts of climate change in two ways: directly and indirectly (we'll spend all of Lesson 5 looking more closely at direct and indirect impacts on human health):
- direct impacts occur when the impact of climate change itself causes them harm (or benefit, but unfortunately most impacts on humans are negative)
- increased heat stress (and demand for air conditioning, which creates a positive feedback loop for increased emissions)
- loss of life or property during hurricanes and other extreme weather events
- indirect impacts occur when the impact of climate change has an effect on some system that humans rely on or engage with; so the impact isn't happening immediately to people, but instead affects an intermediary system that in turn affects people
- decreased crop yields from increased drought-like conditions ---> less food for people
- increased instances of mold from wetter summers (State College experienced this in summer 2018 [87])
There are many other ways that climate change affects people and the things they value. We know, for instance, that climate change is increasing the frequencies and intensities of heavy downpours. We also know that climate change is increasing variation in rainfall from year to year. For agriculture, the result of more frequent, more intense downpours is localized crop loss from damage to plants and agricultural infrastructure. Increasing variation in wet and dry years means that, without irrigation, there are greater year-to-year variations in agricultural yields. These findings suggest that the impacts of climate change will create winners and losers in agriculture. All other things being equal, farmers lose when yields decrease because heavy downpours flatten their crops or droughts ravage the countryside; in contrast, farmers win when the localized downpours miss their fields and strike the fields of their competitors. They also win when yields go up because of a moist year. However, the increase in volatility of the weather leads to fewer winners than losers.
Human Vulnerability to Climate Impacts
Vulnerability refers to the degree to which people or the things they value are susceptible to, or are unable to cope with, the adverse impacts of climate change. Thus, vulnerability determines how severe the impacts of climate change might be.
There are three dimensions of vulnerability to climate change: exposure, sensitivity, and adaptive capacity.
- Exposure is the degree to which people and the things they value could be exposed to climate variation or change;
- sensitivity is the degree to which they could be harmed by that exposure; and
- adaptive capacity is the degree to which they could mitigate the potential for harm by taking action to reduce exposure or sensitivity.
The expression “things they value” not only refers to economic value and wealth, but also to places and to cultural, spiritual, and personal values. In addition, this expression refers to critical physical and social infrastructure, including such physical infrastructure as police, emergency, and health services buildings, communication and transportation networks, public utilities, and schools and daycare centers, and such social infrastructure as extended families, neighborhood watch groups, fraternal organizations, and more. The expression even refers to such factors as economic growth rates and economic vitality. People value some places and things for intrinsic reasons and some because they need them to function successfully in our society.
Some people and the things they value can be highly vulnerable to low-impact climate changes because of high sensitivity or low adaptive capacity, while others can have little vulnerability to even high-impact climate changes because of insensitivity or high adaptive capacity. Climate change will result in highly variable impact patterns because of these variations in vulnerability in time and space.
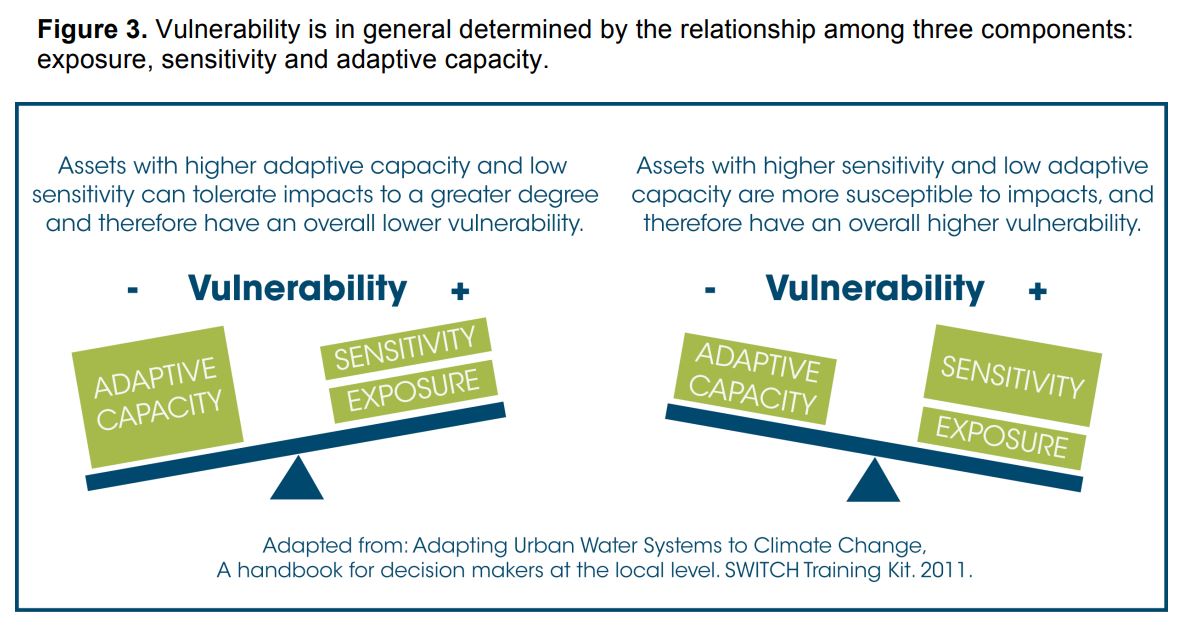
Assets with higher adaptive capacity and low sensitivity can tolerate impacts to a greater degree and therefore have an overall lower vulnerability. (Also shown is a clipart scale with adaptive capacity heavier than sensitivity exposure)
Assets with higher sensitivity and low adaptive capacity are more susceptible to impacts and therefore have an overall higher vulnerability. (Also shown is a clipart scale with sensitivity exposure heavier than adaptive capacity)
Focus first on the difference between adaptive capacity in these two scales.
- On the left, adaptive capacity outweighs both sensitivity and exposure, thereby resulting in lower vulnerability.
- On the right, sensitivity and exposure outweigh adaptive capacity, leading to increased vulnerability.
The concept of resilience is important to understanding adaptive capacity to climate change. Resilience refers to the ability of a human system (such as a municipal water system and the community that supports it) to withstand contemporary shocks and to anticipate and plan for future shocks. Resilient systems have the ability to learn from past experiences and to use that knowledge when confronting problems. Systems with high adaptive capacity are therefore resilient and able to reconfigure themselves to deal with climate change. Systems with low adaptive capacity are much less resilient and much more vulnerable to climate change.
What makes some people more vulnerable than others?
We've looked at the components of vulnerability (exposure, sensitivity, and adaptive capacity). But, let's try to dig in a bit deeper to find out what influences each of those components. Understanding who is most vulnerable to impacts is pivotal in creating successful adaptation and resiliency plans. The Thomas et al. reading for this week takes a much deeper, more comprehensive dive into the myriad factors associated with vulnerability, but before we jump into that, let's focus on some of the highlights.
The definitions in quotes below come from the IPCC TAR WGII [89] (2001):
- exposure - "contact between a person and one or more biological, psychosocial, chemical, or physical stressors, including stressors affected by climate change"
- While developing places like coastal Bangladesh [90] are certainly more exposed to some impacts of climate change, particularly related to extreme weather, exposure alone doesn't tell the whole story as to how socioeconomic status might increase one's vulnerability. Exposure played a bigger role in the vulnerability of victims of Hurricane Katrina, though. Residents of places like the Lower Ninth Ward, a working-class neighborhood, were living below sea level near inadequate levies. This isn't always the case though, sometimes our most exposed housing stock is also the most luxurious, as we see when hurricanes graze the eastern US and threaten extravagant vacation homes.
- While developing places like coastal Bangladesh [90] are certainly more exposed to some impacts of climate change, particularly related to extreme weather, exposure alone doesn't tell the whole story as to how socioeconomic status might increase one's vulnerability. Exposure played a bigger role in the vulnerability of victims of Hurricane Katrina, though. Residents of places like the Lower Ninth Ward, a working-class neighborhood, were living below sea level near inadequate levies. This isn't always the case though, sometimes our most exposed housing stock is also the most luxurious, as we see when hurricanes graze the eastern US and threaten extravagant vacation homes.
- sensitivity - "the degree to which a system is affected, either adversely or beneficially, by climate-related stimuli"
- Thinking about those big beach houses is a good segue into the role of sensitivity in determining your vulnerability to climate change and how your socio-economic status affects that. Imagine two storms with similar destruction. One storm strikes the Lower Ninth Ward, the other strikes the Outer Banks in North Carolina. Which homes are more likely to be insured? Which homeowners are more likely to have the resources to rebuild? So, even when we imagine situations with the same type of climate change impact occurring, depending on your socioeconomic status, even if exposure is equal, sensitivity is not.
- Thinking about those big beach houses is a good segue into the role of sensitivity in determining your vulnerability to climate change and how your socio-economic status affects that. Imagine two storms with similar destruction. One storm strikes the Lower Ninth Ward, the other strikes the Outer Banks in North Carolina. Which homes are more likely to be insured? Which homeowners are more likely to have the resources to rebuild? So, even when we imagine situations with the same type of climate change impact occurring, depending on your socioeconomic status, even if exposure is equal, sensitivity is not.
- adaptive capacity - "the ability of a system to adjust to climate change (including climate variability and extremes) to moderate potential damages, to take advantage of opportunities, or to cope with the consequences"
- This leads us to think about an individual or group's overall adaptive capacity in the face of climate change impacts.
Socio-economic status: Let's look at this at a few different geographic scales. In general, people who live in the least-developed countries are most vulnerable to many of the current and expected impacts of climate change. However, this is not at all to say that people living in poverty in the developed world are somehow immune to the impacts of climate change, far from it. Let's take a look at the global scale first.
It is often the case that those people who have contributed the least to causing the climate crisis stands to be the most adversely impacted by its consequences. Those of us who enjoy comfortable, carbon-intensive lives are often more insulated from the impacts.
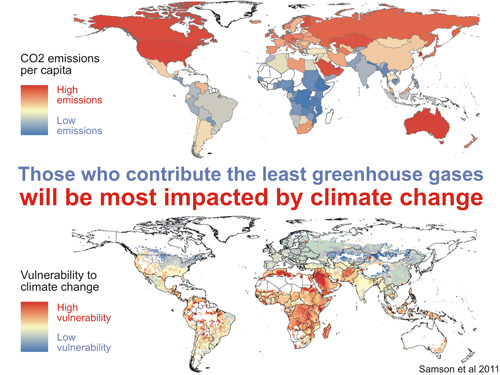
But even within the confines of a developed country, people experience vulnerability quite differently. The flow chart below, while tailored specifically to human health outcomes, provides a useful framework for contextualizing how the various facets of vulnerability work together to determine the severity with which a person or group of people will experience an impact. As you look at the examples under each of the facets of vulnerability, be thinking about how varied these experiences will be among Americans (as an example). Does the developed world in general (and therefore the US) have a stronger adaptive capacity than other places? Absolutely. But, do certain segments of the American population have a weaker adaptive capacity than others? Also absolutely.
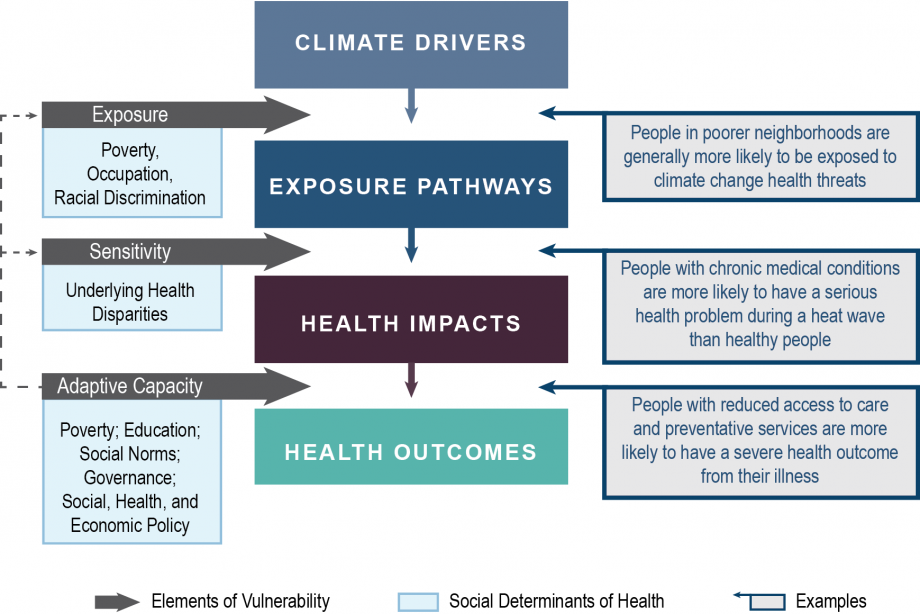
Flow chart starts with climate drivers leading to exposure pathways
In between them is the exposure element of vulnerability. This is poverty, occupation, and racial discrimination. For example, people in poorer neighborhoods are generally more likely to be exposed to climate change health threats.
Exposure pathways lead to health impacts
In between them is the sensitivity element of vulnerability. This is an underlying health disparity. For example, people with chronic medical conditions are more likely to have a serious health problem during a heatwave than healthy people.
Health impacts lead to health outcomes
In between them is the adaptive capacity element of vulnerability. This is poverty; education; social norms; governance; social, health, and economic policy. For example, people with reduced access to care and preventative services are more likely to have a severe health outcome from their illness
Health: The infirm, either through age (very young or very old), illness, or handicap are far more sensitive and have a lower adaptive capacity despite what could be modest exposure. In other words, an impact that might not harm a healthy person could be quite consequential for a sick one.
- The 2003 European Heat Wave is a sobering example of this. Just in Paris, France, almost 15,000 people died. Most of them were elderly women living on high floors of poorly ventilated buildings (research by Richard Keller from the University of Wisconsin-Madison, cited in Why Heat Waves Can Mean High Death Tolls, 2012 [94]). Elderly folks do not often observe early signs of dehydration and may take certain medications that exacerbate their sensitivity to extreme heat. This, coupled with the fact that many elderly people live alone and are on fixed incomes with limited mobility creates a perfect storm of vulnerability to some impacts of climate change.
Side note - Is anyone surprised to learn that in our lifetimes, in a developed country, almost 15,000 people died from heat stress during a single heatwave event? Perhaps it's just me, but I am as floored by this every time I revisit it as I was when it unfolded.
Climate Justice
"Climate change is happening now and to all of us. No country or community is immune. And, as is always the case, the poor and vulnerable are the first to suffer and the worst hit." UN Secretary General, Antonio Guterres (March 2019). See Secretary General Guterres' full remarks [95].
Climate justice is the idea that responding to climate change isn't simply about reducing our emissions and ensuring we've elevated our beach houses to withstand stronger storm surges. Climate justice represents an opportunity to address deep-seated social inequities that increase vulnerability to climate change among some people and recognizes our collective responsibility to those who are most vulnerable. The Mary Robinson Foundation - Climate Justice [96] organizes this into the following principles:
- Respect and protect human rights
- Support the right to development
- Share benefits and burdens equitably
- Ensure that decisions on climate change are participatory, transparent, and accountable
- Highlight gender equality and equity
- harness the transformative power of education for climate stewardship
- Use effective partnerships to secure climate justice
Basically, let's make the world a better place for everyone who is here now and who will come after us. Think for a moment about the Fridays for Future [97] movement led by Greta Thunberg. Here, we're seeing a demand for intergenerational justice - the kids are demanding the adults work aggressively to fix a problem they've created rather than leaving it to the next generation to figure out. The principles listed above (and I do encourage you to go read more about them on the Foundation's website) tie in quite well with the UN's Sustainable Development Goals [98] (which we'll get to in Unit 3 when we turn our attention to responses to climate change).
Summary
This lesson is likely the most important we've had this semester. I strongly encourage you to complete the readings thoroughly, follow through on the links provided for additional resources, and really prepare yourself to be thinking about the impacts of climate change and the solutions we'll attempt to employ to address them within this context of vulnerability and climate justice. There could be nothing more relevant to a course on the human dimensions of a changing climate than these foundational topics, and we'll revisit this throughout the remainder of the semester. Understanding how we determine vulnerability and what constitutes a direct vs. indirect impact will be pivotal in your success for the remainder of this course.
Reminder - Complete all of the Lesson 4 tasks!
You have reached the end of Lesson 4! Double-check the lesson assignments in the corresponding lesson module in Canvas to make sure you have completed all of the tasks listed there.
5: Impacts on Places
The Built Environment and Our Coasts
What will we learn?
This lesson is a bit unique in that we are tackling two separate but decidedly related issues - impacts of climate change on our coasts and impacts of climate change on our cities. Not all cities are near water, but many of our largest, busiest, most populated cities are. Therefore, it makes sense to think about these issues in tandem while also recognizing their unique attributes. And then, let's add extreme weather events to the mix because while they don't happen exclusively on the coasts or in the cities, the nexus of these produces some of the biggest concerns related to human impacts of a changing climate.
By the end of this lesson, you should be able to:
- describe the main physical impacts of climate change on coasts and in cities (including urban utilities and infrastructure, industry, services, and social systems);
- describe which people and what things are exposed to these physical impacts;
- explain why these exposed people and things are or are not sensitive to these physical impacts;
- explain how location, size, and type of economy affect the overall vulnerability of a city to climate change;
- describe the factors that influence the adaptive capacity of cities in relation to climate change and explain how those factors work.
What is due this week?
This lesson will take us one week to complete. Please refer to the corresponding module in Canvas for specific assignments, deliverables, and due dates.
Questions?
If you have questions, please feel free to post them to the "Have a question about the lesson?" discussion forum in Canvas. While you are there, feel free to post your own responses if you, too, are able to help a classmate.
Overview
For this lesson, we'll explore two of the most vulnerable environments to climate change impacts - the coasts and cities with particular emphasis on their vulnerabilty to extreme weather events.
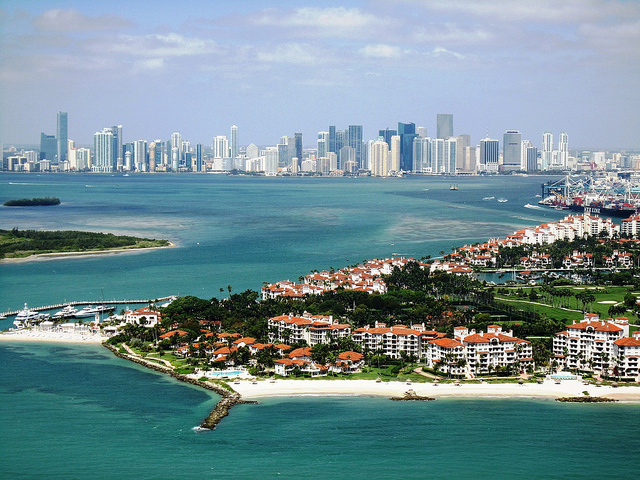
Scientists have little doubt that the impacts and costs of climate change will be unavoidable –– and most likely the greatest –– in coastal environs. More people and more infrastructure will suffer harm in coastal zones than in any other place on Earth. Most other aspects of climate change are only now starting to be felt, but impacts in coastal zones are readily apparent today and accelerating. In response to this unfolding disaster, many of the world’s great coastal cities are already developing adaptation strategies and hoping to avoid the human and financial tragedy that awaits them.
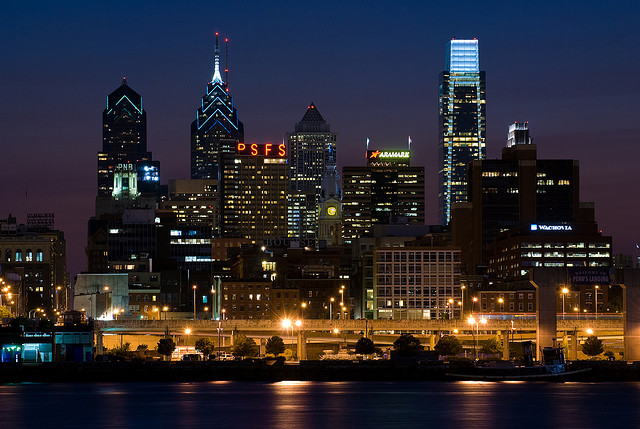
About half the world’s population currently lives in cities. An increasingly larger proportion of the population will live in cities at the same time that climate change intensifies. About 85 percent of the Western Hemisphere’s population will be living in cities by 2030, up from somewhere near 50 percent in the middle of the 20th century. Even more shocking urban growth has taken place in Asia and Africa, going from 17 and 15 percent urban in 1950 to a projected 54 and 51 percent in 2030, respectively. Estimates are that more than 37 percent of the world’s population will live in cities with populations larger than 1 million people in 2030. Against this backdrop of unprecedented urban growth, this lesson will explore relationships between cities and climate change.
Climate-City Relationships
Many people mistakenly think that cities have no connection with climate because urban dwellers’ homes and vehicles insulate them from direct contact with it. Climate, however, is intimately linked to cities and their inhabitants. Many urban activities are climate sensitive, including such diverse activities as basic water use, transportation, construction, and sport and recreation. Climate also affects the costs of climate control, causing urbanites in tropical and subtropical climates to expend huge amounts of energy and money on air conditioning, whereas city dwellers in extratropical climates spend vast sums on heating in winter. Climate and weather also interact with socioeconomic and other natural stresses to increase or decrease overall stress on urban inhabitants.
Climate-city relationships therefore significantly influence the way that cities function, so if these interactions change because climate changes, cities must adapt to accommodate the new climate. Consequently, understanding the likely impacts of climate change on cities, the vulnerability of cities to those impacts, and the potential of cities for adaptation to climate change is a vital area of study because of the enormous number of people who live in cities.
| Year | Percentage Urban | Percent of the world's urban population living in the region | Percent of urban population in different size-class of urban centre, 2000 | ||||||||||
|---|---|---|---|---|---|---|---|---|---|---|---|---|---|
| 1950 | 1975 | 2000 | 2030* | 1950 | 1975 | 2000 | 2030* | Under 0.5 m | 0.5 - 1 m | 1 - 5 m | 5 - 10 m | 10 m+ | |
| Northern America | 63.9 | 73.9 | 79.1 | 86.7 | 15.0 | 11.9 | 8.8 | 7.1 | 37.4 | 11.0 | 34.3 | 5.4 | 11.9 |
| Latin America and the Caribbean | 42.0 | 61.2 | 75.4 | 84.3 | 9.6 | 13.0 | 13.9 | 12.4 | 49.8 | 9.0 | 21.7 | 4.9 | 14.7 |
| Oceania | 62.0 | 71.5 | 70.5 | 73.8 | 1.1 | 1.0 | 0.8 | 0.6 | 41.9 | 0.0 | 58.1 | 0.0 | 0.0 |
| Asia | 16.8 | 24.0 | 37.1 | 54.1 | 32.0 | 37.9; | 47.9 | 53.7 | 49.0 | 10.0 | 22.6 | 8.8 | 9.7 |
| Africa | 14.7 | 25.4 | 36.2 | 50.7 | 4.5 | 7.0 | 10.3 | 15.1 | 60.2 | 9.6 | 22.1 | 4.6 | 3.5 |
| WORLD | 29.0 | 37.2 | 46.8 | 59.9 | 100.0 | 100.0 | 100.0 | 100.0 | 52.6 | 9.8 | 22.4 | 6.8 | 8.4 |
Coasts
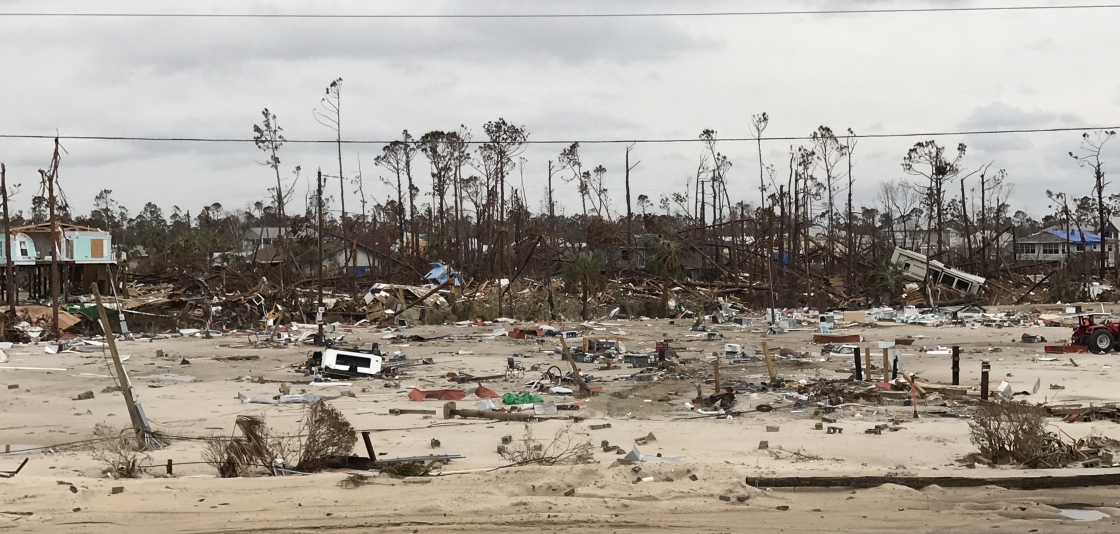
Rising Sea Levels
What is causing the seas to rise?
We hear a lot about sea level rise in the context of climate change. But what are the mechanisms by which the water is rising? There are three factors:
- thermal expansion - warmer water takes up more room. Given that the oceans are absorbing upwards of 90% of the additional heat in our changing climate, it makes sense that these waters are warming and therefore expanding.This accounts for about half of observed sea level rise (Nerem et al., 2019 [106]).
- mountain glaciers - typically, we expect to see intra-annual variation in the size of various glaciers around the world. They tend to melt off a bit in the summer months but then make back up for it with snow in the colder months and maintain a fairly steady state over time. But summer glacier melt is currently outpacing winter glacier growth since the springs and summers are warmer (Glick, n.d. [107])
- Greenland and Antarctic ice sheets - the same heat that's giving the glaciers trouble is impacting the huge ice sheets over Greenland and Antarctica. In Greenland, the meltwater attacks from above and sea water from below to make it easier for ice streams to flow.The West Antarctic ice sheet is usually the one that gets the most attention because it's melting so rapidly and is widely considered the most vulnerable of the three (Fox, 2017 [108]).The science is frankly less clear about what's happening with the East Antarctic ice sheet.
- For example, a study published in Nature last year suggests that the East Antarctic sheet may have added 5 billion tons per year between 1992-2017, though the certainty surrounding this estimate is, by their own admission, fairly weak compared to other findings about the West Antarctic sheet (The IMBIE Team, 2018 [109]).
- A newer study (Rignot et al., 2019 [110]) in the Proceedings of the National Academy of Sciences used 40 years of satellite data to evaluate the ice sheets and finds that East Antarctica was contributing almost a third of Antarctica's total contribution to global sea level rise.
- The important thing to understand about these possibly quite conflicting recent studies of the Antarctic ice sheets is that regardless of 'which one is right', the destabilization of the world's three largest ice sheets has potentially dramatic impacts on our coasts and the cities that often inhabit them. Perhaps there is no greater example, either, of the consequences of reaching tipping points. Once these ice sheets become destabilized, it's hard to get them back. Remember, too, that even if we turned off every fossil-fuel emitting source in the world right now, those extra greenhouse gases would be lingering in our atmosphere for decades or longer, creating additional warming.
To further complicate an already complex matter, these changes in ice volume aren't happening in a vacuum. NASA has this nice visualization [111](I couldn't figure out how to embed it here, but please go review it, it's only 1:08 minutes long) of the snowfall Antarctica experienced over the 20th century. As it turns out, because many parts of Antarctica saw increased snowfall, this helped mitigate the sea level rise we would have otherwise expected (by their estimates, this amounted to about 0.4 inches).
Where do these higher waters go?
As sea level rises, it pushes inland. How far it penetrates depends on the interplay of several factors.
- Regional physical geography: Sea level rising along a flat-lying coastline can push far inland, whereas sea level rise on a steep shoreline makes little appreciable difference.
- Regional tectonic activity: If coastal land is sinking for tectonic reasons, sea level rises faster, but if the land is rising due to Earth movements, sea level might actually fall.
- Local coastal currents can also make a difference, enhancing or suppressing sea level rise caused by climate change.
Along the Mid-Atlantic coastline from about New York City to Cape Hatteras, North Carolina, the combination of climate change-induced sea level rise, a rapidly sinking coastline, coastal currents that reinforce sea level rise, and a very broad, flat coastal shelf results in relative sea level rise that is about twice the global average.
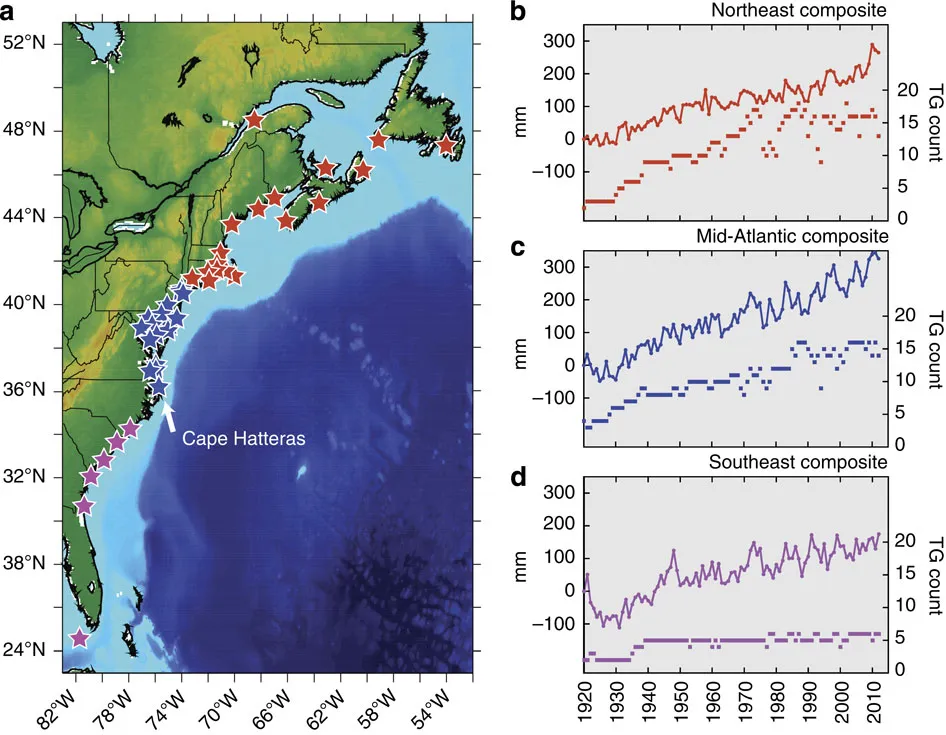
Physical Impacts Caused by Sea Level Rise
- As ocean water pushes inland, it increasingly inundates the coastal zone. The pressure exerted by the rising sea pushes saltwater further upriver and causes saltwater to intrude into coastal aquifers, degrading water quality and sometimes making water unfit for human use.
- When storms strike the coastline, they are working from a higher baseline, so waves and storm surges penetrate further inland, causing more damage than before.
- The greater penetration of waves results in increased coastal erosion.
- Coastal ecosystems have evolved to migrate inland as sea level rises, but because the rate of sea level rise is so rapid, some ecosystems cannot migrate fast enough. Of the ecosystems that can respond to rapid sea level rise, many confront barriers erected by nature or, more likely, by humans; roads, buildings, and other structures effectively squeeze migrating ecosystems, barring them from escaping the rising seas.
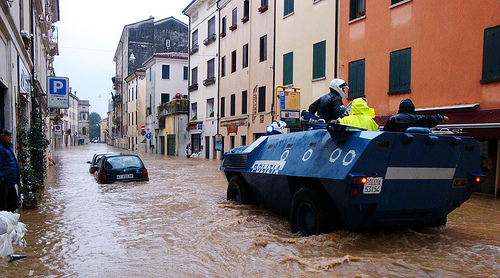
Rising Ocean Temperatures
While sea level rise might feel like a more direct threat to some human settlements, increasing ocean temperatures themselves carry important consequences to understand, too. The rising ocean temperature is having dramatic effects in some areas. Along polar coastlines, sea ice is thinning and melting altogether, opening the coastlines for modern human development, but causing traditional societies and wildlife that depend on the presence of sea ice to move or die. Coastal permafrost is melting quickly, causing shoreline collapse and rapid coastal retreat, damaging ecosystems and human structures –– indeed, entire Native Alaskan settlements are moving as the villages literally collapse. In tropical areas, rising ocean temperatures are contributing to coral bleaching and death, destroying these rich ecosystems worldwide and wrecking tourism industries in many locations.
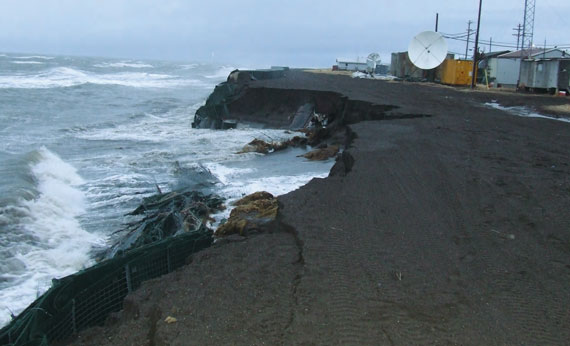
Perhaps an even greater threat associated with climate change is ocean acidification. The global ocean absorbs a major proportion of the atmospheric carbon dioxide emitted by fossil fuel burning and other human activities. The absorption of CO2 is acidifying ocean water. Scientists estimate that since the beginning of the Industrial Revolution, ocean acidity (in terms of H+ ion concentration) has increased 30 percent and will increase much more in the future. The main concern is that increasing acidification could affect major oceanic carbonate-based species and ecosystems–– from plankton, to corals, to shellfish.
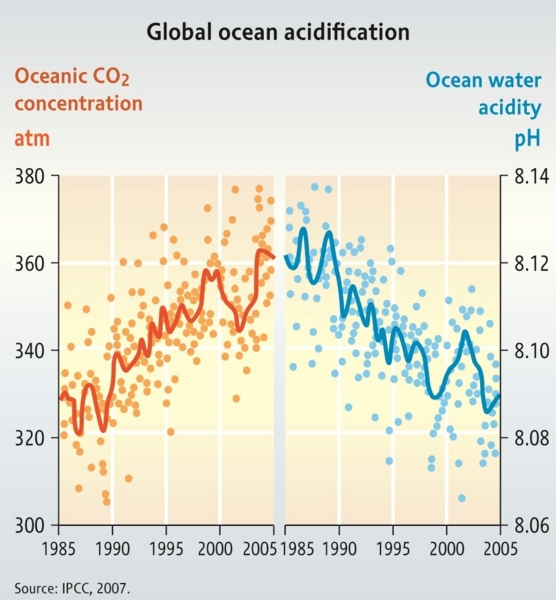
All these impacts are happening today and will certainly increase in the future. Sea level rise will continue to accelerate from glacial melt and especially from thermal expansion; it could become catastrophic if the Greenland or West Antarctic ice sheets were to collapse. Ocean storms such as hurricanes are expected to intensify, and some scientists think that ocean storm frequencies could increase in the future. Accelerating sea level rise and more intense storms will mean that storm surge and wave damage will be much greater, as will be coastal erosion. Coastal ecosystems will come under even more stress than they are feeling today. Ever-increasing ocean temperatures and acidification could mean the end of corals, and a worst-case scenario could see the collapse of major ocean food chains.
Physical Impacts in Coastal Environs
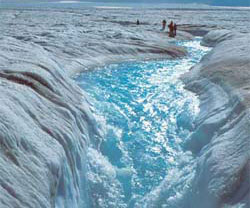
Sea level responds to two elements of climate change. First, as the lower portions of the atmosphere warm, freezing levels rise and move poleward, causing glaciers to melt in mountain and polar regions. The resulting meltwater drains to the oceans and increases their volume, thereby raising sea level. Scientists have understood the relationship between sea level and glaciers for more than a century: when ice sheets build on the continents, sea level goes down by 100 meters as the water from the oceans goes into these glaciers; when the ice sheets melt, water rushes back to the oceans and sea level rises, pushing coastlines miles inland from their positions during glacial maxima. Human-induced global warming is therefore augmenting this natural process.
Sea level also responds to climate change through the thermal expansion of water. When water heats, it expands; as the ocean heats with global warming, it expands. As long as ocean temperatures continue to increase, the global ocean will continue to expand.
Vulnerability at the coast
To understand the human risks of climate change in the coastal zone, it is useful to examine the vulnerability of coastal people and places to climate change impacts. Recall that there are three dimensions of vulnerability: exposure, sensitivity, and adaptive capacity. Exposure usually relates to physical vulnerability, whereas sensitivity and adaptive capacity relate to social vulnerability.
As described in the account of physical impacts above, exposure of coastal people and places is increasing. Climate change is exposing billions of people and their built environments to rising sea levels, more intense storms, enhanced storm surge, and worse coastal erosion. These people are exposed to degrading and reduced ecosystems, upon which many people depend for their livelihoods.
How much this increased exposure harms people and places depends on their sensitivity. In underdeveloped and developing countries, hundreds of millions of people residing in the coastal zone live in poverty, and their livelihoods are at risk of harm by climate change. Many of these people are very young or very old, which makes them even more sensitive. In addition, these impoverished people tend to live in substandard housing, without running water or adequate sanitation, nutrition, and health care; burgeoning poverty, corruption, and overcrowding mean that many of these areas are getting worse, rather than better over time. Coastal hazards associated with climate change exacerbate these infrastructural challenges, sometimes greatly.
Impacts on Coastal Environs in Developing Countries
In developed countries, socioeconomic safety nets are much greater and far fewer people are directly sensitive to the impacts of climate change. Instead, the sensitivities relate to the built environment and can still be great. Inundation from sea level rise and storm surge are the greatest threats. Consider the case of New York City, where trillions of dollars in sophisticated infrastructure -- subways, telecommunications, sewers, and water systems -- exist below ground and could easily be submerged by storm surge in the short run and permanent inundation in the long run. If such flooding occurred, the impacts would cascade around the world. For instance, if workers in the financial district could not get to work because the subways were closed, and if the telecommunications connecting to the New York Stock Exchange were to go down, financial chaos and crisis would spread worldwide. Given that the world’s three major financial centers (New York, London, and Tokyo) are coastal cities, it is clear that in the long term even more affluent countries are sensitive to coastal zone impacts of climate change.
We're sensitive to different things. In sum, it is possible to say that sensitivity to climate change is increasing in the coastal zones of undeveloped, developing, and developed countries. In less affluent countries, sensitivities tend to involve direct impacts on people, but in more wealthy countries, sensitivities are to infrastructure and therefore are felt by individuals and households indirectly. The interconnectedness of the global society means that coastal zone sensitivities and impacts propagate throughout the world. This sensitivity to climate change is mounting in coastal areas because of growing populations and their associated infrastructure.
Adaptive capacity provides the means to decrease vulnerability by either reducing exposure or lessening sensitivity. In the coastal zone, adaptive capacity varies greatly at all scales, from person to person, household to household, neighborhood to neighborhood, settlement to settlement, and country to country. Many factors affect adaptive capacity -- financial resources, technological resources, political resources, and many more. All things being equal, people and places with greater financial resources have greater adaptive capacity. For instance, a rich city might be able to afford to build a sea wall around the city, but a poorer city might not. The rich city is more likely to have a strong intellectual and educational heritage and the technological means to design the sea wall, whereas the poorer city might still possess these characteristics, but it cannot apply them without access to funding. However, even the rich city might not be able to build the sea wall if the political elite are ideologically opposed to doing so; if the poorer city does not follow that ideology and has strong political connections to the nation’s rulers and access to national funds, then they might, in the end, be able to build the sea wall.
People love the coasts
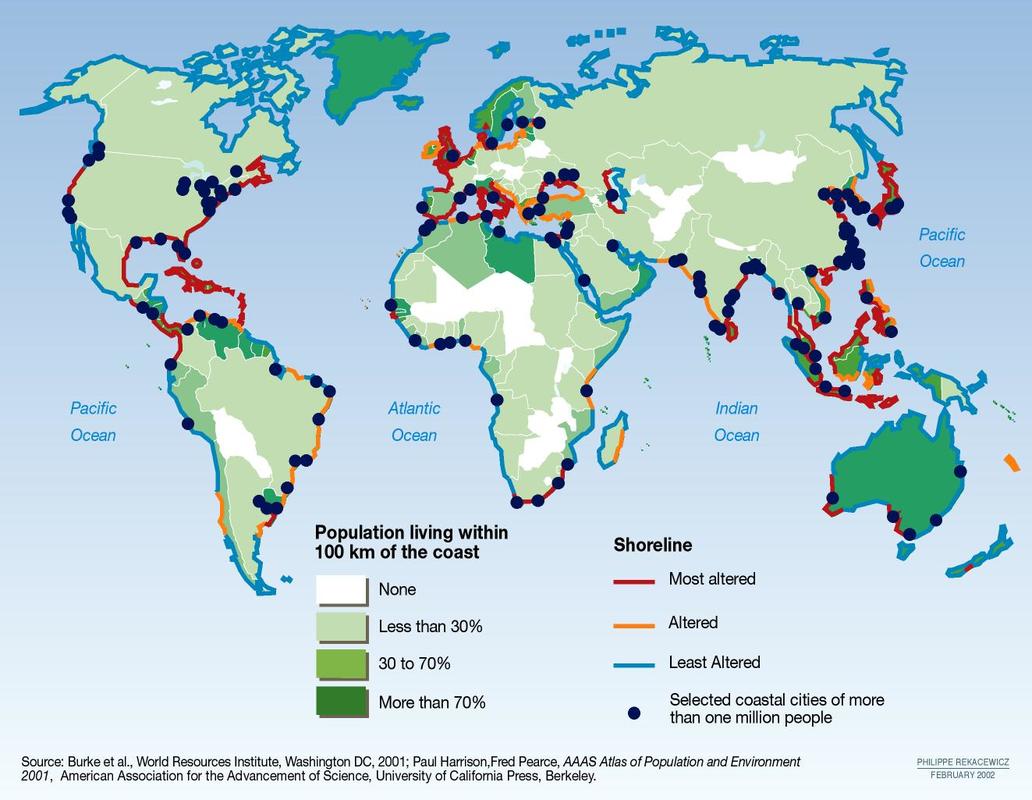
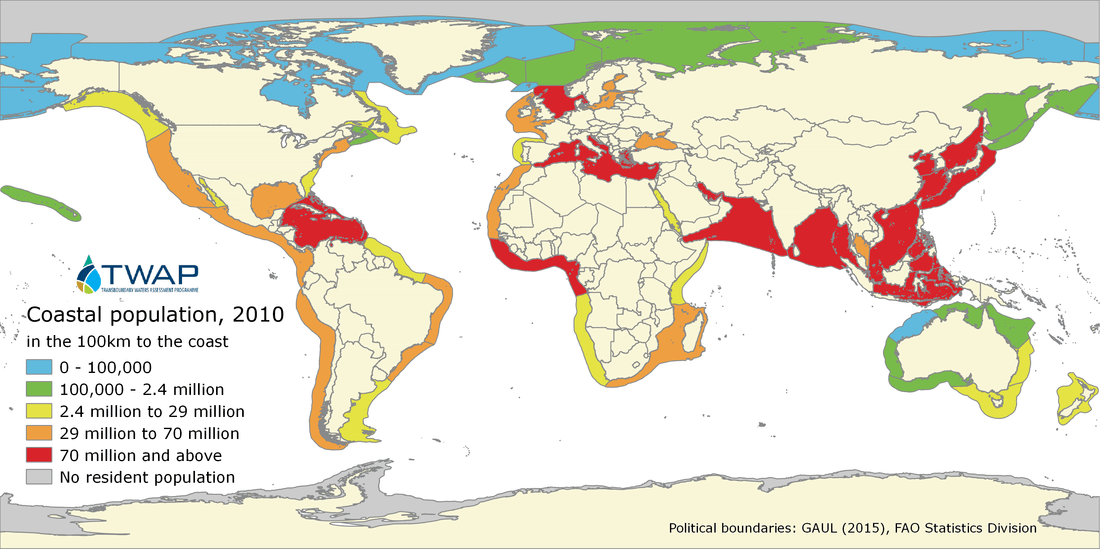
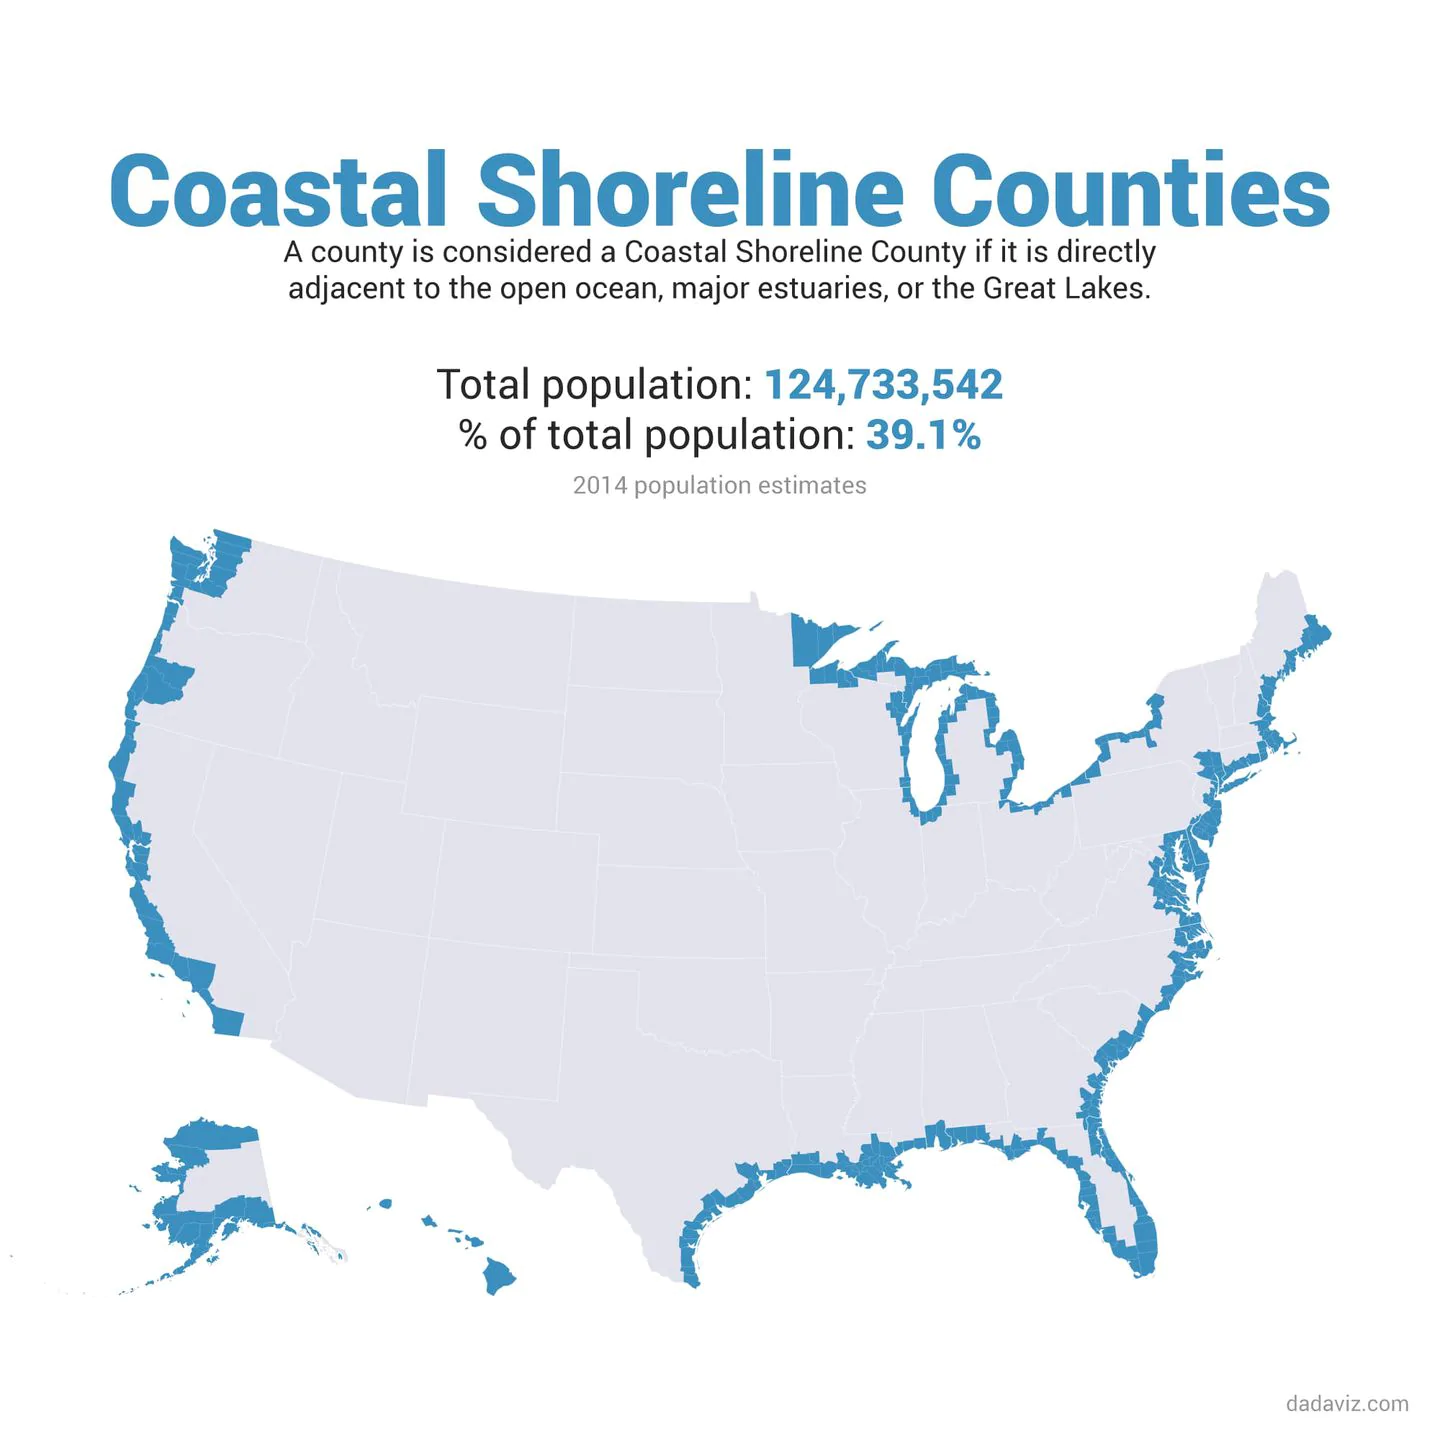
The physical impacts of climate change on coastlines are bad, but the human impacts could be even worse. Humans put more pressures on coasts than any other area, which should be no surprise to you now that you've seen how reliant on the coasts are settlements are.
- 8 of the 10 largest cities are coastal (UN Atlas of the Oceans [123])
- Tokyo, Japan
- Mexico City, Mexico
- Mumbai, India
- Sao Paulo, Brazil
- New York City, US
- Shanghai, China
- Lago, Nigeria
- Los Angeles, US
- Calcutta, India
- Buenos Aires, Argentia
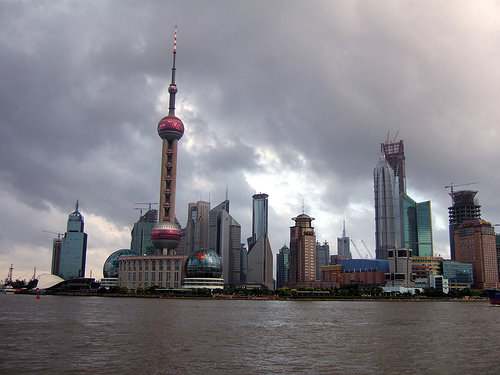
Cities in a Changing Climate
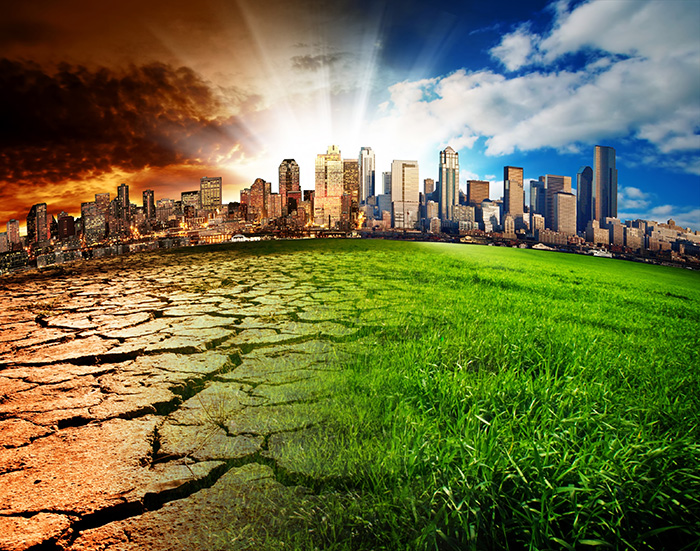
Vulnerability of Cities
The greatest climate risks to cities are extreme events and sea level rise. Tropical cyclones, floods and landslides resulting from extreme rainfall, wildfire, and heat waves are examples of extreme climate-related events that could devastate a city. As discussed in the coastal impacts lesson, sea level rise is starting to stress some cities and worry many others. Other important climate risks include health impacts (particularly heat stress) air quality, water-borne illnesses, and disease vectors. Cities with strong urban heat island effects are particularly prone to heat stress and air quality issues.
What makes a city more or less vulnerable to climate change and its impacts? Many, many factors. But, we can think about them in 3 broader categories:
- location
- Climate risks vary with location, with differences existing between coastal and inland risks, riverine and dryland risks, tropical and extratropical risks, and so forth. For example, coastal cities are vulnerable to sea level rise, and many tropical and subtropical coastal locations are additionally vulnerable to tropical cyclones (hurricanes as we call them in the Atlantic). Cities located on rivers are vulnerable to floods, and cities located in dry vegetated climates are subject to wildfires.
- size
- Large cities have greater total vulnerability to climate change because there are more people and infrastructure to expose to climate impacts and more likelihood that they have a large number of sensitive people. Still, large cities also have more financial, educational, and other resources -- i.e., more adaptive capacity -- for vulnerability reduction. In contrast, smaller cities have a reduced footprint and might be less sensitive overall, but when they do suffer exposure to an event, they have less adaptive capacity.
- economy
- City economies that are resource-dependent are more vulnerable to climate change than cities with diverse, integrated economies. For instance, a city that is largely dependent on forests devastated by climate-induced insect outbreaks is more vulnerable than if the forest industry is one of many facets of the city’s economy. Other characteristics of cities that make them vulnerable to climate change include rapid urbanization and fragile urban infrastructures.
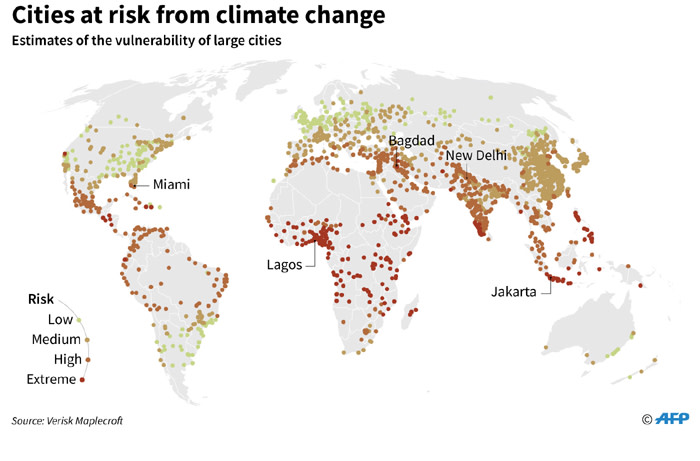
Impacts on Industry and Social Systems in Cities
Industry
Industry is less central today than it was previously in many developed world cities, but it is still dominant in most less-developed cities. In any case, climate has a major impact on most industries. Like the service sector, industry depends on the integrity of the infrastructure. For instance, most industries can experience considerable losses when extreme climate negatively affects transport networks, such as roads, bridges, and pipelines. Many industries are directly weather-dependent, such as construction, so any change in climate will affect them positively or negatively. Other industries are indirectly influenced by climate, but are nevertheless at the mercy of cascading indirect impacts of a changing climate. An example would be the food processing industry, which can shut down altogether when crops fail because of uncooperative weather or climate. The energy production industry is in large part responsible for climate change and is being affected positively and negatively by it. As temperatures go up, more energy is needed to cool homes and businesses but less is required to heat homes, and the direction of change is dependent on the region under consideration. Moreover, as climate change mitigation efforts take hold, fossil fuel-intensive industries will lose business and alternative industries will gain, resulting in a restructuring of energy production.

Social Systems
The social systems of cities are being affected by climate change. Cities tend to be the microcosms of the global system socially, in that the more-affluent classes tend to be the ones driving greenhouse gas emissions, and the less-affluent classes suffer the impacts. Thus, the more affluent are starting to feel mitigation efforts as they alter their energy use, the technologies they use, the nature of their home and business environments, their transportation patterns, and the products they purchase. These changes essentially influence their lifestyle, but not their well-being. The less affluent feel changes in lifestyle to a lesser degree, and are more likely to experience negative impacts of climate change on their well-being, especially in cities in less-developed countries. The most vulnerable among the lower classes are the least empowered and poorest: elderly, young, handicapped and infirm, recent immigrants, and women. These groups are the most exposed to climate and weather. They are most sensitive and have the least adaptive capacity because they have the least access to safe water, food, health care, shelter, social services, employment, and information. Climate change impacts -- sea level rise, increased severe storms, floods, and droughts, and others -- further decrease these essential facets of quality of life and, indeed, survival.
Impacts on Utilities, Infrastructure, and Services in Cities
A city is essentially a network of complex, interacting human systems. It is possible to place the human systems most affected by climate change into four categories: utilities and infrastructure, services, industry, and social systems. Let us take a look at each of these systems.
Utilities and Infrastructure
Utilities and infrastructure are fundamental to the functioning of any city. Health and quality of life depend on a safe, reliable water supply and on sanitation via sewers and storm drainage systems. Projected increases in severe storms, floods, and droughts will place considerable stress on these systems and often compromise them. Also basic to any modern city are transport, power, and telecommunication systems. Climate and weather have a major impact on these networks, so any change in climate will undoubtedly affect them, both positively and negatively. For instance, decreases in snow and ice will ease winter travel in heavily traveled midlatitude transportation networks, but increases in the length and intensity of the severe storm season will adversely influence summer travel. As discussed in the coastal impact lesson, the impact of rising sea level on coastal infrastructure is expected to be devastating without major investment in adaptation.
Services
Services dominate the economies of most cities and include trade and finance, retail and commerce, tourism and hospitality, and insurance. Services need reliable utilities and infrastructure to function –– to get employees to and from work, to provide them with water, food, and sanitation on the job, to supply the energy needed to power their electronic and other tools, and to maintain telecommunication networks. As noted above, climate change will either help or harm utilities and infrastructure by decreasing or increasing disruptions and therefore indirectly help or harm services dependent on them. It is also easy to see how climate change will directly affect such services as tourism and insurance, either affecting them positively or negatively depending on the nature and timing of climate impacts on any particular place.
Summary
The impacts of climate change on cities and the coastal zone will be significant and are compounded by the fact that coasts double as population centers for almost half of the world's people.This growing density of population in the coastal zone is exposing more people and infrastructure to climate change, greatly intensifying the impacts.
Coasts
Ocean warming, sea level rise, and ocean acidification are clearly observable today and their impacts are unavoidable. Even with strong, concerted efforts to mitigate climate change, and even if the polar ice sheets do not collapse and cause catastrophic sea level rise, ocean warming and sea level rise will accelerate during the 21st century because of the climate system’s inherent lags and the thermal inertia of the ocean. Sea level rise will continue for centuries, again because of the ocean’s thermal inertia. Ocean acidification mirrors carbon emissions to the atmosphere, so the oceans will continue to acidify for as long as carbon emissions rise, but will fall when emissions eventually fall. In this lesson, you also learned that cities are already feeling the impacts of climate change, but that those impacts are going to get much worse as cities continue to grow and as climate change continues to intensify. You found out that the human systems most affected by climate change are utilities and infrastructure, industry, services, and social systems. You discovered that the overall vulnerability of any city is a function of its location, size, and type of economy. Finally, you learned that although the capacity for adaptation is generally high in cities, four factors complicate adaptation: adaptation depends on the rate and magnitude of climate change; adaptation links to economic, political, technical, and social systems at scales ranging from local to global; climate change is only one of many risks that cities manage; and adaptation sometimes has unanticipated consequences.
In short, the impacts of climate change on the coastal zone will be momentous. Significant coastal adaptation is unavoidable and will be costly. To minimize these impacts and costs, climate change mitigation is critical and should start at once. In this lesson, you learned about the physical impacts of climate change on coastal zones, especially sea level rise and the two factors –– glacier melt and thermal expansion of sea water –– driving that rise. You read that sea level rise causes many problems such as coastal erosion, enhanced storm surge, and salt water intrusion. You also learned that climate change melts coastal permafrost, kills corals, and acidifies seas. These and other physical impacts have tremendous impacts on humans and the built environment, which are best understood by examining vulnerability's three dimensions: exposure, sensitivity, and adaptive capacity. The lesson compared the costs of adaptation to the costs of failing to adapt. It concluded that the impacts of climate change are unavoidable in the coastal zone, so adaptation should start at once.
Cities
In this lesson, you have learned that cities are already feeling the impacts of climate change, but that those impacts are going to get much worse as cities continue to grow and as climate change continues to intensify. You found out that the human systems most affected by climate change are utilities and infrastructure, industry, services, and social systems. You discovered that the overall vulnerability of any city is a function of its location, size, and type of economy. Finally, you learned that although the capacity for adaptation is generally high in cities, four factors complicate adaptation: adaptation depends on the rate and magnitude of climate change; adaptation links to economic, political, technical, and social systems at scales ranging from local to global; climate change is only one of many risks that cities manage; and adaptation sometimes has unanticipated consequences.
Coastal Cities
We've explored the challenges coastal environments - both build and natural - face in a changing climate. We've also learned about the challenges for cities. When we tie these challenges together and look at the compounded dangers for coastal cities, the urgency of the problem emerges. With so much of the world's population relying on coastal cities for their homes, livelihoods, and global economy, there is much to be lost to adverse impacts from climate change.
Extreme Weather
Obviously not all extreme weather risk happens at the coasts or within cities, but we've explored them together, recognizing that when these factors overlap - coastal cities experiencing extreme weather events - the climate impacts for people and our environment are high. While the connections between some weather events and climate change are not as clearly understood as others, people are increasingly vulnerable to these events as they become more severe and frequent. We'll spend some time in Unit 3 talking about how we can respond to these events to increase our adaptive capacity.
Reminder - Complete all of the Lesson 5 tasks!
You have reached the end of Lesson 5! Double-check the lesson assignments in the corresponding lesson module in Canvas to make sure you have completed all of the tasks listed there.
6: Impacts on People
Human Health, Food, and Water
I'm going to tell you a secret about climate change. It was never about the polar bears.
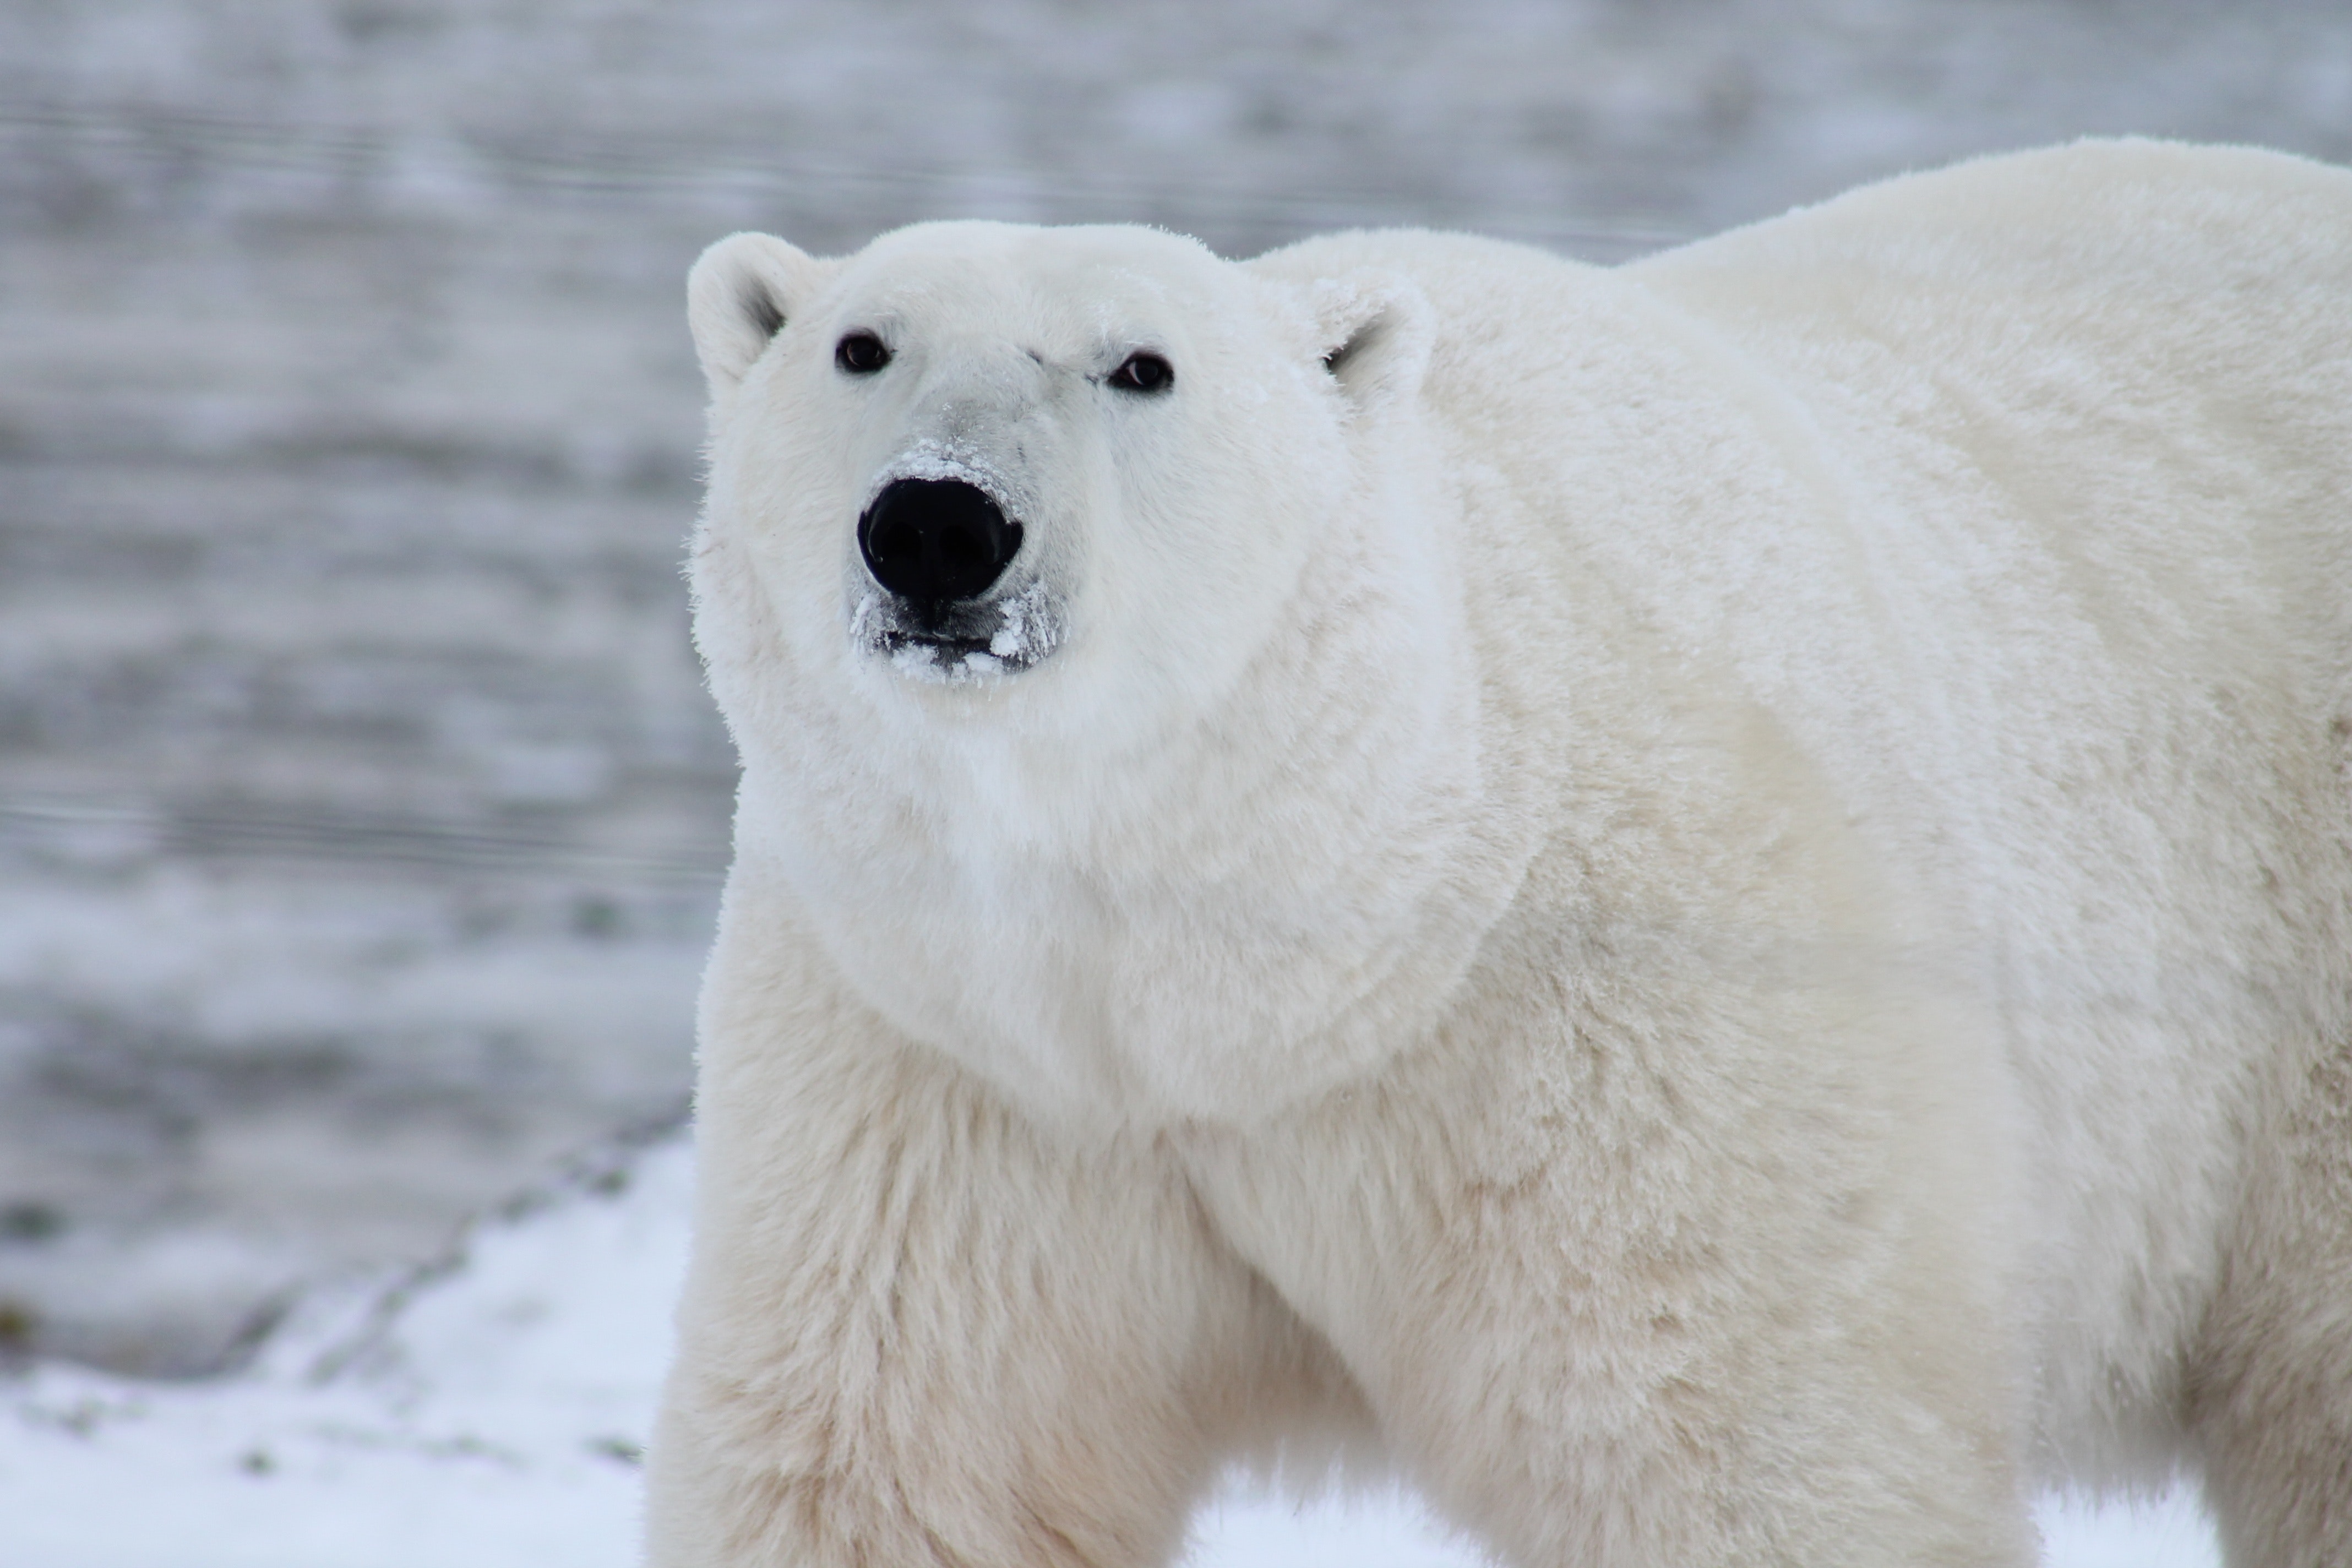
What do I mean by that? Often, it seems the messaging around the urgency to act on climate change gets lost in photos of forlorn-looking polar bears drifting on chunks of ice. Save the polar bears!!! The ice is melting and the polar bears will die. And, certainly polar bears are vulnerable to climate change (see this WWF Polar Bears and Climate Change Assessment [130]). But, my point is that we've been focusing on the wrong messaging about why we should care about climate change. While I don't like the idea of polar bears, or any species, experiencing negative impacts of a changing climate, I might not be inspired to act save polar bears because they feel kind of distant to me. Quite simply, we never should have made polar bears the unofficial mascots of climate action when ultimately, solving the climate crisis is something we need to do for our own well-being as a species.
If there's one thing we can say about humans, it's that we're inherently selfish (it's an evolutionary necessity in some ways). If we focus our climate change messaging on impacts that we feel much, much closer to home, we might just be able to inspire action. (And here, 'action' denotes not only action to address the causes of climate change but also action to respond to these possibly dangerous impacts.) So, for this week, we'll set our affinity for the fluffy white polar bears aside and worry about what climate change is already doing to people.
What will we learn?
By the end of this lesson, you should be able to:
- define the direct and indirect impacts of climate change on human health and discuss types and examples;
- identify and discuss factors beyond climate change that are fundamental to the good health of an individual and a society;
- explain the stressors of a changing climate on food security at various geographic scales;
- evaluate the interconnected nature of food security, climate change, population growth, and development;
- describe the impacts of climate change on water quantity and water quality.
What is due this week?
This lesson will take us one week to complete. Please refer to the corresponding module in Canvas for specific assignments, deliverables, and due dates.
Questions?
If you have questions, please feel free to post them to the "Have a question about the lesson?" discussion forum in Canvas. While you are there, feel free to post your own responses if you, too, are able to help a classmate.
Human Health
One of the biggest concerns that people have about climate change is how it might affect human health. What are the current and projected future health impacts of climate change? Who is at risk? What can be done to reduce those impacts and risks?
Climate change affects human health in three ways:
- direct exposure
- indirect exposure
- socioeconomic disruption
These effects of climate change do not act in isolation, however; environmental, social, and health system factors modify these impacts substantially.
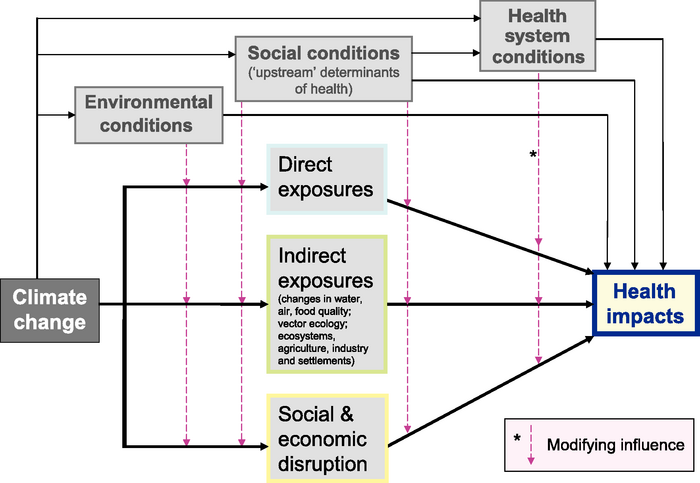
It's about us.
This chart from the IPCC (it's an oldie but goodie from 2007) demonstrates the varying levels of confidence of several impacts on human health. We see red arrows of varying length pointing toward the left to denote negative impacts while we see blue arrows of varying lengths pointing to the right to denote positive impacts. What do you notice, though, about the size and frequency of the negative impact arrows vs. the positive impact arrows? (That's right! The negative impacts far outweigh the positive ones.)
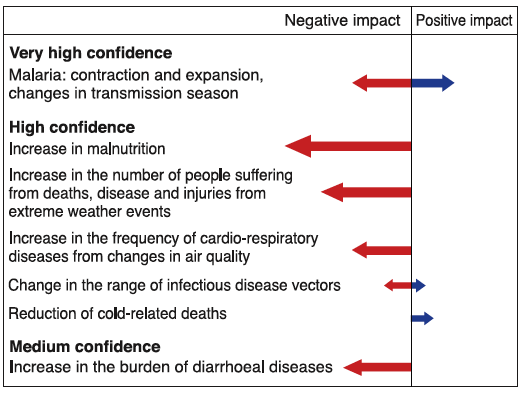
| Impact | Negative Impact | Positive Impact |
|---|---|---|
| Very High Confidence | ||
|
Malaria: Contraction and expansion, changes in the transmission season |
5 |
2.5 |
| High Confidence | ||
|
Increase in malnutrition |
10 |
- |
|
Increase in the number of people suffering from deaths, disease, and injuries from extreme weather events |
7.5 |
- |
|
Increase in the frequency of cardio-respiratory diseases from changes in air quality |
5 |
- |
|
Change in the range of infectious disease vectors |
2.5 |
1 |
|
Reduction of cold-related deaths |
- |
1.5 |
| Medium Confidence | ||
|
Increase in the burden of diarrhoeal diseases |
6 |
- |
Direct Impacts of Climate on Health
Direct impacts of climate on human health occur when the human body is physically stressed or injured immediately by some element of the climate system.
Examples of direct impacts include:
- extreme heat
- extreme cold
- other extreme weather events
Remembering that we're looking at the direct impacts on human health right now, we're thinking about the immediate impact events such as hurricanes, wildfires, droughts, and floods have on people's health. But how many people are affected by these various extreme weather events?
In 2015, the Centre for Research on the Epidemiology of Disasters (CRED) and the UN's Office for Disaster Risk Reduction (UNISDR) published The Human Cost of Weather Related Disasters 1995-2015 [132]. The timing of this report wasn't accidental - it was intended to help inform the urgency of the then-upcoming Paris climate negotiations producing meaningful targets for GHG mitigation. The two infographics below show the numbers of people affected and killed by weather-related disasters in 1995-2015.
- (Insert screeching brake sound.) Ok, but each of these types of extreme weather events was occurring before anthropogenic climate change. Yes! True. But, current understanding of the science strongly suggests that these types of events will increase in both frequency and intensity in a changing climate. So, certainly, not every person affected by a hurricane is someone who wouldn't have experienced that hurricane in the absence of climate change - that's not what we're talking about here. Instead, we're trying to understand that climate change is making these events worse in several dimensions, and this will in turn have bigger consequences for more people, and therefore we need to understand the magnitude of the potential problem and looking at the totality of people affected helps us do just that.
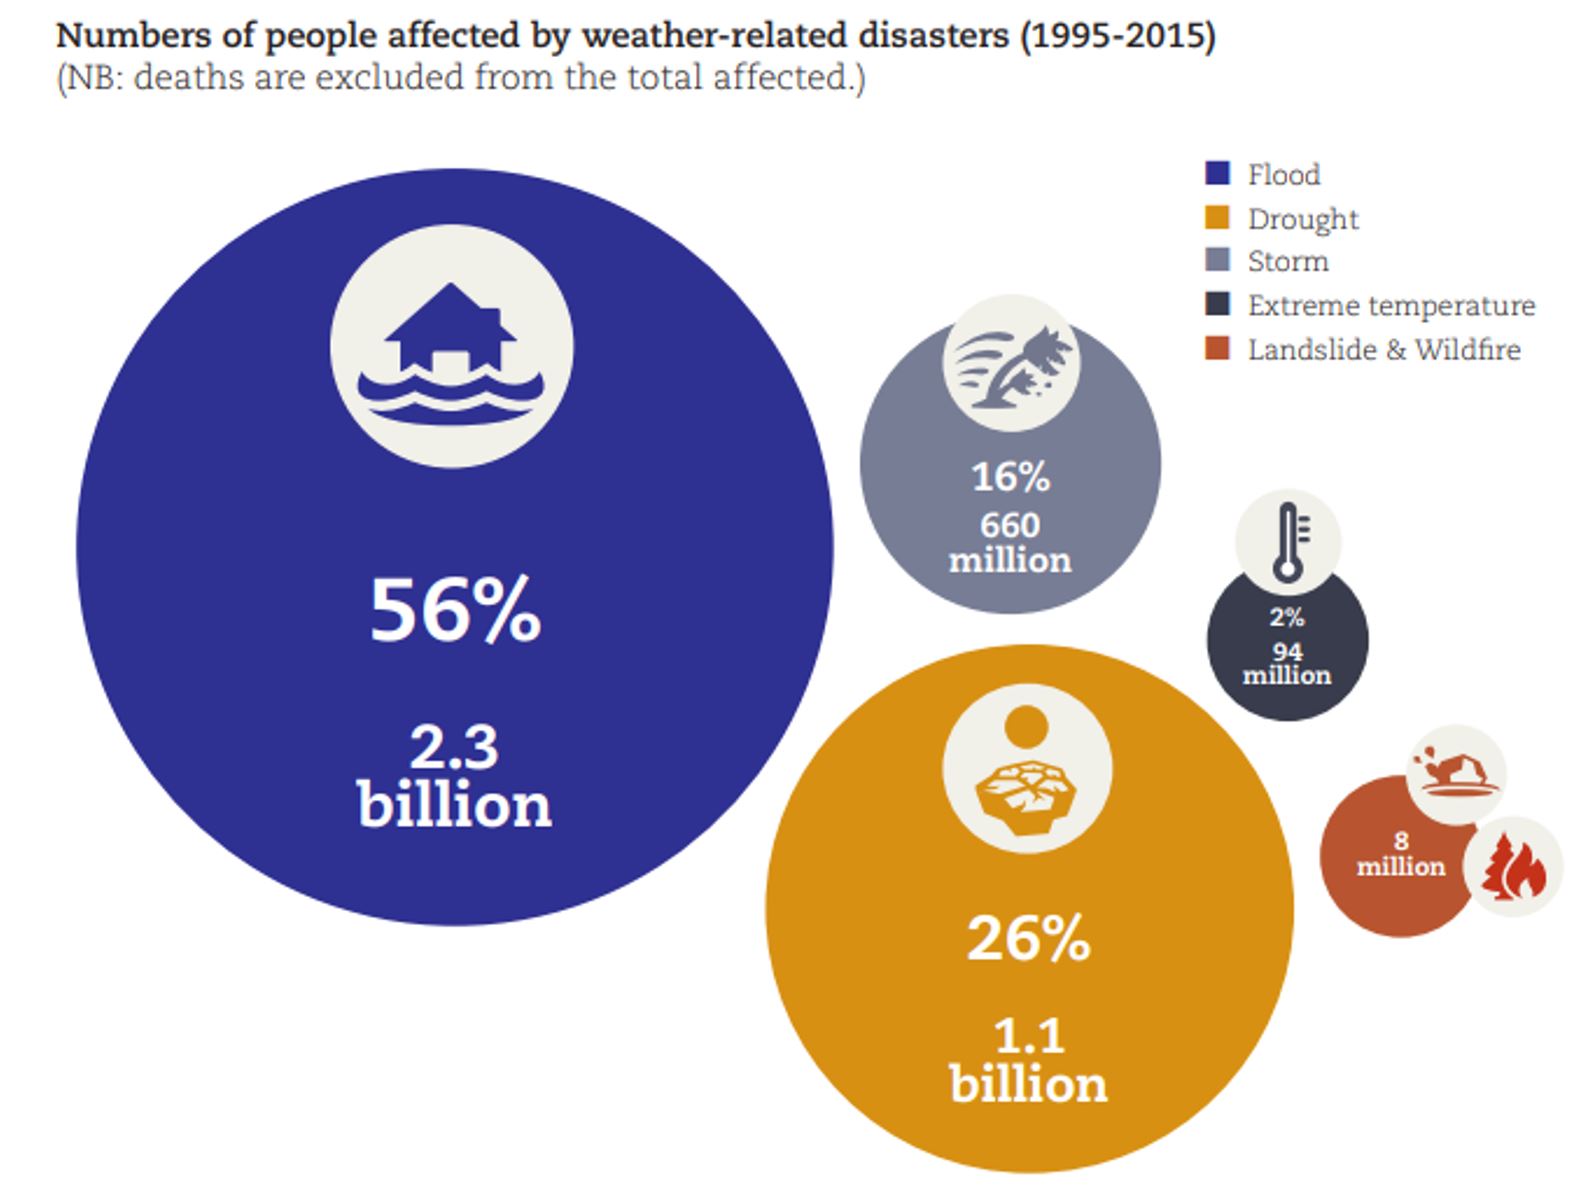
| Natural Disaster | Percent of People | Number of People |
|---|---|---|
| Flood | 56% | 2.3 Billion |
| Drought | 26% | 1.1 billion |
| Storm | 16% | 660 million |
| Extreme Temperature | 2% | 94 million |
| Landslide/Wildfire | <1% | 8 million |
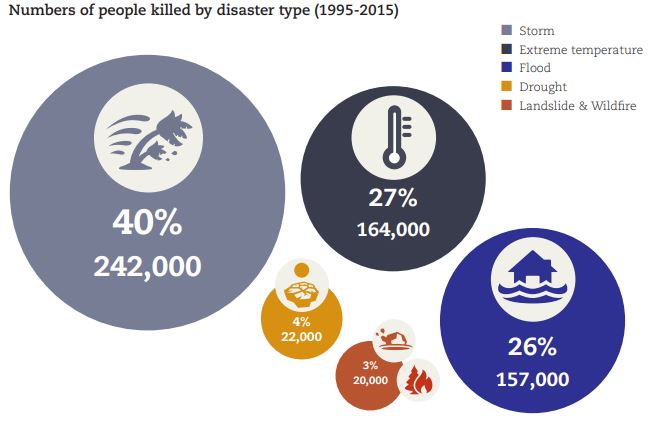
| Natural Disaster | Percent of People | Number of People |
|---|---|---|
| Flood | 26% | 157,000 |
| Drought | 4% | 22,000 |
| Storm | 40% | 242,000 |
| Extreme Temperature | 27% | 164,000 |
| Landslide/Wildfire | 3% | 20,000 |
Extreme heat
The US Global Program on Climate Change [134] defines a heat wave as, "a period of two or more consecutive days where the daily minimum apparent temperature (actual temperature adjusted for humidity) in a particular city exceeds the 85th percentile of historical July and August temperatures for that city". Heat waves have been more frequent and more intense in the last few decades. As the maps and graphs below illustrate, not only are heat waves getting more frequent, the seasons in which they occur are getting longer.
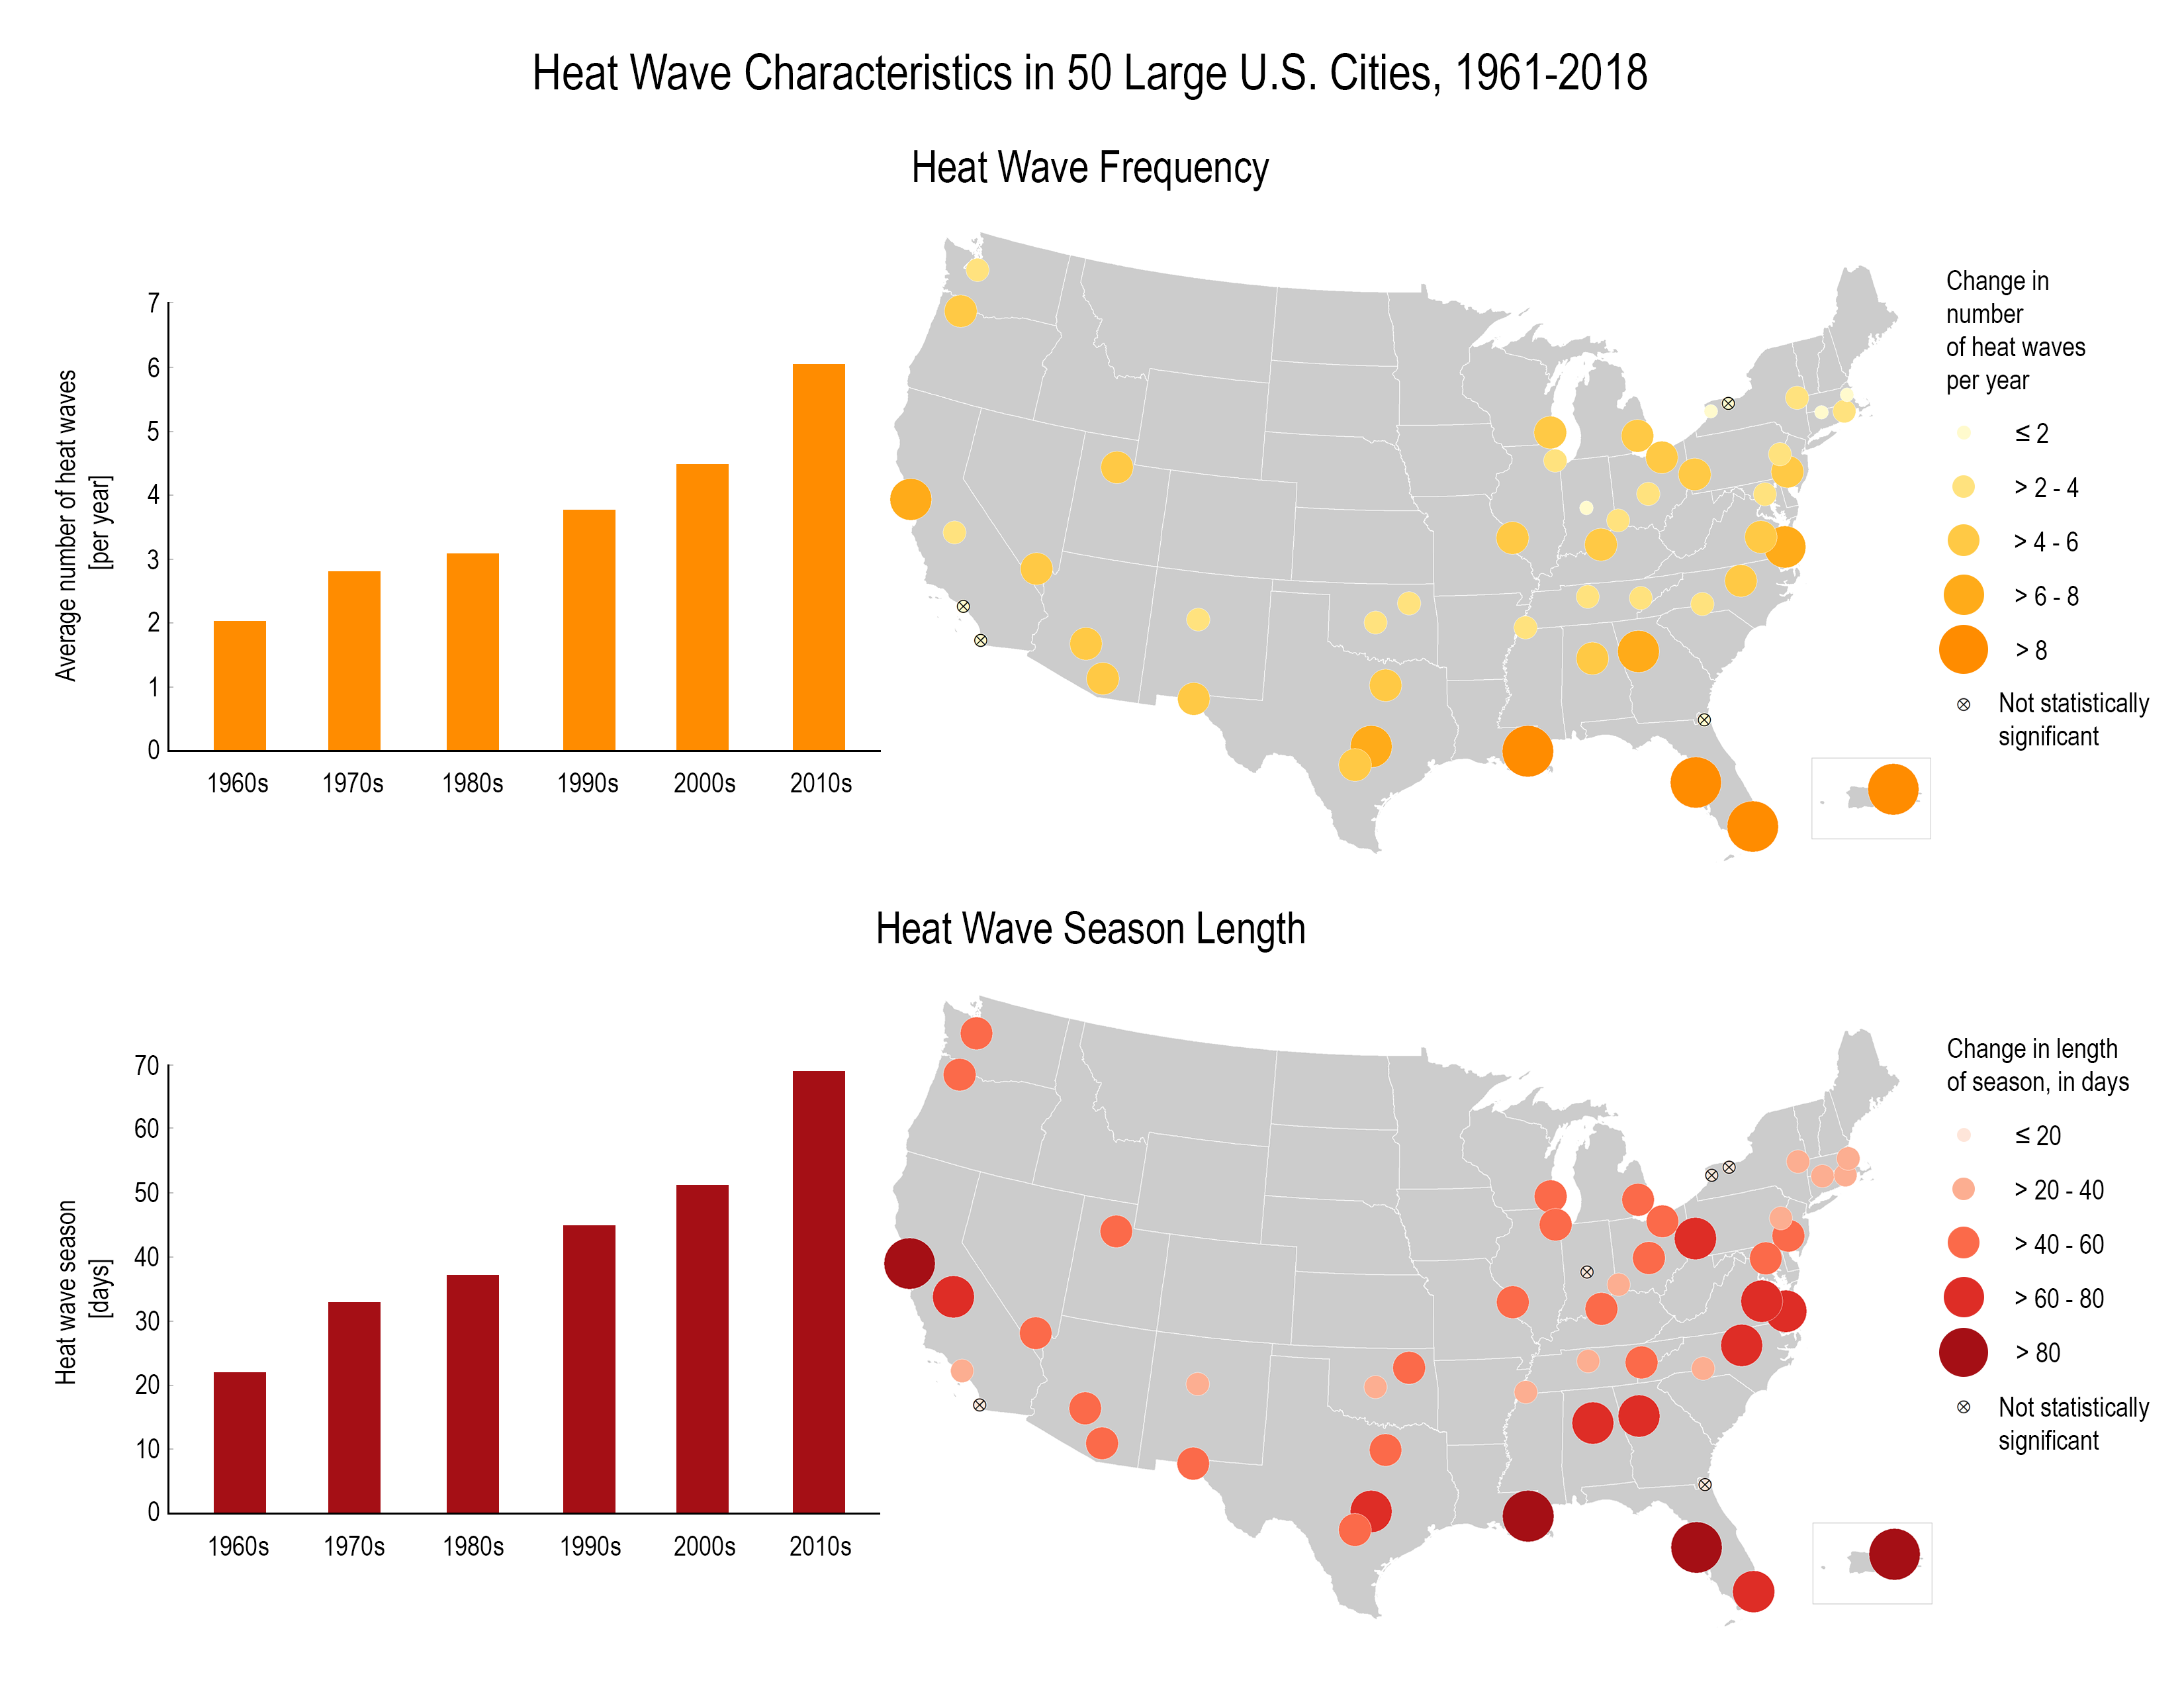
Heat Wave Characteristics in 50 Large U.S. Cities, 1961 – 2018. (Most of the cities are on the coast or the eastern half of the US.)
Heat Wave Frequency
Heat wave frequency has gone up from about 2 per year in the 1960s to 6 in the 2010s. Florida and Louisiana have seen the greatest increase of heat wave s per year.
Heat Wave Season Length
Heat wave season length has gone up almost everywhere especially in Florida, Louisiana, California, and Virginia. It has gone from roughly 20 days in the 1960s to 70 days in the 2010s.
But maybe when you look at these maps you think, "Ok, we're having more heat waves - that might be uncomfortable, but it's not actually affecting my health? Let's take a closer look. Remember in Lesson 3 when we were looking at vulnerability to climate change impacts and we talked about the 2003 heat wave in Europe and the almost 15,000 people in Paris who died (not to mention the 55,000 other people who died across Europe in that heat wave )?
Vulnerability plays a huge role in determining how a person or group of people experience climate change impacts. And yes, for many Americans, more heat waves are nothing more than an inconvenience. Perhaps I don't have air conditioning and will be uncomfortable. But maybe I have the resources (adaptive capacity) to minimize my exposure by staying with a family member with air conditioning, buying some fans, or spending the hottest parts of the day outside my home. My exposure might be similar to someone else's but as a healthy adult with reasonable resources, my sensitivity is lower and my adaptive capacity higher, thereby making me less vulnerable. While we saw that many of those deaths in Paris were elderly women, it's not just who you are that can make you vulnerable, but also what you do for a living. People who work outdoors have an obviously higher exposure to heat wave events and are therefore also more vulnerable to the direct health impacts those events bring (Xiang et al., 2014 [135]).
Let's take a look at a project in the Bronx to help identify residents most vulnerable to heat waves and the adaptation measures they're implementing to keep folks safe during extreme heat events.
DANNY PERALTA: I grew up here in New York City. This time of the year brings a lot of memories back-- the hydrants and smells and, I don't know, all of it. Yeah, yeah. It's a very distinct thing. Hunts Point in the Bronx is inclined to be much hotter than other neighborhoods, primarily because we're surrounded by highways.
24-hour, constant movement creates a lot of different pockets of heat in the neighborhood that you feel all the time. We have a lot of the more vulnerable populations-- folks that just got here from other countries, seniors that are not making any income. They can't maybe afford things like the fans and the ACs or the bill that comes with it.
[SIREN BLARING]
PRESENTER 1: Triple digits-- 103, the projected heat index in the city tomorrow.
PRESENTER 2: Three deaths are being blamed on the extreme heat that started--
CARI OLSON: People in New York City, New Yorkers who are at the greatest risk are getting sick and also dying because of the heat. We wanted to better understand how heat-related illness and death differed across New York City. Are all New Yorkers being impacted the same way? And the answer is that they're not. There are great inequalities. Jaime Madrigano at Columbia University, who was affiliated with CCRUN and NOAA, and researchers here at the health department started to look at how the distribution of heat-related illness and death differs across the city.
JAIME MADRIGANO: In cities, we have something called an urban heat island. The hot air gets trapped in the environment. And because of that, we see people dying of heat wave s every year. And areas of upper Manhattan and the Bronx are particularly heat-sensitive, vulnerable areas. I wanted to see the research that I did inform policy.
NOAA provided support and resources to get the project off the ground. We worked collaboratively with the New York City Department of Health and the New York City Mayor's Office over about a two-year period. Then it was published in 2015. The great thing about doing this study as part of CCRUN and working directly with stakeholders, such as the New York City Department of Health, is that they were able to take the results immediately, bring it up through their management, and direct it over to the New York City Mayor's Office so that it could be acted upon.
DANIELLA HENRY: The heat vulnerability study was the basis for the Cool Neighborhoods NYC Strategy.
BILL DE BLASIO: The city will be providing over 500 cooling centers. That's in city facilities and working with community-based organizations. There's over 500 locations around the city.
DANIELLA HENRY: Even though the city activates all of these cooling centers, individuals aren't going to them as much as we would want them to. We realized that it was really important to reach people within their homes, which was the impetus to create a program like Be A Buddy.
[KNOCKING]
PRESENTER 3: Hey, hey.
PRESENTER 4: What's going on, man?
PRESENTER 3: All right. How are you doing?
[MUSIC PLAYING]
DANNY PERALTA: Door knocking is very important. Having those folks strategically in the neighborhood that are getting to know the right people that are going to need support, that's huge.
PRESENTER 5: Fresh Meadows Library right here, See? That's a cooling center.
DANNY PERALTA: The Point is very excited about this opportunity to work with the Department of Health and the Office of the Mayor.
PRESENTER 6: So we're going to review what we just talked about.
DANNY PERALTA: For us, that means opening up this process for the community to come in and create part of that vision. If you don't give people a voice, they're not going to be an agent of change during these times.
CARI OLSON: We're really trying to think about how to empower the neighborhoods and give them the resources so that they can get to a place that's cool and stay safe.
DANNY PERALTA: If we have the tools, if we have the space to do this work, we can be our own citizen scientists, we can be our own first responders. And that's very, very key.
PRESENTER 7: --what it feels like to stand there with the [INAUDIBLE] on your tongue. Hear the gunshots or fire crackers on the 4 of July.
JAIME MADRIGANO: Heat waves are the biggest killer of all-weather events in the US. I knew that by working with CCRUN, the New York City Department of Health, and other stakeholders that are involved with CCRUN, my research would be used.
CARI OLSON: What we hope is that people can use this research to better understand heat health and also take action in their own communities.
DANIELLA HENRY: It's really important that all New Yorkers know how to stay safe and to know what are those protective measures that you can take and to really think about checking in on those that might really need it.
DANNY PERALTA: Whatever we do now has an impact 20, 50 years down the line. What do we want to see in 2020, 2025, 2035? We're laying the groundwork for that now.
As heat wave frequency and intensity increase in a changing climate, heat wave mortality also rises. This map (a) and graph (b) from that 2003 European heat wave shows the increased mortality across France that summer (this is calculated based on the mortality you'd expect under normal conditions) as well as the mean daily temperature in 2003 and its corresponding daily mortality compared to those values for the 1999-2002 time period.
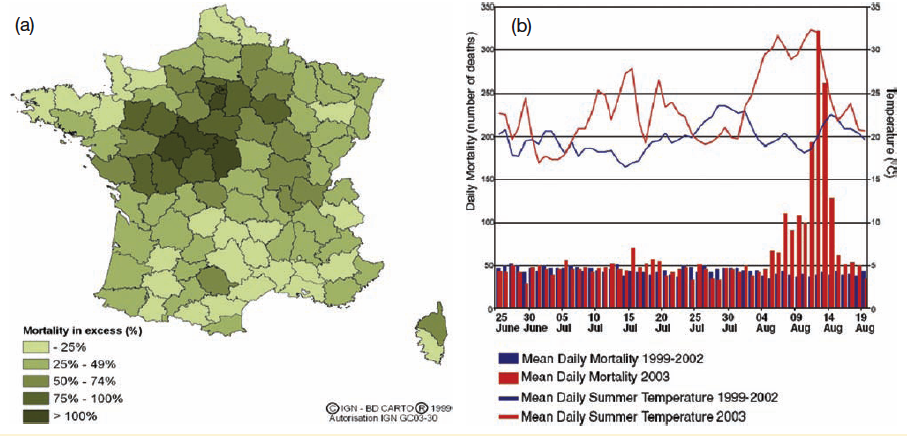
NOAA's Billion-Dollar Weather and Climate Disaster Database [136] (yep, that's really a thing) includes four drought/heat wave incidents since 1980 in its list of deadliest events. It is interesting to note that heat wave mortality varies with location: in Russia, South Asia, and Southeast Asia, deaths were primarily in rural areas; in the US, deaths were almost exclusively in urban areas; and in southern Europe, deaths were in both rural and urban areas.
Extreme cold
Wait. We just spent all that time talking about all of these more frequently occurring and more severe heat waves. Extreme cold? Although very cold days, very cold nights, and total frost days have declined over the past few decades, cold waves are still a problem and more recent studies are exploring the link between a changing climate and periods of extreme cold weather. This issue got a fair bit of attention in the early winter months of 2019, as the eastern US found itself subject to another polar vortex event. Cold weather is often a favorite talking point for overly simplistic climate denial, but in reality, the connection is much more complex and cold weather is anything but an indication that climate change isn't real. A changing climate is destabilizing the jet stream and allowing Arctic weather to dip down to lower latitudes than it otherwise would here in the US. Luckily, many popular news outlets tried to get in front of this by offering explanations of how climate change and cold snaps are related (see National Geographic's Why Cold Weather Doesn't Mean Climate Change is Fake [137], Climate Reality Project's Yes It's Cold, and Yes Our Climate is (Still) Changing [138], or Scientific American's Why Global Warming Can Mean Harsher Winter Weather [139]).
Much like heat waves, vulnerability is determined in a large extent to one's exposure. The most vulnerable among us are those people without adequate housing or reliable heat sources. People with existing health conditions or who are very young or very old are more sensitive. This NY Times article, Extreme Cold Weather Spreads East [140], offers a glimpse at many of the human health issues authorities were dealing with during this cold wave event in early 2019.
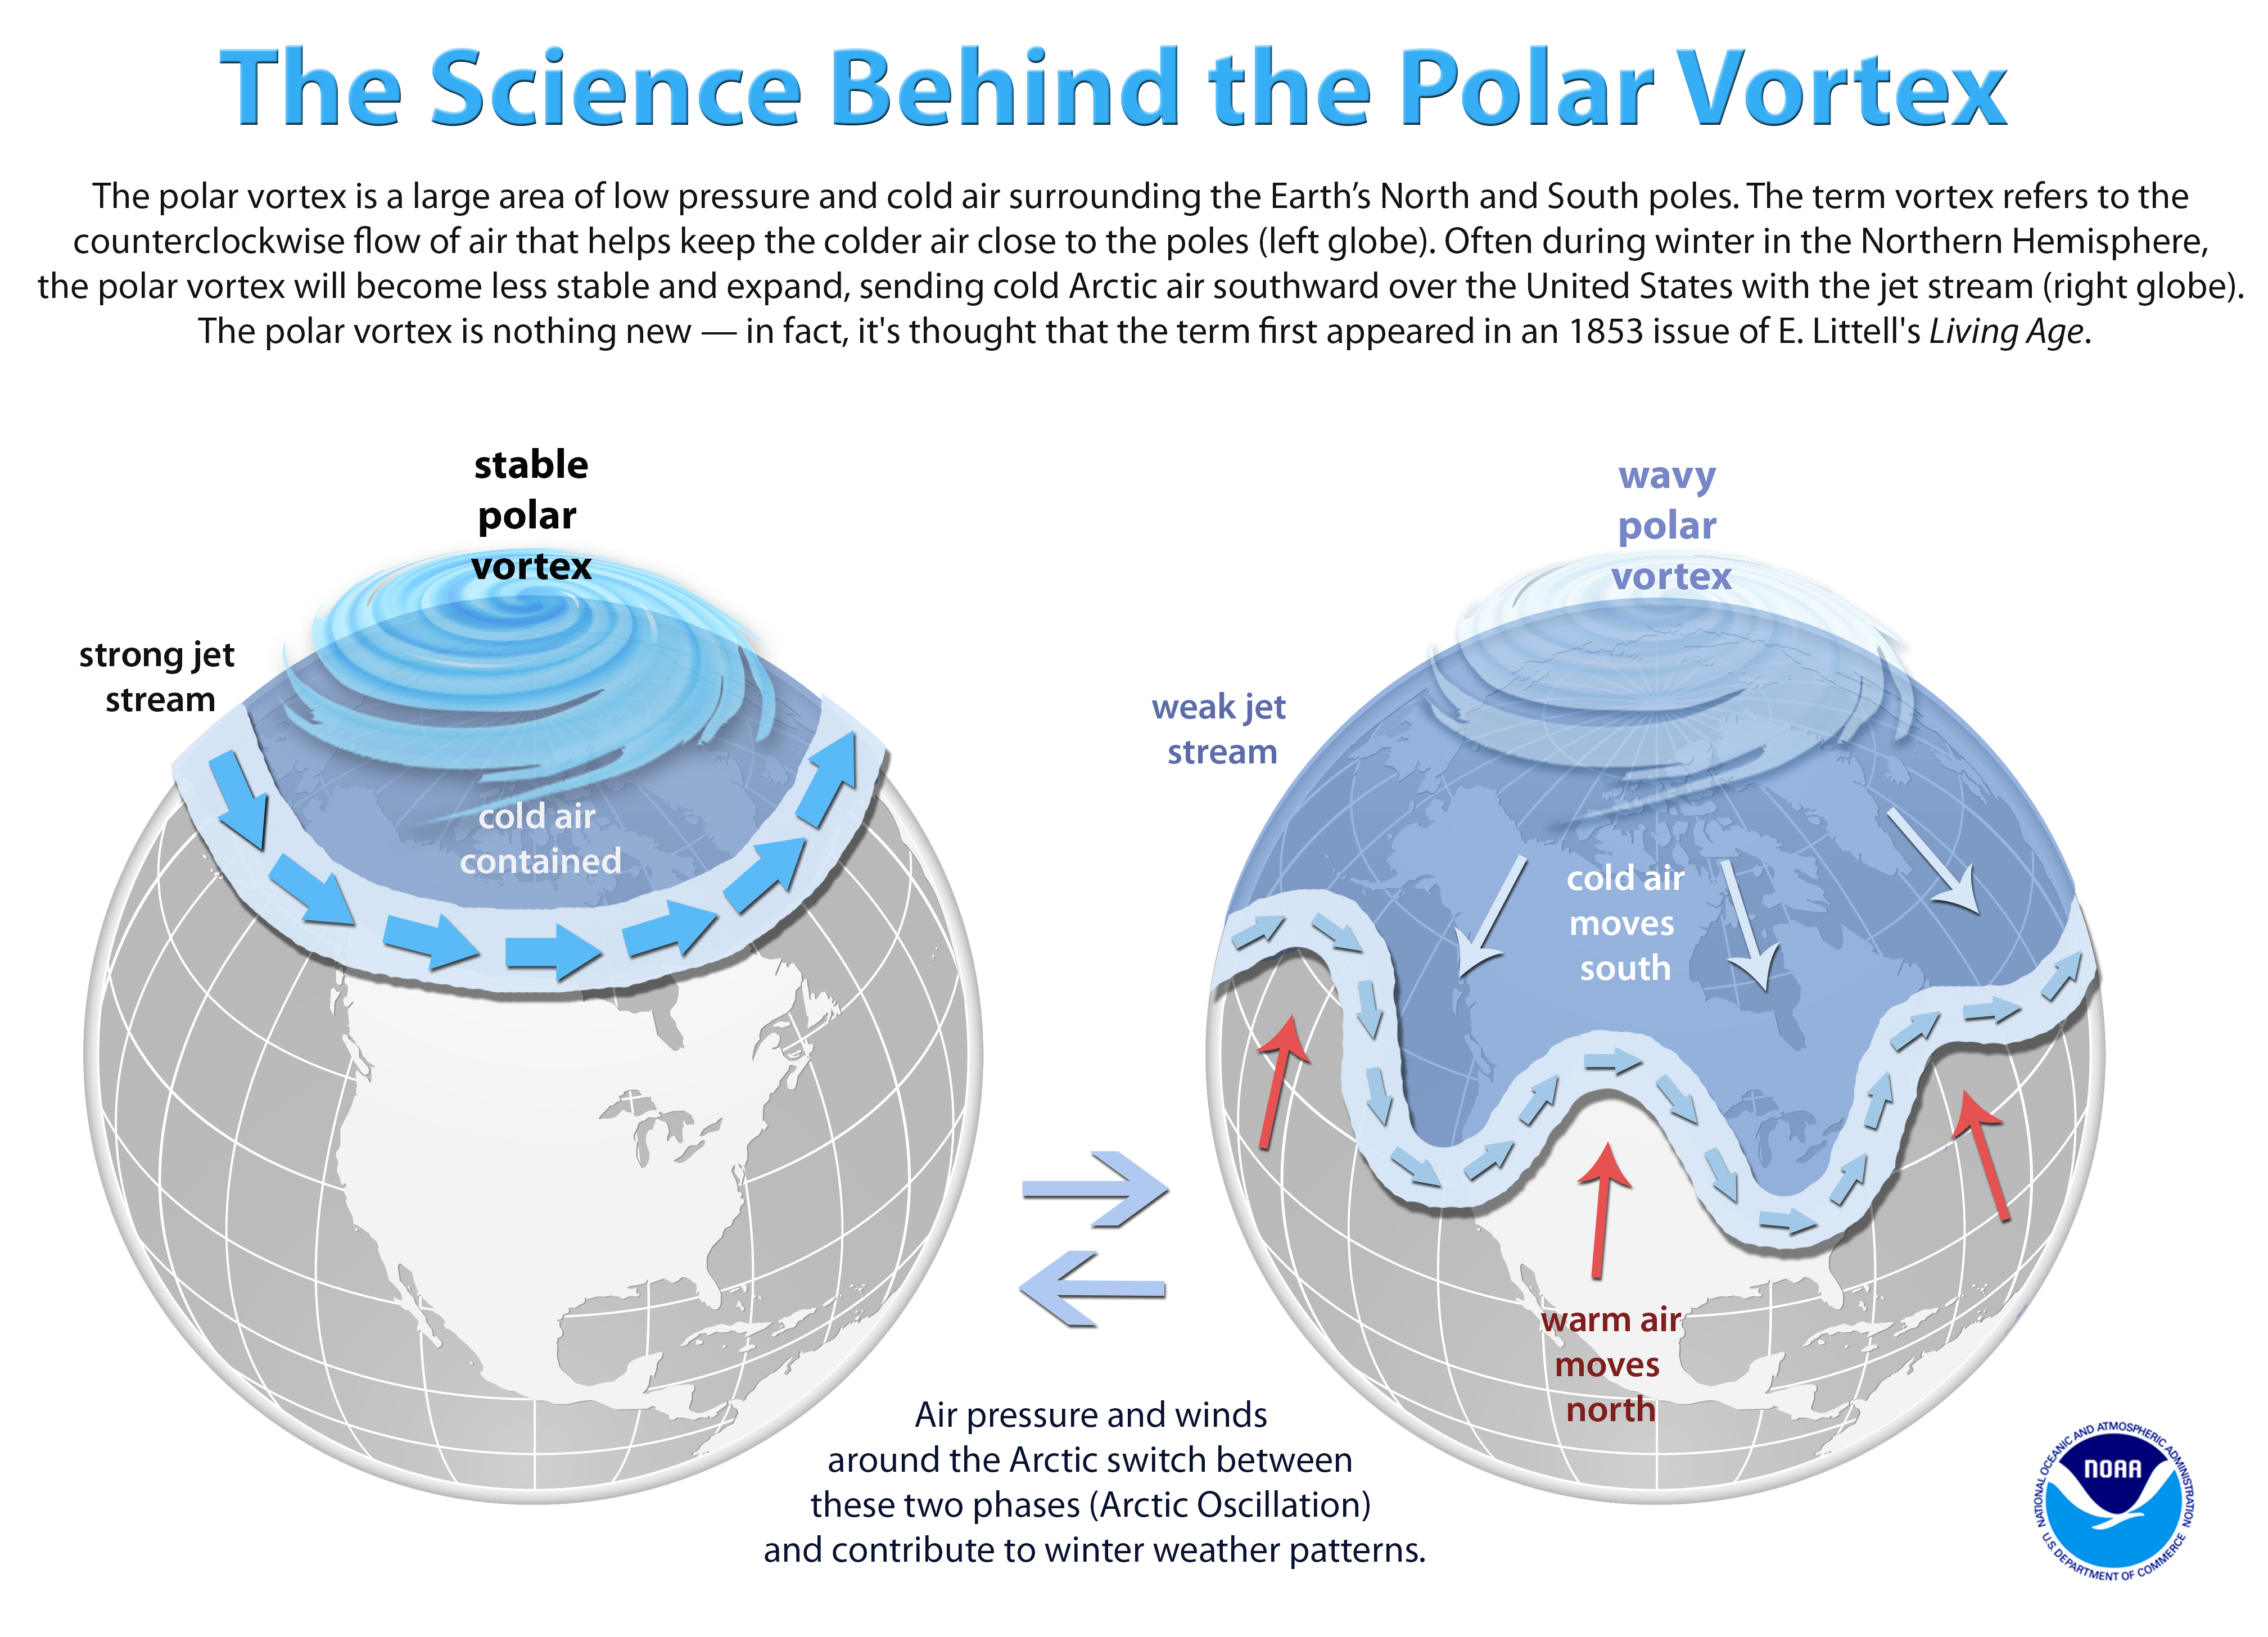
Image Reads:
“The polar vortex is a large area of low pressure and cold air surrounding the Earth’s North and South poles. The term vortex refers to the counterclockwise flow of air that helps keep the colder air close to the poles (left globe). Often during winter in the Northern Hemisphere the polar vortex will become less stable and expand, sending cold arctic air southward over the United States with the jet stream (right globe). The polar vortex is nothing new – in fact, it’s thought that the term first appeared in an 1853 issue of E. Littell’s Living Age.”
Image Shows:
Left globe: A strong jet stream and a stable polar vortex keep the cold air contained.
Right globe: A weak jet stream and wavy polar vortex allows the cold air to move south. Warm air moves north and creates pockets of warm and cold.
Between the globes, the image says, "Air pressure and winds around the Arctic switch between these two phases (Arctic Oscillation) and contribute to winter weather patterns."
Other Extreme Weather Events
We'll be looking at extreme weather events in more detail in Impacts on Earth: Climate and Weather [142], but let's talk a bit about the specific human health dimensions of extreme weather. Obviously, heat waves and cold waves are forms of extreme weather too, but we tend to break those out separately from storms, floods, and droughts (though we can certainly group droughts and heat waves together). This is a recurring theme with the topics we're discussing this semester - they're all inextricably linked, and there's never a good starting point or logical progression.
Indirect Impacts of Climate on Health
Indirect impacts of climate on human health are ones in which the human body is not immediately affected by the climate system but instead feels the delayed impacts through some intermediary. Indirect impacts affect many more people in many more ways than the direct impacts. The list is long and includes, among others:
Food- and Water-Borne Disease Outbreaks
Several food-borne pathogens are spreading due to climate change. Depending on the crop type, drought and excess moisture encourage crop pests and spread molds. Climate-driven rusts, blights, and rots are devastating already stressed crops and thereby indirectly affecting human health through decreased food security.
But it's not just our crops falling ill from increased pathogens in a changing climate. Instances of some types of pathogens that make their way to people are also on the rise. The US Global Change Research Program's Climate and Health Assessment from 2016 describes some of these pathways and consequences (and in their bulleted list [144], they include ample citations to support each bullet point - I'm linking out to that directly in hopes the links there are updated as necessary):
- "Higher temperatures can increase the number of pathogens already present on produce and seafood.
- Bacterial populations can increase during food storage which, depending on time and temperature, can also increase food spoilage rates.
- Sea surface temperature is directly related to seafood exposure to pathogens.
- Precipitation has been identified as a factor in the contamination of irrigation water and produce, which has been linked to food-borne illness outbreaks.
- Extreme weather events like dust storms or flooding can introduce toxins to crops during development.
- Changing environmental conditions and soil properties may result in increases in the incidence of heavy metals in the food supply."
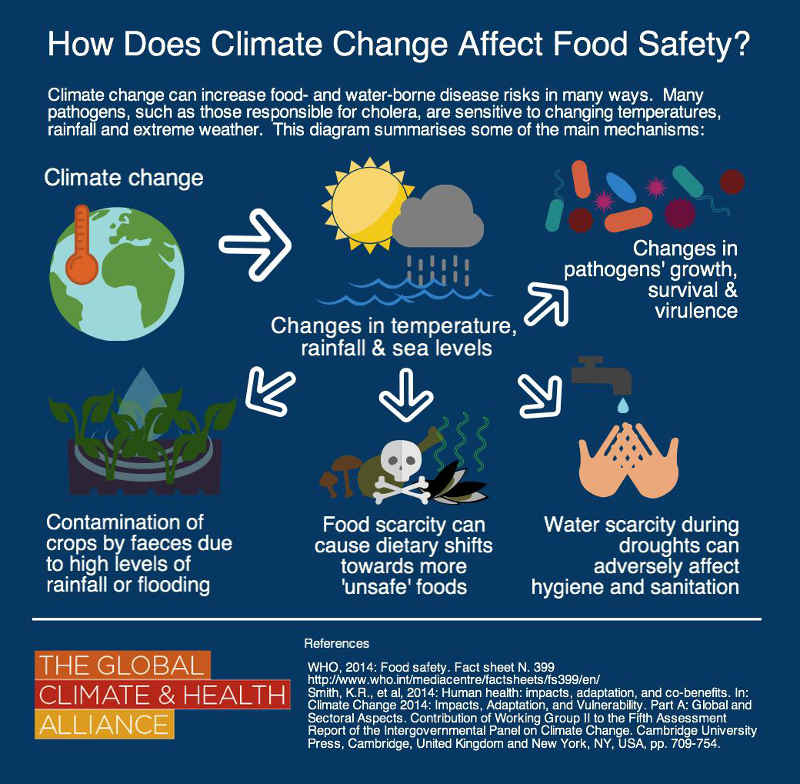
Climate change causes changes in temperature, rainfall and sea levels. This affects the contamination of crops by faeces due to high levels of rainfall or flooding. It can cause food scarcity which can cause dietary shifts towards more ‘unsafe’ foods. It can also cause changes in pathogens’ growth, survival & virulence. Additionally, water scarcity during droughts can adversely affect hygiene and sanitation.
Water-borne diseases are closely related to weather and climate. Cholera, cryptosporidiosis, and several other significant diseases are spread by fecal contamination of water supplies and are often closely associated with floods and heavy downpours. In other cases, drought can concentrate disease pathogens in pools and low flows. Climate change is causing increased intense rainfall events in many parts of the world and drought in others; it is not surprising that water-borne illness is a growing problem in those areas with the most extreme changes. The key to understanding the spread of water-borne illness in a changing climate is exposure. As this image shows, various factors (all from human activity) are increasing our exposure to these illnesses.
- increasing frequency and intensity of precipitation events
- increasing sea surface temperatures
- runoff from agriculture and our built environments
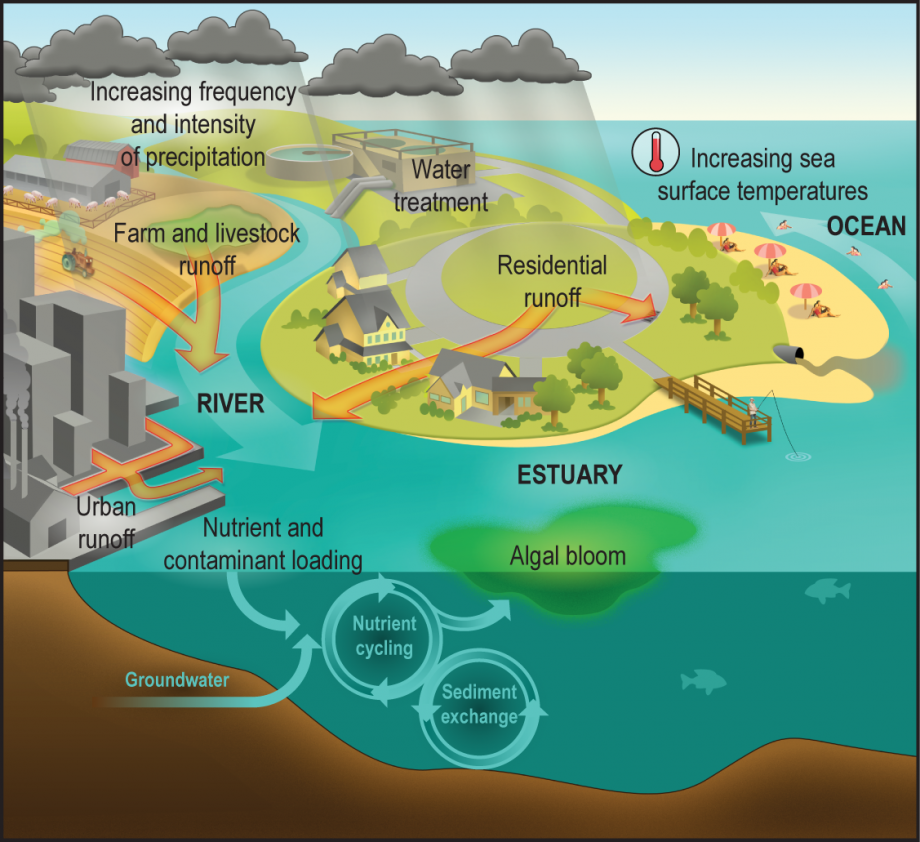
Vector-borne diseases
Disease vectors, such as mosquitos and ticks, are moving into new areas as warmer, wetter climates push poleward and upslope. The spread of malaria and dengue fever, for instance, is believed to be at least partly due to mosquitos expanding their range with the changing climate.
Click through this series of maps illustrating the projected expansion of mosquitos carrying Aedes-borne viruses (dengue fever* and Zika among them). These projections are based on an RCP (representative concentration pathway [147]) of 8.5 which is really a worst-case scenario in which we continue on with our business as usual practices and fail to mitigate climate change. So, with any luck, this won't happen! But, you can also see a set of projections based on a more plausible RCP with the original paper (Ryan et al., 2019 [148]). These projections demonstrate the rapid increase in exposure for highly populated areas, some expansion into new areas - meaning newly vulnerable populations.
- Ok, but if it's getting so much warmer, then maybe it'll be TOO warm for these mosquitos in places they currently haunt, right? Well, this is true to a very small degree. But remember, the higher latitudes are warming more dramatically than the tropics, so it's not uniform warming across the globe.
*In 2019, countries across tropical Asia saw higher than usual instances of dengue fever.
- Bangladesh Reports More than 13,000 Dengue Cases in July [149] (Khan and Chappell, 2019)
- Philippines Declares National Alert After 465 Dengue Deaths [150] (The Straits Times, 2019)
- Peak Dengue Season in Singapore: 8000 Cases, 5x Last Year's Number [151] (Outbreak News Today, 2019)
Let's take a look at another vector, ticks. Look at the massive growth in reported cases of Lyme Disease [152] between 1996 and 2014. Many of you live in Pennsylvania or surrounding states, so you're likely all too familiar with ticks and Lyme Disease. Most of us have a story or two of pulling a deer tick off ourselves, our children, or our pet. I've spared you a close-up image of a deer tick on this page, you're welcome.
- But isn't it possible that people are just doing a better job of reporting Lyme Disease now than they did in 1996? That's certainly part of what you see here, but it isn't the whole story. These northern latitude states are warming faster than the rest of the country, and as such as are becoming more hospitable habitat into which deer ticks are expanding. Additionally, if places are not getting as cold over the winter as they used to, then the deer ticks might be active for a longer period of time each year. All of this increases our exposure to this potential impact on human health.
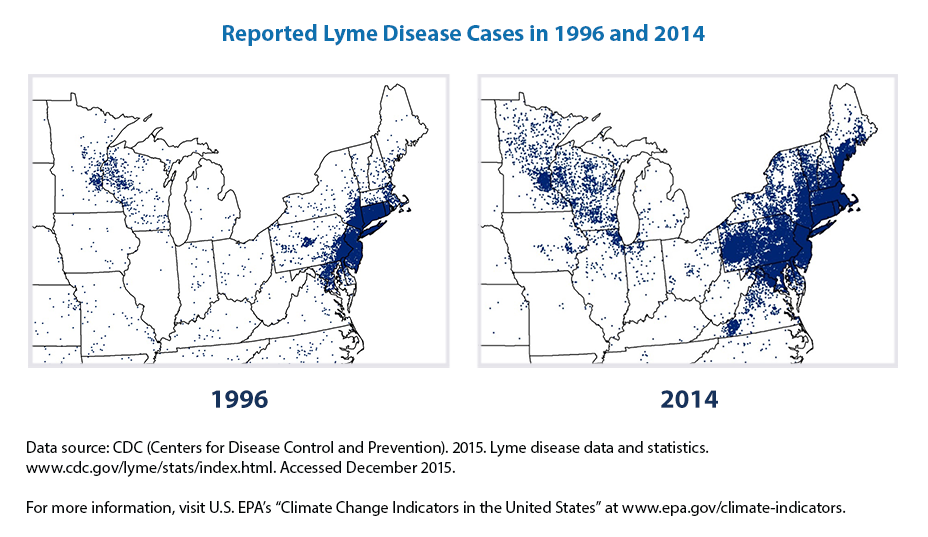
Rodents and their fleas are also a concerning disease vector with changing distributions in a changing climate. For example, Hantavirus borne by fleas on deer mice is closely linked to the ENSO cycle in the US Southwest (Hjelle and Glass, 2000 [154]), and evidence points to climate-related distribution changes in Europe of Hantavirus borne by other rodents (European Center for Disease Prevention and Control, n.d. [155]). In Brazil, warmer temperatures mean an increased expansion of sugarcane production. Rodents (particularly deer mice) find sugarcane quite tasty and estimates suggest that this combination of increased sugarcane production and warming temperatures could expose an additional 20% of Brazilians [156] to this potentially fatal virus.
Poor Air Quality
Sometimes, when I'm having a conversation about climate change (as one does!), I hear people talk about our greenhouse gas emissions as pollutants. I've personally never really thought of them that way (even though, perhaps I should because they do overlap), because I tend to think of air pollution as particulate matter - soot, big puffs of black exhaust from the back of a truck, things like that. Greenhouse gas emissions seem categorically different to me - like secret pollutants we can't see. However, it's important to understand that regardless of how you conceive of GHGs and pollutants, our GHG emissions are affecting the more traditional air pollutants in ways it's important for us to understand.
Air quality and its effect on human health is in large part a function of the weather, which creates conditions that promote or depress the formation, concentration, deposition, dispersion, and transport of pollutants. Changing climate means changes in location, timing, and intensity of air pollution events. Ground-level ozone, the most noxious constituent of photochemical smog, is associated with a host of health problems and is strongly and positively correlated with temperature and solar radiation; increases in temperature and longer summer seasons correspond to increases in general ozone concentrations and the number of days violating air quality standards. Here's a short EPA podcast from 2016 called The Future of Breathing: Connecting Air Quality and Climate Change [157] I'd like you to spend 2 minutes on (or read its transcript).
Particulate matter (PM) has even greater health effects than ozone; this pollutant is also linked to temperature and humidity in its formation. Forest fires also release many particulate air pollutants and toxic gases and are known to affect health. Forest fires are on the increase worldwide and forecast to escalate dramatically in the future.
Let's circle back to thinking about vulnerability and how people might experience this type of impact of a changing climate differently than those around them. The American Lung Association [158] estimates 26 million people in the US are living with asthma. Poor air quality is just one potential indirect impact on human health that affects people with asthma more acutely.
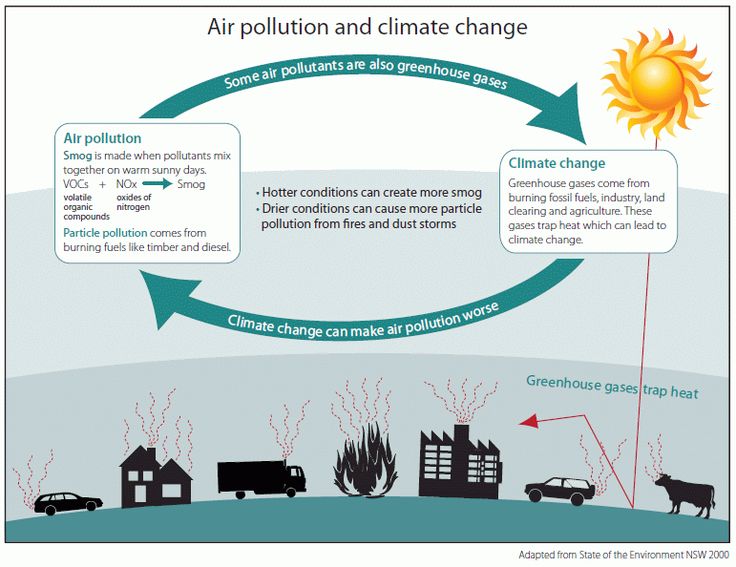
Air pollution and climate change cycle.
Air pollution: Smog is made when pollutants mix together on warm sunny days. Volatile organic compounds + nitrogen oxides = smog. Particle pollution comes from burning fuels like timer and diesel. Hotter conditions create more smog and drier conditions can cause more particle pollution from fires and dust storms.
Air pollution leads to climate change with an arrow that reads: some air pollutants are also greenhouse gases.
Climate Change: Greenhouse gases come from burning fossil fuels, industry, land clearing, and agriculture. These gases trap heat which can lead to climate change.
Climate change leads to air pollution with an arrow that reads: Climate change can make air pollution worse.
Seasonal Allergens
One of the biggest climate impacts on human health is through seasonal allergens. Over the past few decades, spring is coming earlier and fall is ending later in the Northern Hemisphere, increasing the length of the allergy season. (Do you hear the collective groan of the roughly 30% of the population who suffer from seasonal allergies?) Changing distributions of plants and molds (thanks to extreme precipitation events and changing temperature patterns) are causing the spread of allergens into areas where they did not exist earlier. There is also some evidence that the rising atmospheric CO2 concentration is fertilizing some allergen-rich species, like ragweed (Albertine et al., 2014 [160]).
What do you notice about this map? The northern latitudes of the US and the western part of the country are seeing rapidly expanding numbers of frost-free days relative to the southern US. It's just another reminder that while impacts are global in nature, they materialize very differently across smaller geographic scales.
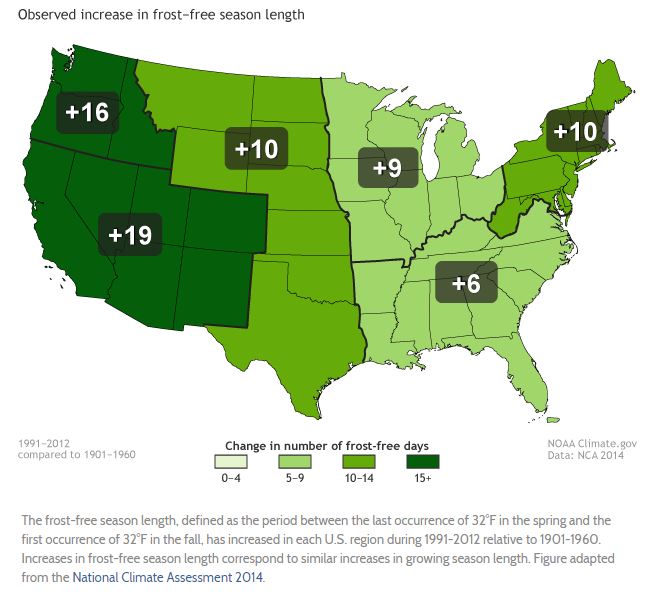
Mental health and well-being
For this week's lesson, let's focus specifically on the effects climate change impacts can have on one's mental health. This is separate from thinking about the mental health implications associated with people worrying about climate change in general (which is a rapidly growing issue). We'll probably have a chance to tackle that in Unit 3: Solutions.
This area seems a bit understudied compared to the more obvious impacts and isn't discussed as much publicly. Flooding, droughts, Lyme Disease, asthma - we've talked about a lot of potential issues connected to climate change that might seem more connected. But, the mental health implications of living through many of these impacts is of serious consequence and worth our time to better understand.
Mental health is inextricably linked to physical and community health (see those bidirectional arrows between the physical, mental, and community symbols - it's all connected!).
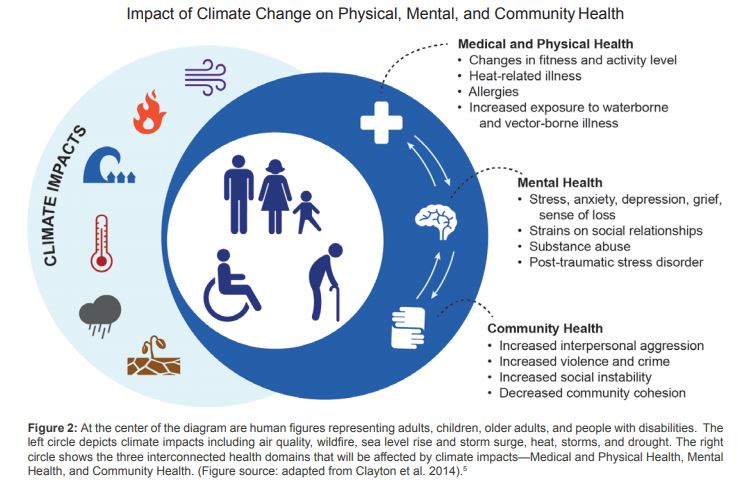
Climate impacts more than just the weather:
Medical and Physical Health
Changes in fitness and activity level
Heat-related illness
Allergies
Increased exposure to waterborne and vector-borne illness.
Mental Health
Stress, anxiety, depression, grief, sense of loss
Strains on social relationships
Substance abuse
Post-traumatic stress disorder
Community Health
Increase interpersonal aggression
Increased violence and crime
Increased social instability
Decreased community cohesion
Additional Pressures on Health
It is important to recognize that climate change is neither the primary driver of human health today nor will it be in the future. Beyond genetics, access to these three factors are fundamental to the good health of an individual and a society.
- Safe water and good sanitation - More people die each year from this factor than from war and all other forms of violence. Most of these deaths occur in children less than five years of age. More than two and a half billion people do not have access to good sanitation; nearly all of those are located in the developing world. Learn more about these concerns by visiting the CDC's Global WASH Fast Facts [163]. Does it surprise you to learn that 1 in 3 people in the world don't have access to the sanitation that many of us take for granted?
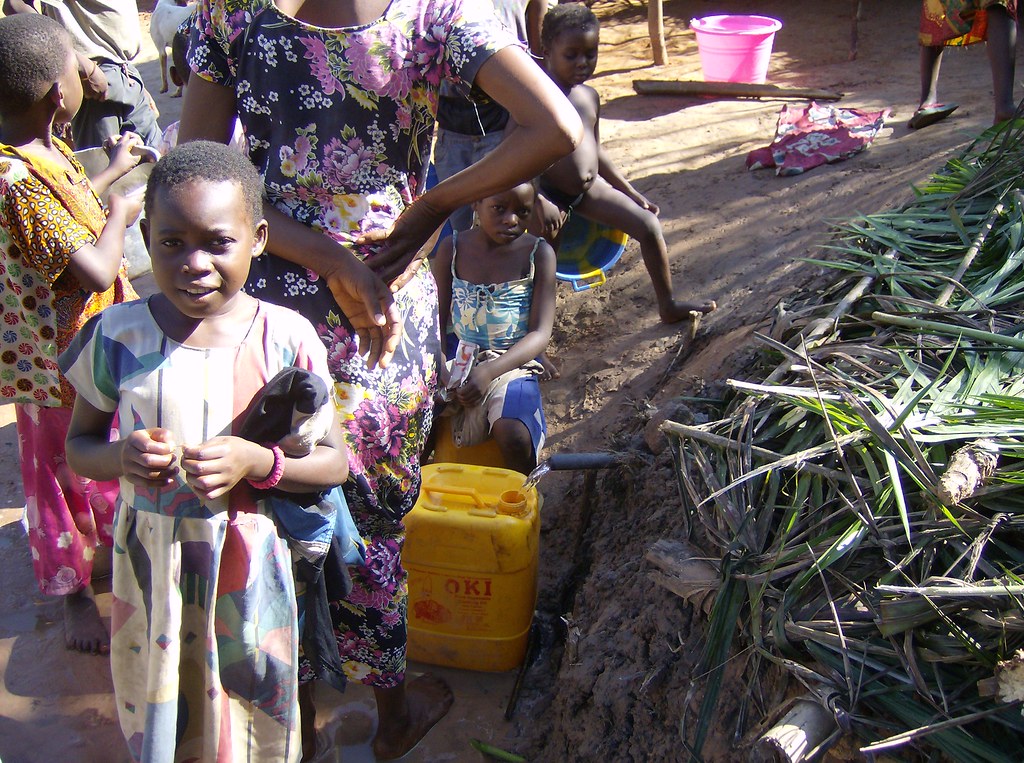 Children collecting drinking water"Do You Dream About Water?" [164]by Woody Collins [165] from Flickr is licensed under CC BY-NC-SA 2.0 [166]
 - Nutritious food and food security - Undernourished people receive less than the minimum amount of food needed for sound health and growth. The World Health Organization puts the number of undernourished people at about one in nine people [167] and nearly all of those live in the developing world. And while some of the statistics [168]surrounding access to health food are quite sobering, there are glimmers of good news in there, too. Let's take a look at the prevalence of undernourishment as a percent of the population by global region in 2000 and 2016 (the images below are static and a bit squished, but you can watch this animation over the 16 year period [169] if you're interested). What do you notice? With the exception of North America, all other global regions reduced their share of the population experiencing undernourishment - some rather substantially!
Indeed, food security linked to extreme climatic events is and will continue to be one of the biggest impacts of the changing climate. Many areas of the globe –– particularly in Africa –– lack basic food security. Apart from starvation, malnutrition weakens the populations of these areas and leaves them open to a host of illnesses; malnutrition-induced morbidity and mortality is greatest among the very young and the very old. Droughts and floods aggravate an already bad situation, reducing yields and sometimes causing crop failure, further weakening an already vulnerable population.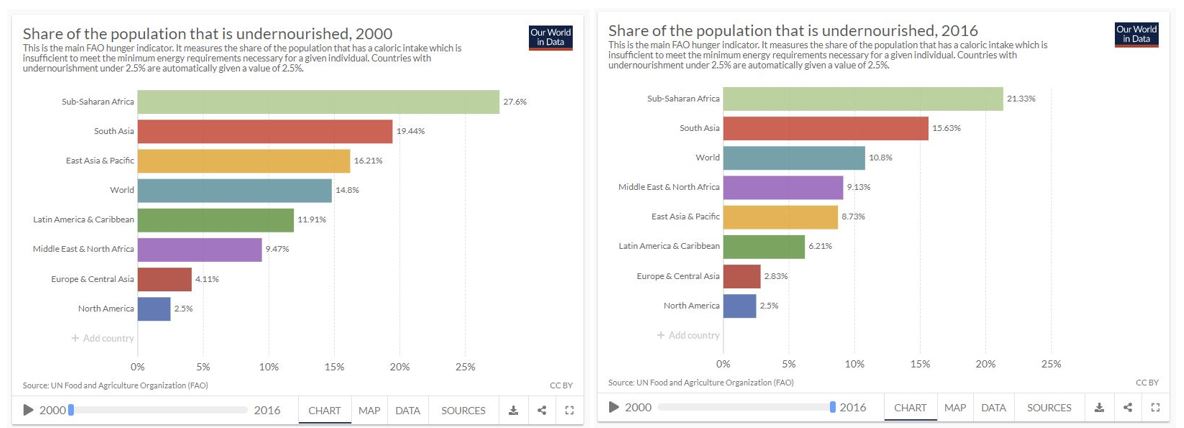 Comparison of the share of the population that is undernourished 2000 vs 2016Click here for a text alternative to the figure above
Share of the Population that is Undernourished Country 2000 2016 Sub-Saharan Africa 27.6% 21.33% South Asia 19.44% 15.63% East Asia & The Pacific 16.21% 8.73 World 14.8% 10.8% Latin America & Caribbean 11.91% 6.21% Middle East & North Africa 9.47% 9.13% Europe & Central Asia 4.11% 2.83% North America 2.5% 2.5% Credit: Our World in Data - Hunger and Undernourishment [169] by Roser and Ritchie, 2019 is licensed under CC BY 4.0 [11] - Health care - People in developed countries spend huge sums on health care while less-developed countries spend little. Per capita health care spending by the top 5 percent of the world population is about 4,500 times the spending of the lowest 20 percent. As the graph below indicates, there is a positive relationship between health care spending and life expectancy, with low health care spending associated with low life expectancy and high spending associated with high life expectancy. There are anomalies. For instance, Cuba, which has essentially the same life expectancy as the US, has excellent health care but spends only about an eleventh [170] of what the US spends per person on health care. Despite the fact that it spends about twice as much per capita on health care as other developed countries, the US is only ranked 45th in life expectancy [171] (this ranking varies a bit by source, with some estimates as high as the mid twenties but it still represents a point for discussion - the US is paying a lot for its health care but not realizing commensurate outcomes for that cost). Another measure of health care access is doctors per 100,000 people. Here the disparity between developed and less-developed countries is stark. Again, there are anomalies, such as the former communist countries, which have relative high densities of physicians. Moreover, there can be large inequalities even within the most-developed countries where rural areas often have difficulty attracting doctors.
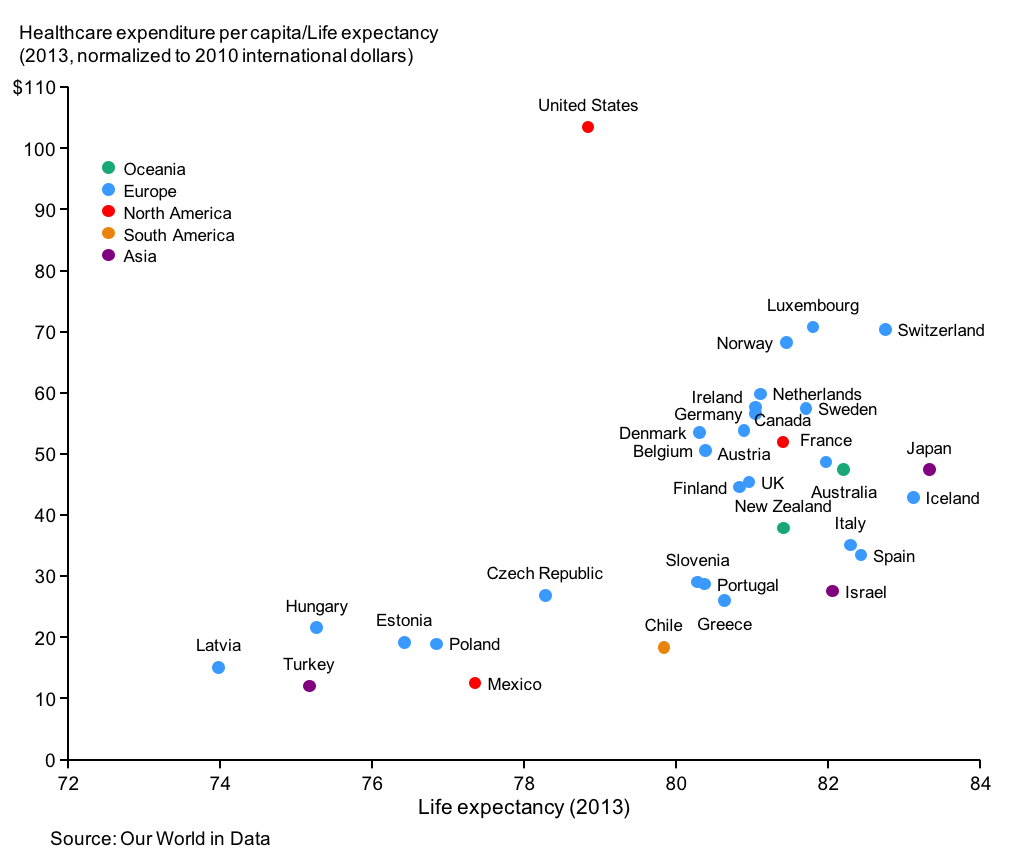
In summary, individuals who live in developed countries generally have better access to safe water and sanitation, good nutrition, and health care. People who live in the least-developed nations often have unsafe water and poor sanitation, inadequate nutrition, and little access to health care. Therefore, with or without climate change, health outcomes vary based on a person's country of residence and its level of development.

- 3.1 Maternal mortality
- 3.2 Newborn and child mortality
- 3.3 Communicable diseases
- 3.4 Noncommunicable diseases and mental health
- 3.5 Substance abuse
- 3.6 Road traffic injuries
- 3.7 Sexual and reproductive health
- 3.8 Universal health coverage
- 3.9 Mortality from environmental coverage
- 3.a Tobacco control
- 3.b Development assistance vaccine coverage
- 3.c Health workforce
- 3.d National and global health risks
- 1.a Mobilization of resources
- 2.2 Child malnutrition
- 6.1 Drinking water
- 6.2 Sanitation and hygiene
- 7.1 Clean household energy
- 11.6 Clean cities
- 13.1 Natural disasters
- 16.1 Violence
- 17.19 Statistical capacity-building
Food and Water
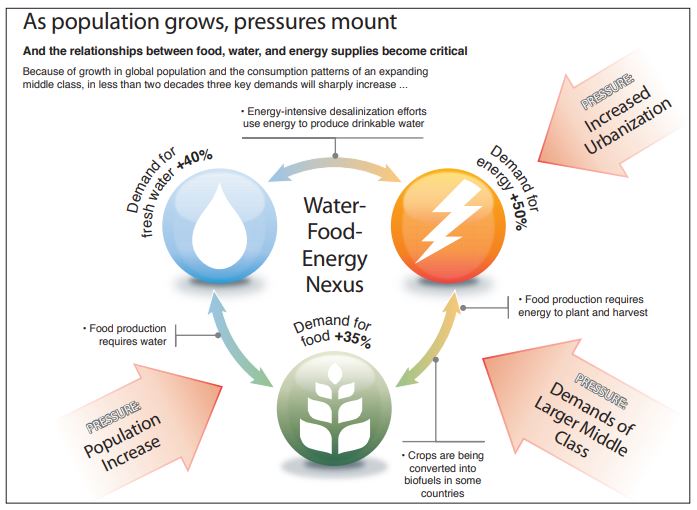
Image reads: As the population grows, pressures mount and the relationships between food, water and energy supplies become critical. Because of growth in the global population and the consumption patterns of an expanding middle class, in less than two decades three key demands will sharply increase.
Image is a circular flow chart:
Demand for freshwater +40%
Pressure: population increase
*Food production requires water
Demand for food +35%
Pressure: Population increase & Demands of a larger middle class
*Crops are being converted into biofuels in some countries
Demand for energy +50% Pressure: Increased urbanization
*energy-intensive desalination efforts use energy to produce drinkable water
*Food production requires energy to plant and harvest
With a growing global population that's becoming increasingly urban and aspiring to middle class lifestyles, the demands on our food, water, and energy systems is expected to grow considerably in coming decades. Add climate change into the mix, and this creates a very precarious nexus of demands for basic needs like food and water.
Impacts on Food
Food insecurity linked to climate change impacts will be one of the most pressing consequences of a changing climate. Many areas of the globe –– particularly in Africa –– lack basic food security. Droughts and floods aggravate already bad situations, reducing yields and sometimes causing crop failure, further weakening already vulnerable populations.
This week, we'll explore just a few examples of the impacts of climate change on our global food security, recognizing that the impacts are complex, intertwined, and far-reaching. These examples include:
- changes in growing season duration and timing;
- changes in growing regions;
- more extreme fluctuations in temperature and precipitation.
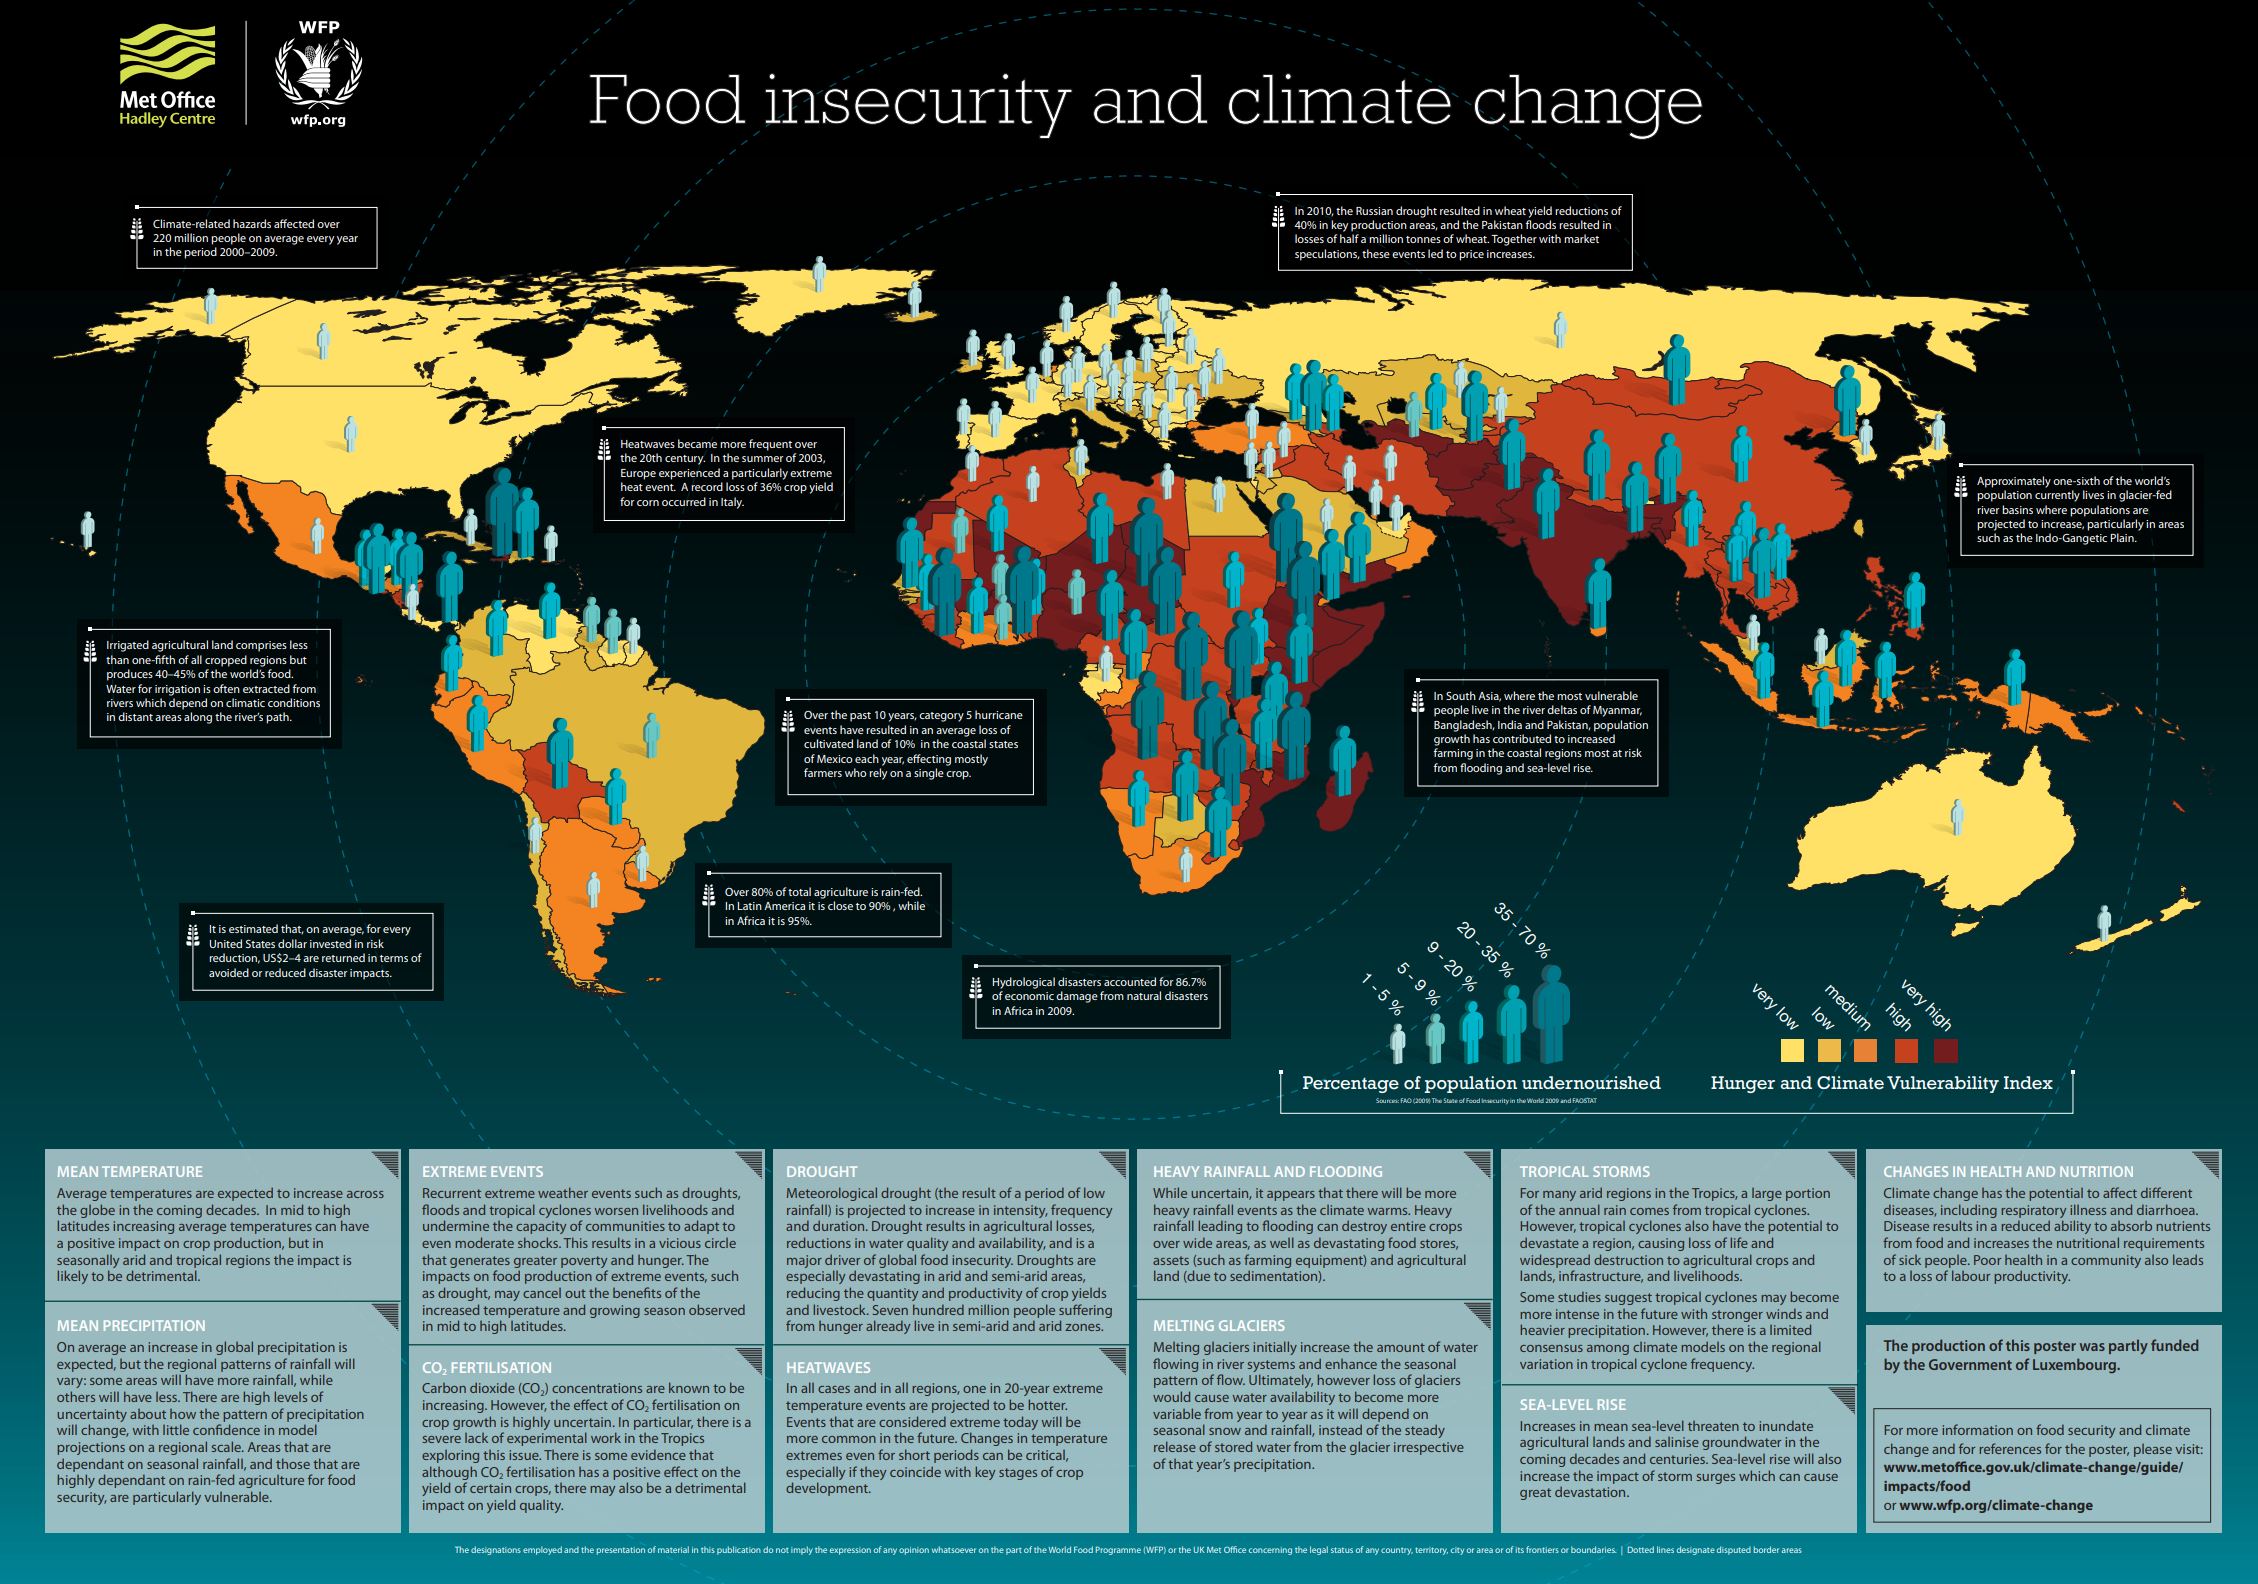
Fluctuations in Precipitation and Temperature
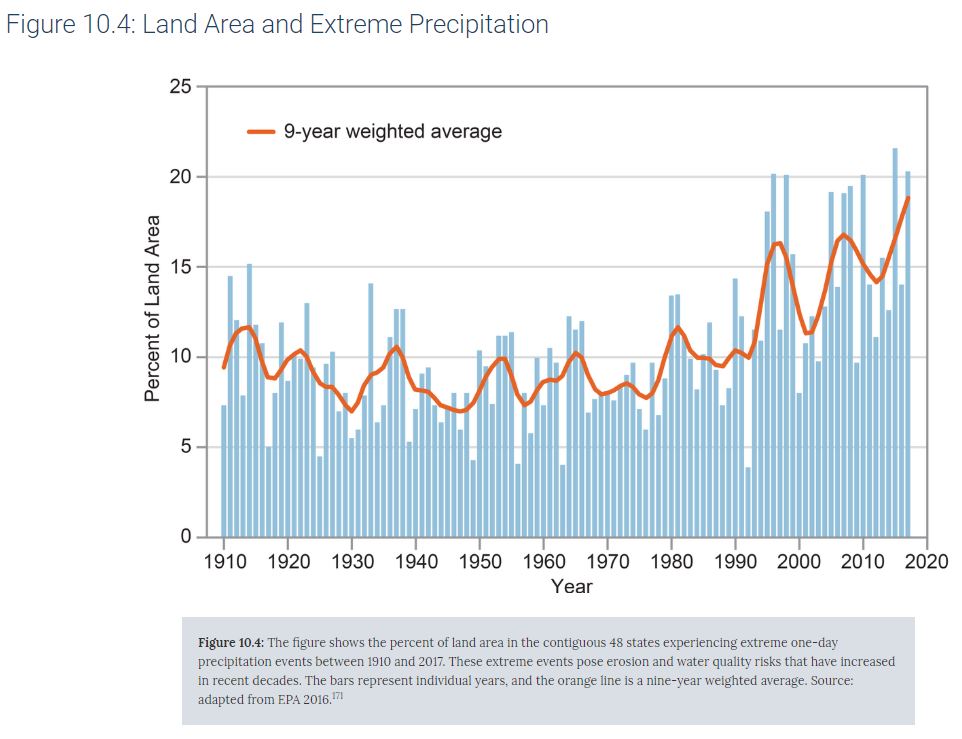
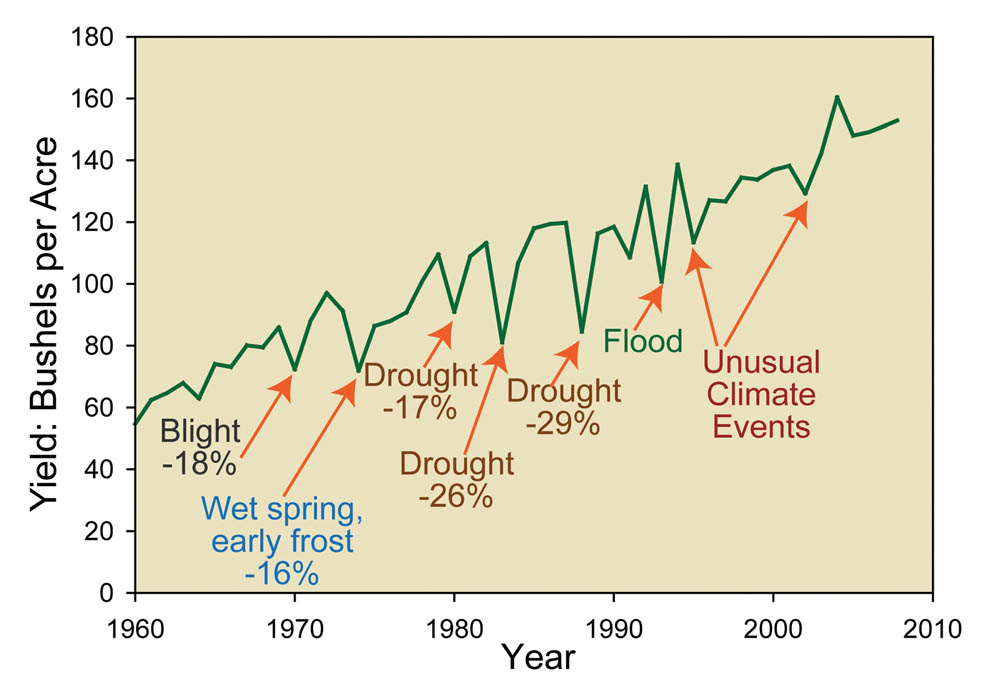
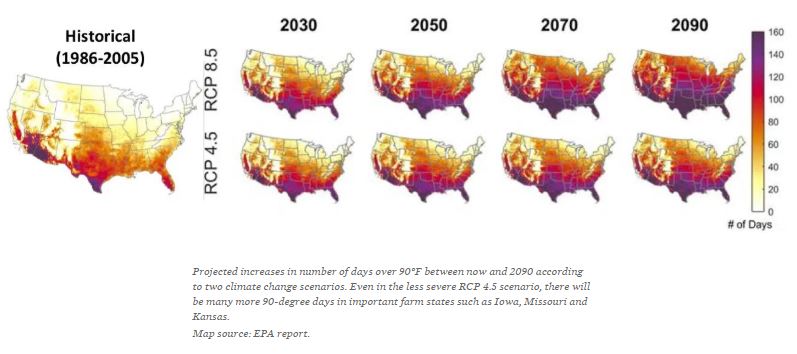
Changes in Where We Grow Our Food
Sometimes, climate change impacts create winners and losers. It's important to understand that climate change leading to food insecurity is more nuanced than it's hotter here and we can't grow food. Climate shifts happen regionally and it's important to understand what that looks like at a smaller scale. Take a look at this map of anticipated agricultural yields in the US by the end of the 21st century. What do you notice?
- As you look at the areas where much of our food is currently produced, how is the end of the century looking for them?
- As we look generally at the northwest corner of the US, we see a noticeable increase in agricultural productivity. But what activities currently happen in these areas?
The issue is more complicated than deciding to follow the climatic conditions with our farming. What does this mean for land use planning, both in the places which stand to lose productivity and those which stand to gain?
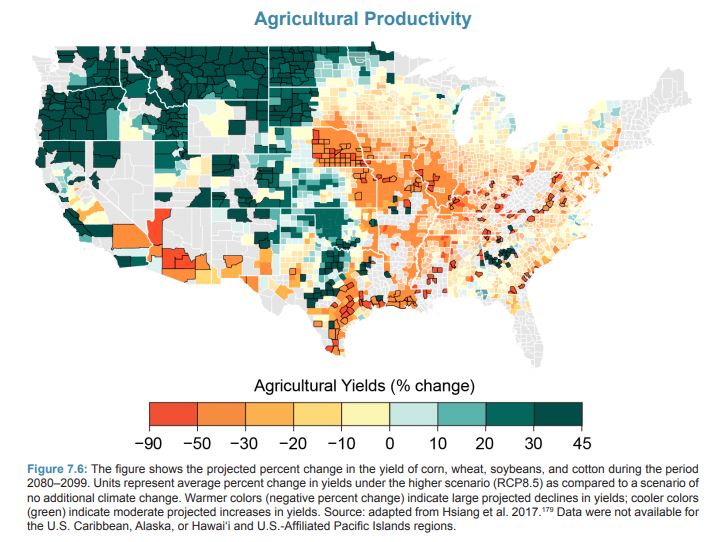
- chocolate [180]
- champagne [181]and beer [182](for those of us over 21)
- avocados [183]
- 5 major crops threatened by climate change [184] (NPR, 2018)
Longer Growing Season
In a changing climate with predominant warming trends, we're seeing the lengthening of our growing seasons (as defined by the period of time with frost-free days). Given what we understand about the increased pressures to feed a growing global population, a longer growing season sounds like it might be the silver lining of climate change impacts we've been searching for, doesn't it? Let's take a closer look.
A longer growing season does mean that some crops and forests are growing for longer periods of time each year; sequestering more carbon dioxide from the atmosphere - good news! But, longer growing seasons for good plants also mean longer growing seasons for less desirable plants. Remember when we looked at the lengthening of seasonal allergy seasons when we talked about human health? Plants like ragweed will enjoy these longer growing seasons, too (EPA, 2016 [185]).
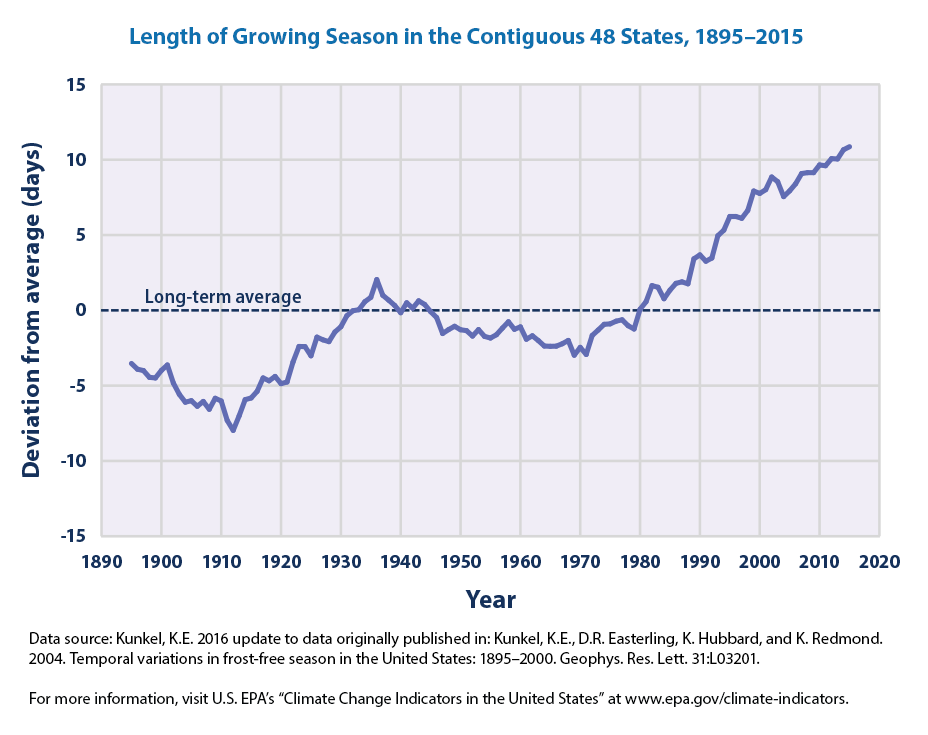
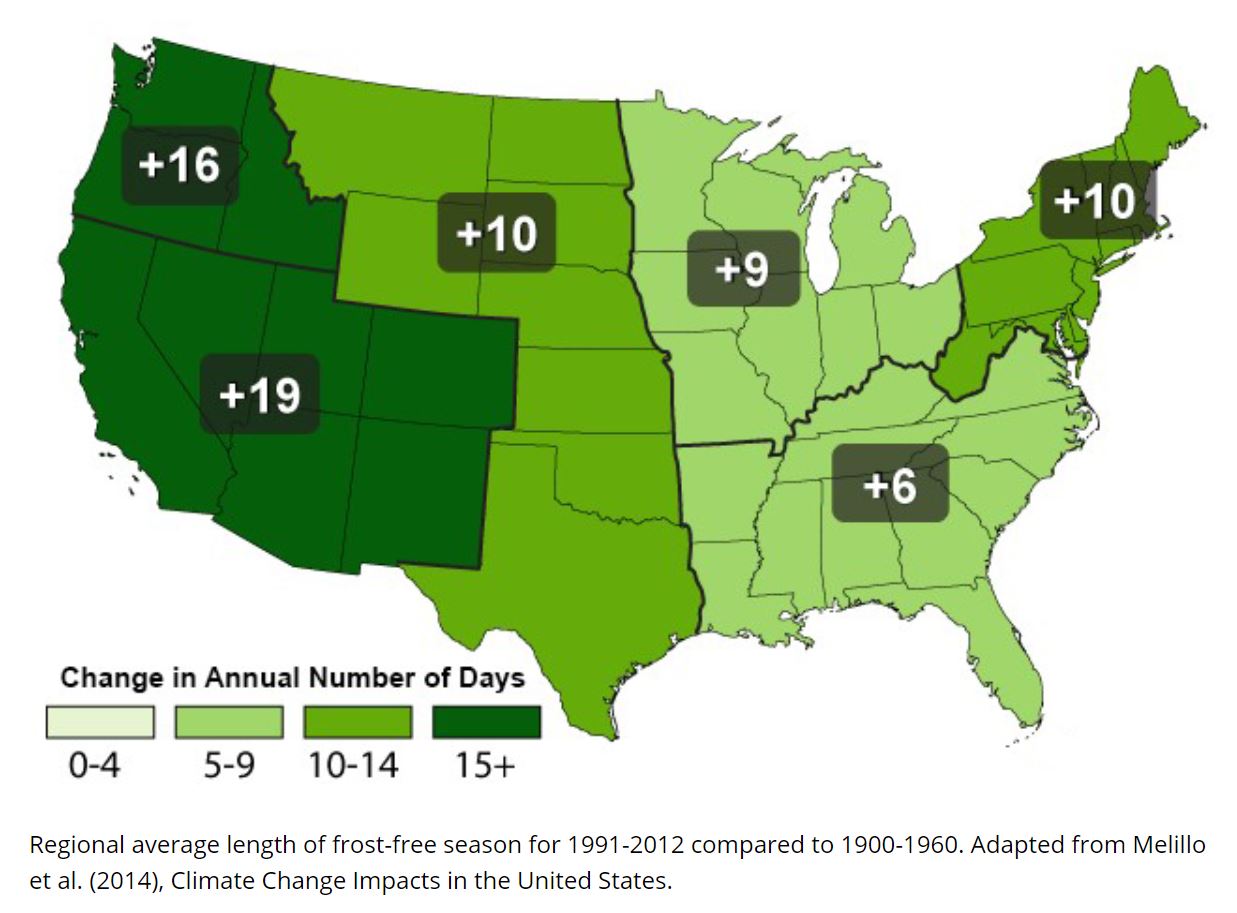
Impacts on Water
Climate change is creating major consequences for water resources through its impacts on the planet’s hydrology.
- Hydrology is the physical science of the distribution, movement, and quality of water in the Earth system.
- Water resources is the term which refers to the social science of the human use of water through agricultural, industrial, domestic, recreational, and other activities.
To put it another way, our impacts on water are a bit of a double whammy. Because anthropogenic climate change is altering water’s distribution, movement, and quality, climate change is also causing humans to adjust the ways we use water.
We'll spend a fair bit of time exploring the impacts of climate change on water resources and understanding how these impacts vary from place to place. But first, it takes a look at the physical impacts of climate change on hydrology so we approach that exploration with a solid foundation of its root causes.
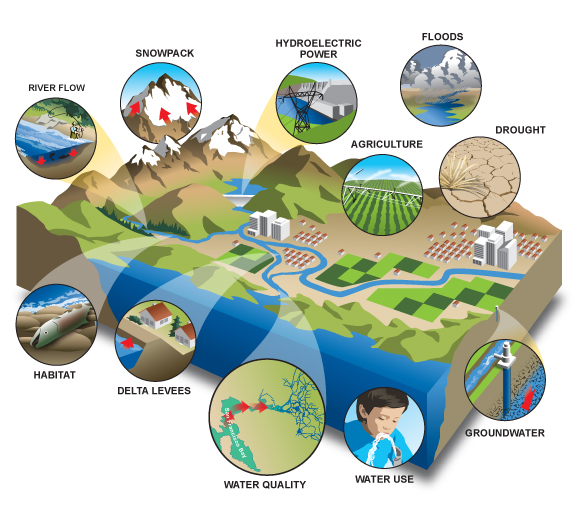
Changing Hydrology
Alterations in hydrology caused by climate change are complex. A simple increase in average temperature results in greater evaporation from soils, drying them out and providing less water to plants and diminished input to groundwater. Less soil water and groundwater lead to lower stream and lake levels and reduced wetland areas. Increased temperatures also mean greater evaporation from lakes and wetlands. Greater evaporation from land surfaces and water bodies, including the oceans, produces more water vapor, which translates into global precipitation increases. (Oh, good news! A few sentences ago it was looking like we were having less water enter the groundwater. Not so fast...)
Those increases, however, are not evenly distributed in time and space (geography matters!). Those places getting much more precipitation find that the increased precipitation offsets the greater evaporation from land and water surfaces; these places are wetter. Those places seeing only a modest increase in precipitation or no increase at all find that increased evaporation rates overshadow precipitation and total available water decreases. Finally, in combination with increased evaporation, those places receiving less precipitation are much drier than before climate change.
These combinations of factors become even more complex if the seasonality of precipitation changes. Some places are becoming wetter in some seasons and drier in others, and the impact of those changes on hydrology is a function of which season is becoming wetter and which one is becoming drier, of the timing of those changes in the annual water cycle, and of the type of precipitation that falls. For example, some mountainous regions are finding that the first snowfall in autumn is coming later and the last snowfall in spring is coming earlier. This change means that the snowfall season is much shorter and snowpacks are much thinner on average. Not only does that change result in less water in the snowpack, but also it causes the release of that water with spring melt to come earlier and to have a significantly smaller peak flow in streams. Regions that rely on mountain snowpacks for their water supply watch these changes with growing alarm. This feels a bit confusing; let's walk through this more carefully with The Importance of Mountain Snowpack to Water Resources [189]. I like this brief write-up because it talks about a few specific regions in the US and what this means for each of them.
Precipitation Effects
More water vapor in the atmosphere from increased evaporation causes some areas to get more rainfall. When the greater latent heat stored in the evaporation process is released by condensation–that is, the formation of clouds–this energy produces stronger updrafts with more liquid water and, ultimately, heavier precipitation. Indeed, like most other areas on Earth, observed precipitation over the United States shows that precipitation totals have been going up for the last century. Moreover, precipitation events are getting more intense and these stronger events are becoming more numerous over most of the country.
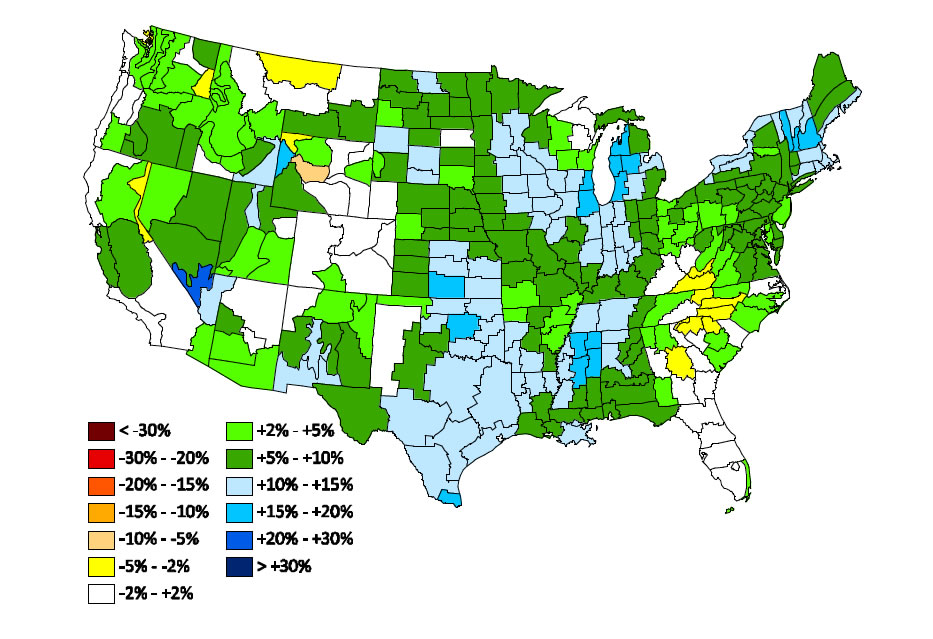
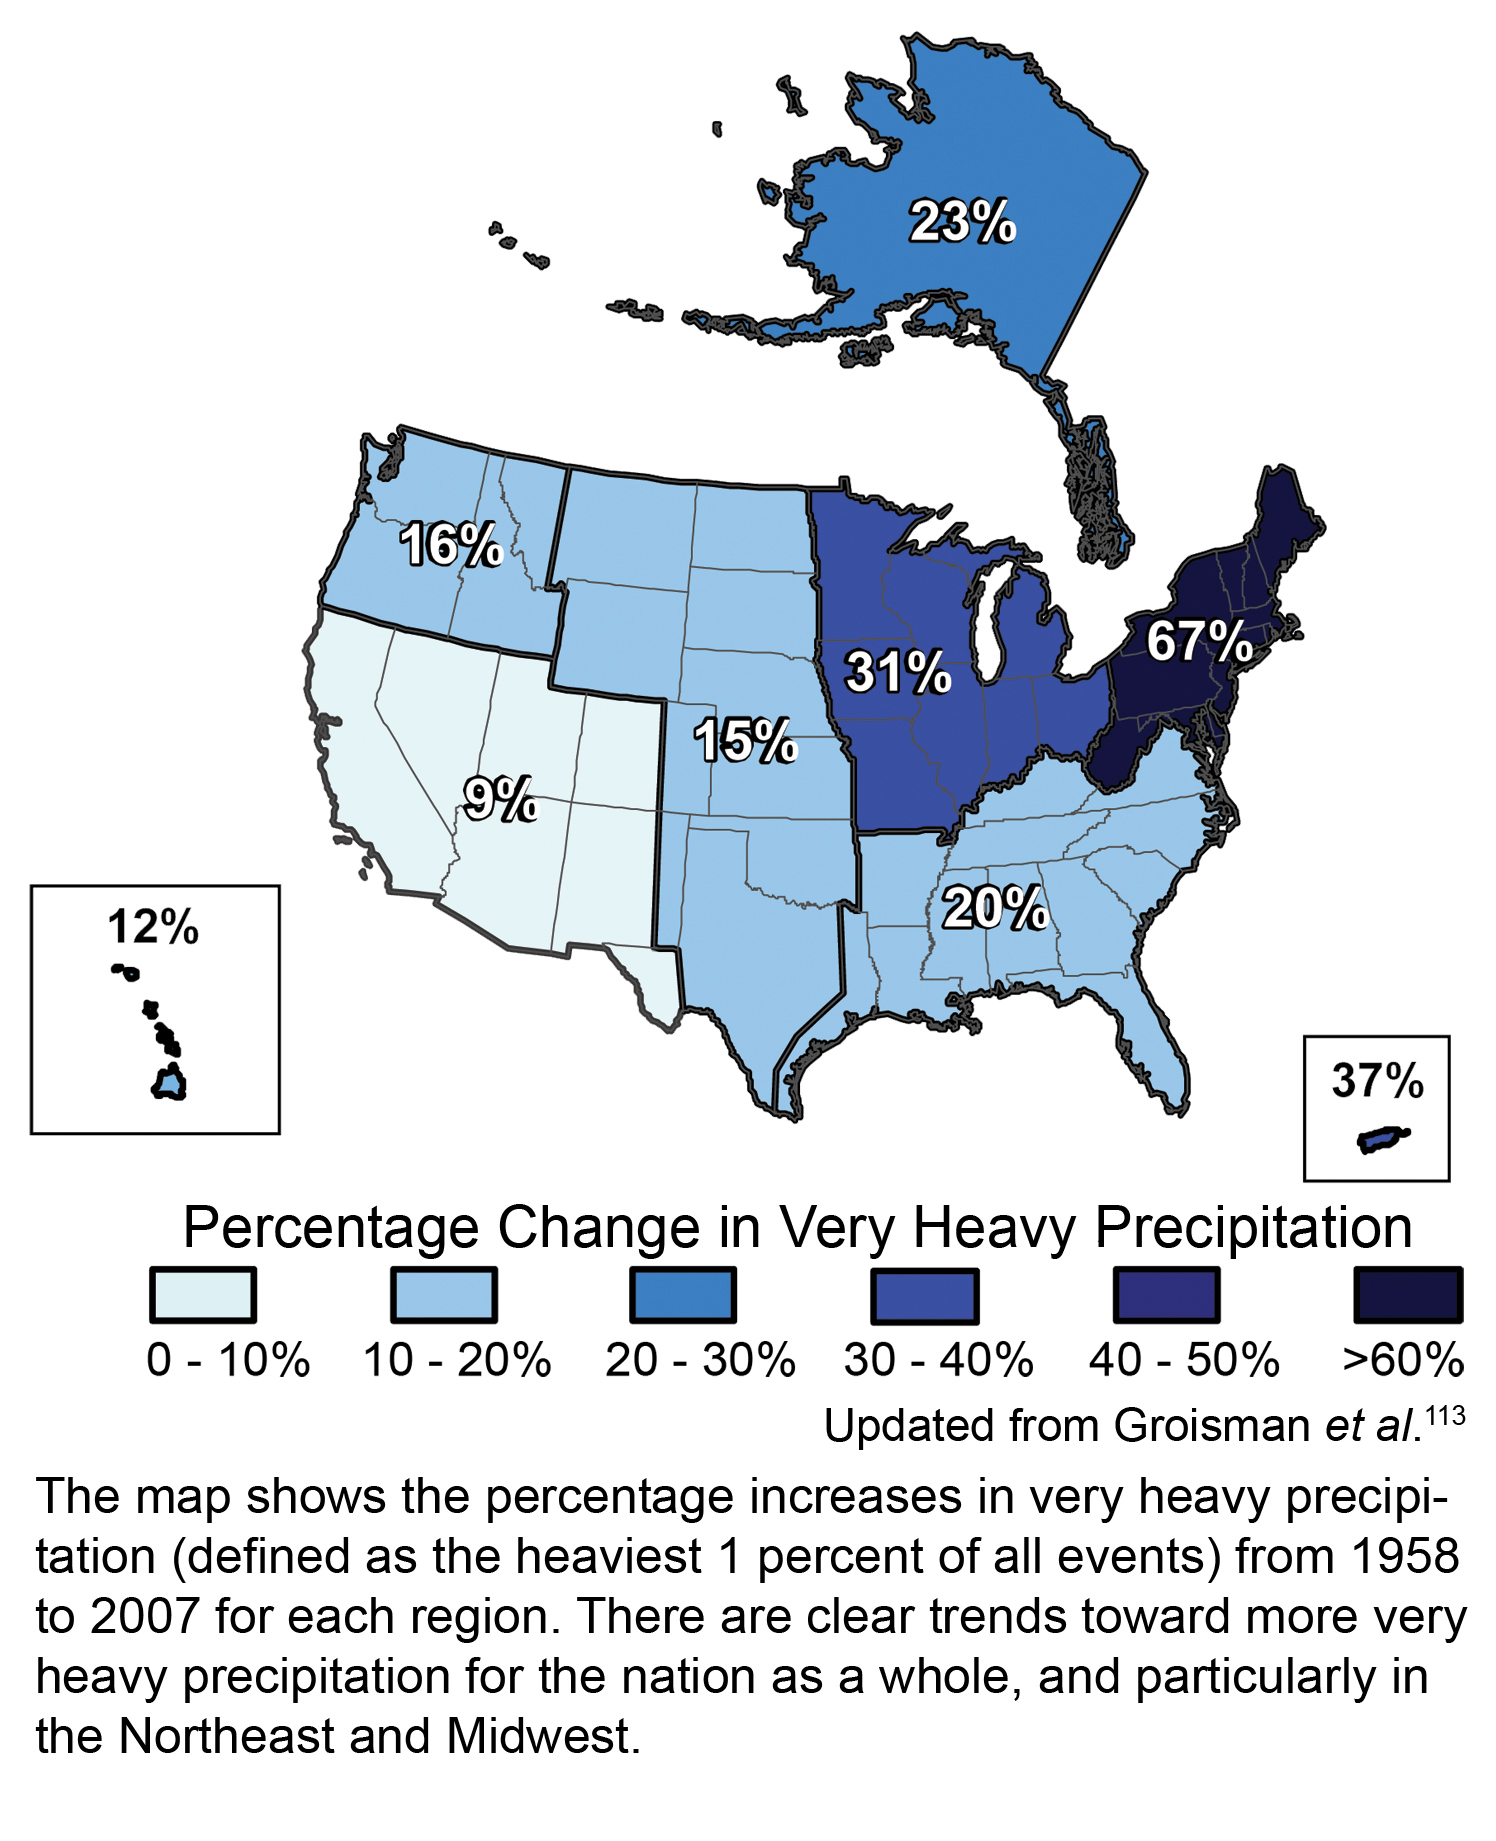
The payoff from these changes in hydrology is easy to understand and to document. Despite overall increases in precipitation, drought is becoming more frequent because in those areas where precipitation has not been increasing strongly, greater evaporation results in drier soils and less available water. Even in areas that are becoming wetter on average, a period of decreased rainfall––say, a few weeks––coupled with higher temperatures results in quick drying and rapid conversion to drought. Ironically, the more frequent, more intense downpours lead to more flash floods. Prolonged, stronger wet periods also generate more floods. Thus, climate change results in greater hydrologic variability over time and space, producing more droughts and floods overall and in any one place. Streamflow and groundwater is, therefore, more variable than ever and much harder to predict and manage.
It is worth noting that sea-level rise resulting from climate change also affects hydrology. Saltwater intrusion into coastal aquifers is increasing partly from greater extraction by growing human populations, and partly from the greater osmotic pressures produced by rising sea levels. Simply, when people install wells, they draw down the water table, causing pressure that can pull saltwater into the aquifer. Concurrently, as sea levels rise, the pressure of all that water can force saltwater into the groundwater system. Saltwater is also increasingly working its way upstream in estuaries and coastal rivers, degrading and replacing freshwater.
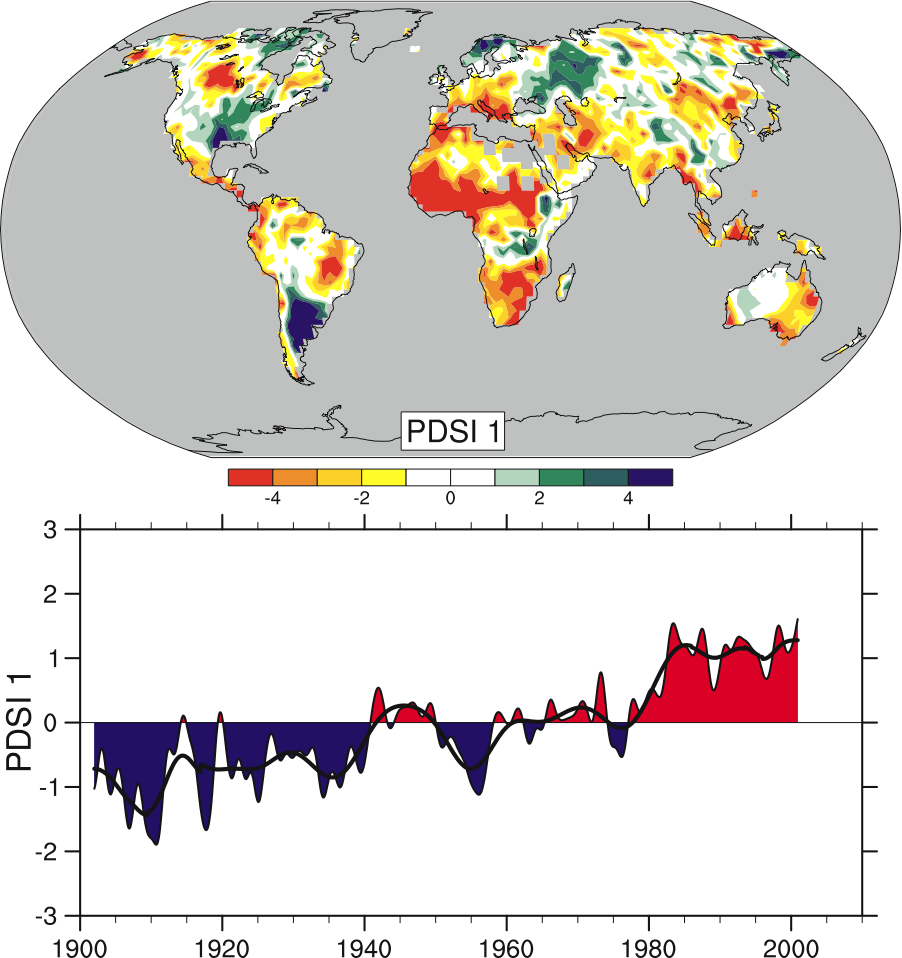
The impacts presented above are an important subset of the total changes to hydrology produced by climate change. The following section explores how these hydrologic impacts translate into challenges for water resource and other managers.
Drought Effects
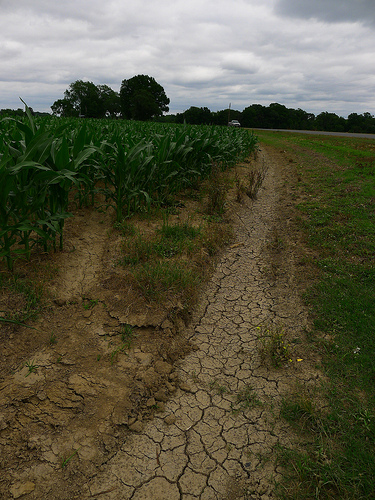
Drought is especially tough on agricultural production. Nearly all crops require moisture as they germinate, grow, mature, flower, and fruit. Yields of water-intensive crops especially depend on how much water is available during crucial life stages. For instance, corn yields are strongly associated with temperatures and precipitation totals in July: if conditions are cool and wet in that month, then yields will be high; if it is dry and hot in July, then yields will be low. Livestock operations also depend on water. For example, because feedlot cattle require significant quantities of water per cow per day, when drought strikes, feedlots must cut back on the number of cattle they process. It is easy to see that those areas experiencing increased frequencies and intensities of drought because of climate change will feel substantial impacts on agriculture output.
Drought influences many aspects of society beyond municipalities and agriculture. For instance, drought even has a big impact on transportation. A large proportion of U.S. commercial transport occurs on barges along the Ohio, Missouri, and Mississippi Rivers and their tributaries. Over 40 percent of all US grain exports travels on the Mississippi River alone. The devastating drought of 1988 stopped all barge traffic on the Mississippi for weeks and affected billions of dollars in exports. The less severe, but prolonged drought affecting the Missouri River drainage from 2003-2010 diverted products totaling many billions of dollars away from barges and onto less cost-effective trains and trucks. If climate change were to cause more droughts in the Midwest or generally dry out the area, then transportation costs and, subsequently, food costs would rise.
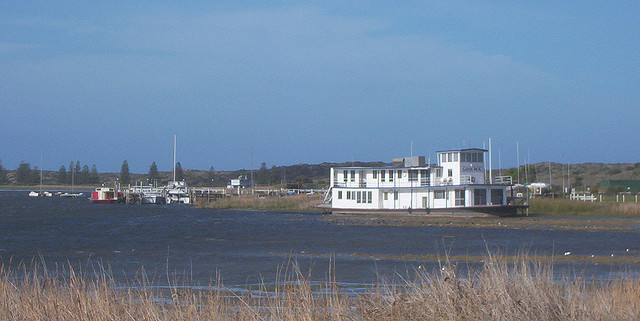
Water Quantity and Quality
Wet and dry periods have major impacts on the water quantity and water quality of both surface water and groundwater systems. Water quantities go up during wet spells and down during dry spells. Dams and reservoirs help solve surface water quantity problems by helping to control floods during wet periods, holding back floodwaters and allowing them to release gradually, thereby reducing the impact of the flood wave generated by nature. At the same time, dams and reservoirs help maintain adequate water supplies during dry periods by impounding water -- perhaps generated during earlier wet periods -- and releasing it as needed. Climate change could therefore necessitate more dams and reservoirs, with the large economic and environmental costs associated with them, such as the impacts on communities submerged by reservoirs or the impacts on ecosystems caused by changes in the quantities and timings of streamflows.
Groundwater quantities are also greatly influenced by wet and dry periods, with water tables rising when climate is wetter and falling when climate dries. One effect of rising and falling water tables is rising and falling streams. Many people do not realize that most water in streams comes not from storm water, but instead from groundwater. Streams occur at low points where the land surface intersects the water table, so when groundwater rises, stream levels rise. Conversely, when the water table falls below the streambed, the stream dries up, running only when a storm temporarily washes water into the channel. Climate change impacts on groundwater therefore will result in changing streams. Another, more purely human, technology associated with groundwater levels is wells. Wells experience few problems when water tables are high, but when they fall it becomes more difficult for wells to pump water, requiring well owners to purchase bigger pumps or -- in those cases when the water table falls below the well depth--dig deeper wells. Deeper wells and stronger pumps result in overpumping and a further drawdown in the regional water table. Consequently, those areas dependent on groundwater where climate change lowers the water table should expect less and more expensive water.
Water quantity is not the only aspect of water resources affected by climate; climate change will also affect water quality. Where net water quantities increase by moderate amounts, surface water quality will generally improve as streams and lakes fill and dilute their pollutants; where available surface water decreases, pollutants will concentrate and water quality will go down. In those areas where water quantities go up dramatically, or where intense precipitation events become more common, water quality will deteriorate substantially as more pollutants are washed into water supplies. Moreover, overloaded storm and sewage systems will spill effluent into streams and water supplies, producing important health hazards. Exceeded capacities will lead to damages, not only causing health hazards but also costing taxpayers large sums to repair, modify, or replace inadequate and damaged systems. Groundwater quality is declining, too, with climate change. Increasing heavy downpours are washing pollutants into wells more frequently, compromising local drinking water supplies after each heavy precipitation event. Sea level rise is causing more frequent cases of saltwater intrusion into groundwater supplies, making coastal drinking water unpleasant in many instances and undrinkable in others.
Water Competition
Climate change is also increasing competition for water resources. Competition for water already exists in drier areas. The U.S. and Mexico compete over Colorado River water, and Northern and Southern California compete for meltwater from the Sierra Nevada Mountains, for example. Such rivalries will increase as climate continues to dry in the Southwest, snowpacks continue to shrink in California, and other regions experience decreases in water resources. There will be competition not only within regions, but also between regions as water-poor regions fight for survival and water-rich regions seek to maintain competitive economic advantage.
In addition, climate change is bringing growing competition between and within market sectors. For example, in many regions of the nation, competition already exists as agricultural interests, municipalities, and energy production companies vie for shrinking water resources; that struggle is growing more combative over time, even resulting in calls for changes in longstanding water laws. Within sectors, such as agriculture, economically and politically entrenched water-intense activities are competing for water with less powerful, more environmentally sensitive, and less water-intense practices. Such competition will continue to intensify as the distribution of water over time and space changes with the climate.
North America is not the only continent facing this problem. The Murray River in Australia, for instance, is drying up and not reaching the population centers near its mouth. The cause of this drying is a combination of long-term drought and overuse by upstream farmers growing such water-intensive crops as rice. Severe competition therefore exists between agricultural and urban interests.
Summary
This week, we've been looking at some of the ways climate change impacts people in very up close and personal ways: our health, our food supply, and our water supply. We learned that climate change is having significant impacts on human health today; it will have even more dramatic impacts on health in the future. Those impacts either are direct, such as heatstroke, or indirect, such as disease transmission through mosquito vectors. One of the key takeaways, as we think about the effects on our health, is that they are varied, pervasive, and expected to become more severe as climate change impacts become even more acute.
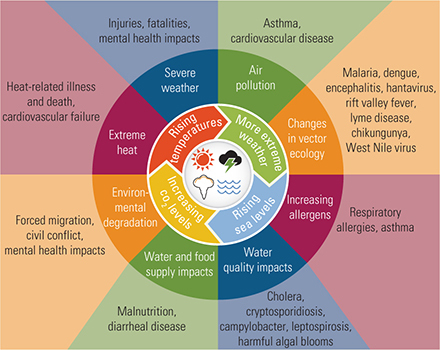
Rising Temperatures
More Extreme Weather
Rising Sea Levels
Increasing CO2 levels
Severe Weather: Injuries, fatalities, mental health impacts
Air Pollution: Asthma, cardiovascular disease
Changes in vector ecology: Malaria, dengue, encephalitis, hantavirus, rift valley fever, Lyme disease, chikungunya, West Nile virus
Increasing allergens: respiratory allergies, asthma
Water quality impacts: cholera, cryptosporidiosis, campylobacter, leptospirosis, harmful algal blooms
Water and food supply impacts: malnutrition, diarrheal disease
Environmental degradation: Forced migration, civil conflict, mental health impacts
Extreme Heat: Heat-related illness and death, cardiovascular failure
We've also looked at impacts on water and food. It doesn't get more integral to our survival than this (remember - not [just] about polar bears).
The story of food security and climate change is one of geography and compounding vulnerabilities. The shifts in where we can grow certain types of food is inherently a geographic problem to understand and carries economic, environmental, and social consequences of great import. Water poses more risks for competition-related issues. Both exacerbate vulnerable populations that may be experiencing insecurity for these basic necessities even before the impacts of climate change really take hold.
"When the well is dry, we know the worth of water." (Benjamin Franklin, Poor Richard’s Almanac, 1746.) Many of you seemed to come to a similar sentiment in your Write to Learn assignments that asked you to talk about what aspects of climate change impacts on human health you were most concerned about or how you personally felt most vulnerable to climate change, and as I told some of you, nothing else really matters if we don't have water. (Ben Franklin and I are clearly on the same page, except about kites and thunderstorms.)
Climate change is profoundly changing Earth’s hydrology, giving us too much water in some places, but too little water in others; giving us too much water at one time, but not enough water over time, and giving us rain, but not snow. (Instead of the line from The Rime of the Ancient Mariner water, water, everywhere but not a drop to drink (a sailor surrounding by salty seawater he cannot drink) it's more like water, water - not there, not like that, not then!!!) Perhaps the greatest challenge posed by climate change is deciding how to adjust our water resource use to address the new normals of hydrology.
Decision-making takes place at all scales of human endeavor, from individual and household levels to community, state, national, and international levels. People regularly make decisions about water use at all these scales, including decisions that have time horizons of decades to centuries. Humanity, therefore, appears to be equipped to handle the water resource challenge presented by climate change. Although competing economic, political, cultural, and social interests will undoubtedly make this task more difficult than it needs to be, humans are infinitely resourceful and will figure out how to meet this challenge and, in many cases, turn it to their advantage.
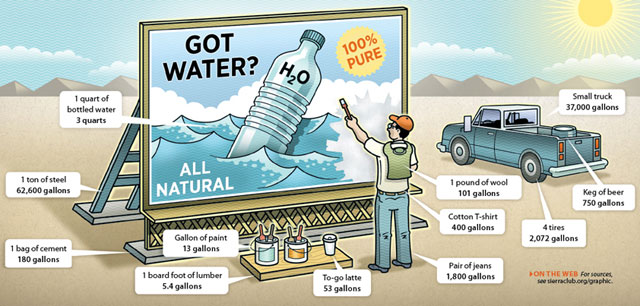
| Product | Amount of Water |
|---|---|
| 1 quart bottled water | 3 quarts |
| 1 ton of steel | 62,600 gallons |
| 1 bag of cement | 180 gallons |
| 1 gallon of paint | 13 gallons |
| 1 board food of lumber | 5.4 gallons |
| To-go latte | 53 gallons |
| Pair of jeans | 1,800 gallons |
| Cotton T-Shirt | 400 gallons |
| 1 pound of wool | 101 gallons |
| 4 tires | 2,072 gallons |
| Small Truck | 37,000 gallons |
| Keg of Beer | 750 gallons |
Reminder - Complete all of the Lesson 6 tasks!
You have reached the end of Lesson 6! Double-check the lesson assignments in the corresponding lesson module in Canvas to make sure you have completed all of the tasks listed there.
7: Sustainability
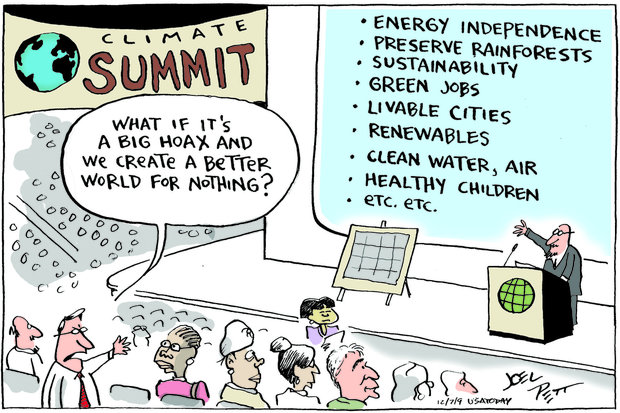
What will we learn?
By the end of this lesson, you should be able to:
- understand the UN's sustainable development goals and the historical context under which they emerged;
- consider the relative merits and drawbacks of different economic models;
- articulate various definitions of 'development';
- find possible problematic aspects to the UN's sustainable development goals and the concept of sustainable development more broadly.
What is due this week?
This lesson will take us one week to complete. Please refer to the corresponding module in Canvas for specific assignments, deliverables, and due dates.
Questions?
If you have questions, please feel free to post them to the "Have a question about the lesson?" discussion forum in Canvas. While you are there, feel free to post your own responses if you, too, are able to help a classmate.
What are the UN Sustainable Development Goals?
PRESENTER: In the year 2000, leaders from 189 countries agreed on a vision for the new millennium. They wanted to end extreme poverty in all of its forms. So they made a list of eight goals called the Millennium Development Goals. And they wanted to achieve these goals in 15 years.
One of the leading organizations working to fulfill these goals has been the United Nations Development Program, or UNDP. We're present in more than 170 countries and territories.
We championed the goals so that people everywhere would know what they were and how people could do their part. We funded projects that helped fulfill the goals. We helped countries accelerate NDG progress by breaking down the silos and working across sectors. We acted as scorekeeper, helping countries to track progress.
As a result, the number of people that live on less than $1.25 per day has dropped by more than half. The number of primary school age kids who don't go to school down by almost half. The number of people getting life saving treatment for HIV increased by over 15 times. Child mortality down by almost half.
As much progress as we've made together, there's still a lot more to do. Over 800 million people are still living on less than $1.25 a day. One in nine people on our planet goes to sleep hungry each night. Deforestation remains alarmingly high in many countries. Oceans are becoming more acidic, threatening food security and marine ecosystems. And about one of every six adults in the world is illiterate. 2/3 of them are women.
We think those are tough numbers, and so do leaders from the countries where we work. So in September 2015, they agreed on a new set of goals to help finish the work we all started in 2000. The new goals are called the Stable Development Goals, or SDGs.
We have made significant progress in the last 15 years, and we think there's plenty of room for hope, for action in the next 15 years. Today, the world is more connected by technology. We know more about how to balance the three pillars of sustainable development, social progress, economic growth, and environmental protection.
However, our climate is changing. Our planet is transforming. And there are more people on earth than ever before. We at UNDP believe everyone can have enough of what they need living within our planetary boundaries, and we are working around the world to make this happen.
Our goals to reach by 2030 are to eradicate extreme poverty, protect our environment, and much more. UNDP has 50 years of experience working with countries to make this a more prosperous, healthy, inclusive, and sustainable world. Join us.
How did we do with the Millenium Development Goals? As the video illustrates, we made progress on some, but certainly not all of them. Taking the lessons learned from that initial process, the goals were reimagined and structured differently into the current Sustainable Development Goals, which will carry us through 2030. The World Bank has a nicely done interactive visualization [203] to explore progress on the MDGs by country and indicator.
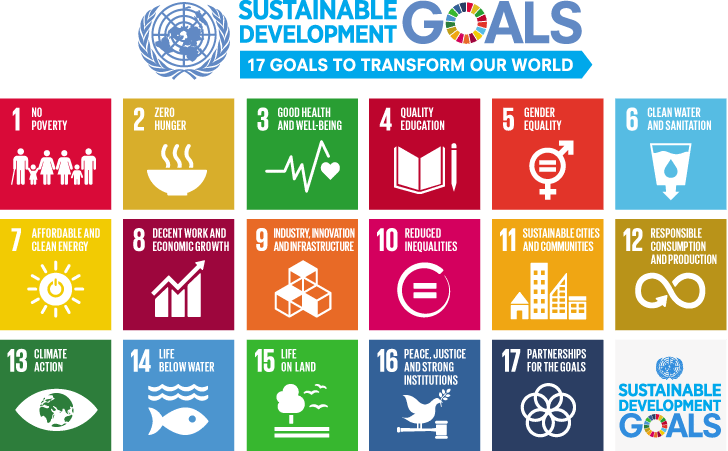
Sustainable Development Goals: 17 Goals to Transform our World
-
No poverty
-
Zero hunger
-
Good health and well-being
-
Quality education
-
Gender Equality
-
Clean Water and Sanitation
-
Affordable and Clean Energy
-
Decent Work and Economic Growth
-
Industry, Innovation and Infrastructure
-
Reduced Inequalities
-
Sustainable Cities and Communities
-
Responsible Consumption and Production
-
Climate Action
-
Life Below Water
-
Life on Land
-
Peace, Justice and Strong Institutions
-
Partnerships for the Goals
But this graphic really just scratches the surface. To better understand how the UN envisions the world achieving these goals, please explore About the Sustainable Development Goals [98]. For example, here's the more detailed description and discussion of Goal 13: Climate Action [205]. (Hint: This goal-by-goal resource will be pivotal in incorporating the goals correctly into your Exam 3 assignment, so definitely worth your time!)
A different economic model
So much of our discussion about how to address climate change, not only in class this semester but also in general, focuses on the economics of climate change. We talk about how our economic structure created the problem and we talk about the need to create solutions that don't just do the right thing because it's the right thing, but also because it creates economic value. Let's imagine for a minute (well, how about for some of this week, anyway), that what we really need is to re-envision what a healthy economy looks like.
I was first introduced to this concept of doughnut hole economics a few years ago. (You had me at doughnuts, right?) This is a 15 minute TED Talk - required viewing - because Kate Raworth tells this story far better in person than any piece of writing could do.
KATE RAWORTH: Have you ever watched a baby learning to crawl? Because any parent knows, it's gripping. First, they wriggle about on the floor, usually backwards. But then, they drag themselves forwards. And then, they pull themselves up to stand. And we all clap.
And that simple motion of forwards and upwards, it's the most basic direction of progress we humans recognize. We tell it in our story of evolution as well. From our lolloping ancestors, to Homo Erectus, finally upright, to Homo Sapiens, depicted always a man, always mid stride.
[LAUGHTER]
So no wonder we so readily believe that economic progress will take this very same shape, this ever rising line of growth. It's time to think again, to re-imagine the shape of progress.
Because today, we have economies that need to grow, whether or not they make us thrive. And what we need, especially in the richest countries, are economies that make us thrive whether or not they grow.
Yes, it's a little flip in words hiding a profound shift in mindset. But I believe this is the shift we need to make if we, humanity, are going to thrive here together this century.
So where did this obsession with growth come from? Well, GDP, gross domestic product, it's just the total cost of goods and services sold in an economy in a year.
It was invented in the 1930s, but it very soon became the overriding goal of policy making. So much so that even today, in the richest of countries, governments think that the solution to their economic problems lies in more growth.
Just how that happened is best told through the 1960 classic by W.W. Rostow. I love it so much, I have a first-edition copy. The Stages of Economic Growth: A Non-Communist Manifesto.
[LAUGHTER]
[SNIFFING]
You can just smell the politics, huh?
[LAUGHTER]
And Rostow tells us that all economies need to pass through five stages of growth. First, traditional society, where a nation's output is limited by its technology, its institutions, and mindset.
But then the preconditions for takeoff, where we get the beginnings of a banking industry, the mechanization of work, and the belief that growth is necessary for something beyond itself, like national dignity or a better life for the children.
Then takeoff, where compound interest is built into the economy's institutions and growth becomes the normal condition. Fourth is the drive to maturity, where you can have any industry you want, no matter your natural resource base.
And the fifth and final stage, the age of high mass consumption, where people can buy all the consumer goods they want, like bicycles and sewing machines. This was 1960, remember.
[LAUGHTER]
Well, you can hear the implicit airplane metaphor in this story. But this plane is like no other because it can never be allowed to land. Rostow left us flying into the sunset of mass consumerism.
And he knew it, as he wrote, "And then the question beyond, where history offers us only fragments. What to do when the increase in real income itself loses its charm?"
He asked that question, but he never answered it. And here's why. The year was 1960, he was an advisor to the presidential candidate John F. Kennedy who was running for election on the promise of 5% growth.
So Rostow's job was to keep that plane flying, not to ask if, how, or when it could ever be allowed to land. So here we are, flying into the sunset of mass consumerism, over half a century on with economies that have come to expect, demand, and depend upon unending growth. Because we are financially, politically, and socially addicted to it.
We're financially addicted to growth because today's financial system is designed to pursue the highest rate of monetary return. Putting publicly-traded companies under constant pressure to deliver growing sales, growing market share, and growing profits.
And because banks create money as debt, bearing interest, which must be repaid with more. We're politically addicted to growth because politicians want to raise tax revenue without raising taxes. And a growing GDP seems a sure way to do that. And no politician wants to lose their place in the G20 family photo.
[LAUGHTER]
But if their economy stops growing while the rest keep going, well, they'll be booted out by the next emerging powerhouse.
And we are socially addicted to growth because thanks to a century of consumer propaganda, which, fascinatingly, was created by Edward Bernays, the nephew of Sigmund Freud, who realized that his uncle's psychotherapy could be turned into very lucrative retail therapy if we could be convinced to believe that we transform ourselves every time we buy something more.
None of these addictions are insurmountable. But they all deserve far more attention than they currently get. Because, look where this journey has been taking us.
Global GDP is 10 times bigger than it was in 1950. And that increase has brought prosperity to billions of people. But the global economy has also become incredibly divisive, with the vast share of returns to wealth now accruing to a fraction of the global 1%.
And the economy has become incredibly degenerative, rapidly destabilizing this delicately balanced planet on which all of our lives depend. Politicians know it, and so they offer new destinations for growth.
You can have green growth, inclusive growth, smart, resilient, balanced growth. Choose any future you want, so long as you choose growth.
I think it's time to choose a higher ambition, a far bigger one. Because humanity's 21st century challenge is clear. To meet the needs of all people within the means of this extraordinary, unique, living planet so that we and the rest of nature can thrive.
Progress on this goal isn't going to be measured with a metric of money. We need a dashboard of indicators. And when I sat down to try and draw a picture of what that might look like, strange though this is going to sound, it came out looking like a doughnut. I know. I'm sorry.
But let me introduce you to the one doughnut that might actually turn out to be good for us. So imagine humanity's resource use radiating out from the middle. That hole in the middle is a place where people are falling short on life's essentials.
They don't have the food, healthcare, education, political voice, housing that every person needs for a life of dignity and opportunity. We want to get everybody out of the hole, over the social foundation, and into that green doughnut itself.
But-- and it's a big but-- we cannot let our collective resource use overshoot that outer circle, the ecological ceiling. Because there, we put so much pressure on this extraordinary planet that we begin to kick it out of kilter.
We cause climate breakdown. We acidify the oceans, a hole in the ozone layer. Pushing ourselves beyond the planetary boundaries of the life-supporting systems that have, for the last 11,000 years, made Earth such a benevolent home to humanity.
So this double-sided challenge to meet the needs of all within the means of the planet invites a new shape of progress. No longer this ever-rising line of growth, but a sweet spot for humanity. Thriving in dynamic balance between the foundation and the ceiling.
And I was really struck, once I had drawn this picture, to realize that the symbol of well-being in many ancient cultures reflects this very same sense of dynamic balance. From the Maori Takarangi to the Taoist yin yang, the Buddhist endless knot, the Celtic double spiral.
So can we find this dynamic balance in the 21st century? Well, that's a key question. Because as these red wedges show, right now, we are far from balance, falling short and overshooting at the same time.
Look in that hole. You can see that millions or billions of people worldwide still fall short on their most basic of needs. And yet, we've already overshot at least four of these planetary boundaries, risking irreversible impacts of climate breakdown and ecosystem collapse.
This is the state of humanity and our planetary home. We, the people of the early 21st century, this is our selfie. No economist from last century saw this picture. So why would we imagine that their theories would be up for taking on its challenges?
We need ideas of our own, because we are the first generation to see this and probably the last with a real chance of turning this story around. You see, 20th-century economics assured us that if growth creates inequality, don't try to redistribute. Because more growth will even things up again.
If growth creates pollution, don't try to regulate. Because more growth will clean things up again. Except, it turns out, it doesn't and it won't. We need to create economies that tackle this shortfall and overshoot together by design.
We need economies that are regenerative and distributive by design. You see, we've inherited degenerative industries. We take Earth's materials, make them into stuff we want, use it for a while-- often only once-- and then throw it away. And that is pushing us over planetary boundaries.
So we need to bend those arrows around, create economies that work with and within the cycles of the living world. So that resources are never used up, but are used again and again. Economies that run on sunlight, where waste from one process is food for the next.
And this kind of regenerative design is popping up everywhere. Over 100 cities worldwide, from Quito to Oslo, from Harare to Hobart, already generate more than 70% of their electricity from sun, wind, and waves.
Cities like London, Glasgow, Amsterdam are pioneering circular-city design, finding ways to turn the waste from one urban process into food for the next. And from Tigray, Ethiopia to Queensland, Australia, farmers and foresters are regenerating once barren landscape so that it teams with life again.
But as well as being regenerative by design, our economies must be distributive by design. And we've got unprecedented opportunities for making that happen. Because 20th century centralized technologies, institutions, concentrated wealth, knowledge, and power in few hands.
This century, we can design our technologies and institutions to distribute wealth, knowledge, and empowerment to many. Instead of fossil-fuel energy and large-scale manufacturing, we've got renewable energy networks, digital platforms, and 3D printing.
200 years of corporate control of intellectual property is being upended, by the bottom up, open-source, peer to peer, knowledge commons.
And corporations that still pursue maximum rate of return for their shareholders, well, they suddenly look rather out of date next to social enterprises that are designed to generate multiple forms of value and share it with those throughout their networks.
If we can harness today's technologies, from AI, to blockchain, to the internet of things, to material science, if we can harness these in service of distributive design, we can ensure that healthcare, education, finance, energy, political voice reaches and empowers those people who need it most. You see, regenerative and distributive design create extraordinary opportunities for the 21st-century economy.
So where does this leave Rostow's airplane ride? Well, for some, it still carries the hope of endless green growth. The idea that thanks to de-materialization, exponential GDP growth can go on forever while resource use keeps falling.
But look at the data. This is a flight of fancy. Yes, we need to de-materialize our economies. But this dependency on unending growth cannot be decoupled from resource use on anything like the scale required to bring us safely back within planetary boundaries.
I know this way of thinking about growth is unfamiliar because growth is good, no? We want our children to grow, our gardens to grow. Yes. Look to nature and growth as a wonderful, healthy source of life. It's a phase. But many economies, like Ethiopia and Nepal today, may be in that phase. Their economies are growing at 7% a year.
But look again to nature. Because from your children's feet to the Amazon forest, nothing in nature grows forever. Things grow, and they grow up, and they mature. And it is only by doing so that they can thrive for a very long time.
We already know this. If I told you my friend went to the doctor who told her she had a growth, well, that feels very different. Because we intuitively understand that when something tries to grow forever within a healthy, living, thriving system, it is a threat to the health of the whole.
So why would we imagine that our economies would be the one system that could buck this trend and succeed by growing forever? We urgently need financial, political, and social innovations that enable us to overcome this structural dependency on growth so that we can instead focus on thriving in balance within the social and the ecological boundaries of the doughnut.
And if the mere idea of boundaries makes you feel, well, bounded, think again. Because the world's most ingenious people turn boundaries into the source of their creativity, from Mozart on his five-octave piano, Jimi Hendrix on his six-string guitar, Serena Williams on a tennis court.
It's boundaries that unleash our potential. And the doughnut's boundaries unleash the potential for humanity to thrive, with boundless creativity, participation, belonging, and meaning. It's going to take all the ingenuity that we have got to get there. So bring it on. Thank you
Ms. Raworth does a far better job in her TED Talk of describing this concept, but allow me to summarize. The green doughnut you see represents a good life. We're living under our ecological ceiling (so not overexploiting our natural resources) and we're living on a strong social foundation which ensures quality life for all. But this concept isn't playing out in reality, and the words described in the outermost layer of the diagram represent what happens when we overshoot those ecological limits - climate change, ocean acidification, loss of biodiversity - big, complex environmental problems we're facing right now. The concepts described at the core of the diagram suffer when we fail to secure our social foundation - health, education, equality. As you might imagine, we're overshooting the ecological ceiling and we don't have the greatest social foundations, so our doughnut is crumbling from both sides. Ms. Raworth argues (rather effectively) that this mismatch between what we need for balance in our natural world and what we see playing out in society is due largely to our economic structure. And this makes sense if you think about it - if we've predicated 'success' on the idea of growth, where does that end?
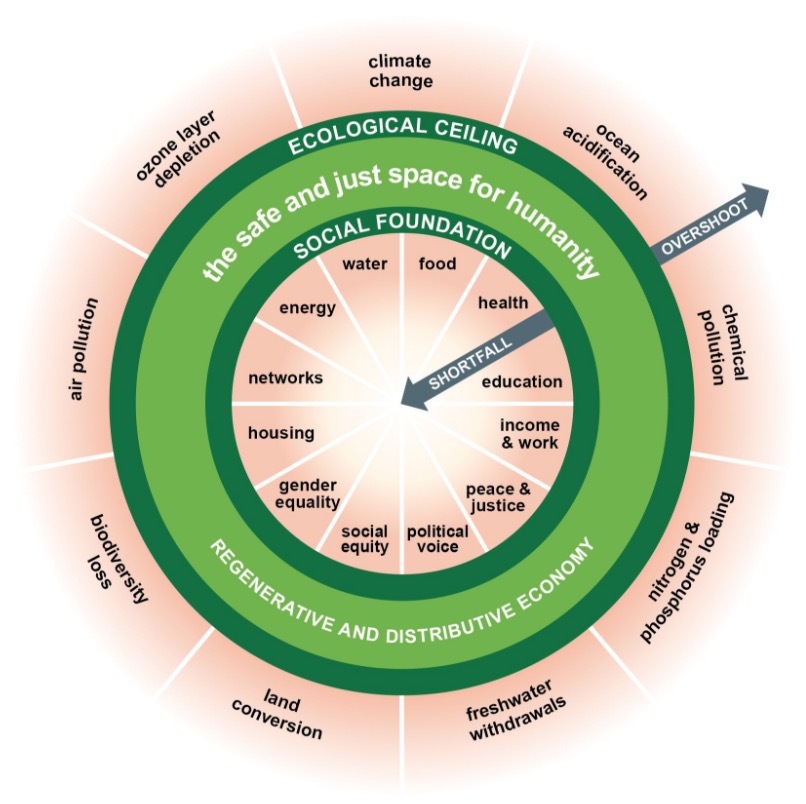
The center of the image is a ring shape labeled "the safe and just space for humanity" and "regenerative and distributive economy.
The inside edge of the ring is labeled "social foundation" and inside the center of the ring is; water, food, health, education, income & work, peace & justice, political voice, social equity, gender equality, housing, networks, and energy. An arrow pointing toward the center of the ring is labeled "shortfall".
The outer edge of the ring is labeled "ecological ceiling". Outside the ring, there are sections labeled; air pollution, ozone layer depletion, climate change, ocean acidification, chemical pollution, nitrogen & phosphorous loading, freshwater withdrawals, land conversion, and biodiversity loss. An arrow pointing away from the ring is labeled "overshoot".
SDGs: not just for the developing world
Sometimes, when we start talking about sustainable development or even the UN's SDGs specifically, that conversation tends to gravitate toward the developing world - almost as if the post-industrial countries don't need to think about this. There may even be misconceptions that if we evaluated a place like the US, for example, on its progress toward meeting any number of the SDGs that what we would find is a report card we'd be proud to hang on the refrigerator. Let's take a closer look.
Each year, the Sustainable Development Solutions Network [207] reports on the status of sustainable development right here in the United States. The figures below are from the most recent report* for year 2018 [208].
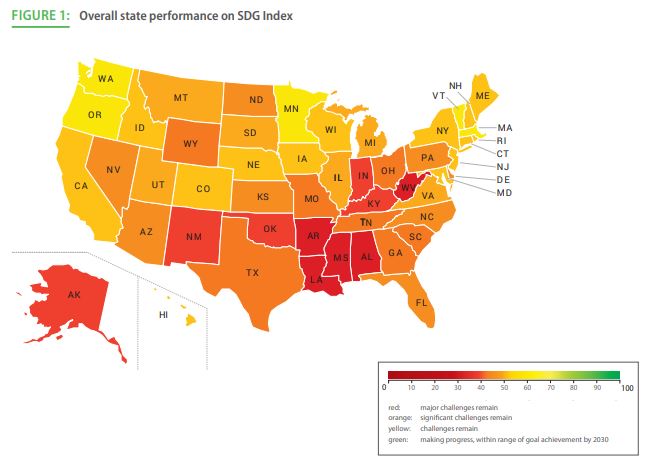
The dashboard below breaks down the US map above in more detail to illustrate how those SDG indices are derived and ranks the states from best to worst in achieving these goals. But rather than focus on which states are doing well relative to others, let's look at which goals we're struggling as a country to achieve. Here are three that jump out to me. What stands out to you?
- Goal 1: End poverty in all its forms everywhere.
- Goal 13: Take urgent action to combat climate change and its impacts.
- Goal 16: Promote peaceful and inclusive societies for sustainable development.
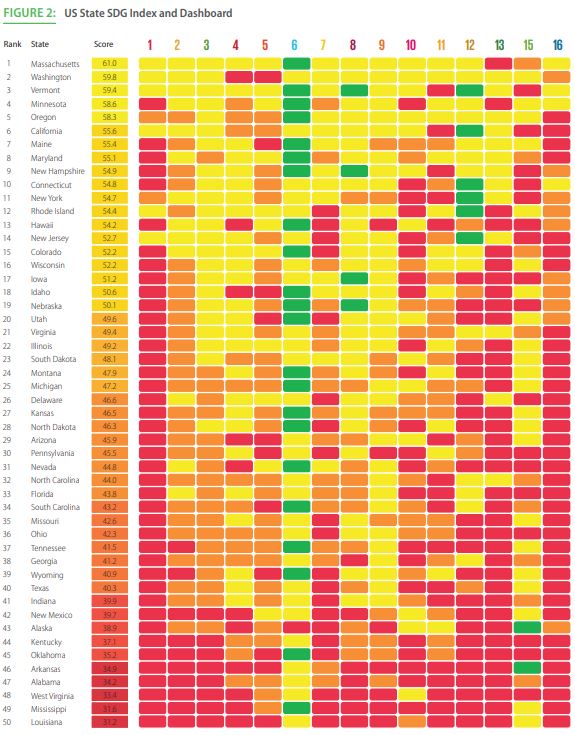
Summary
That's a wrap! This week, we explored the ideas of sustainable development and rectifying economic growth with long-term sustainability as we rounded out our learning about responses to climate change.
Reminder - Complete all of the Lesson 7 tasks!
You have reached the end of Lesson 7! Double-check the lesson assignments in the corresponding lesson module in Canvas to make sure you have completed all of the tasks listed there.
8: Public Opinion on Climate Change
Too often, the climate crisis is framed as a political debate rather than a scientific consensus. This can be problematic for creating the innovative solutions the situation necessitates. However, the story is not so simple and while we may assume it cuts readily on party lines in the US, when we take a closer look, we find a more nuanced situation. This week's lesson is an exploration of the ever-evolving public opinion of climate change, with particular focus here in the US. We're digging into this because it is fundamentally one of the most complicated human dimensions of climate change and also perhaps one of the most potentially powerful to get us out of the mess. Finally, understanding how our family, friends, and neighbors think about this issue helps us have more productive conversations toward common goals.
What will we learn?
By the end of this lesson, you should be able to:
- appreciate the underlying drivers of people's personal perceptions of the climate crisis
- discuss the Six Americas as described by the Yale Program on Climate Communication
- create strategies for engaging in productive conversations about climate change in a variety of community settings (home, work, social organizations, etc.)
What is due this week?
This lesson will take us one week to complete. Please refer to the corresponding module in Canvas for specific assignments, deliverables, and due dates.
Questions?
If you have questions, please feel free to post them to the "Have a question about the lesson?" discussion forum in Canvas. While you are there, feel free to post your own responses if you, too, are able to help a classmate.
The origins of our climate opinions
Before we dig into public perception of climate change, we need to establish an understanding of the underpinnings of these perceptions. Some of this will seem directly linked and obviously correlated, but some if it may not.
I am a geographer, so I tend to think of things at different scales. For public opinion on climate change (or really any topic) where the discussion can be heated and politically divisive, I think it's always a good idea to zoom out. If we zoom out far enough, we can usually find some common ground. Let's look at this in an overly simplistic way for a minute just to make the point. If we zoom way out, I think we could build strong consensus among diverse audiences that it's important that the Earth can sustain human life. That statement feels very non-threatening or confrontational. Now of course, as we Zoom in, things get a bit messy. While we might all still agree on this point for a bit, we may fundamentally disagree on how we define the Earth as being in good enough shape to sustain us, or even what we mean by sustaining us. And do we mean all of human life or do we start to get selfish? Are we concerned mostly about sustaining our current economy? See, very messy. If we zoom in even more, we get an even more complicated look at priorities. Sure, maybe I do genuinely think that we need to take good care of the planet, but perhaps that doesn't align with other issues which are more immediately pressing to me and my family. Maybe I'm concerned that better care of the planet means me losing my job and ability to support my family. Or taking better care of the planet means higher taxes I cannot afford or otherwise do not support. Or maybe I'm very concerned about national security or education or health care or my local economy and thinking about taking care of the planet takes a back seat to things that feel more immediately relevant to my day. We zoomed way in and scattered our consensus.
I raise these points to say that part of the human dimensions of climate change is understanding how our friends, family, and neighbors come to feel the way about it that they do. It's easy to sit here and say shouldn't spend time on whether someone 'believes' in climate change - and to an extent, that's true. It's more about understanding the science than believing in it. After all, the climate is changing whether I believe that or not. However, if we want to do something about it, we need to create constructive conversations on the topic, and that can't happen if we don't take a step back to appreciate how people arrive at their opinions and beliefs.
Meeting People Where They Are
Here's the good news and the bad news about climate change all in one statement: it touches pretty much everything. Why is that good news?!? Because it gives us a lot of opportunity to connect with people. As we've already seen, even people who care about climate change might not identify it as their top priority (in daily life or at the polls). However, there is something that they really care about - and chances are, climate change may impact it.
I'll give you a personal example. Remember Tom Butler, our hog farmer friend in North Carolina? Tom wasn't the only farmer I worked with. I had hog farmers in North Carolina and dairy farmers in New York who were all implementing those same lagoon cover digesters on their farms to manage manure and earn some carbon credit revenue on the side. And to be perfectly honest with you, I had more than one farmer (definitely NOT Tom!) tell me that they didn't believe in climate change, but they were happy to cash carbon credit checks from people who did. And while I didn't say this to them, what I thought was, "Well, good news - the atmosphere doesn't care why you've reduced emissions, just that you have!" Those farmers weren't just in it for the carbon credit revenue - I promise you, it wasn't that much. However, those lagoon cover digesters served a lot of other important functions for them. Many of them found their farms increasingly encroached on by development and as it turns out, though we all enjoy food, many people don't like the way farms smell and they complain about it a lot. The odor control offered by the lagoon covers was very beneficial to some of those farmers. Others, including Tom, really enjoyed the peace of mind from not worrying about a hurricane parking over the farm and flooding the open air lagoons over their tops anymore - the water quality nightmare that stems from that was quite the headache. Others needed a new strategy to successfully manage their manure. So, in all of these cases, we were doing something that benefited the climate but we were often doing it for other reasons. The climate is fine with that.
So while it's absolutely important that we try to educate people about the science of climate change and why it matters for people (not polar bears), we need to recognize that it can't be everyone's priority. But those of us who do view it as a priority have a unique and important opportunity to integrate climate solutions with our families', friends', and neighbors' top priorities. Instead of asking people to come to you, meet them where they are. I like to think of it as coming through the back door to address climate change by focusing first on how we make our communities better places to live. It helps us zoom in without so much of the mess.
The Politics of Climate Change - Good, Bad, and Ugly
We don't need to spend too much time stuck in the quagmire of politics and climate change. That's time better spent in GEOG 432. However, it's worth noting that for better or worse, this is currently a politically divisive topic. However, it's not that simple. I repeat: it's not that simple. American politics has this unfortunate tendency to be very binary, especially in a time with such partisan divide as now (thanks, two party system!). But perhaps if you take nothing else away from this class, I want you to walk away with this: we can't let broader politics define our willingness to act on climate. We just can't.
So right now, it may seem as though democrats or more liberal-leaning folks are the ones who support climate action and republicans or more conservative-leaning folks do not. And you'll see in the public opinion readings that this bears out to a large extent. But it's not the whole story, and in this class we're not making generalized assumptions based on politics.
First things first - it hasn't always been this way. Conservation has historically been well, conservative. Some of our more landmark environmental policies have been enacted under Republican leaders - the establishment of the national parks system, the EPA, Clean Air and Water Acts - all under Republican leadership. It's really only been since the early 2000s that we've seen it become a political hot potato. And we could go on an expedition to find out why, but we don't need to for this class. What I want you to understand is that while we see a lot of divisiveness on the issue in Congress along party lines, that doesn't play out as well in the public (just wait until you check out those Yale Climate Opinion maps!).
This is by no means an exhaustive list, but I want to demonstrate that there is a place for careful stewardship of our natural resources within conservative values (there are those values again - influencing our positions on things!).
- RepublicEN [209] - established by former Congressman Bob Inglis from South Carolina, this organization seeks to support market-based solutions to a changing climate
- Climate Solutions Caucus [210] - there's one for the House and one for the Senate - these are bipartisan groups of congresspeople working together toward federal climate action
So really, I just wanted to take a step back and say that while on the surface we may think we understand the party lines, and that is true in many ways, it's not good to make generalized judgments. Instead, we need to find ways for everyone to work together to address climate change while also addressing the values that matter most to them.
Summary
This week has really just been a bit of a pause for us to think about how we connect with people on climate change.
Key takeaways:
- It's important to understand and appreciate the underlying values that inform our position on climate change.
- We need to talk with our friends, family, and neighbors about the things that matter most to them and connect those concerns to climate change.
- Yes, this is a political hot potato, but it's not entirely binary and making assumptions doesn't help us craft constructive conversations.
Reminder - Complete all of the Lesson 8 tasks!
You have reached the end of Lesson 8! Double-check the lesson assignments in the corresponding lesson module in Canvas to make sure you have completed all of the tasks listed there.
9: Individual Behavior and Collective Action
This week, we're going to explore the tension between two opposing narratives about who's to 'blame' for climate change and who therefore needs to 'fix' the problem. And, like many of the topics we've explored this semester, it all boils down to scale! (Geography matters!!!) We hear a lot about the agency of individuals in the fight against climate change, but what does it mean when a global oil company encourages us to reduce our fuel consumption? As you'll see, there aren't any simple answers, but we're going to dig in and explore these topics with the ultimate goal in mind of using what we learn for effective and constructive science communication.
Because this topic is evolving and dynamic, your primary responsibility will be the readings assigned in Canvas. There are no associated lesson content pages here for this week.
What will we learn?
By the end of this lesson, you should be able to identify and discuss the following:
- the relative merits of encouraging (and participating in) individual action to address the climate crisis
- the shortcomings of relying on individual action to address the climate crisis
- the relative merits of systemic collective action to address the climate crisis
- the shortcomings of systemic collective action to address the climate crisis
What is due this week?
This lesson will take us one week to complete. Please refer to the corresponding module in Canvas for specific assignments, deliverables, and due dates.
Questions?
If you have questions, please feel free to post them to the "Have a question about the lesson?" discussion forum in Canvas. While you are there, feel free to post your own responses if you, too, are able to help a classmate.
10: Mitigation
This lesson explores greenhouse gas mitigation — actions that prevent, limit, delay or slow the rate of climate change.
What will we learn?
By the end of this lesson, you should be able to:
- describe the concept of greenhouse gas mitigation and articulate the role it plays in addressing the climate crisis;
- understand the difference between climate change mitigation and adaptation measures;
- value the importance of stabilizing atmospheric CO2 concentrations;
- articulate the importance of staying within the carbon budget to contain warming to between 1.5-2 degrees Celsius;
- understand the timescale on which emissions stabilization and reductions must occur to stay within that warming range.
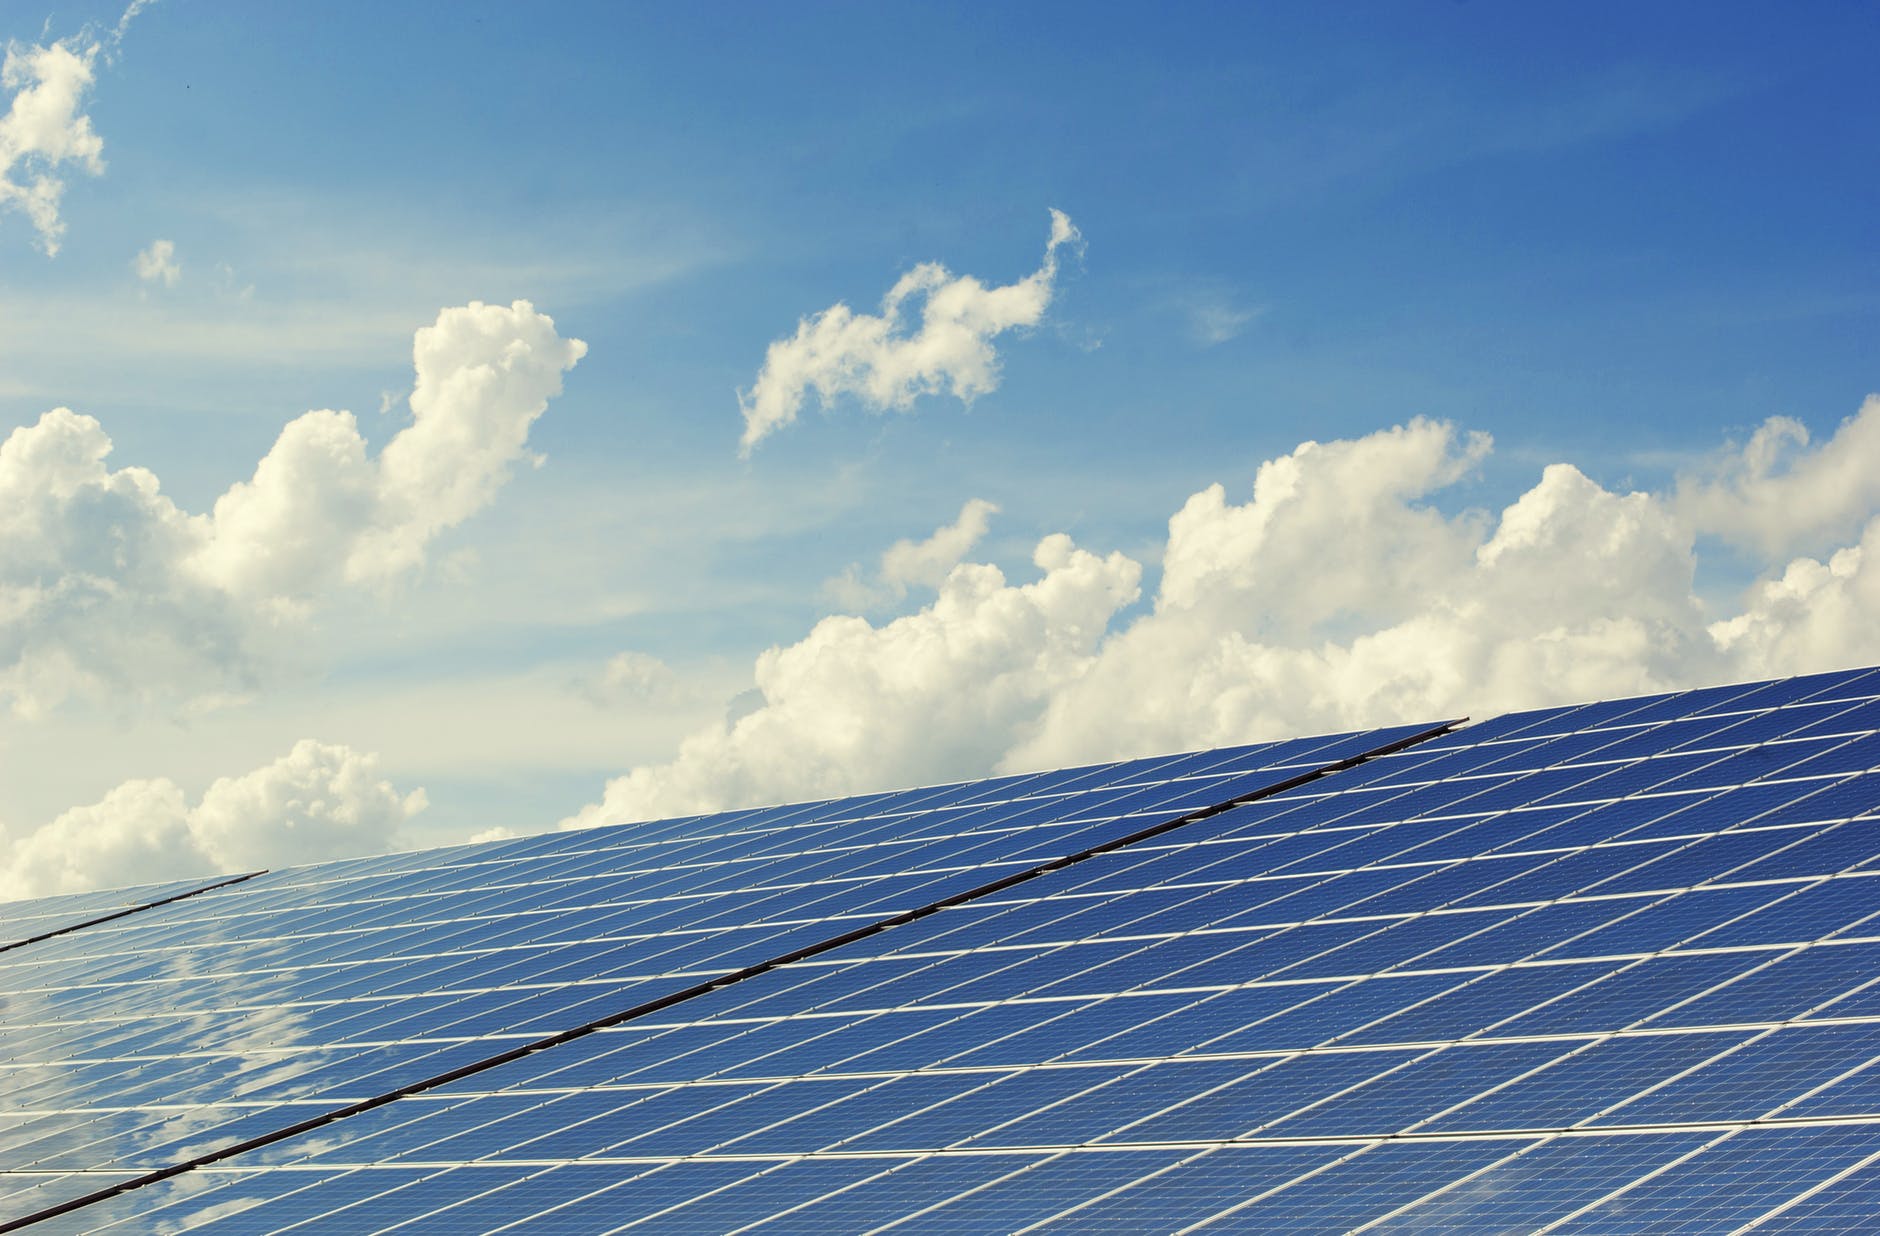
What is due this week?
This lesson will take us one week to complete. Please refer to the corresponding module in Canvas for specific assignments, deliverables, and due dates.
Questions?
If you have questions, please feel free to post them to the "Have a question about the lesson?" discussion forum in Canvas. While you are there, feel free to post your own responses if you, too, are able to help a classmate.
The difference between mitigation and adaptation
This week, we're looking at mitigation and next week we'll turn our attention to adaptation. It's important to understand the difference between these two ways we respond to climate change because they:
- often occur at different geographic scales;
- tackle different parts of the problem;
- lead to specific outcomes not fulfilled by the other.
In other words, these terms are not interchangeable, nor do they happen in isolation.
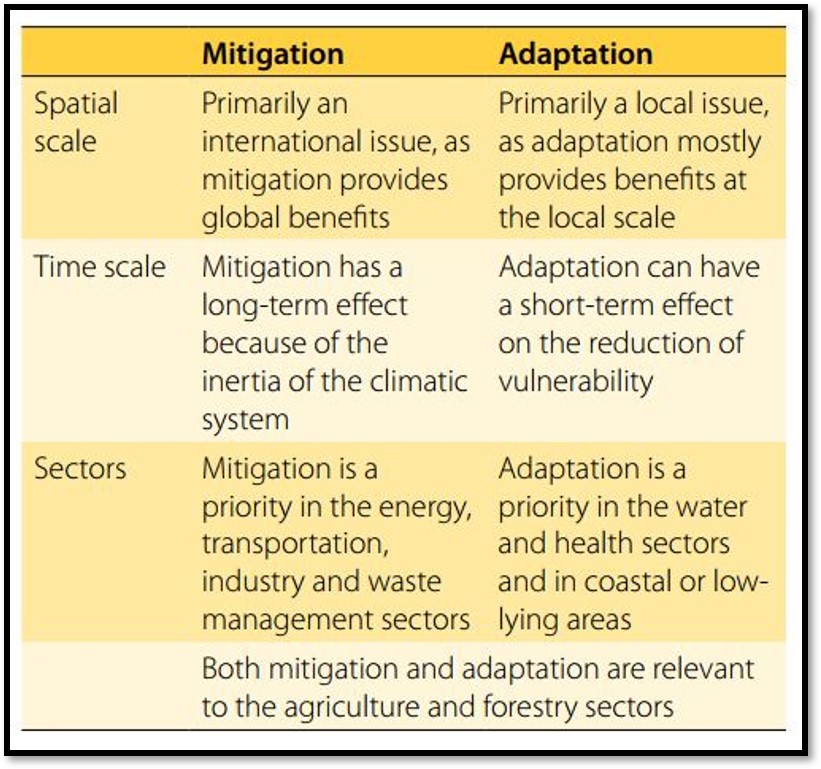
| Mitigation | Adaptation | |
|---|---|---|
| SPACIAL SCALE |
Primarily an international issue, as mitigation provides global benefits |
Primarily a local issue, as adaption mostly provides benefits at the local scale |
| TIME SCALE |
Mitigation has a long-term effect because of the inertia of the climatic system |
Adaptation can have a short-term effect on the reduction of vulnerability |
| SECTORS |
Mitigation is a priority in the energy, transportation, industry and waste management sectors |
Adaptation is a priority in the water and health sectors and in coastal or low lying areas |
The simplest way to understand it is:
- mitigation - addresses the root cause of climate change (emissions)
- adaptation - addresses the impacts of climate change
Another way to think about this is mitigation is getting your flu shot to avoid illness while adaptation is taking medicine after you've gotten sick to alleviate your symptoms.
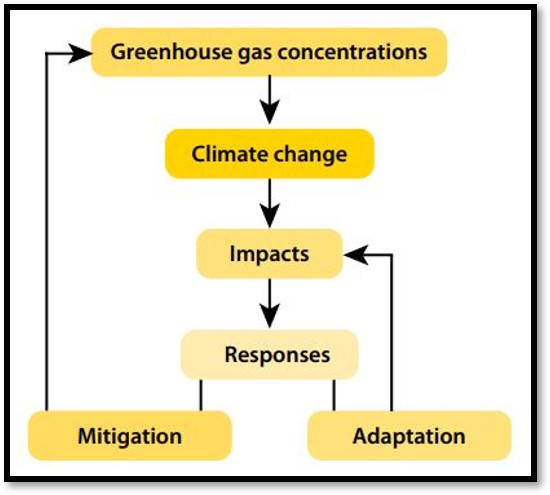
We can't focus our efforts on simply one or the other. At this point, we can't mitigate our way out of the problem entirely. Our centuries of fossil fuel combustion have already committed us to a certain amount of warming, even if we shut every emissions source down right now. Conversely, if we throw up our hands and decide that it's too hard to find lower-carbon solutions and instead we'll focus our efforts on adapting to the new normal, we likely won't be able to keep up with the pace and severity of change. We need to work on both parts of the problem: adapt to the warming and impacts we're already likely to face and reduce emissions now to prevent worsening impacts in the future.
Tradeoffs
Ultimately, the path we take to address climate change will be characterized as emphasizing one of three frameworks for response:
- mitigation - where we focus on tackling those root causes of emissions;
- adaptation - where we focus on preparing for the changes we're committed to seeing;
- inaction - where we continue on our business and usual ways and respond only in reactionary ways to changes around us.
It's up to us to define our path (and be thinking about the path you want to take; you'll need that for Exam 3!!!). And if we're being honest, neither mitigation nor adaptation alone will save us. We need to emphasize both. If we shut down all of the power plants and took all the internal combustion engine cars off the roads today, we're still committed to a certain level of impacts from our historical emissions (see If We Stopped Emitting Greenhouse Gases Right Now Would We Stop Climate Change? [214] over on The Conversation for a nice discussion of this by Richard Rood, 2017).
The emphasis we choose leads to different costs and consequences. As a society, we need to identify the tradeoffs we're willing to accept and the ones we are not. This values-based introspective will guide the path we take. Do we want to spend aggressively on mitigation so that adaptation costs down the road are less? Or should we turn our attention to adapting to the likely future a not-so-very-well-mitigated scenario leads us to? And if we choose not to mitigate or adapt aggressively, are we willing to accept the costs of that inaction? These are the questions you'll need to help craft answers to as you venture off into the world to solve this global challenge.
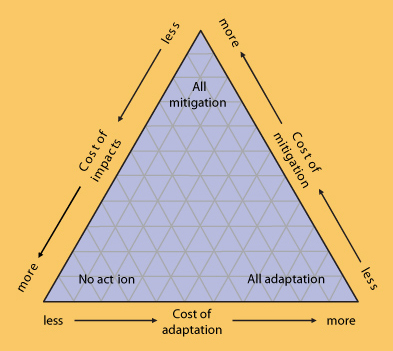
The carbon budget
We've spent the entire semester working under the premise that we need to reduce emissions and we need to do so quickly. The global carbon budget concept helps us understand not only why emissions reductions are important, but more specifically, why they are urgently important.
In 2013, the IPCC released the fifth assessment report - IPCC, 2013: Climate Change 2013: The Physical Science Basis. Contribution of Working Group I to the Fifth Assessment Report of the Intergovernmental Panel on Climate Change [215] which included an overall cap on the cumulative anthropogenic emissions of greenhouse gases possible since industrialization before we hit 2 degrees of warming and the catastrophic impacts it brings along with it. That number? A trillion metric tons. That number is arguably too big for most of us to comprehend, especially as we're thinking about it over a several centuries-long time frame. (If you're curious you can watch this real-time tracker at www.trillionthtonne.org [216] to see where we currently stand.) At the time the report was released in 2013, based on the previous several decades of emissions, they estimated we'd hit that trillionth tonne of emissions somewhere in late November 2040.
This short video (2:21) offers a concise explanation of the carbon budget. Take a look.PRESENTER: Increased carbon in the atmosphere warms the planet. Scientists estimate that humans cannot add more than 1 trillion tons, also known as 1,000 gigatons, of carbon to the atmosphere to stay below two degrees of global warming. The basic understanding is that beyond two degrees of warming, humanity will no longer have the ability to control warming trends, in part due to the release of methane currently trapped beneath the arctic permafrost.
From the beginning of the Industrial Revolution, we've spent about 515 gigatons, leaving us with 485 gigatons of carbon left to emit before hitting that two-degree warming barrier. The first half of our budget was spent over the past 200 years to build the society in which we live today. However, due to a consistently increasingly carbon-intensive world, if current trends continue, the 485 gigatons left in the budget will be spent in as little as the next 30 years.
Any use of what is left of our carbon budget that would increase our dependence on fossil fuels is akin to spending your last few dollars to cover the upfront cost of a payday loan. It may make everything look better for the time being, but when collection time rolls around, you've put yourself in a position where you are now at the mercy of external forces. And if you can't pay, mother nature just might break your kneecaps.
This means we only have 30 years to completely phase out the widespread use of fossil fuels. Therefore, as we move forward, the central policy question must be how we can expedite the decarbonization of our world so as to avoid spending it all.
The carbon budget helps us understand how much carbon we have left to 'spend' before we commit ourselves to various levels of warning. But what does that look like? Let's try to interpret these results. At current (2014 when this graphic was created) emissions levels, we had just 6 years before we reached that budget if we want to confidently contain warming to 1.5 degrees. If we decide we're ok with just shooting for 2 degrees, that stretches our budget out to about 20 years.
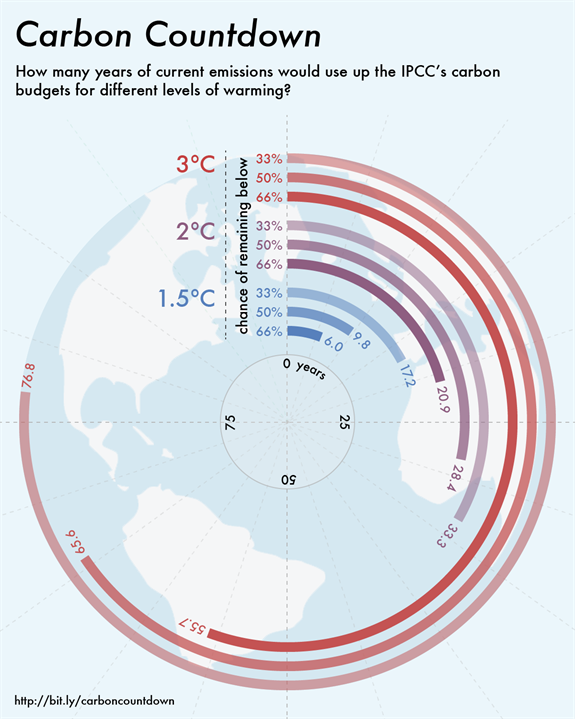
| 1.5ºC | 2ºC | 3ºC | |||||||
|---|---|---|---|---|---|---|---|---|---|
| Chance of Remaining Below | 66% | 50% | 33% | 66% | 50% | 33% | 66% | 50% | 33% |
| Years | 6.0 | 9.8 | 17.2 | 20.9 | 28.4 | 33.3 | 55.7 | 65.6 | 76.8 |
Tell me more about carbon budgets
If you want to know more about carbon budgets, see WRI's According to New IPCC Report, the World is on Track to Exceed its Carbon Budget in 12 Years [219] (Levin, 2018).
A shared budget
An important consideration of the carbon budget is understanding that it is effectively a shared account.
Imagine that you and your friends (or roommates, siblings, family, whomever) share a single bank account and must each use it to pay your bills, buy the things you need, and maybe even have some leftover for fun once in a while. But what if you've got that one friend that's always taking more? There's only so much money you can then withdraw before you'll start incurring overdraft fees. Think of the United States as that spend-happy roommate you're sharing your bank account with. Take a look.
This animated graphic (no audio) from Carbon Brief demonstrates the cumulative CO2 emissions since 1750 for countries around the world. As you watch it, take note of the scale of emissions across the top (eventually, the top country's bar almost appears to be standing still, but that's just because they're running out of room and running the scale to the left).
We've talked (briefly) about issues of equity, fairness, and climate justice - particularly as they relate to vulnerability to the impacts of climate change. While China is currently the largest annual emitter of greenhouse gases (having surpassed the US in 2017), the US is historically the biggest emitter. This means that during UN climate negotiations, many countries view the US as having a larger (or at least a large) responsibility to reducing emissions. In other words, we've enjoyed the largely unfettered economic growth and prosperity it has created since the Industrial Revolution with little in the way of climate considerations as limitations. Now, isn't it our responsibility to take an active role in addressing a problem we've had a large role in creating? Should we not use our relative economic strength, built on carbon-intensive activities, to reduce our own emissions and help ensure the most vulnerable among our global family are protected?
And then this happened while I was updating this lesson. To continue on with the shared bank account analogy, that roommate that drains your shared account regularly has announced they will no longer be making any deposits.
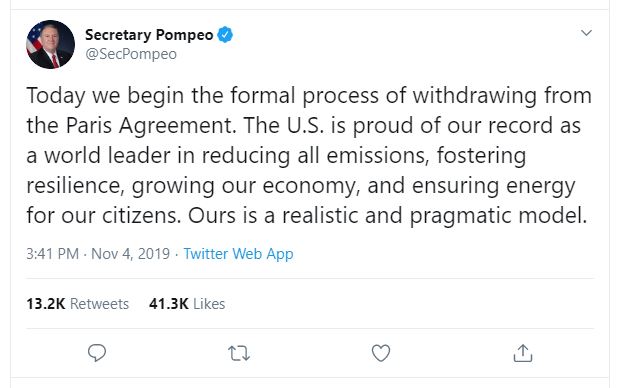
The space between
We need to think about mitigating greenhouse gases in 3 distinct phases:
- slowing emissions growth
- stabilizing emissions
- reducing emissions
Often, we talk generically about 'reducing emissions' and when we do, we're talking about reducing them from what they are right now. But in this context, we're talking about reducing them beyond the point of stabilization. We have a lot of work to do slowing emissions growth and stabilizing emissions before we can really dig into reducing them.
Each year, the UN puts out an Emissions Gap Report. Quite simply, the report shows us where we are vs. where we need to be (and how that has changed from year to year) and discusses ways to close that gap. Let's take a look.
Remember, the science tells us we want to contain warming to between 1.5-2 degrees Celsius. Those trajectories are shown in green and blue. What do you notice about how they align with projected emissions reductions under current Paris Agreement commitments (NDCs or nationally determined contributions)? The space between those scenarios is the emissions gap. Are you surprised or did you expect the gap to be this big (or this small depending on how you're looking at it)? Can we get there?
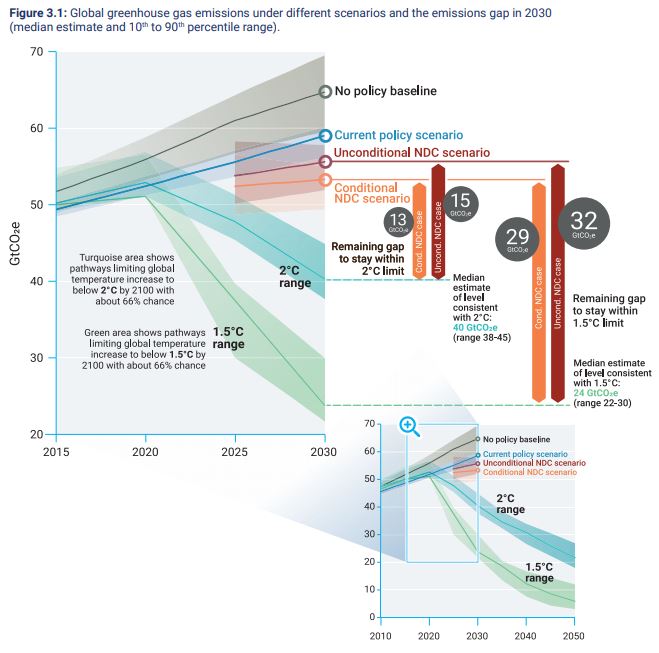
That gap looks a bit daunting, doesn't it? But how are we doing? Globally, we aren't on track to meet our 2030 goals [221] under the Paris Agreement, and in early November 2019, the Trump Administration submitted its formal request to pull the US out of the agreement altogether (this process takes a full year, though, so depending on this November's election, perhaps the US won't end up leaving the agreement).
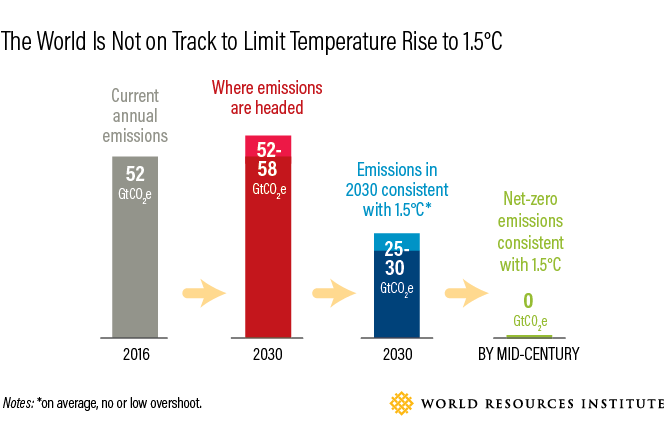
The world is not on track to limit temperature rise to 1.5ºC
Current Annual Emissions (2016): 52 GtCO2e
Where emissions are headed (2030): 52-58 GtCO2e
Emissions in 2030 consistent with 1.5ºC: 25-30 GtCO2
Net-zero emissions consistent with 1.5ºC: 0 GtCO2
Summary
This lesson was intended to be a broad overview of the concept of mitigation rather than a laundry list of types of mitigation across sectors. Rather than listing out those options, I thought it would be more useful to think about the totality of the problem as it relates to what the science is telling us needs to happen to these emissions trajectories. The SPM reading really reinforces the urgency of the problem - if we want to contain warming to 1.5C we need to halve emissions by 2030 and be net-zero by 2050. And 2030 somehow sounds really far away (in the same way that the year 2000 still feels 'recent' - to me, anyway), but it's 10 years from now. And as we are thinking about turning the cogs necessary for the large scale systemic change we need, a decade doesn't feel so long.
The Davis et al. piece is an update to a reading assignment I used to use for this class (Stabilization Wedges: Solving the Climate Problem for the Next 50 Years with Current Technologies [223] by Pacala and Socolow from 2004). I've tried to update that a bit since it was getting outdated and in the intervening years, we've just kept adding to our emissions, meaning we need more and more wedges. I like to think of these wedges as a precursor to the solutions we see in Project Drawdown [224]. The message is the same in both frameworks, and it's an important one to hear:
We already have everything we need to mitigate GHGs and avoid the most catastrophic impacts of climate change. Everything, except perhaps the political will to deploy the solutions. It's an important framework to explore - we often think that we need to find some magic technological fix, but in reality, we already have lot of tools in our toolbox to pull that emissions curve steeply down. Are they easy? Cheap? Popular? Maybe not. But do they exist? Absolutely.
Reminder - Complete all of the Lesson 10 tasks!
You have reached the end of Lesson 10! Double-check the lesson assignments in the corresponding lesson module in Canvas to make sure you have completed all of the tasks listed there.
11: Adaptation
Even if we stopped emitting all greenhouse gases today, we're still committed to a certain degree of warming due to our historical emissions and the lag time that the gases remain in the atmosphere. In short, we can't mitigate our way out of the problem entirely, so in addition to thinking about what it will take to sharply pull down our emissions curve, we also need to be anticipating the impacts to which we're already committed and preparing for them locally to create strong, resilient communities.
What will we learn?
By the end of this lesson, you should be able to:
- understand the differences between reactive and anticipatory adaptation measures and which of those types of adaptation we've historically relied more heavily upon;
- remember from our mitigation lesson the key differences between mitigation and adaptation;
- explore some examples from around the world of climate change adaptation in action;
- articulate the needs for immediate action on adaptation and opportunities to finance these actions.
What is due this week?
This lesson will take us one week to complete. Please refer to the corresponding module in Canvas for specific assignments, deliverables, and due dates.
Questions?
If you have questions, please feel free to post them to the "Have a question about the lesson?" discussion forum in Canvas. While you are there, feel free to post your own responses if you, too, are able to help a classmate.
Types of Adaptation
There are two broad categories of adaptation for us to understand:
- reactive adaptation - as the name implies, reactive adaptation measures are implemented only after we've seen or felt the initial impacts of climate change
- anticipatory adaptation - involves adaptation measures taken before the impacts are ever felt (we anticipate what they might be and respond proactively)
The Repetto reading for this week walks through adaptation by type quite nicely (which is why despite it being 11 years old, I'm using it - I can't find another paper that describes this so well). There are tradeoffs associated with each type of adaptation, as you might imagine.
- Which suite of measures do you think is more effective?
- Which one do you think is more expensive?
Be thinking about these questions as you work through the Repetto reading.
The table below lays this out pretty nicely to help you sort out where certain adaptation practices fall. What do you notice immediately? Natural systems can only respond reactively to climate change. The ability to anticipate and plan for these changes is uniquely human, and as such you could argue we have an even greater responsibility to prepare our natural systems for the changes on the horizon.
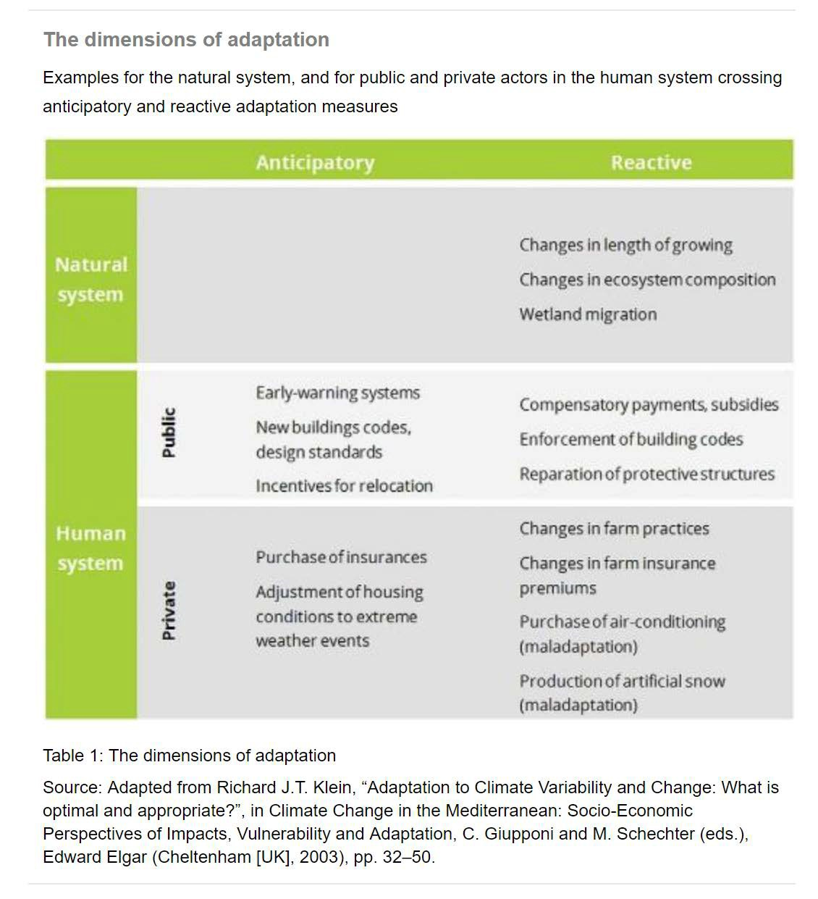
| Anticipatory | Reactive | ||
|---|---|---|---|
| Natural System |
Changes in length of growing Changes in ecosystem composition Wetland Mitigation |
||
| Human System | Public |
Early-Warning systems New Building codes, design standards Incentives for relocation |
Compensatory payments, subsidies Enforcement of building codes Reparation of protective structures |
| Private |
Purchase of insurances Adjustment of housing conditions to extreme weather events |
Changes in farm practices Changes in farm insurance premiums Purchase of air-conditioning (maladaptation) Production of artificial snow (maladaptation) |
Maladaptation
In the IPCC Fifth Assessment Report, Working Group II (Impacts, Vulnerability, and Adaptation) offered this definition of maladaptation:
"...actions that may lead to increased risk of adverse climate-related outcomes, increased vulnerability to climate change, or diminished welfare, now or in the future." (IPCC Working Group II, 2014)
And while we tend to think of maladaptation in its most basic sense as being action that makes something worse, the IPCC went on to provide categorical examples of maladaptive actions:
| Broad type of maladaptive Action |
|---|
| Failure to anticipate future climates. Large engineering projects that are inadequate for future climates. Intensive use of non-renewable resources (e.g., groundwater) to solve immediate adaptation problem. |
| Engineered defenses that preclude alternative approaches such as ecosystem-based adaptation. |
| Adaptation actions not taking wider impacts into account. |
| Awaiting more information, or not doing so, and eventually acting either too early or too late. Awaiting better "projections" rather than using scenario planning and adaptive management approaches. |
| Forgoing longer term benefits in favor of immediate adaptive actions; depletion of natural capital leading to greater vulnerability. |
| Locking into a path dependence, making path correction difficult and often too late. |
| Unavoidable ex post maladaptation, e.g., expanding irrigation that eventually will have to be replaced in the distant future. |
| Moral hazard, i.e., encouraging inappropriate risk taking based on, e.g., insurance, social security net, or aid backup. |
| Adopting actions that ignore local relationships, traditions, traditional knowledge, or property rights, leading to eventual failure. |
| Adopting actions that favor directly or indirectly one group over others leading to breakdown and possibly conflict. |
| Retaining traditional responses that are no longer appropriate. |
| Migration may be adaptive or maladaptive or both depending on context and the individuals involved. |
Adaptation all around us
Whether through reactive or anticipatory measures, communities around the world are already responding to the impacts of climate change. Let's highlight just a few examples.
These short video clips, produced by the Global Commission on Adaptation (we'll read something from this organization this week, too), give you a glimpse into some adaptation measures and perspectives of the people on the front lines of climate change impacts from around the world. Take a look (all fair game for upcoming quizzes and exam). The New York City example feels distinctly different than the first three, doesn't it? What's different about it? Think about what surprised you the most from the videos (I can pinpoint the biggest shock to me, and I'll share it with you later in the week.)
LIZ LEVY: I'm Liz Levy. I'm from Jamaica. And I farm hot peppers, specifically scotch Bonnet peppers, which is what Jamaica is known for. If the last four years are anything to go by, climate change is real. And it's here to stay.
What is normal now? Is it the years when we have four months of back-to-back rains? Or is normal half the amount of rainfall? What is normal? I don't know. I'm still trying to figure it out. It's affected me to the point where I've had to relocate my whole farm from one area of the island to another.
It's a really neat little thing. You enter the district that you're farming in, and he has a tailor-made, custom-made weather outlook for you for the next day or two. I know that I use it about 7:00 so I can make last-minute calls to my workers as to whether or not there are going to be any changes in what we do with the farming. There are not huge margins in farming. And anything that can help you to avoid wasting money and help the whole planning process to maximize what you want to get out of your crop.
When it comes to climate change, the first thing is just to accept that it's real. It's not a fluke. It's not an odd year. Then it's very liberating. You can start looking for help. And you'll be surprised to know how much help there is out there.
Archana: My name is Archana Ramesh Bhosale. I have five acres of land and I live with my family in Maharashtra, India.
Words on Screen: Climate Crisis in Maharashtra. Rainfall down 31%, rising temperature up to 2-4 degrees Celsius, food production projected down 22%.
Archana: 20 years ago, when I was a child, there was a lot of water here, around 20 feet deep and we would swim and enjoy it but now the kids can’t experience it because the river is dry and the rains have decreased.
Before, the monsoons used to arrive on time and there would be 3 seasons: summer, monsoon and winter. But now, it’s uncertain when it will rain, when it will get hot and when temperatures will drop. It’s sometimes too hot, too cold or too windy. All these are changes in the climate.
When we were young, there were rivers and when we dug a pit the water was at five feet which could be used for drinking or for the household. Now, even at 1,000 feet, there’s no water in the borewells.
Words on Screen: Adaption in action, new water storage, empowering women farmers, diversifying food crops.
Archana: The water you can see here comes because during the rainy season we recharge the water sources and the farm looks lush and green because we grow crops requiring less water and we use sprinklers. We used to use water-intensive and cash-intensive crops which used chemical fertilizers. Now, we farm using organic fertilizers and have diversified to crops which use less water and require less investment which improves the health of the children, family, soil and the environment. We have made changes in our life and work and taken up livelihoods that adapt to environmental change. We have change to organic farming systems, we are developing allied businesses and we are diversifying crops so we can preserve and protect our soil, our environment and our wellbeing.
Luis: My name is Luis Angel Anchila Rojas. I live in Hojancha, Guanacaste, Costa Rica. I grow coffee and citrus fruits. And right now, I have five hectares of coffee.
Words on screen: Costa Rican coffee, more than 43,000 coffee growers. Exports worth $314 million in 2017 – 2018 but global competition means critically low prices and now climate change has hit harvest yields.
Luis: Here we can see what climate change, this phenomenon that’s weighing on us, is doing. This branch should be full of coffee cherries up to here, but it doesn’t have any. Why? Because it doesn’t rain enough and so this is what happens. Bare branches, no beans, no harvest.
Words on screen: Guanacaste’s coffee crisis, many farmers face heavy losses and huge debts, leaf ‘rust’ fungus devastates harvests, climate change threatens long term future.
Luis: It’s a plant that needs to have moisture in the soil permanently and the soil dried out because the high temperatures take away the moisture and this is what climate change has brought. The climate is unpredictable. When it needs to rain March, it doesn’t come until April or May and when it does rain, it rains too hard.
Words on screen: How growers adapt to climate change. Tree planting for shade, increased irrigation, switching coffee varieties and growing new and different crops.
Luis: Due to all the problems with coffee, we have come up with a good alternative-the idea of growing citrus trees. At first, there was some doubt, but now it’s become a profitable product and so we are diversifying to coffee and citrus. It’s resilient, it blossoms really well. There isn’t a lot of loss of the fruit. There are diseases that affect it but they’re much more manageable. I see it as a solution. It’s another door to open. There are ways we can offer a good environment for plants, for coffee or citrus, or whatever crop and that is to have care and be conscious of what you’re doing and act with love and excellence. You can do it.
JAINEY BAVISHI: My name is Jainey Bavishi, and I'm the director of the New York City Mayor's Office of Resiliency. I'm responsible for helping to prepare the city for the unprecedented challenge of climate change.
We're facing more extreme coastal weather events, coastal storm events, such as Hurricane Sandy, and we expect those kinds of storms to continue to become more frequent and more intense.
Lower Manhattan is the economic hub of not only the city, but also the country. By 2100, we expect 50% of lower Manhattan to be at risk to coastal storms, storm surge from coastal storms. And also by 2100, we expect 20% of the streets of lower Manhattan to be subject to daily tidal inundation.
The city is implementing a $20 billion resiliency and adaptations strategy citywide. This work is focused on adapting to the risks of sea level rise, storm surge, extreme heat, and intense precipitation.
I'm standing here on a sand dune on Rockaway Beach. The city actually built this dune after Sandy to provide protection for the Rockaway community. It's just one of the layers of protection in our multilayer strategy. We've also put more sand on the beach, so the beach is wider than it's ever been before. And we've rebuilt the Rockaway boardwalk. It's now 5.5 miles of steel-reinforced concrete.
Here in New York City, we expect temperatures to rise by 4.1 to 5.7 degrees Fahrenheit, and the number of days above 90 degrees Fahrenheit to triple by the 2050s.
The Cool Roofs program is focused on painting rooftops with a special white reflective coating that keeps buildings cooler, but also reduces ambient temperatures in the neighborhood when we can do them in clusters.
We've painted 10 million square feet of rooftops white so far, and we aim to paint at least one million square feet a year.
The way I see building resilience of the city is sort of like strengthening your immune system. We know that there will be more extreme weather that the city has to deal with, just like you know that you're going to get a cold. You can't stop it. But you want to make sure that you're preparing your body to weather that cold and recover as quickly as possible. In the same way, we're preparing the city to bounce back from extreme weather events as quickly as possible.
Connection to mitigation
Last week, we spent some time thinking about the differences between mitigation and adaptation as they relate to climate change. Let's revisit that thinking for a moment.
Mitigation is our big-picture, tackle the problem at its root cause way to address climate change. Adaptation is our response to the impacts of the climate we've already committed to changing. Mitigation is longer term and occurs most effectively at broader geographic scales. Adaptation is inherently a more localized endeavor.
| Mitigation | adaptation | |
|---|---|---|
| SPACIAL SCALE | Primarily an international issue, as mitigation provides global benefits | Primarily a local issue, as adaption mostly provides benefits at the local scale |
| TIME SCALE | Mitigation has a long term effect because of the inertia of the climatic system | Adaptation can have a short-term effect on the reduction of vulnerability |
| SECTORS | Mitigation is a priority in the energy, transportation, industry and waste management sectors | Adaptation is a priority in the water and health sectors and in coastal or low lying areas |
We also talked about the relative costs of focusing our climate change responses more heavily toward one (or neither) of mitigation or adaptation and discovered, you really get what you pay for.

Now, we prepare to head into our final lesson on sustainable development, let's be thinking about the outcomes of both mitigation and adaptation measures, and where we see opportunities for overlap. In other words, what are some actions we can take that provide both mitigation of the causes of climate change (i.e. reduces our emissions) and also makes us more resilient to impacts?
This venn diagram is from the City of Calgary's Climate Program and it highlights efforts they're taking to both mitigate and adapt to climate change. But what I'd like you to focus on is the area of overlap - look at how implementing water conservation measures, supporting local food, emphasizing education, and other actions create benefits both in reducing emissions and building resiliency to impacts (not to mention probably making Calgary a nicer place to live along the way).
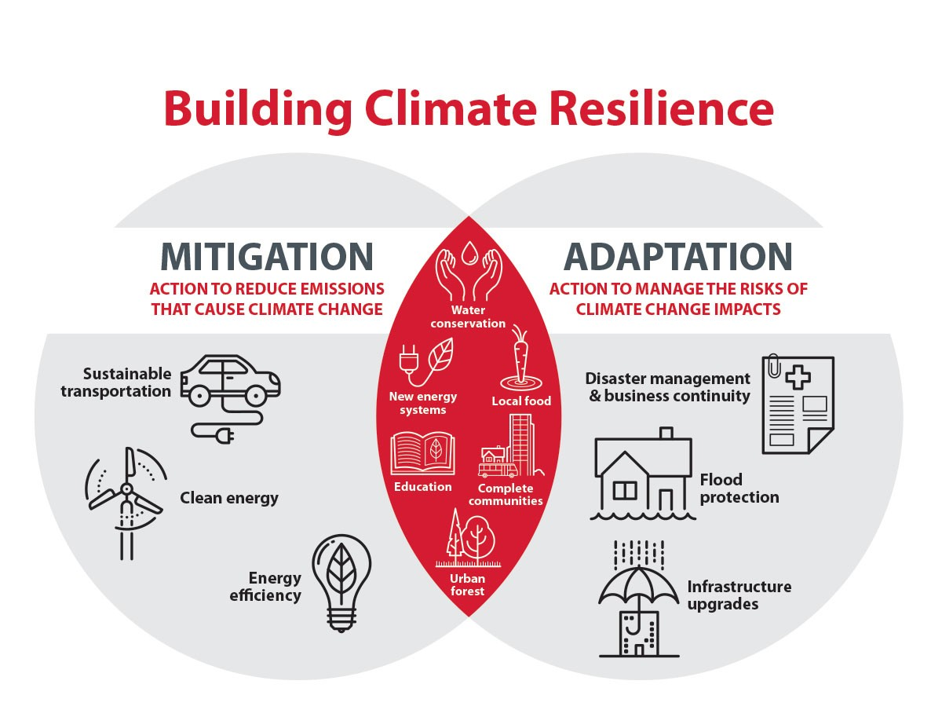
| Mitigation | Both | Adaption |
|---|---|---|
| Sustainable Transportation | Water Conservation | Disaster Management & Business Continuity |
| Clean Energy | New Energy System | Flood Protection |
| Energy Efficiency | Local Food | Infrastructure Upgrades |
| Education | ||
| Complete Communities | ||
| Urban Forest |
Summary
Adapting to climate change impacts is a necessary part of our response to the climate crisis. This week, we've talked about how no matter how swiftly and aggressively we mitigate the causes of climate change, we're still going to need to prepare for the changes we're likely to face anyway. How we choose to respond and adapt has great implications for overall cost, effectiveness, and equity. We've looked at both the US context and a broader international perspective which challenges us to think back to what we've learned about the people and places who create climate change vs. the people and places who most harshly feel the negative impacts of climate change.
Next up, we'll continue thinking about adaptation from the framework of sustainable development and look closely at the UN's Sustainable Development goals - ending our semester together on a hopeful, actionable note!
Reminder - Complete all of the Lesson 11 tasks!
You have reached the end of Lesson 11! Double-check the lesson assignments in the corresponding lesson module in Canvas to make sure you have completed all of the tasks listed there.
12: Storytelling and Climate Change
Everything we've been working on this semester leads us to this idea of storytelling. You've mastered the ability to communicate science to a lay audience in your community. Let's take this a step farther and continue to think about how we connect with our audiences. We've talked a lot about meeting people where they are when it comes to opinions on climate change. This week, I want you to really think about that. Think about how you can connect climate change to something your audience already really cares about. The good news and the bad news about climate change - it affects most everything. Then, we'll end the semester with a very fun writing assignment in which you're encouraged to think outside of the box and paint our climate future.
While there are assigned readings in Canvas, there are no associated lesson pages here on our course website.
What will we learn?
By the end of this lesson, you should be able to:
- connect climate change to issues that matter to your audience (rather than expecting your audience to make room in their personal priorities to care about climate change)
- use your communication skills to create a personal connection between your audience and climate change - moving beyond the data and toward the stories of our lives and how climate influences them
What is due this week?
This lesson will take us one week to complete. Please refer to the corresponding module in Canvas for specific assignments, deliverables, and due dates.
Questions?
If you have questions, please feel free to post them to the "Have a question about the lesson?" discussion forum in Canvas. While you are there, feel free to post your own responses if you, too, are able to help a classmate.