6: Impacts on People
Human Health, Food, and Water
I'm going to tell you a secret about climate change. It was never about the polar bears.
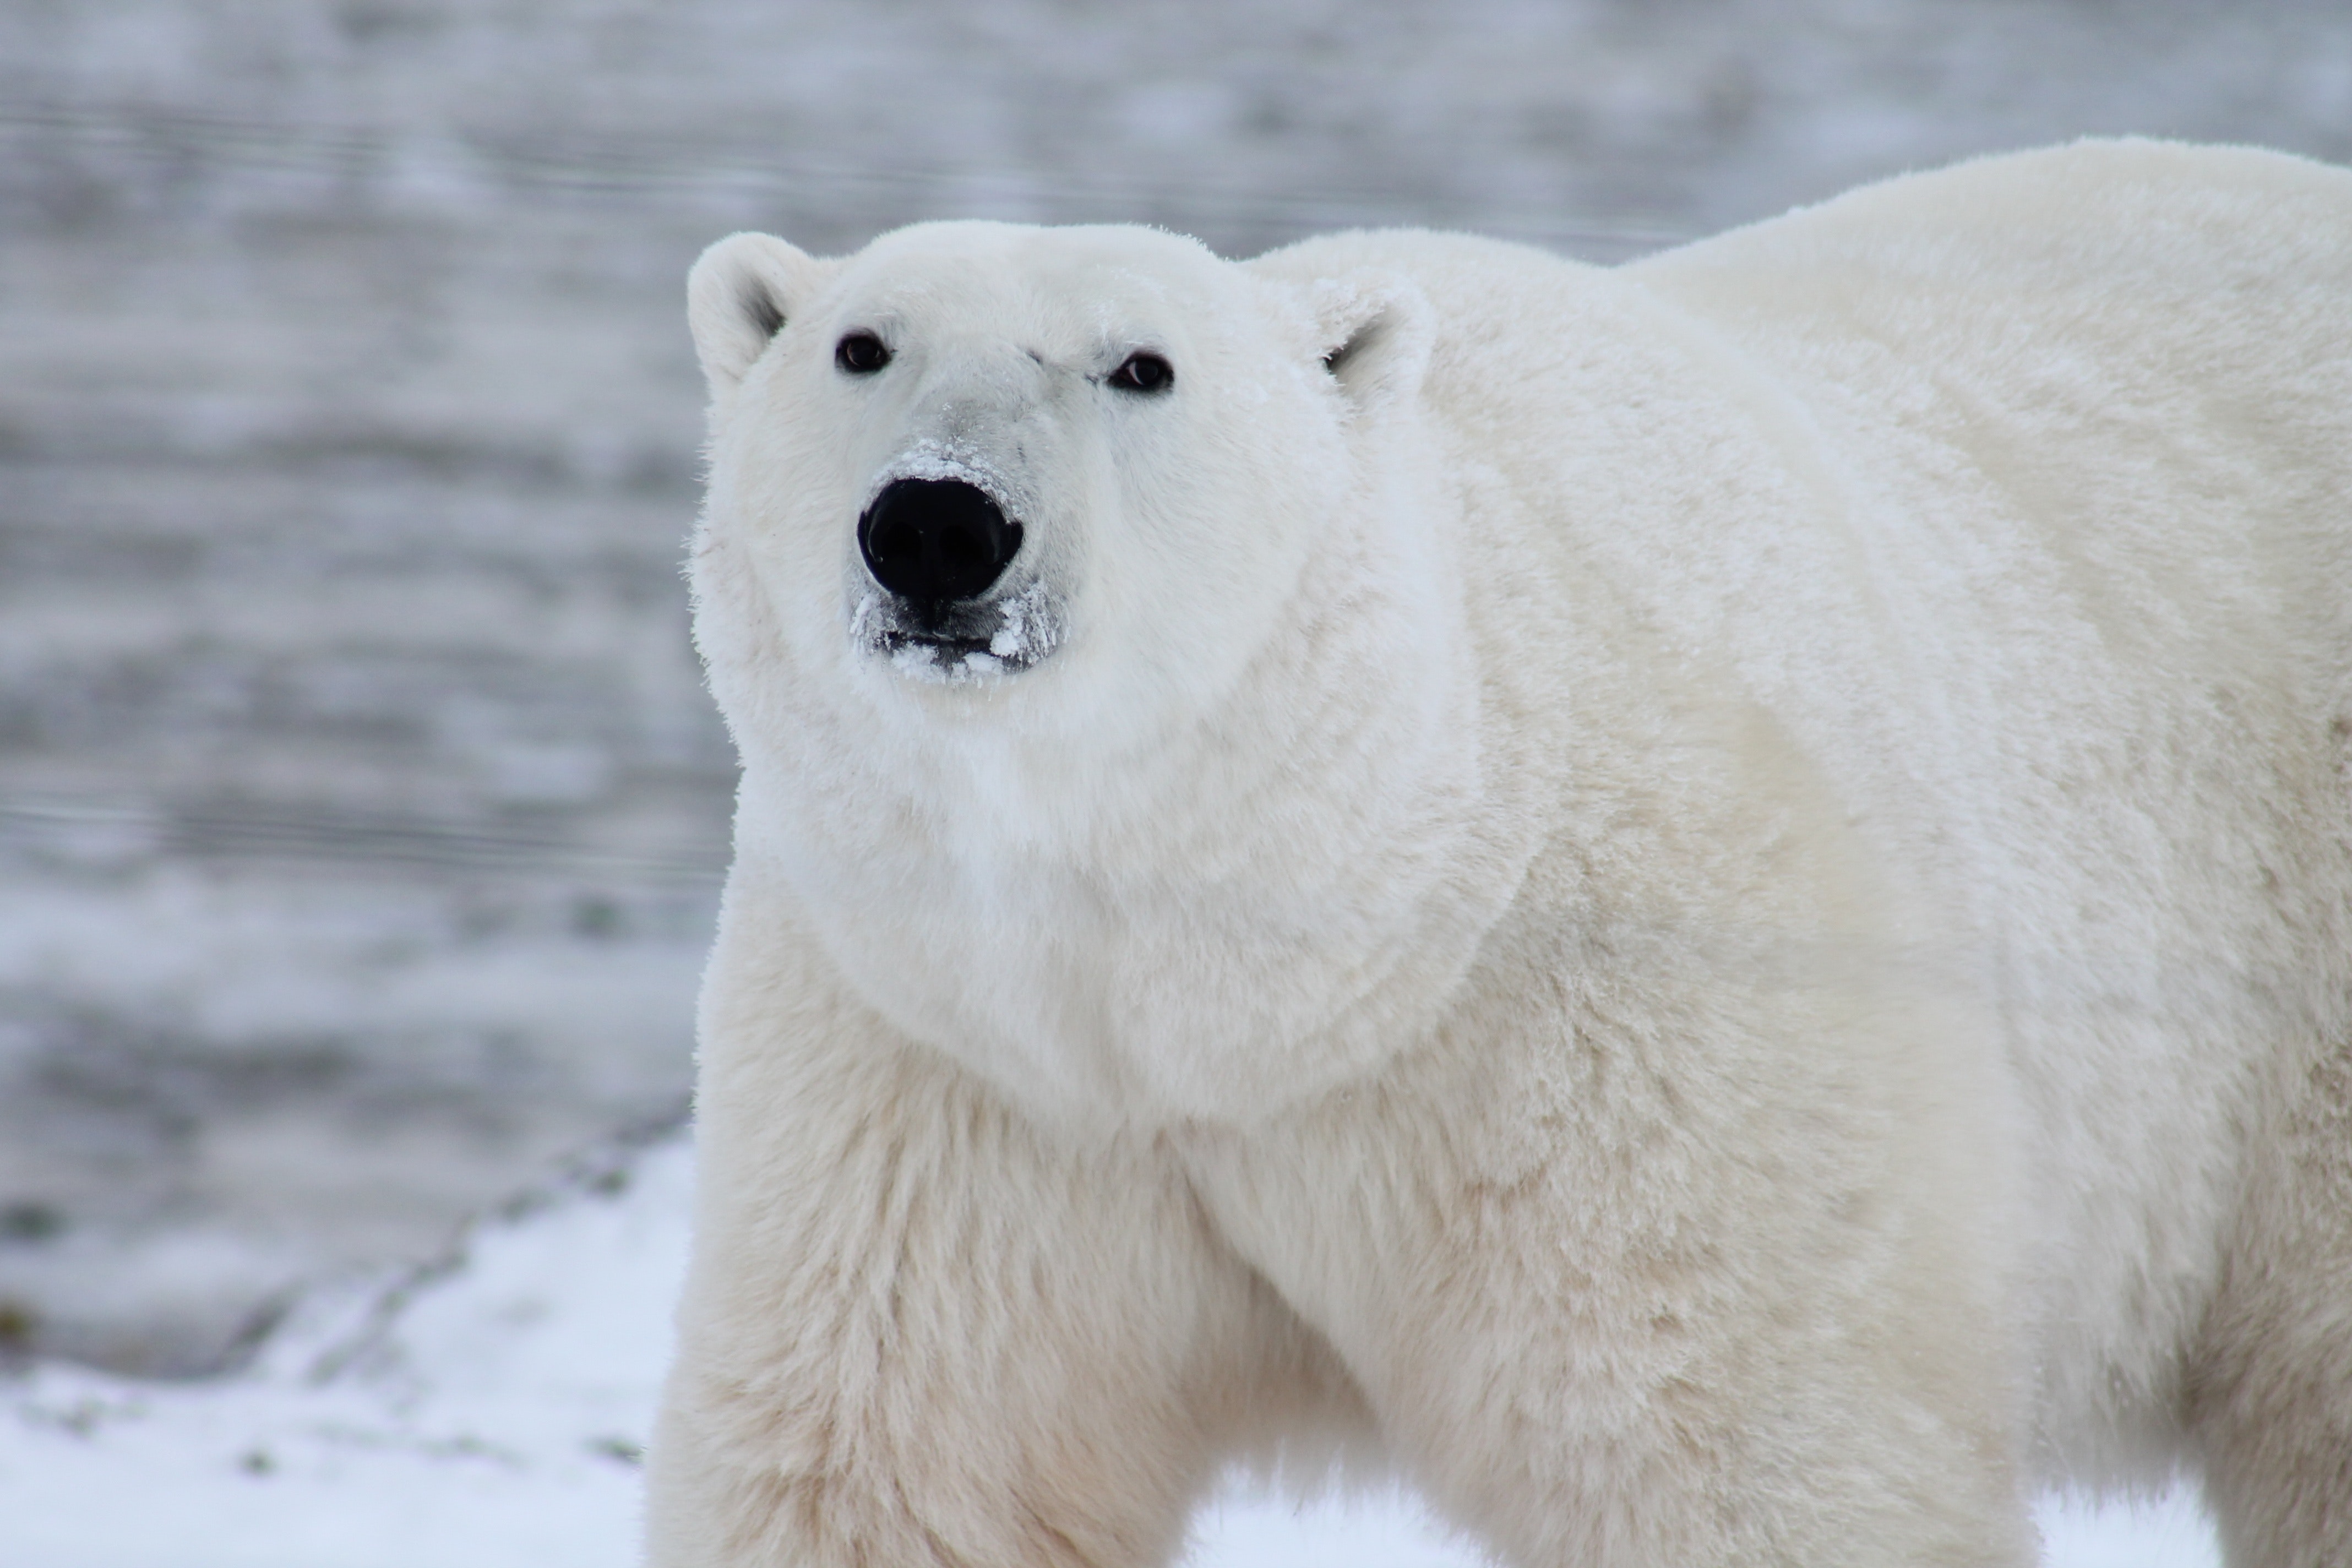
What do I mean by that? Often, it seems the messaging around the urgency to act on climate change gets lost in photos of forlorn-looking polar bears drifting on chunks of ice. Save the polar bears!!! The ice is melting and the polar bears will die. And, certainly polar bears are vulnerable to climate change (see this WWF Polar Bears and Climate Change Assessment [3]). But, my point is that we've been focusing on the wrong messaging about why we should care about climate change. While I don't like the idea of polar bears, or any species, experiencing negative impacts of a changing climate, I might not be inspired to act save polar bears because they feel kind of distant to me. Quite simply, we never should have made polar bears the unofficial mascots of climate action when ultimately, solving the climate crisis is something we need to do for our own well-being as a species.
If there's one thing we can say about humans, it's that we're inherently selfish (it's an evolutionary necessity in some ways). If we focus our climate change messaging on impacts that we feel much, much closer to home, we might just be able to inspire action. (And here, 'action' denotes not only action to address the causes of climate change but also action to respond to these possibly dangerous impacts.) So, for this week, we'll set our affinity for the fluffy white polar bears aside and worry about what climate change is already doing to people.
What will we learn?
By the end of this lesson, you should be able to:
- define the direct and indirect impacts of climate change on human health and discuss types and examples;
- identify and discuss factors beyond climate change that are fundamental to the good health of an individual and a society;
- explain the stressors of a changing climate on food security at various geographic scales;
- evaluate the interconnected nature of food security, climate change, population growth, and development;
- describe the impacts of climate change on water quantity and water quality.
What is due this week?
This lesson will take us one week to complete. Please refer to the corresponding module in Canvas for specific assignments, deliverables, and due dates.
Questions?
If you have questions, please feel free to post them to the "Have a question about the lesson?" discussion forum in Canvas. While you are there, feel free to post your own responses if you, too, are able to help a classmate.
Human Health
One of the biggest concerns that people have about climate change is how it might affect human health. What are the current and projected future health impacts of climate change? Who is at risk? What can be done to reduce those impacts and risks?
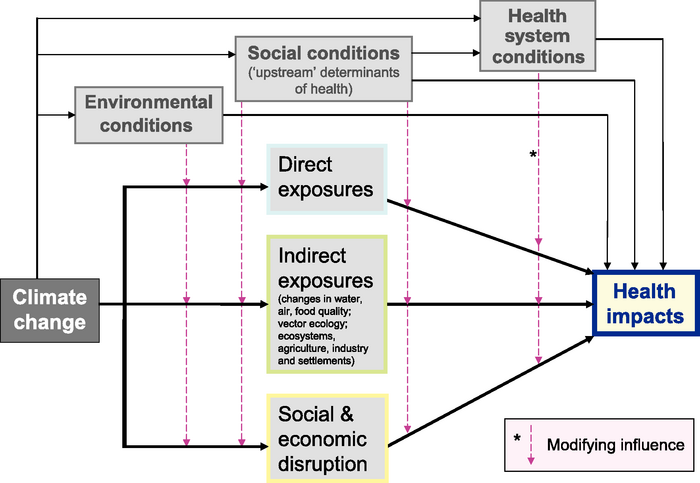
Climate change affects human health in three ways:
- direct exposure
- indirect exposure
- socioeconomic disruption
These effects of climate change do not act in isolation, however; environmental, social, and health system factors modify these impacts substantially.
It's about us.
This chart from the IPCC (it's an oldie but goodie from 2007) demonstrates the varying levels of confidence of several impacts on human health. We see red arrows of varying length pointing toward the left to denote negative impacts while we see blue arrows of varying lengths pointing to the right to denote positive impacts. What do you notice, though, about the size and frequency of the negative impact arrows vs. the positive impact arrows? (That's right! The negative impacts far outweigh the positive ones.)
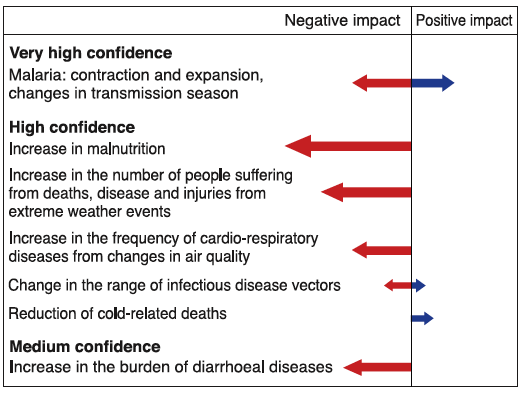
| Impact | Negative Impact | Positive Impact |
|---|---|---|
| Very High Confidence | ||
|
Malaria: Contraction and expansion, changes in the transmission season |
5 |
2.5 |
| High Confidence | ||
|
Increase in malnutrition |
10 |
- |
|
Increase in the number of people suffering from deaths, disease, and injuries from extreme weather events |
7.5 |
- |
|
Increase in the frequency of cardio-respiratory diseases from changes in air quality |
5 |
- |
|
Change in the range of infectious disease vectors |
2.5 |
1 |
|
Reduction of cold-related deaths |
- |
1.5 |
| Medium Confidence | ||
|
Increase in the burden of diarrhoeal diseases |
6 |
- |
Direct Impacts of Climate on Health
Direct impacts of climate on human health occur when the human body is physically stressed or injured immediately by some element of the climate system.
Examples of direct impacts include:
- extreme heat
- extreme cold
- other extreme weather events
Remembering that we're looking at the direct impacts on human health right now, we're thinking about the immediate impact events such as hurricanes, wildfires, droughts, and floods have on people's health. But how many people are affected by these various extreme weather events?
In 2015, the Centre for Research on the Epidemiology of Disasters (CRED) and the UN's Office for Disaster Risk Reduction (UNISDR) published The Human Cost of Weather Related Disasters 1995-2015 [5]. The timing of this report wasn't accidental - it was intended to help inform the urgency of the then-upcoming Paris climate negotiations producing meaningful targets for GHG mitigation. The two infographics below show the numbers of people affected and killed by weather-related disasters in 1995-2015.
- (Insert screeching brake sound.) Ok, but each of these types of extreme weather events was occurring before anthropogenic climate change. Yes! True. But, current understanding of the science strongly suggests that these types of events will increase in both frequency and intensity in a changing climate. So, certainly, not every person affected by a hurricane is someone who wouldn't have experienced that hurricane in the absence of climate change - that's not what we're talking about here. Instead, we're trying to understand that climate change is making these events worse in several dimensions, and this will in turn have bigger consequences for more people, and therefore we need to understand the magnitude of the potential problem and looking at the totality of people affected helps us do just that.
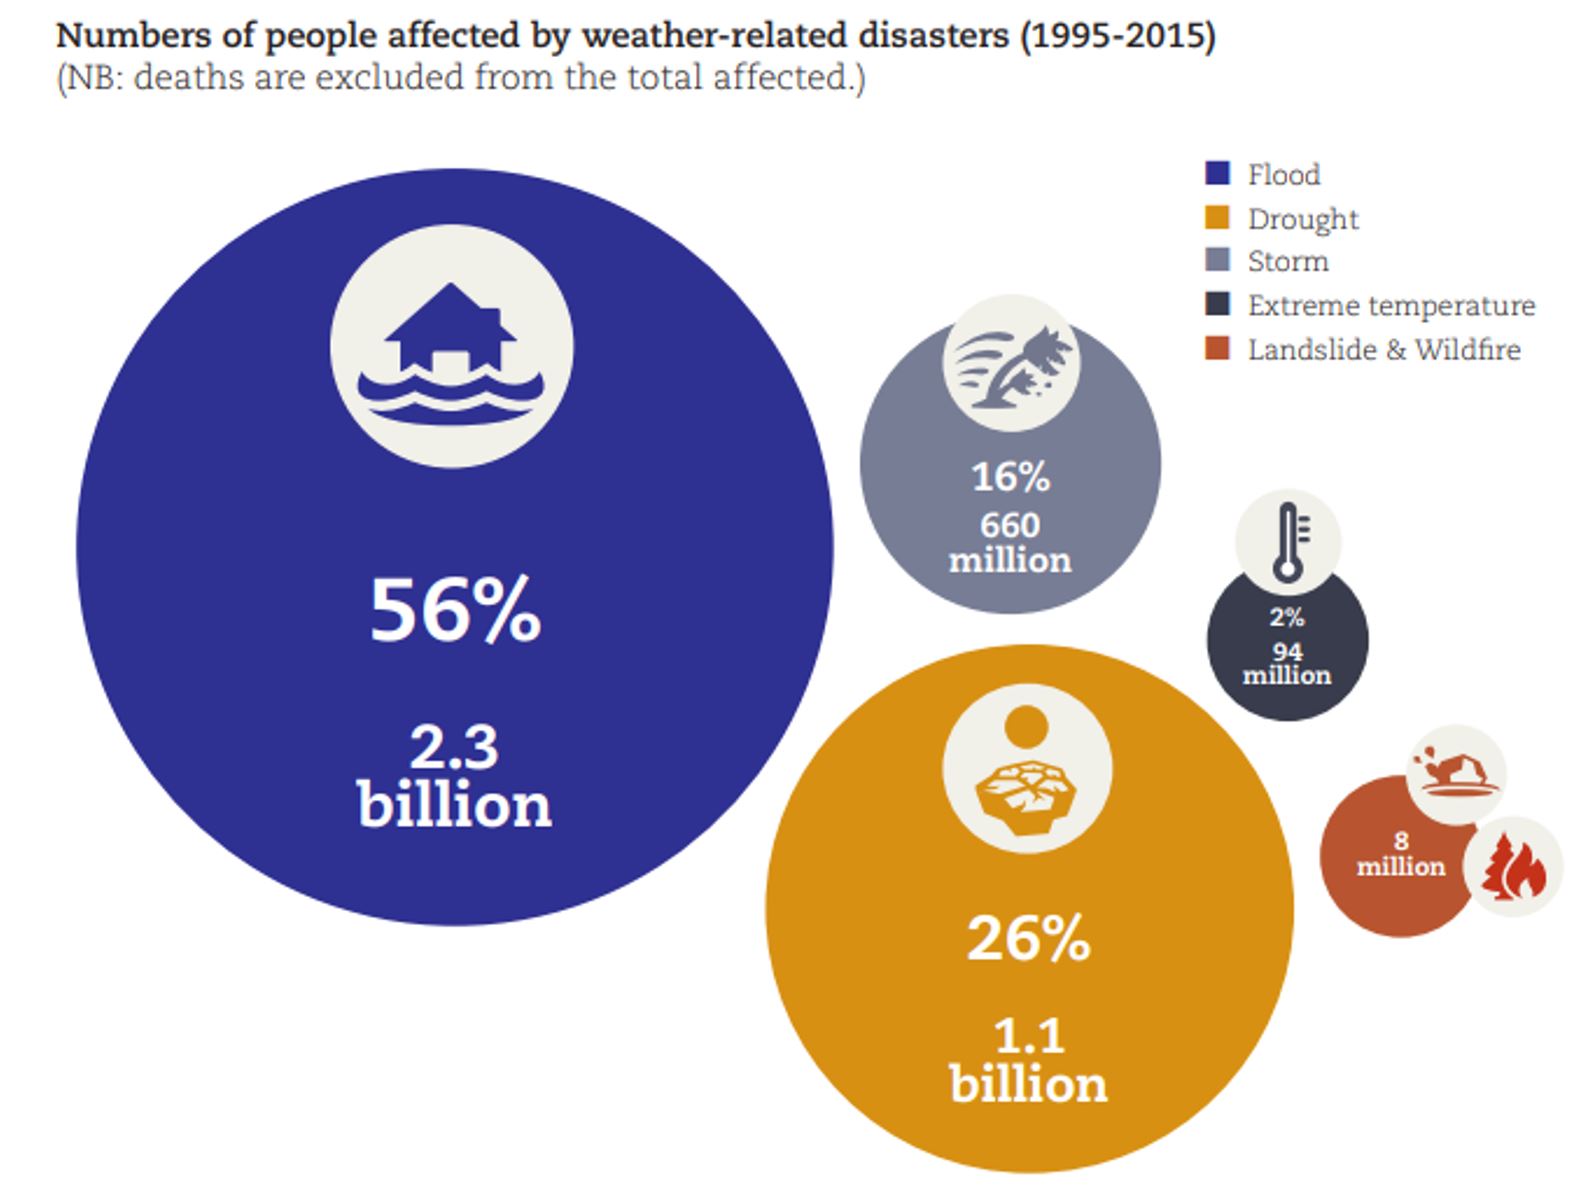
| Natural Disaster | Percent of People | Number of People |
|---|---|---|
| Flood | 56% | 2.3 Billion |
| Drought | 26% | 1.1 billion |
| Storm | 16% | 660 million |
| Extreme Temperature | 2% | 94 million |
| Landslide/Wildfire | <1% | 8 million |
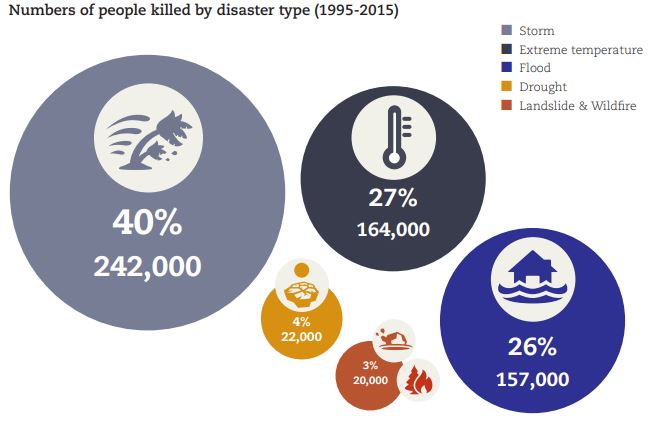
| Natural Disaster | Percent of People | Number of People |
|---|---|---|
| Flood | 26% | 157,000 |
| Drought | 4% | 22,000 |
| Storm | 40% | 242,000 |
| Extreme Temperature | 27% | 164,000 |
| Landslide/Wildfire | 3% | 20,000 |
Extreme heat
The US Global Program on Climate Change [7] defines a heat wave as, "a period of two or more consecutive days where the daily minimum apparent temperature (actual temperature adjusted for humidity) in a particular city exceeds the 85th percentile of historical July and August temperatures for that city". Heat waves have been more frequent and more intense in the last few decades. As the maps and graphs below illustrate, not only are heat waves getting more frequent, the seasons in which they occur are getting longer.
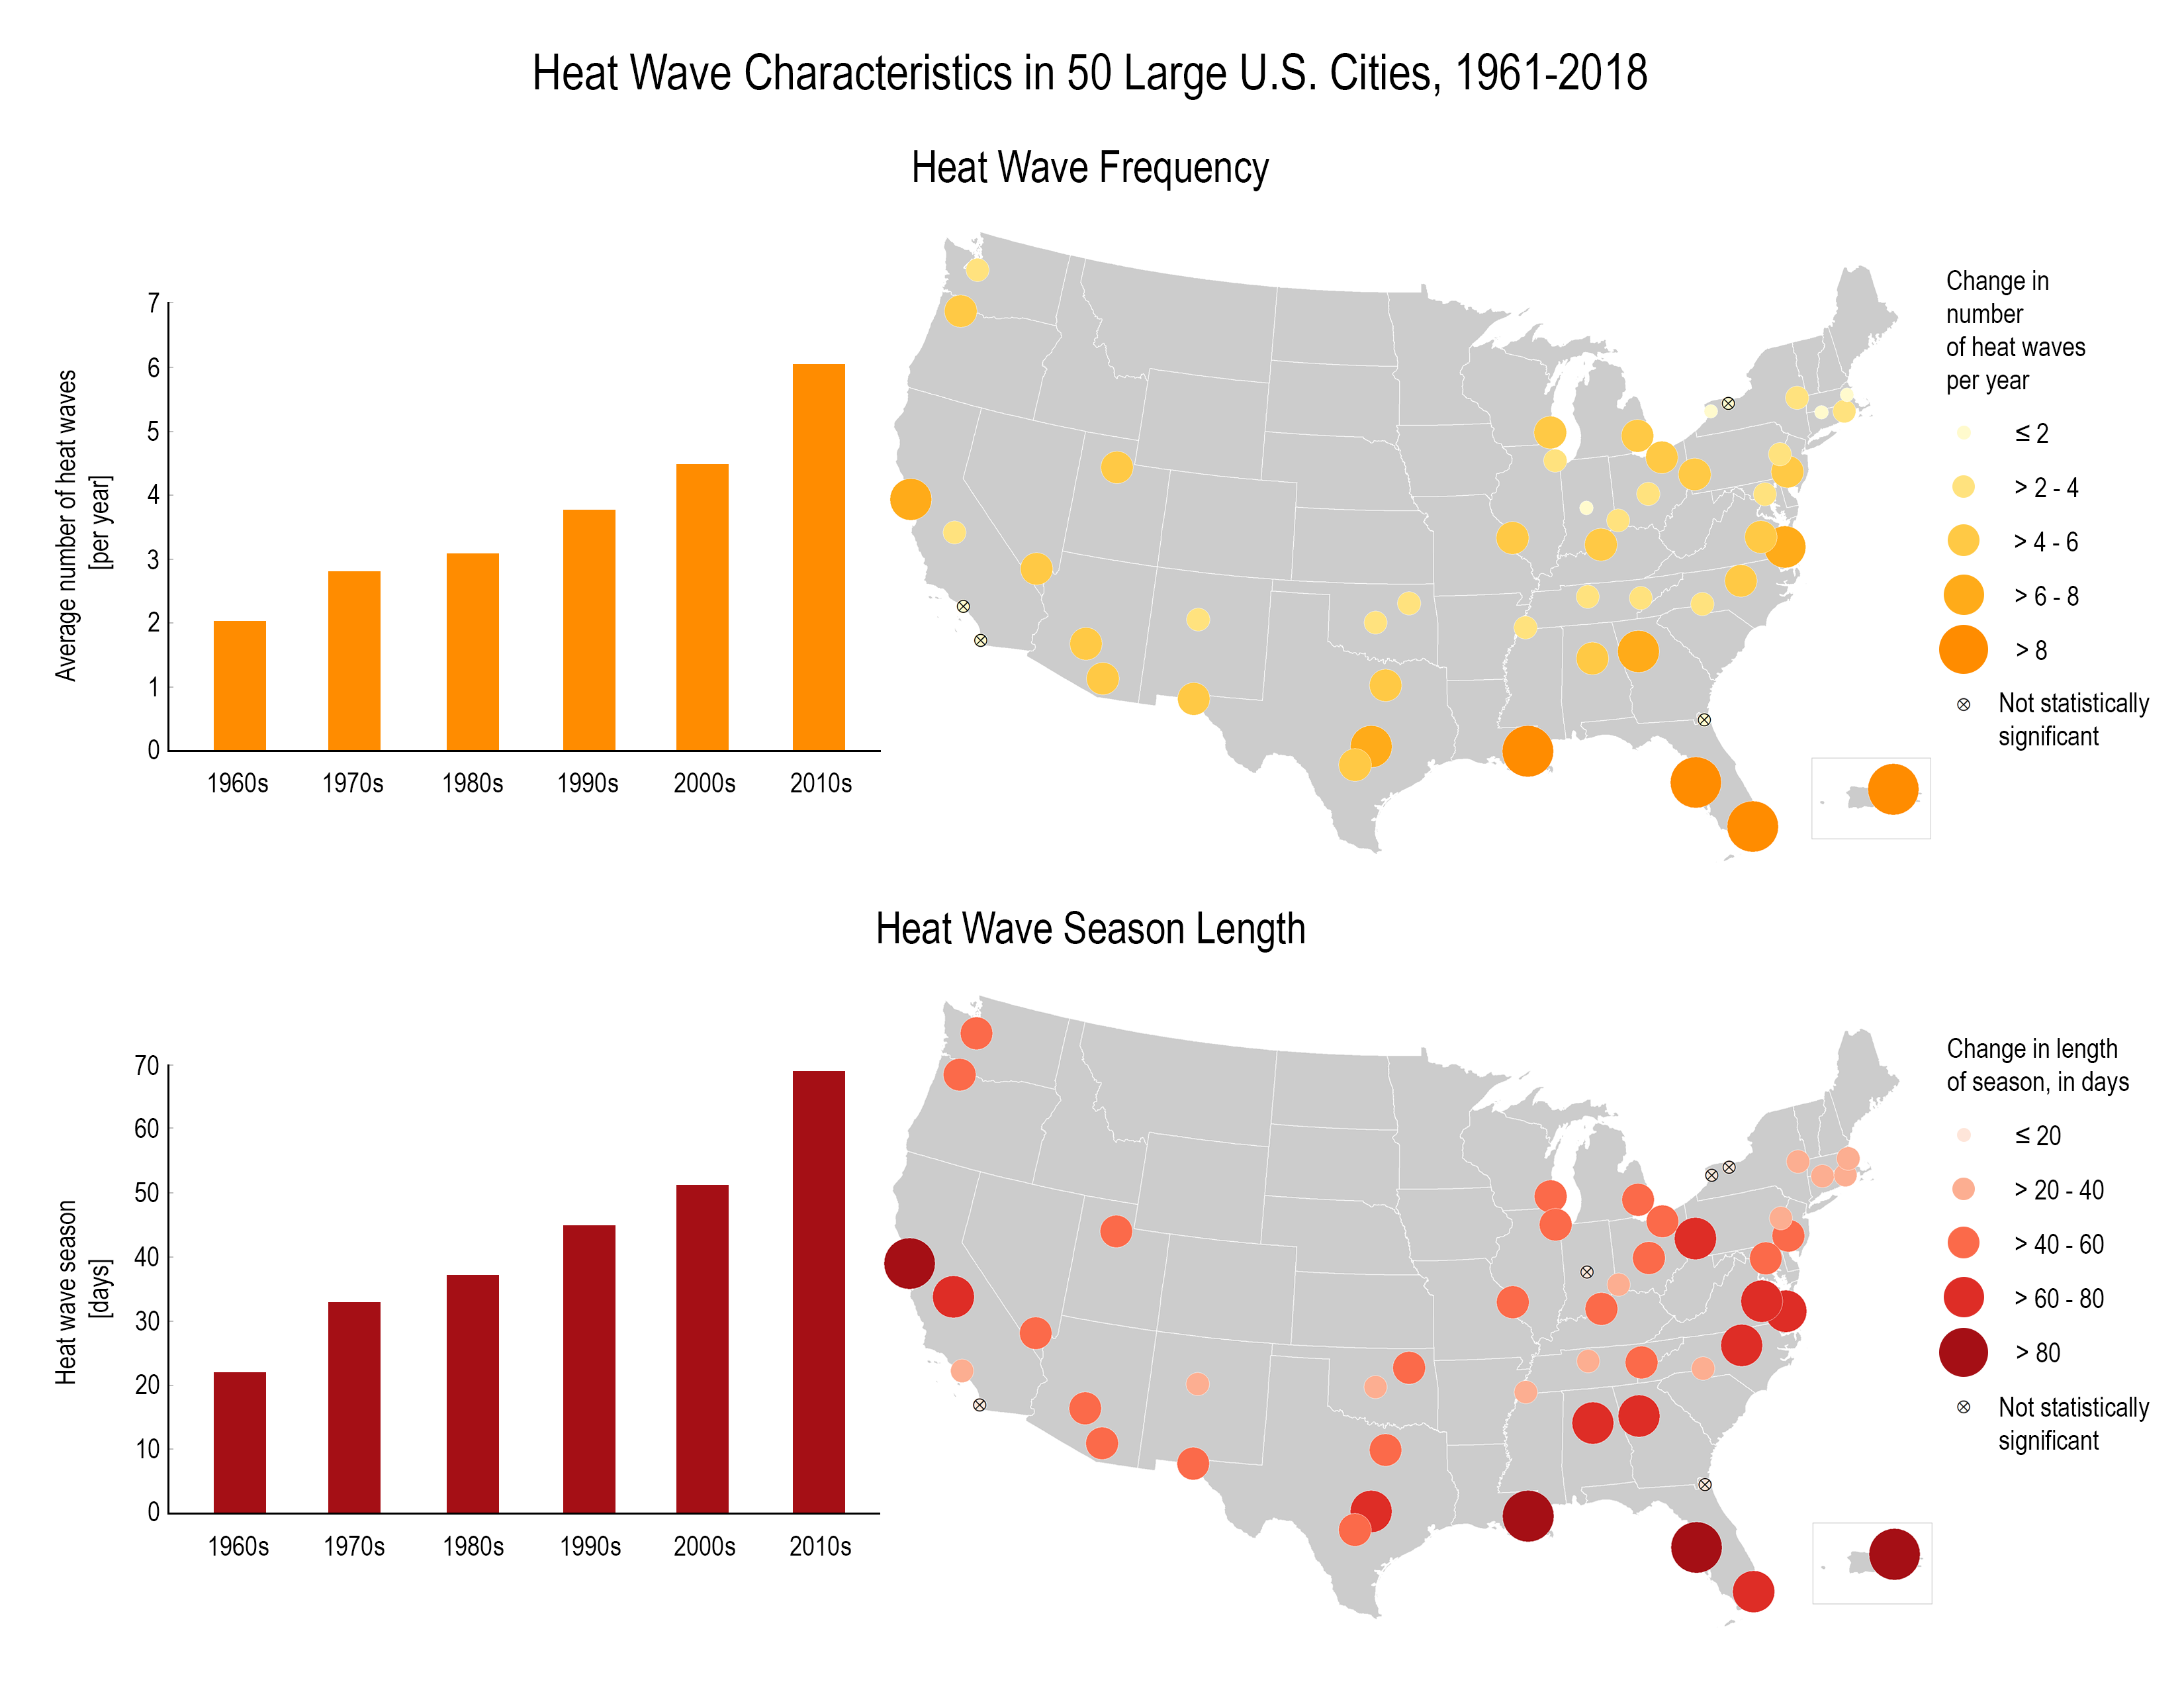
Heat Wave Characteristics in 50 Large U.S. Cities, 1961 – 2018. (Most of the cities are on the coast or the eastern half of the US.)
Heat Wave Frequency
Heat wave frequency has gone up from about 2 per year in the 1960s to 6 in the 2010s. Florida and Louisiana have seen the greatest increase of heat wave s per year.
Heat Wave Season Length
Heat wave season length has gone up almost everywhere especially in Florida, Louisiana, California, and Virginia. It has gone from roughly 20 days in the 1960s to 70 days in the 2010s.
But maybe when you look at these maps you think, "Ok, we're having more heat waves - that might be uncomfortable, but it's not actually affecting my health? Let's take a closer look. Remember in Lesson 3 when we were looking at vulnerability to climate change impacts and we talked about the 2003 heat wave in Europe and the almost 15,000 people in Paris who died (not to mention the 55,000 other people who died across Europe in that heat wave )?
Vulnerability plays a huge role in determining how a person or group of people experience climate change impacts. And yes, for many Americans, more heat waves are nothing more than an inconvenience. Perhaps I don't have air conditioning and will be uncomfortable. But maybe I have the resources (adaptive capacity) to minimize my exposure by staying with a family member with air conditioning, buying some fans, or spending the hottest parts of the day outside my home. My exposure might be similar to someone else's but as a healthy adult with reasonable resources, my sensitivity is lower and my adaptive capacity higher, thereby making me less vulnerable. While we saw that many of those deaths in Paris were elderly women, it's not just who you are that can make you vulnerable, but also what you do for a living. People who work outdoors have an obviously higher exposure to heat wave events and are therefore also more vulnerable to the direct health impacts those events bring (Xiang et al., 2014 [8]).
Let's take a look at a project in the Bronx to help identify residents most vulnerable to heat waves and the adaptation measures they're implementing to keep folks safe during extreme heat events.
DANNY PERALTA: I grew up here in New York City. This time of the year brings a lot of memories back-- the hydrants and smells and, I don't know, all of it. Yeah, yeah. It's a very distinct thing. Hunts Point in the Bronx is inclined to be much hotter than other neighborhoods, primarily because we're surrounded by highways.
24-hour, constant movement creates a lot of different pockets of heat in the neighborhood that you feel all the time. We have a lot of the more vulnerable populations-- folks that just got here from other countries, seniors that are not making any income. They can't maybe afford things like the fans and the ACs or the bill that comes with it.
[SIREN BLARING]
PRESENTER 1: Triple digits-- 103, the projected heat index in the city tomorrow.
PRESENTER 2: Three deaths are being blamed on the extreme heat that started--
CARI OLSON: People in New York City, New Yorkers who are at the greatest risk are getting sick and also dying because of the heat. We wanted to better understand how heat-related illness and death differed across New York City. Are all New Yorkers being impacted the same way? And the answer is that they're not. There are great inequalities. Jaime Madrigano at Columbia University, who was affiliated with CCRUN and NOAA, and researchers here at the health department started to look at how the distribution of heat-related illness and death differs across the city.
JAIME MADRIGANO: In cities, we have something called an urban heat island. The hot air gets trapped in the environment. And because of that, we see people dying of heat wave s every year. And areas of upper Manhattan and the Bronx are particularly heat-sensitive, vulnerable areas. I wanted to see the research that I did inform policy.
NOAA provided support and resources to get the project off the ground. We worked collaboratively with the New York City Department of Health and the New York City Mayor's Office over about a two-year period. Then it was published in 2015. The great thing about doing this study as part of CCRUN and working directly with stakeholders, such as the New York City Department of Health, is that they were able to take the results immediately, bring it up through their management, and direct it over to the New York City Mayor's Office so that it could be acted upon.
DANIELLA HENRY: The heat vulnerability study was the basis for the Cool Neighborhoods NYC Strategy.
BILL DE BLASIO: The city will be providing over 500 cooling centers. That's in city facilities and working with community-based organizations. There's over 500 locations around the city.
DANIELLA HENRY: Even though the city activates all of these cooling centers, individuals aren't going to them as much as we would want them to. We realized that it was really important to reach people within their homes, which was the impetus to create a program like Be A Buddy.
[KNOCKING]
PRESENTER 3: Hey, hey.
PRESENTER 4: What's going on, man?
PRESENTER 3: All right. How are you doing?
[MUSIC PLAYING]
DANNY PERALTA: Door knocking is very important. Having those folks strategically in the neighborhood that are getting to know the right people that are going to need support, that's huge.
PRESENTER 5: Fresh Meadows Library right here, See? That's a cooling center.
DANNY PERALTA: The Point is very excited about this opportunity to work with the Department of Health and the Office of the Mayor.
PRESENTER 6: So we're going to review what we just talked about.
DANNY PERALTA: For us, that means opening up this process for the community to come in and create part of that vision. If you don't give people a voice, they're not going to be an agent of change during these times.
CARI OLSON: We're really trying to think about how to empower the neighborhoods and give them the resources so that they can get to a place that's cool and stay safe.
DANNY PERALTA: If we have the tools, if we have the space to do this work, we can be our own citizen scientists, we can be our own first responders. And that's very, very key.
PRESENTER 7: --what it feels like to stand there with the [INAUDIBLE] on your tongue. Hear the gunshots or fire crackers on the 4 of July.
JAIME MADRIGANO: Heat waves are the biggest killer of all-weather events in the US. I knew that by working with CCRUN, the New York City Department of Health, and other stakeholders that are involved with CCRUN, my research would be used.
CARI OLSON: What we hope is that people can use this research to better understand heat health and also take action in their own communities.
DANIELLA HENRY: It's really important that all New Yorkers know how to stay safe and to know what are those protective measures that you can take and to really think about checking in on those that might really need it.
DANNY PERALTA: Whatever we do now has an impact 20, 50 years down the line. What do we want to see in 2020, 2025, 2035? We're laying the groundwork for that now.
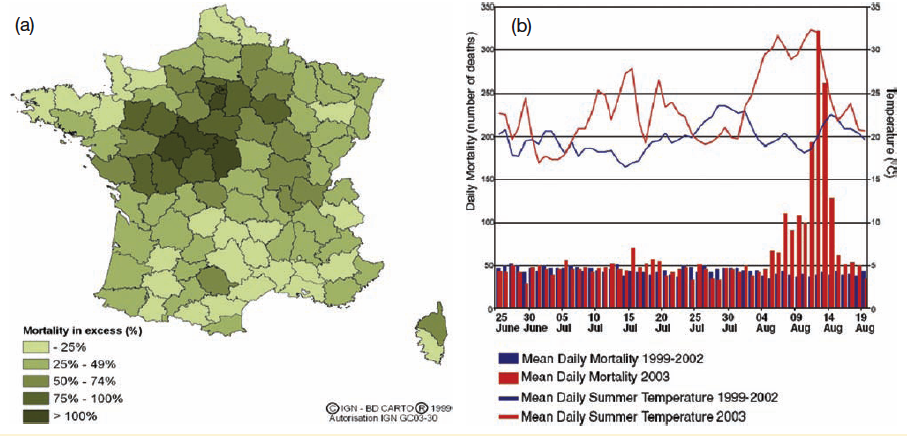
As heat wave frequency and intensity increase in a changing climate, heat wave mortality also rises. This map (a) and graph (b) from that 2003 European heat wave shows the increased mortality across France that summer (this is calculated based on the mortality you'd expect under normal conditions) as well as the mean daily temperature in 2003 and its corresponding daily mortality compared to those values for the 1999-2002 time period.
NOAA's Billion-Dollar Weather and Climate Disaster Database [9] (yep, that's really a thing) includes four drought/heat wave incidents since 1980 in its list of deadliest events. It is interesting to note that heat wave mortality varies with location: in Russia, South Asia, and Southeast Asia, deaths were primarily in rural areas; in the US, deaths were almost exclusively in urban areas; and in southern Europe, deaths were in both rural and urban areas.
Extreme cold
Wait. We just spent all that time talking about all of these more frequently occurring and more severe heat waves. Extreme cold? Although very cold days, very cold nights, and total frost days have declined over the past few decades, cold waves are still a problem and more recent studies are exploring the link between a changing climate and periods of extreme cold weather. This issue got a fair bit of attention in the early winter months of 2019, as the eastern US found itself subject to another polar vortex event. Cold weather is often a favorite talking point for overly simplistic climate denial, but in reality, the connection is much more complex and cold weather is anything but an indication that climate change isn't real. A changing climate is destabilizing the jet stream and allowing Arctic weather to dip down to lower latitudes than it otherwise would here in the US. Luckily, many popular news outlets tried to get in front of this by offering explanations of how climate change and cold snaps are related (see National Geographic's Why Cold Weather Doesn't Mean Climate Change is Fake [10], Climate Reality Project's Yes It's Cold, and Yes Our Climate is (Still) Changing [11], or Scientific American's Why Global Warming Can Mean Harsher Winter Weather [12]).
Much like heat waves, vulnerability is determined in a large extent to one's exposure. The most vulnerable among us are those people without adequate housing or reliable heat sources. People with existing health conditions or who are very young or very old are more sensitive. This NY Times article, Extreme Cold Weather Spreads East [13], offers a glimpse at many of the human health issues authorities were dealing with during this cold wave event in early 2019.
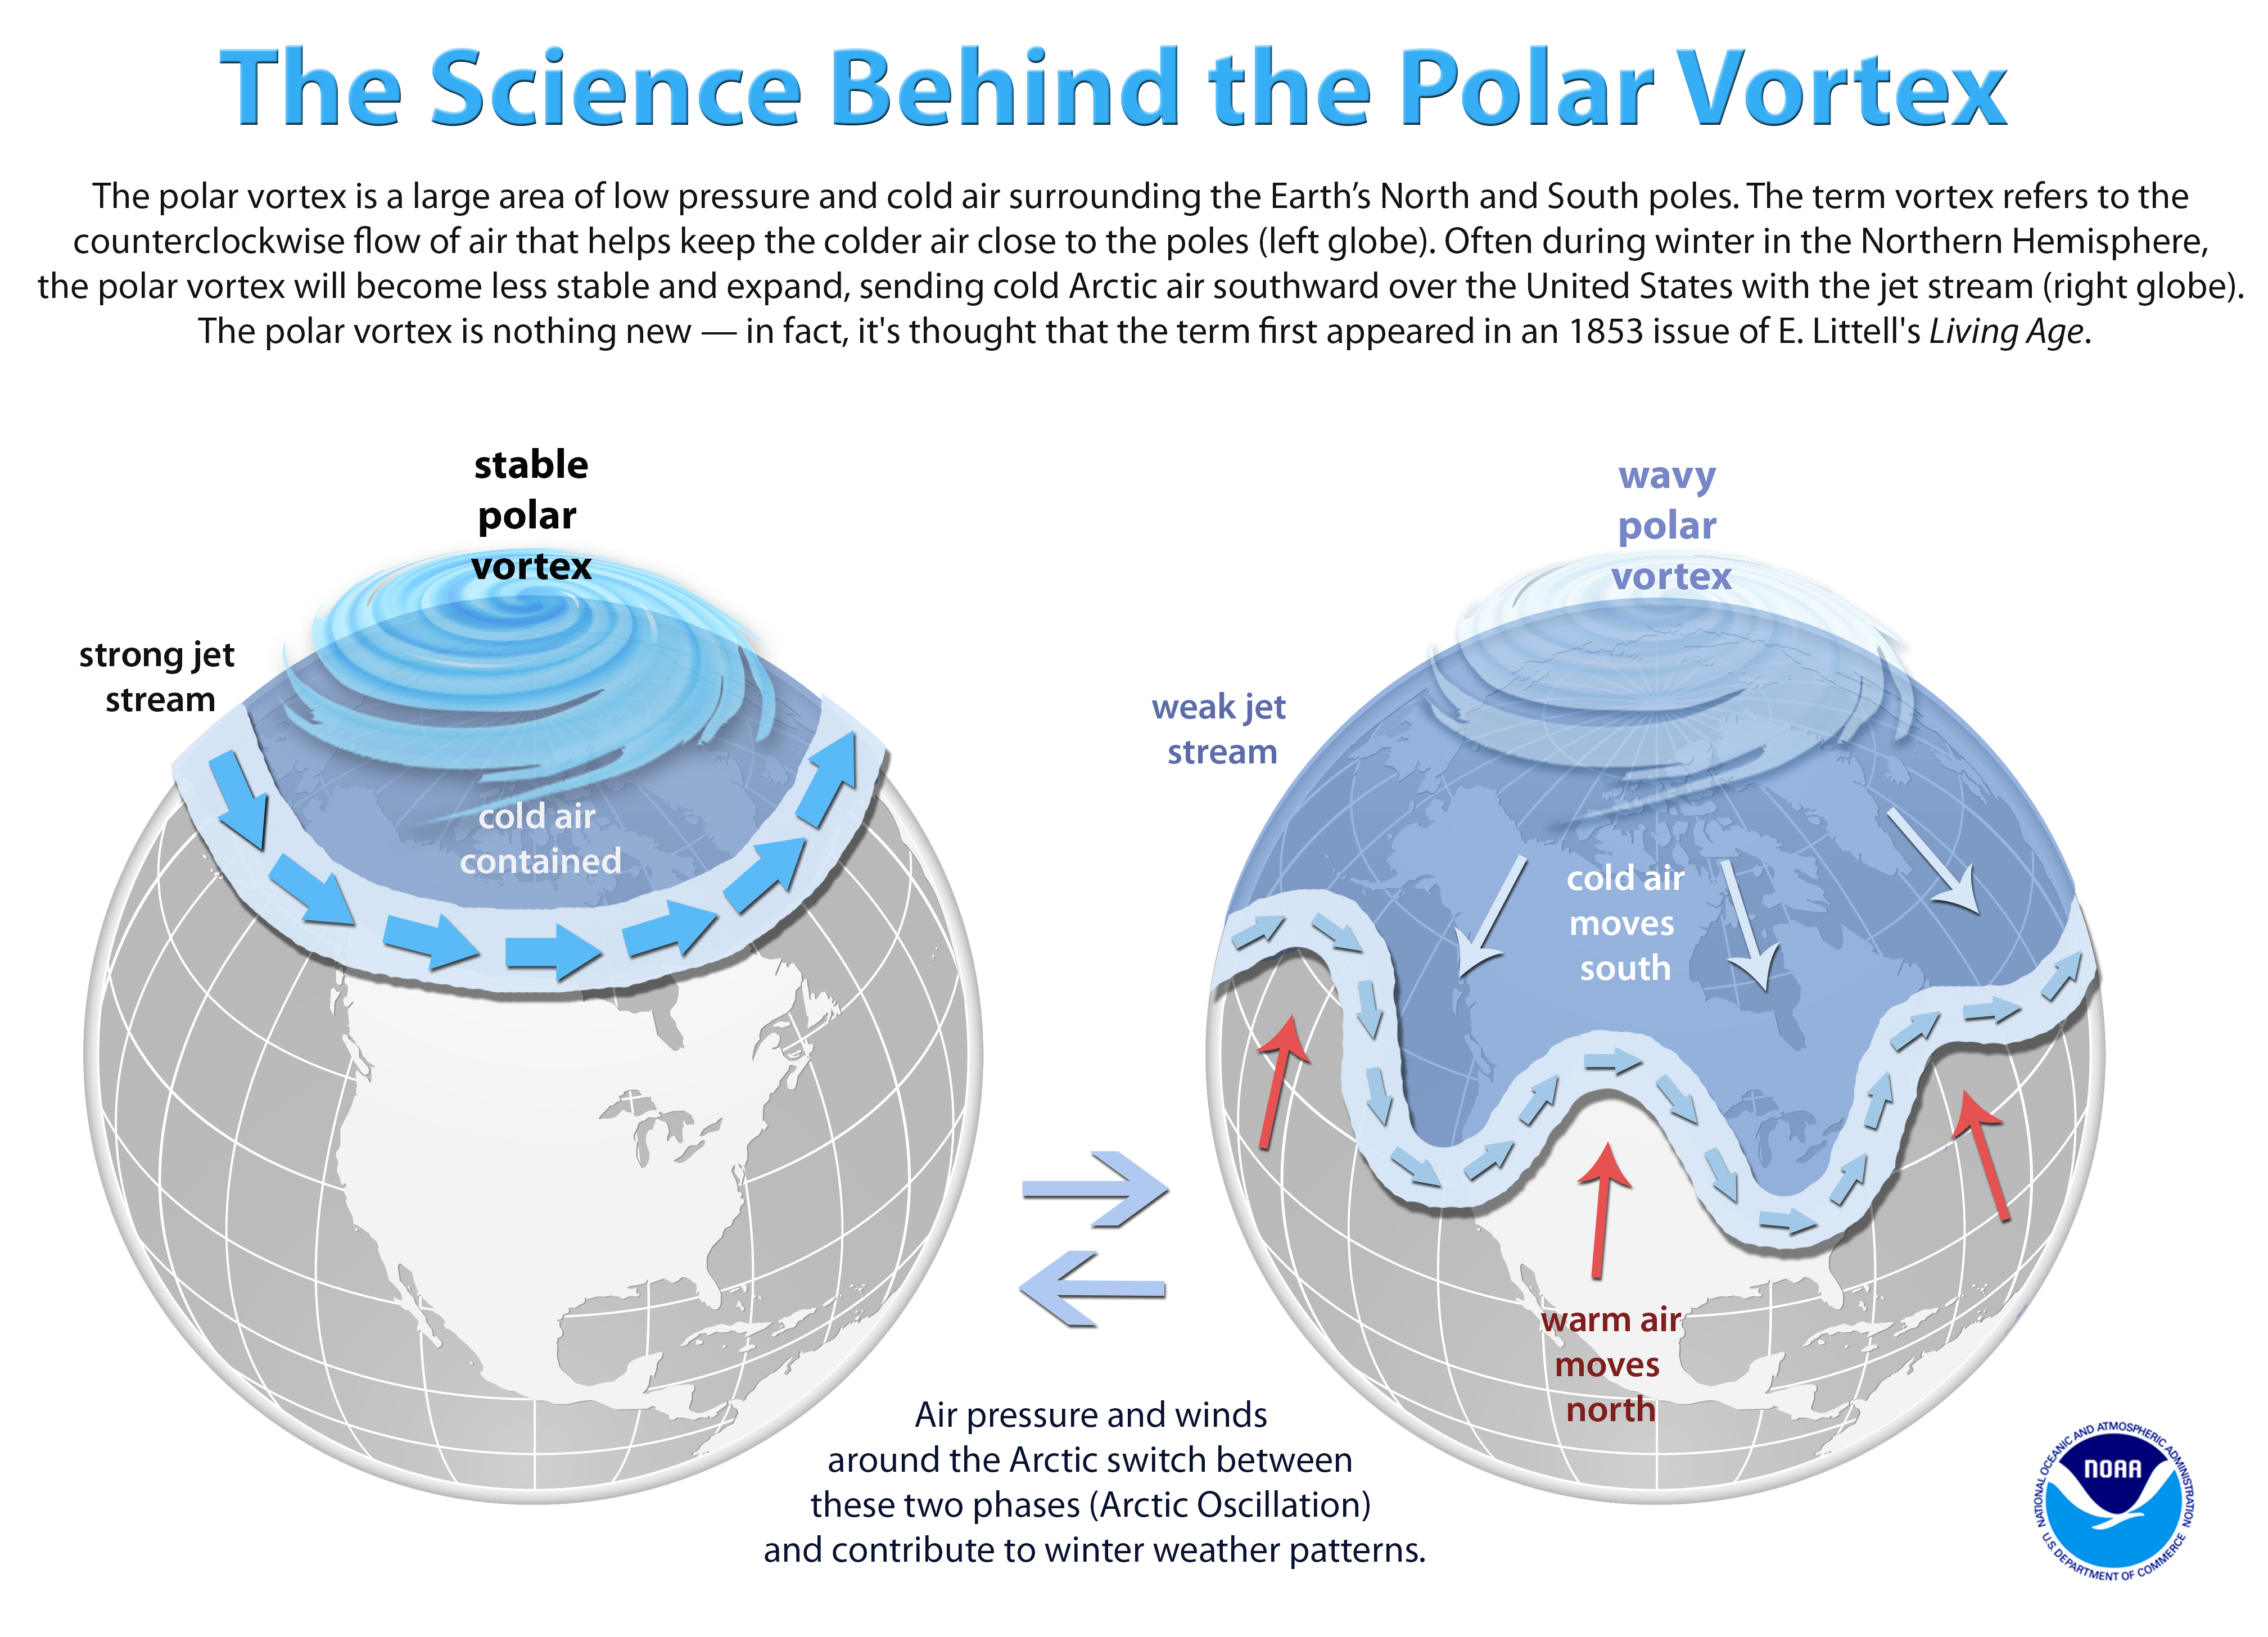
Image Reads:
“The polar vortex is a large area of low pressure and cold air surrounding the Earth’s North and South poles. The term vortex refers to the counterclockwise flow of air that helps keep the colder air close to the poles (left globe). Often during winter in the Northern Hemisphere the polar vortex will become less stable and expand, sending cold arctic air southward over the United States with the jet stream (right globe). The polar vortex is nothing new – in fact, it’s thought that the term first appeared in an 1853 issue of E. Littell’s Living Age.”
Image Shows:
Left globe: A strong jet stream and a stable polar vortex keep the cold air contained.
Right globe: A weak jet stream and wavy polar vortex allows the cold air to move south. Warm air moves north and creates pockets of warm and cold.
Between the globes, the image says, "Air pressure and winds around the Arctic switch between these two phases (Arctic Oscillation) and contribute to winter weather patterns."
Other Extreme Weather Events
We'll be looking at extreme weather events in more detail in Impacts on Earth: Climate and Weather [15], but let's talk a bit about the specific human health dimensions of extreme weather. Obviously, heat waves and cold waves are forms of extreme weather too, but we tend to break those out separately from storms, floods, and droughts (though we can certainly group droughts and heat waves together). This is a recurring theme with the topics we're discussing this semester - they're all inextricably linked, and there's never a good starting point or logical progression.
Indirect Impacts of Climate on Health
Indirect impacts of climate on human health are ones in which the human body is not immediately affected by the climate system but instead feels the delayed impacts through some intermediary. Indirect impacts affect many more people in many more ways than the direct impacts. The list is long and includes, among others:
Food- and Water-Borne Disease Outbreaks
Several food-borne pathogens are spreading due to climate change. Depending on the crop type, drought and excess moisture encourage crop pests and spread molds. Climate-driven rusts, blights, and rots are devastating already stressed crops and thereby indirectly affecting human health through decreased food security.
But it's not just our crops falling ill from increased pathogens in a changing climate. Instances of some types of pathogens that make their way to people are also on the rise. The US Global Change Research Program's Climate and Health Assessment from 2016 describes some of these pathways and consequences (and in their bulleted list [17], they include ample citations to support each bullet point - I'm linking out to that directly in hopes the links there are updated as necessary):
- "Higher temperatures can increase the number of pathogens already present on produce and seafood.
- Bacterial populations can increase during food storage which, depending on time and temperature, can also increase food spoilage rates.
- Sea surface temperature is directly related to seafood exposure to pathogens.
- Precipitation has been identified as a factor in the contamination of irrigation water and produce, which has been linked to food-borne illness outbreaks.
- Extreme weather events like dust storms or flooding can introduce toxins to crops during development.
- Changing environmental conditions and soil properties may result in increases in the incidence of heavy metals in the food supply."
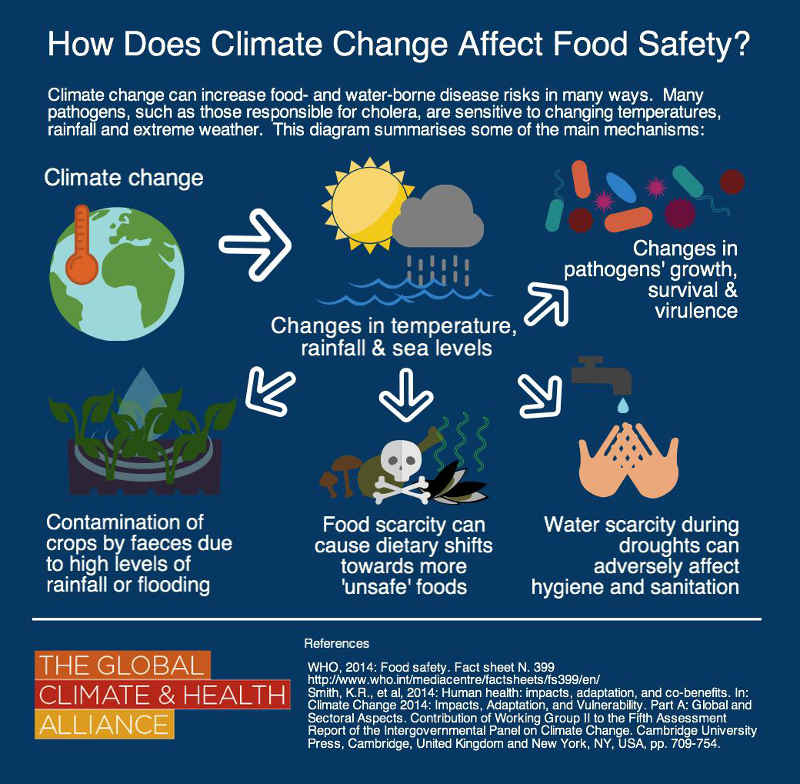
Climate change causes changes in temperature, rainfall and sea levels. This affects the contamination of crops by faeces due to high levels of rainfall or flooding. It can cause food scarcity which can cause dietary shifts towards more ‘unsafe’ foods. It can also cause changes in pathogens’ growth, survival & virulence. Additionally, water scarcity during droughts can adversely affect hygiene and sanitation.
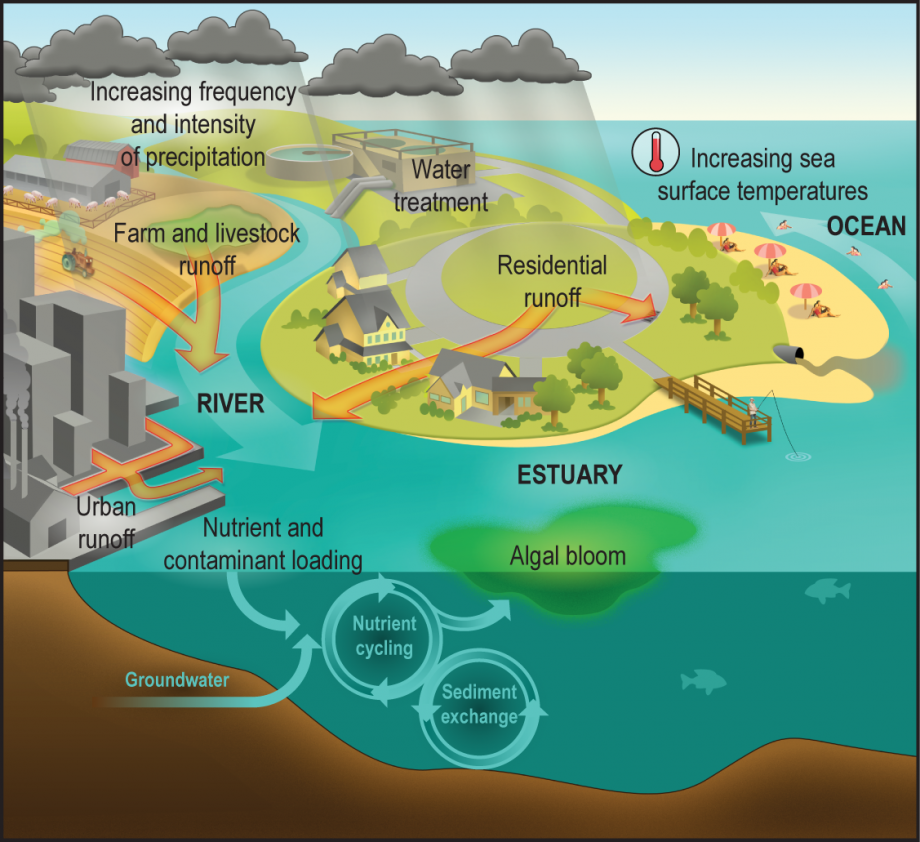
Water-borne diseases are closely related to weather and climate. Cholera, cryptosporidiosis, and several other significant diseases are spread by fecal contamination of water supplies and are often closely associated with floods and heavy downpours. In other cases, drought can concentrate disease pathogens in pools and low flows. Climate change is causing increased intense rainfall events in many parts of the world and drought in others; it is not surprising that water-borne illness is a growing problem in those areas with the most extreme changes. The key to understanding the spread of water-borne illness in a changing climate is exposure. As this image shows, various factors (all from human activity) are increasing our exposure to these illnesses.
- increasing frequency and intensity of precipitation events
- increasing sea surface temperatures
- runoff from agriculture and our built environments
Vector-borne diseases
Disease vectors, such as mosquitos and ticks, are moving into new areas as warmer, wetter climates push poleward and upslope. The spread of malaria and dengue fever, for instance, is believed to be at least partly due to mosquitos expanding their range with the changing climate.
Click through this series of maps illustrating the projected expansion of mosquitos carrying Aedes-borne viruses (dengue fever* and Zika among them). These projections are based on an RCP (representative concentration pathway [20]) of 8.5 which is really a worst-case scenario in which we continue on with our business as usual practices and fail to mitigate climate change. So, with any luck, this won't happen! But, you can also see a set of projections based on a more plausible RCP with the original paper (Ryan et al., 2019 [21]). These projections demonstrate the rapid increase in exposure for highly populated areas, some expansion into new areas - meaning newly vulnerable populations.
- Ok, but if it's getting so much warmer, then maybe it'll be TOO warm for these mosquitos in places they currently haunt, right? Well, this is true to a very small degree. But remember, the higher latitudes are warming more dramatically than the tropics, so it's not uniform warming across the globe.
*In 2019, countries across tropical Asia saw higher than usual instances of dengue fever.
- Bangladesh Reports More than 13,000 Dengue Cases in July [22] (Khan and Chappell, 2019)
- Philippines Declares National Alert After 465 Dengue Deaths [23] (The Straits Times, 2019)
- Peak Dengue Season in Singapore: 8000 Cases, 5x Last Year's Number [24] (Outbreak News Today, 2019)
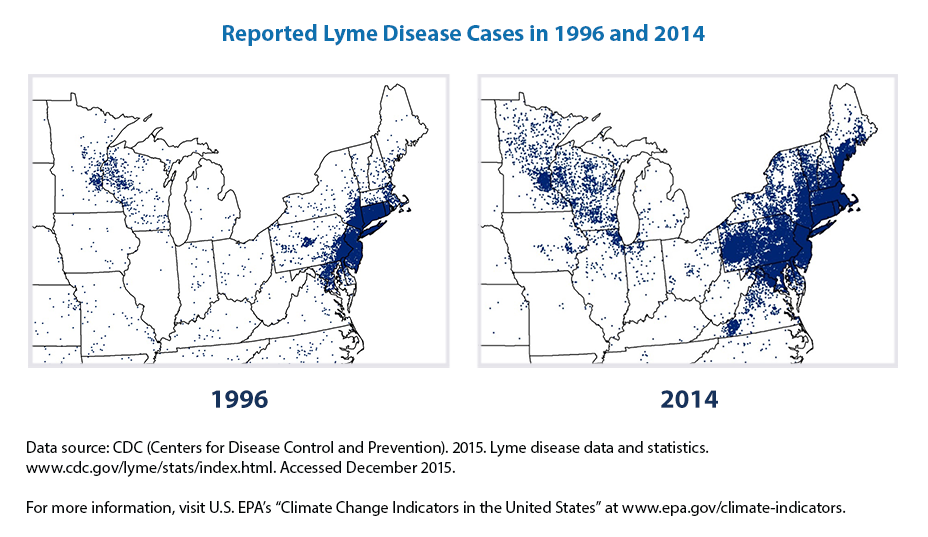
Let's take a look at another vector, ticks. Look at the massive growth in reported cases of Lyme Disease [25] between 1996 and 2014. Many of you live in Pennsylvania or surrounding states, so you're likely all too familiar with ticks and Lyme Disease. Most of us have a story or two of pulling a deer tick off ourselves, our children, or our pet. I've spared you a close-up image of a deer tick on this page, you're welcome.
- But isn't it possible that people are just doing a better job of reporting Lyme Disease now than they did in 1996? That's certainly part of what you see here, but it isn't the whole story. These northern latitude states are warming faster than the rest of the country, and as such as are becoming more hospitable habitat into which deer ticks are expanding. Additionally, if places are not getting as cold over the winter as they used to, then the deer ticks might be active for a longer period of time each year. All of this increases our exposure to this potential impact on human health.
Rodents and their fleas are also a concerning disease vector with changing distributions in a changing climate. For example, Hantavirus borne by fleas on deer mice is closely linked to the ENSO cycle in the US Southwest (Hjelle and Glass, 2000 [27]), and evidence points to climate-related distribution changes in Europe of Hantavirus borne by other rodents (European Center for Disease Prevention and Control, n.d. [28]). In Brazil, warmer temperatures mean an increased expansion of sugarcane production. Rodents (particularly deer mice) find sugarcane quite tasty and estimates suggest that this combination of increased sugarcane production and warming temperatures could expose an additional 20% of Brazilians [29] to this potentially fatal virus.
Poor Air Quality
Sometimes, when I'm having a conversation about climate change (as one does!), I hear people talk about our greenhouse gas emissions as pollutants. I've personally never really thought of them that way (even though, perhaps I should because they do overlap), because I tend to think of air pollution as particulate matter - soot, big puffs of black exhaust from the back of a truck, things like that. Greenhouse gas emissions seem categorically different to me - like secret pollutants we can't see. However, it's important to understand that regardless of how you conceive of GHGs and pollutants, our GHG emissions are affecting the more traditional air pollutants in ways it's important for us to understand.
Air quality and its effect on human health is in large part a function of the weather, which creates conditions that promote or depress the formation, concentration, deposition, dispersion, and transport of pollutants. Changing climate means changes in location, timing, and intensity of air pollution events. Ground-level ozone, the most noxious constituent of photochemical smog, is associated with a host of health problems and is strongly and positively correlated with temperature and solar radiation; increases in temperature and longer summer seasons correspond to increases in general ozone concentrations and the number of days violating air quality standards. Here's a short EPA podcast from 2016 called The Future of Breathing: Connecting Air Quality and Climate Change [30] I'd like you to spend 2 minutes on (or read its transcript).
Particulate matter (PM) has even greater health effects than ozone; this pollutant is also linked to temperature and humidity in its formation. Forest fires also release many particulate air pollutants and toxic gases and are known to affect health. Forest fires are on the increase worldwide and forecast to escalate dramatically in the future.
Let's circle back to thinking about vulnerability and how people might experience this type of impact of a changing climate differently than those around them. The American Lung Association [31] estimates 26 million people in the US are living with asthma. Poor air quality is just one potential indirect impact on human health that affects people with asthma more acutely.
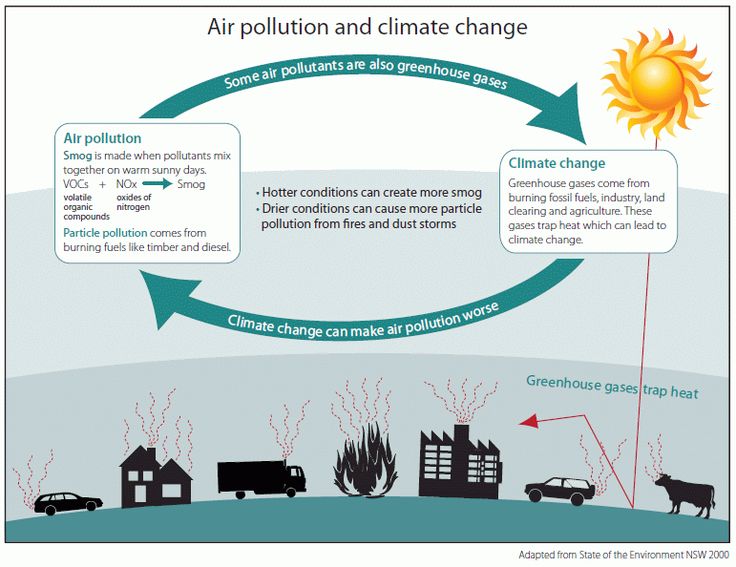
Air pollution and climate change cycle.
Air pollution: Smog is made when pollutants mix together on warm sunny days. Volatile organic compounds + nitrogen oxides = smog. Particle pollution comes from burning fuels like timer and diesel. Hotter conditions create more smog and drier conditions can cause more particle pollution from fires and dust storms.
Air pollution leads to climate change with an arrow that reads: some air pollutants are also greenhouse gases.
Climate Change: Greenhouse gases come from burning fossil fuels, industry, land clearing, and agriculture. These gases trap heat which can lead to climate change.
Climate change leads to air pollution with an arrow that reads: Climate change can make air pollution worse.
Seasonal Allergens
One of the biggest climate impacts on human health is through seasonal allergens. Over the past few decades, spring is coming earlier and fall is ending later in the Northern Hemisphere, increasing the length of the allergy season. (Do you hear the collective groan of the roughly 30% of the population who suffer from seasonal allergies?) Changing distributions of plants and molds (thanks to extreme precipitation events and changing temperature patterns) are causing the spread of allergens into areas where they did not exist earlier. There is also some evidence that the rising atmospheric CO2 concentration is fertilizing some allergen-rich species, like ragweed (Albertine et al., 2014 [33]).
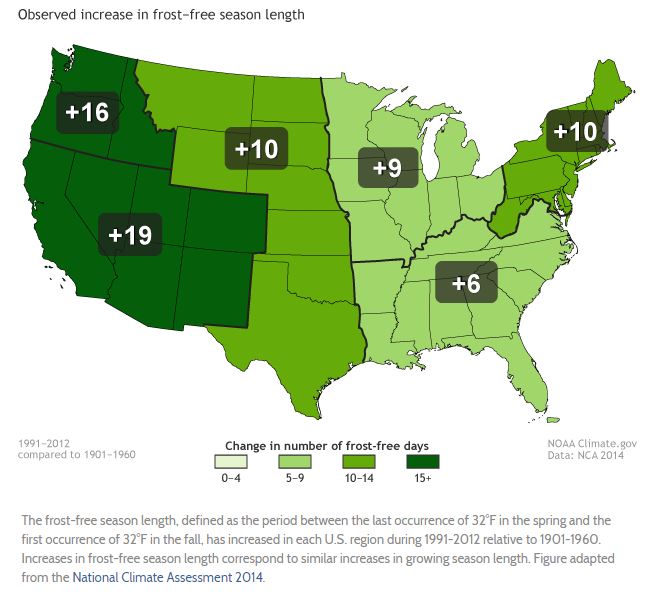
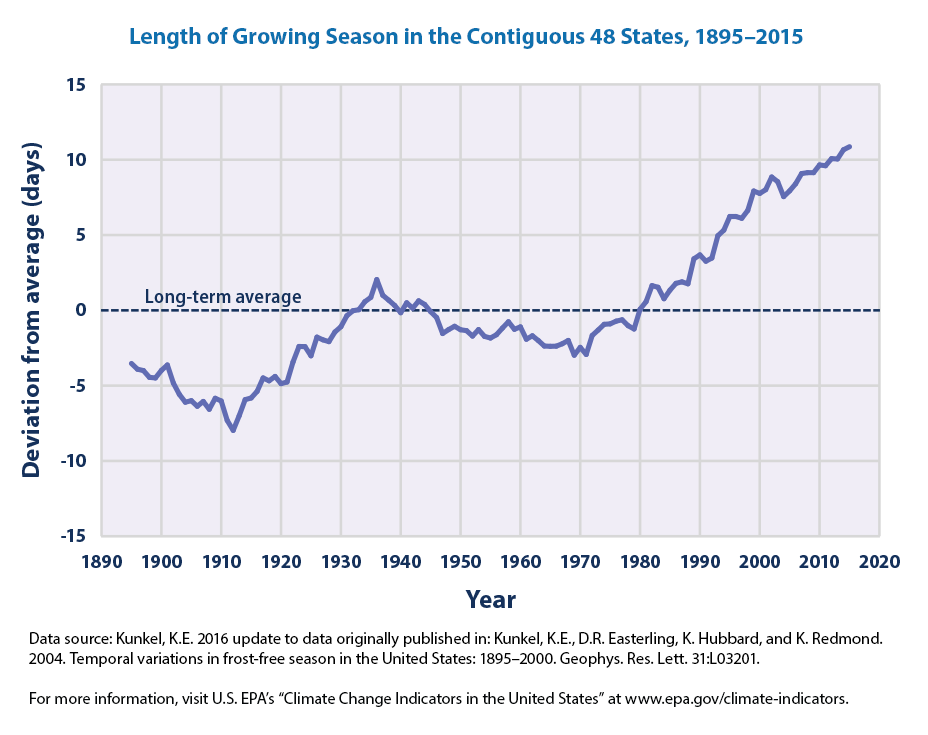
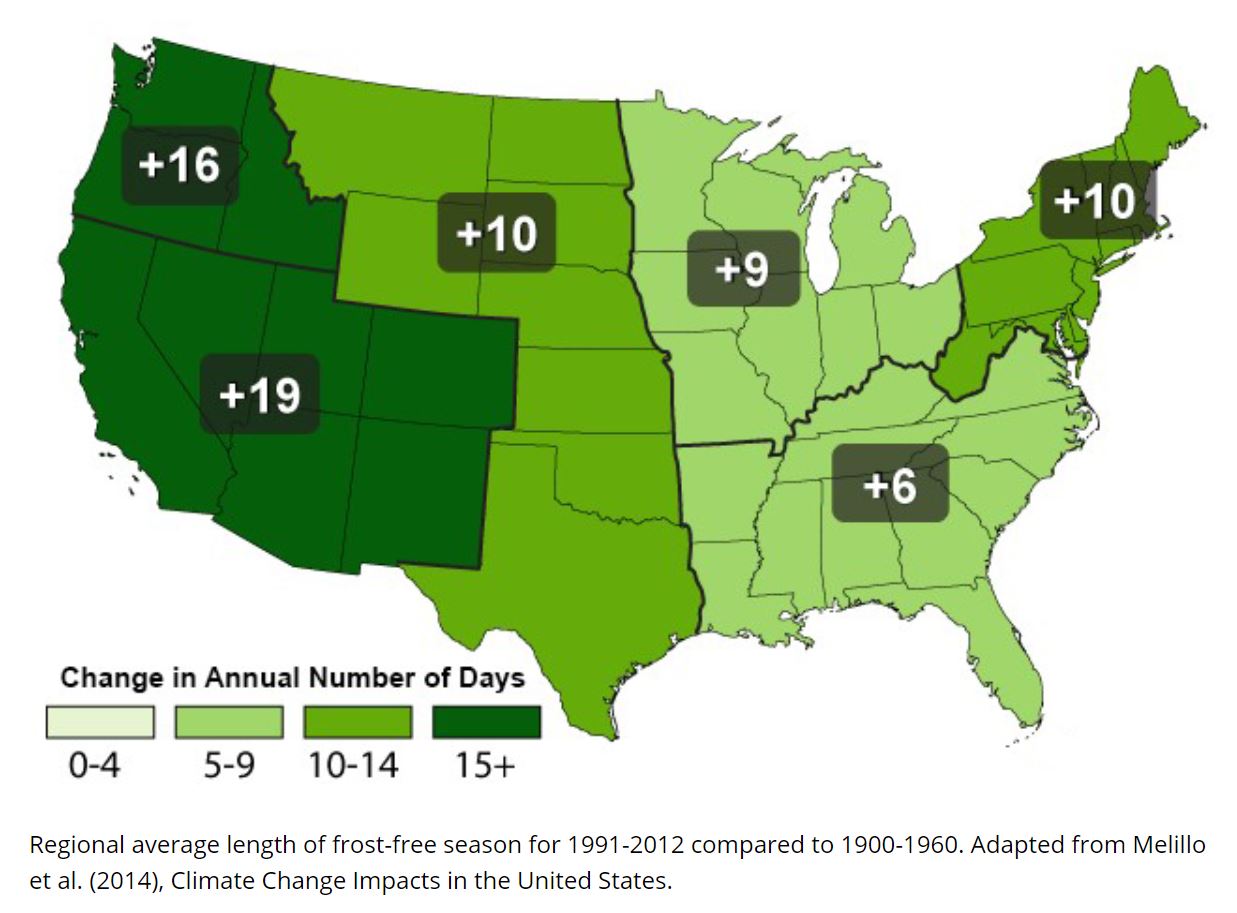
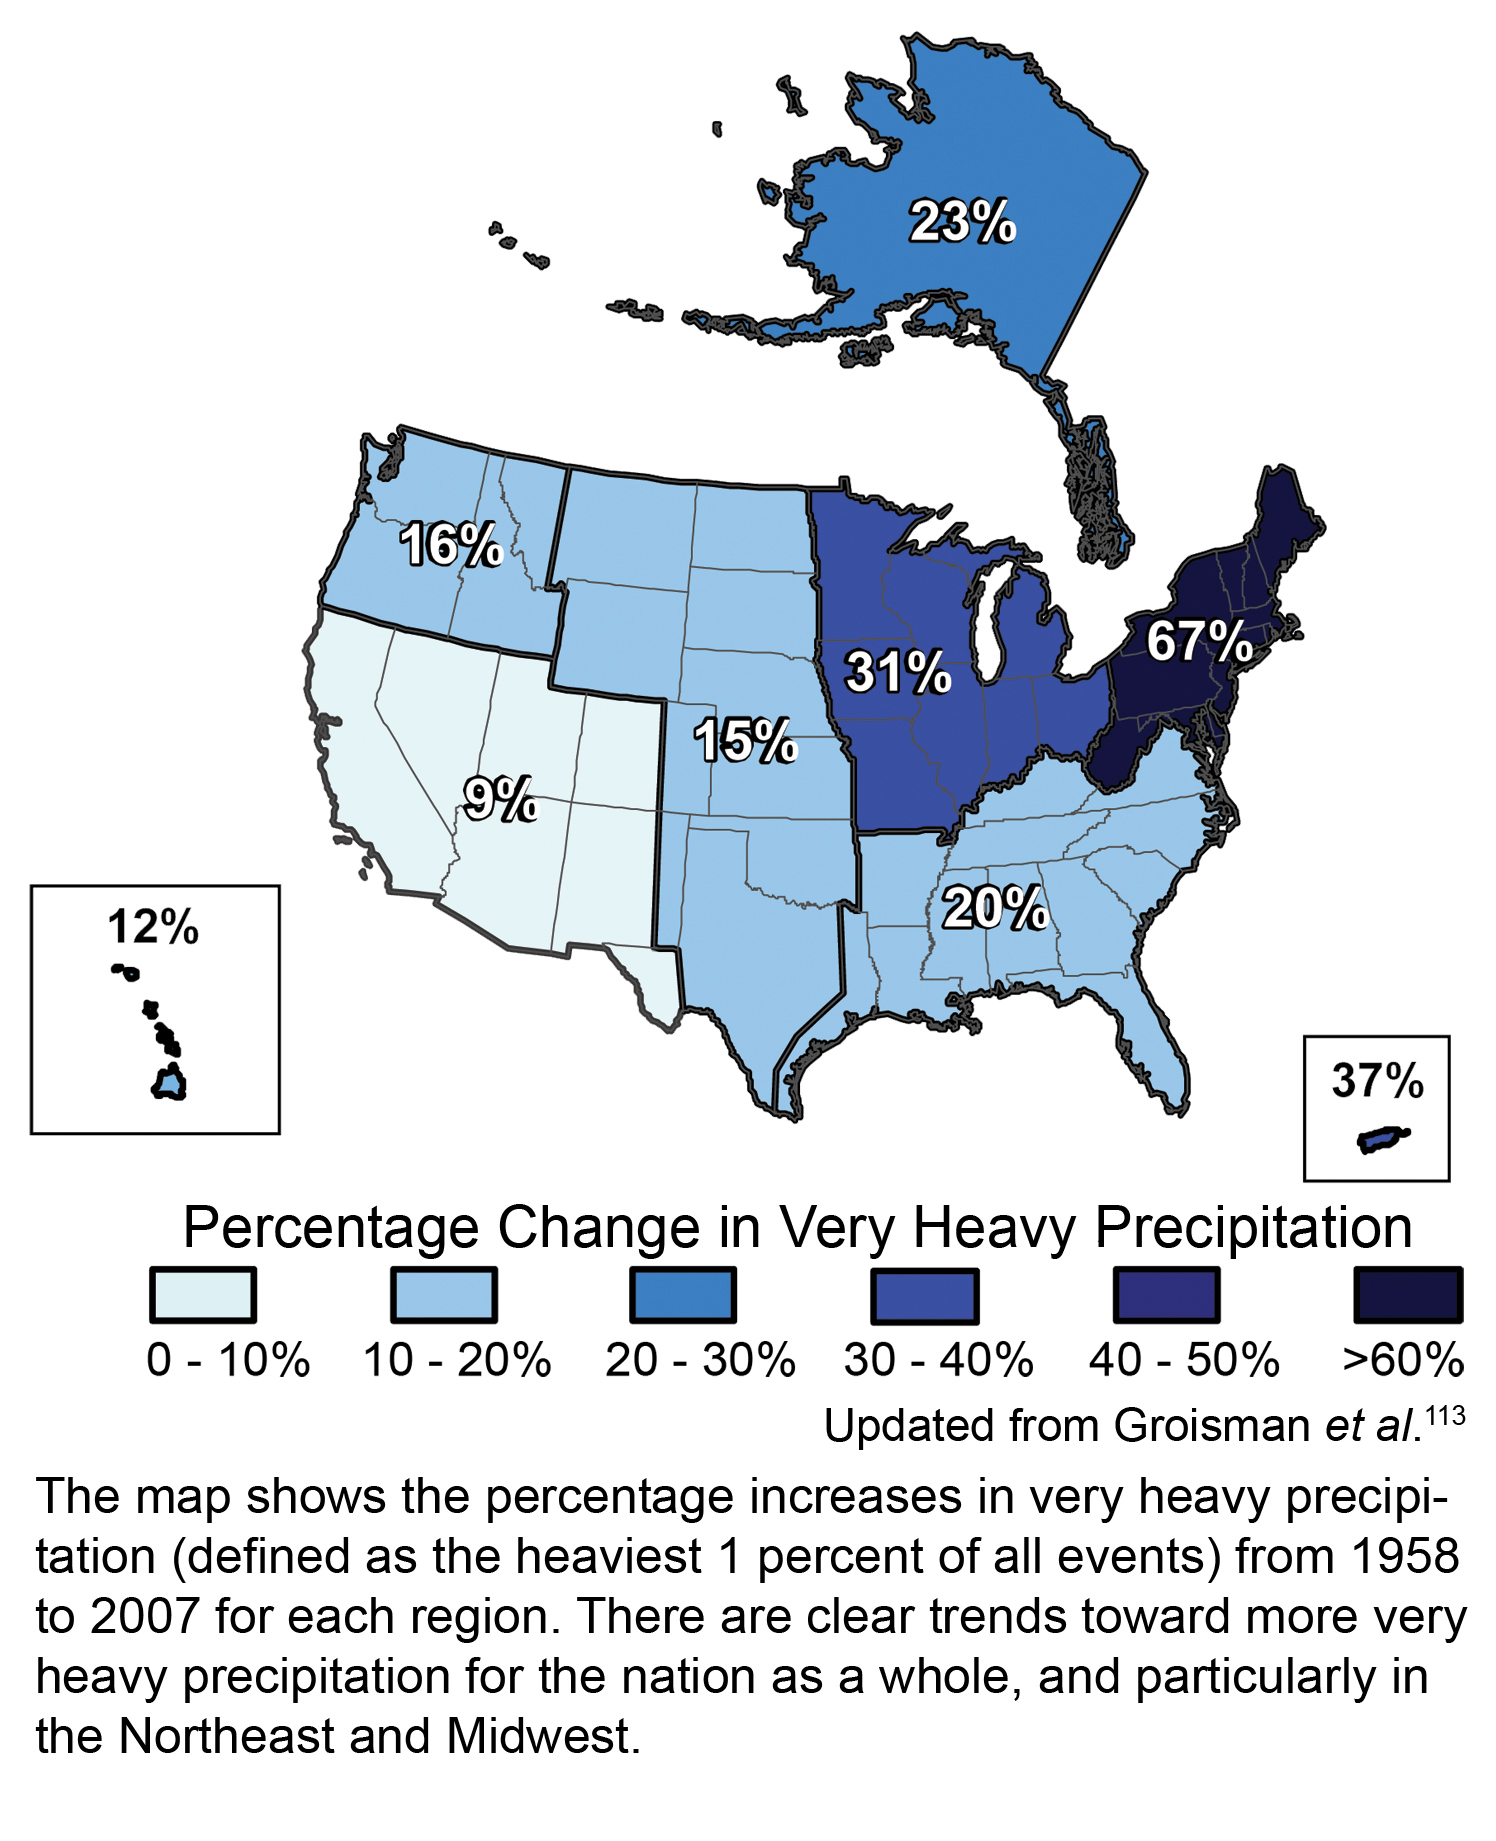
What do you notice about this map? The northern latitudes of the US and the western part of the country are seeing rapidly expanding numbers of frost-free days relative to the southern US. It's just another reminder that while impacts are global in nature, they materialize very differently across smaller geographic scales.
Mental health and well-being
For this week's lesson, let's focus specifically on the effects climate change impacts can have on one's mental health. This is separate from thinking about the mental health implications associated with people worrying about climate change in general (which is a rapidly growing issue). We'll probably have a chance to tackle that in Unit 3: Solutions.
This area seems a bit understudied compared to the more obvious impacts and isn't discussed as much publicly. Flooding, droughts, Lyme Disease, asthma - we've talked about a lot of potential issues connected to climate change that might seem more connected. But, the mental health implications of living through many of these impacts is of serious consequence and worth our time to better understand.
Mental health is inextricably linked to physical and community health (see those bidirectional arrows between the physical, mental, and community symbols - it's all connected!).
Climate impacts more than just the weather:
Medical and Physical Health
Changes in fitness and activity level
Heat-related illness
Allergies
Increased exposure to waterborne and vector-borne illness.
Mental Health
Stress, anxiety, depression, grief, sense of loss
Strains on social relationships
Substance abuse
Post-traumatic stress disorder
Community Health
Increase interpersonal aggression
Increased violence and crime
Increased social instability
Decreased community cohesion
Additional Pressures on Health
It is important to recognize that climate change is neither the primary driver of human health today nor will it be in the future. Beyond genetics, access to these three factors are fundamental to the good health of an individual and a society.
- Safe water and good sanitation - More people die each year from this factor than from war and all other forms of violence. Most of these deaths occur in children less than five years of age. More than two and a half billion people do not have access to good sanitation; nearly all of those are located in the developing world. Learn more about these concerns by visiting the CDC's Global WASH Fast Facts [36]. Does it surprise you to learn that 1 in 3 people in the world don't have access to the sanitation that many of us take for granted?
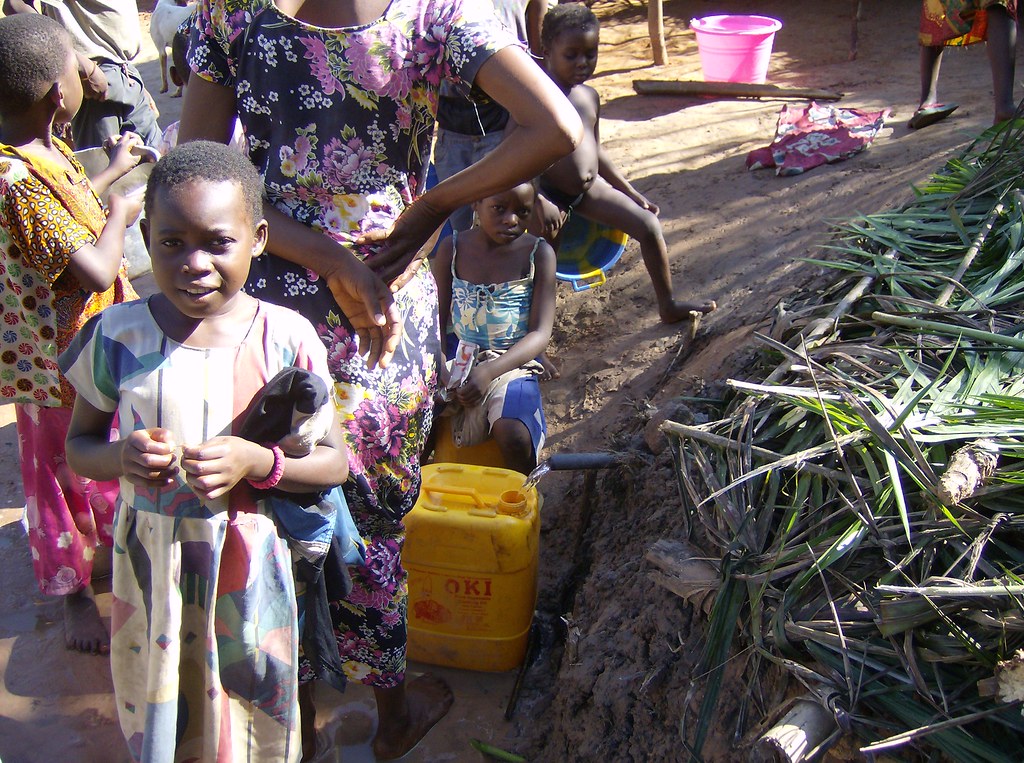 Children collecting drinking water"Do You Dream About Water?" [37]by Woody Collins [38] from Flickr is licensed under CC BY-NC-SA 2.0 [39]
 - Nutritious food and food security - Undernourished people receive less than the minimum amount of food needed for sound health and growth. The World Health Organization puts the number of undernourished people at about one in nine people [40] and nearly all of those live in the developing world. And while some of the statistics [41]surrounding access to health food are quite sobering, there are glimmers of good news in there, too. Let's take a look at the prevalence of undernourishment as a percent of the population by global region in 2000 and 2016 (the images below are static and a bit squished, but you can watch this animation over the 16 year period [42] if you're interested). What do you notice? With the exception of North America, all other global regions reduced their share of the population experiencing undernourishment - some rather substantially!
Indeed, food security linked to extreme climatic events is and will continue to be one of the biggest impacts of the changing climate. Many areas of the globe –– particularly in Africa –– lack basic food security. Apart from starvation, malnutrition weakens the populations of these areas and leaves them open to a host of illnesses; malnutrition-induced morbidity and mortality is greatest among the very young and the very old. Droughts and floods aggravate an already bad situation, reducing yields and sometimes causing crop failure, further weakening an already vulnerable population.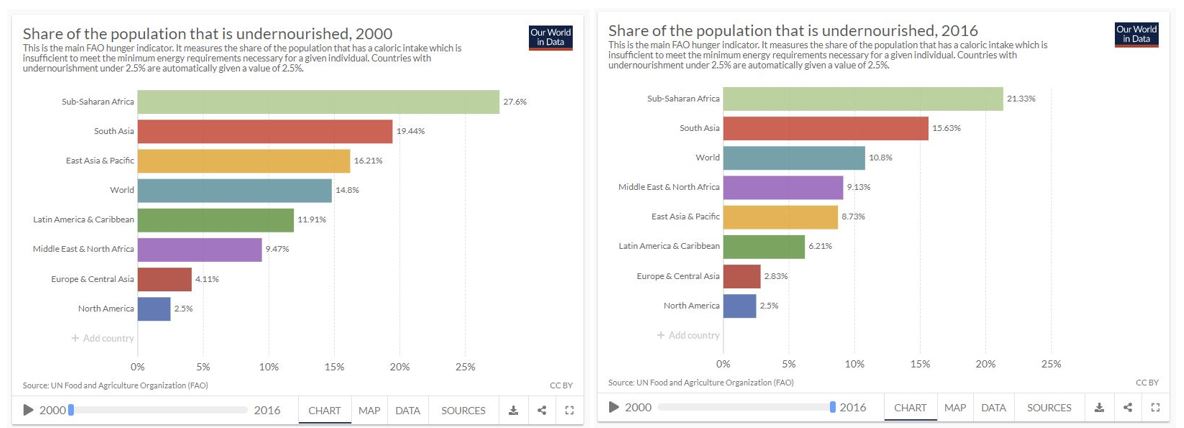 Comparison of the share of the population that is undernourished 2000 vs 2016Click here for a text alternative to the figure above
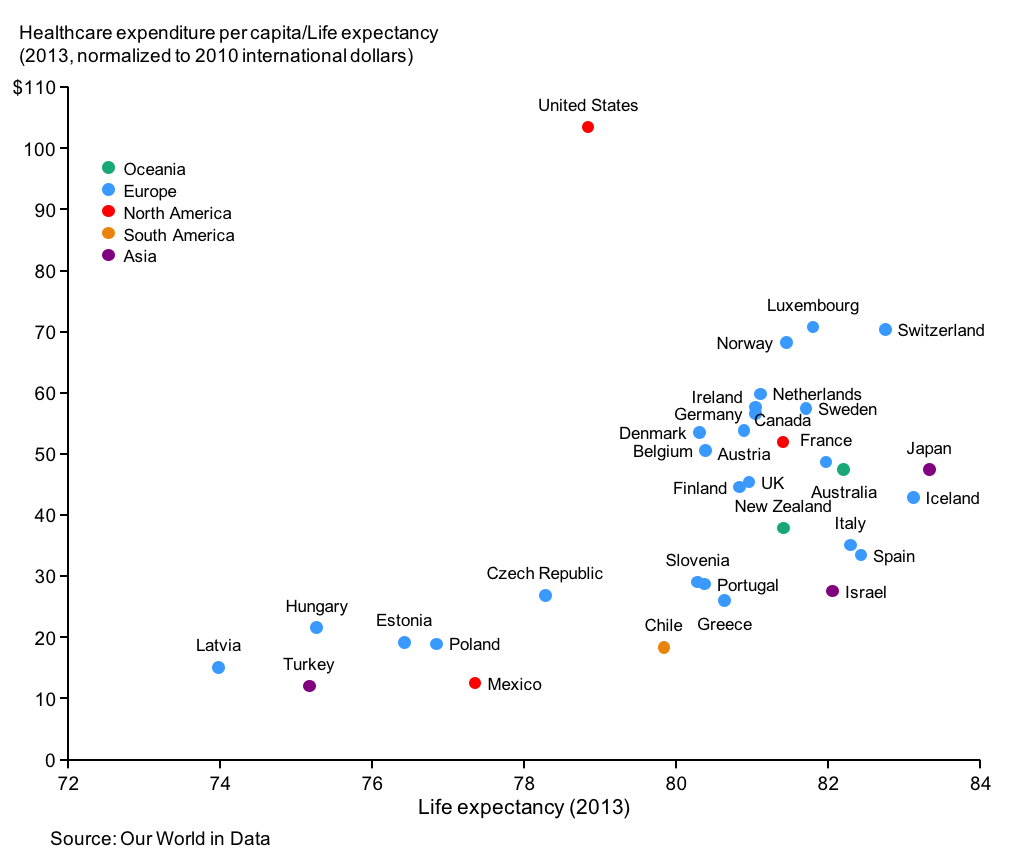
Share of the Population that is Undernourished Country 2000 2016 Sub-Saharan Africa 27.6% 21.33% South Asia 19.44% 15.63% East Asia & The Pacific 16.21% 8.73 World 14.8% 10.8% Latin America & Caribbean 11.91% 6.21% Middle East & North Africa 9.47% 9.13% Europe & Central Asia 4.11% 2.83% North America 2.5% 2.5% Credit: Our World in Data - Hunger and Undernourishment [42] by Roser and Ritchie, 2019 is licensed under CC BY 4.0 [43] - Health care - People in developed countries spend huge sums on health care while less-developed countries spend little. Per capita health care spending by the top 5 percent of the world population is about 4,500 times the spending of the lowest 20 percent. As the graph below indicates, there is a positive relationship between health care spending and life expectancy, with low health care spending associated with low life expectancy and high spending associated with high life expectancy. There are anomalies. For instance, Cuba, which has essentially the same life expectancy as the US, has excellent health care but spends only about an eleventh [44] of what the US spends per person on health care. Despite the fact that it spends about twice as much per capita on health care as other developed countries, the US is only ranked 45th in life expectancy [45] (this ranking varies a bit by source, with some estimates as high as the mid twenties but it still represents a point for discussion - the US is paying a lot for its health care but not realizing commensurate outcomes for that cost). Another measure of health care access is doctors per 100,000 people. Here the disparity between developed and less-developed countries is stark. Again, there are anomalies, such as the former communist countries, which have relative high densities of physicians. Moreover, there can be large inequalities even within the most-developed countries where rural areas often have difficulty attracting doctors.
In summary, individuals who live in developed countries generally have better access to safe water and sanitation, good nutrition, and health care. People who live in the least-developed nations often have unsafe water and poor sanitation, inadequate nutrition, and little access to health care. Therefore, with or without climate change, health outcomes vary based on a person's country of residence and its level of development.

- 3.1 Maternal mortality
- 3.2 Newborn and child mortality
- 3.3 Communicable diseases
- 3.4 Noncommunicable diseases and mental health
- 3.5 Substance abuse
- 3.6 Road traffic injuries
- 3.7 Sexual and reproductive health
- 3.8 Universal health coverage
- 3.9 Mortality from environmental coverage
- 3.a Tobacco control
- 3.b Development assistance vaccine coverage
- 3.c Health workforce
- 3.d National and global health risks
- 1.a Mobilization of resources
- 2.2 Child malnutrition
- 6.1 Drinking water
- 6.2 Sanitation and hygiene
- 7.1 Clean household energy
- 11.6 Clean cities
- 13.1 Natural disasters
- 16.1 Violence
- 17.19 Statistical capacity-building
Food and Water
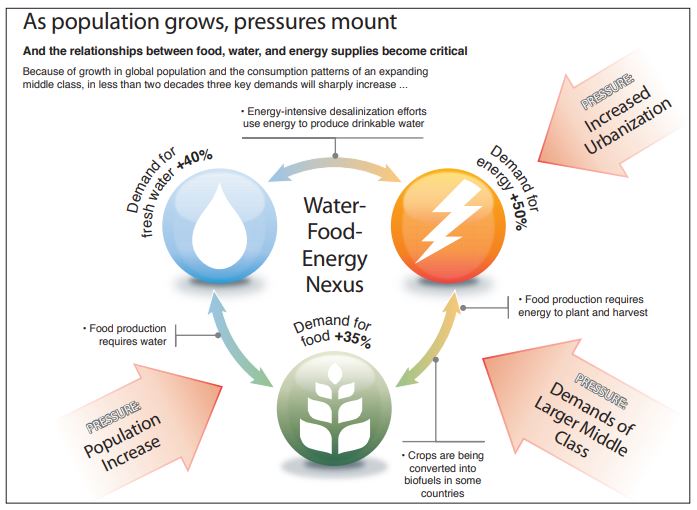
Image reads: As the population grows, pressures mount and the relationships between food, water and energy supplies become critical. Because of growth in the global population and the consumption patterns of an expanding middle class, in less than two decades three key demands will sharply increase.
Image is a circular flow chart:
Demand for freshwater +40%
Pressure: population increase
*Food production requires water
Demand for food +35%
Pressure: Population increase & Demands of a larger middle class
*Crops are being converted into biofuels in some countries
Demand for energy +50% Pressure: Increased urbanization
*energy-intensive desalination efforts use energy to produce drinkable water
*Food production requires energy to plant and harvest
With a growing global population that's becoming increasingly urban and aspiring to middle class lifestyles, the demands on our food, water, and energy systems is expected to grow considerably in coming decades. Add climate change into the mix, and this creates a very precarious nexus of demands for basic needs like food and water.
Impacts on Food
Food insecurity linked to climate change impacts will be one of the most pressing consequences of a changing climate. Many areas of the globe –– particularly in Africa –– lack basic food security. Droughts and floods aggravate already bad situations, reducing yields and sometimes causing crop failure, further weakening already vulnerable populations.
This week, we'll explore just a few examples of the impacts of climate change on our global food security, recognizing that the impacts are complex, intertwined, and far-reaching. These examples include:
- changes in growing season duration and timing;
- changes in growing regions;
- more extreme fluctuations in temperature and precipitation.
Fluctuations in Precipitation and Temperature
Changes in Where We Grow Our Food
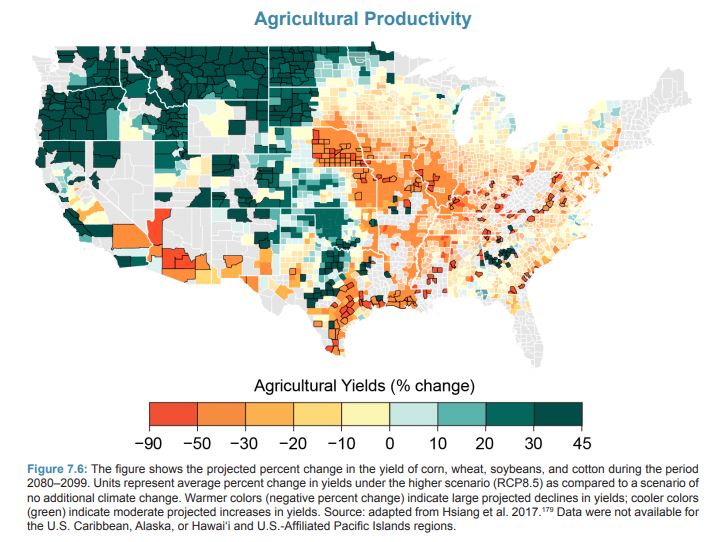
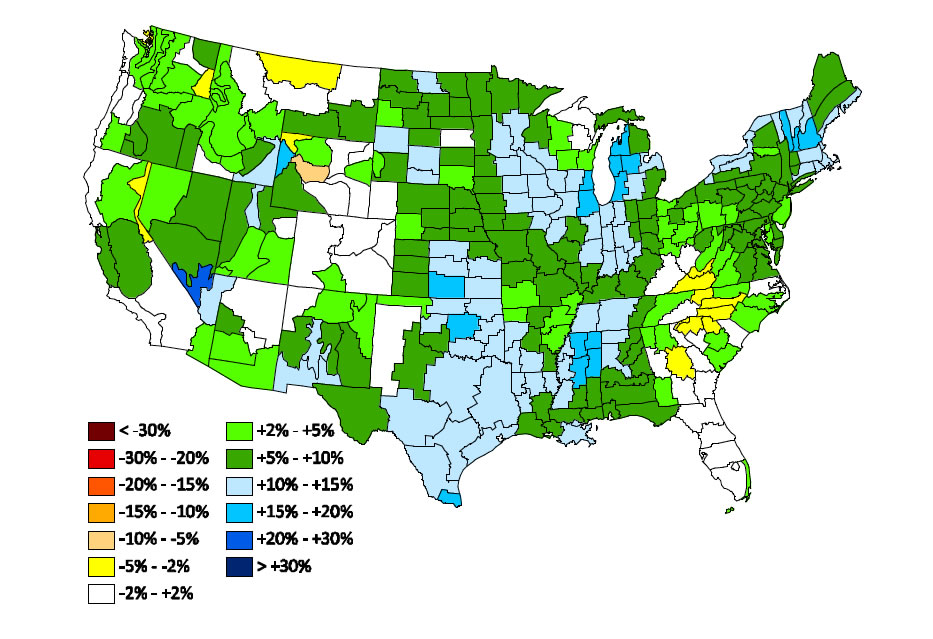
Sometimes, climate change impacts create winners and losers. It's important to understand that climate change leading to food insecurity is more nuanced than it's hotter here and we can't grow food. Climate shifts happen regionally and it's important to understand what that looks like at a smaller scale. Take a look at this map of anticipated agricultural yields in the US by the end of the 21st century. What do you notice?
- As you look at the areas where much of our food is currently produced, how is the end of the century looking for them?
- As we look generally at the northwest corner of the US, we see a noticeable increase in agricultural productivity. But what activities currently happen in these areas?
The issue is more complicated than deciding to follow the climatic conditions with our farming. What does this mean for land use planning, both in the places which stand to lose productivity and those which stand to gain?
- chocolate [54]
- champagne [55]and beer [56](for those of us over 21)
- avocados [57]
- 5 major crops threatened by climate change [58] (NPR, 2018)
Longer Growing Season
In a changing climate with predominant warming trends, we're seeing the lengthening of our growing seasons (as defined by the period of time with frost-free days). Given what we understand about the increased pressures to feed a growing global population, a longer growing season sounds like it might be the silver lining of climate change impacts we've been searching for, doesn't it? Let's take a closer look.
A longer growing season does mean that some crops and forests are growing for longer periods of time each year; sequestering more carbon dioxide from the atmosphere - good news! But, longer growing seasons for good plants also mean longer growing seasons for less desirable plants. Remember when we looked at the lengthening of seasonal allergy seasons when we talked about human health? Plants like ragweed will enjoy these longer growing seasons, too (EPA, 2016 [59]).
Impacts on Water
Climate change is creating major consequences for water resources through its impacts on the planet’s hydrology.
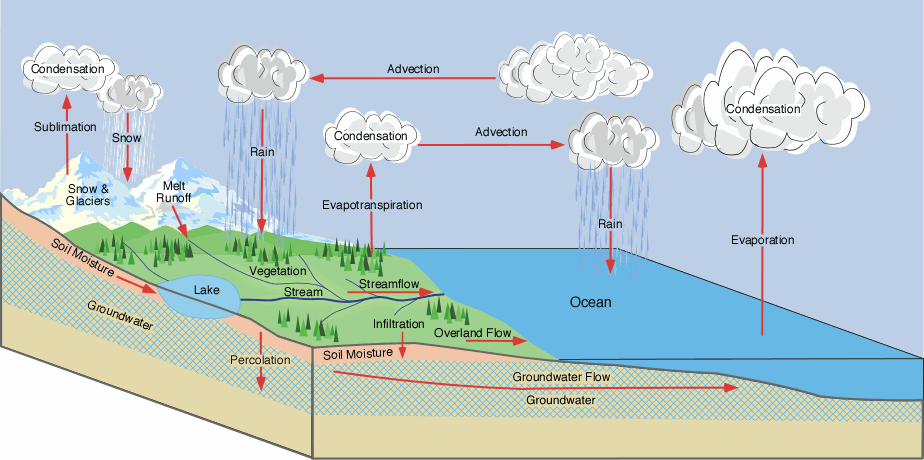
- Hydrology is the physical science of the distribution, movement, and quality of water in the Earth system.
- Water resources is the term which refers to the social science of the human use of water through agricultural, industrial, domestic, recreational, and other activities.
To put it another way, our impacts on water are a bit of a double whammy. Because anthropogenic climate change is altering water’s distribution, movement, and quality, climate change is also causing humans to adjust the ways we use water.
We'll spend a fair bit of time exploring the impacts of climate change on water resources and understanding how these impacts vary from place to place. But first, it takes a look at the physical impacts of climate change on hydrology so we approach that exploration with a solid foundation of its root causes.
Changing Hydrology
Alterations in hydrology caused by climate change are complex. A simple increase in average temperature results in greater evaporation from soils, drying them out and providing less water to plants and diminished input to groundwater. Less soil water and groundwater lead to lower stream and lake levels and reduced wetland areas. Increased temperatures also mean greater evaporation from lakes and wetlands. Greater evaporation from land surfaces and water bodies, including the oceans, produces more water vapor, which translates into global precipitation increases. (Oh, good news! A few sentences ago it was looking like we were having less water enter the groundwater. Not so fast...)
Those increases, however, are not evenly distributed in time and space (geography matters!). Those places getting much more precipitation find that the increased precipitation offsets the greater evaporation from land and water surfaces; these places are wetter. Those places seeing only a modest increase in precipitation or no increase at all find that increased evaporation rates overshadow precipitation and total available water decreases. Finally, in combination with increased evaporation, those places receiving less precipitation are much drier than before climate change.
These combinations of factors become even more complex if the seasonality of precipitation changes. Some places are becoming wetter in some seasons and drier in others, and the impact of those changes on hydrology is a function of which season is becoming wetter and which one is becoming drier, of the timing of those changes in the annual water cycle, and of the type of precipitation that falls. For example, some mountainous regions are finding that the first snowfall in autumn is coming later and the last snowfall in spring is coming earlier. This change means that the snowfall season is much shorter and snowpacks are much thinner on average. Not only does that change result in less water in the snowpack, but also it causes the release of that water with spring melt to come earlier and to have a significantly smaller peak flow in streams. Regions that rely on mountain snowpacks for their water supply watch these changes with growing alarm. This feels a bit confusing; let's walk through this more carefully with The Importance of Mountain Snowpack to Water Resources [63]. I like this brief write-up because it talks about a few specific regions in the US and what this means for each of them.
Precipitation Effects
More water vapor in the atmosphere from increased evaporation causes some areas to get more rainfall. When the greater latent heat stored in the evaporation process is released by condensation–that is, the formation of clouds–this energy produces stronger updrafts with more liquid water and, ultimately, heavier precipitation. Indeed, like most other areas on Earth, observed precipitation over the United States shows that precipitation totals have been going up for the last century. Moreover, precipitation events are getting more intense and these stronger events are becoming more numerous over most of the country.
The payoff from these changes in hydrology is easy to understand and to document. Despite overall increases in precipitation, drought is becoming more frequent because in those areas where precipitation has not been increasing strongly, greater evaporation results in drier soils and less available water. Even in areas that are becoming wetter on average, a period of decreased rainfall––say, a few weeks––coupled with higher temperatures results in quick drying and rapid conversion to drought. Ironically, the more frequent, more intense downpours lead to more flash floods. Prolonged, stronger wet periods also generate more floods. Thus, climate change results in greater hydrologic variability over time and space, producing more droughts and floods overall and in any one place. Streamflow and groundwater is, therefore, more variable than ever and much harder to predict and manage.
It is worth noting that sea-level rise resulting from climate change also affects hydrology. Saltwater intrusion into coastal aquifers is increasing partly from greater extraction by growing human populations, and partly from the greater osmotic pressures produced by rising sea levels. Simply, when people install wells, they draw down the water table, causing pressure that can pull saltwater into the aquifer. Concurrently, as sea levels rise, the pressure of all that water can force saltwater into the groundwater system. Saltwater is also increasingly working its way upstream in estuaries and coastal rivers, degrading and replacing freshwater.
The impacts presented above are an important subset of the total changes to hydrology produced by climate change. The following section explores how these hydrologic impacts translate into challenges for water resource and other managers.
Drought Effects
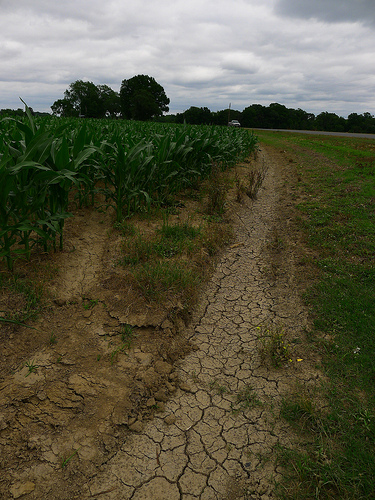
Drought is especially tough on agricultural production. Nearly all crops require moisture as they germinate, grow, mature, flower, and fruit. Yields of water-intensive crops especially depend on how much water is available during crucial life stages. For instance, corn yields are strongly associated with temperatures and precipitation totals in July: if conditions are cool and wet in that month, then yields will be high; if it is dry and hot in July, then yields will be low. Livestock operations also depend on water. For example, because feedlot cattle require significant quantities of water per cow per day, when drought strikes, feedlots must cut back on the number of cattle they process. It is easy to see that those areas experiencing increased frequencies and intensities of drought because of climate change will feel substantial impacts on agriculture output.
Drought influences many aspects of society beyond municipalities and agriculture. For instance, drought even has a big impact on transportation. A large proportion of U.S. commercial transport occurs on barges along the Ohio, Missouri, and Mississippi Rivers and their tributaries. Over 40 percent of all US grain exports travels on the Mississippi River alone. The devastating drought of 1988 stopped all barge traffic on the Mississippi for weeks and affected billions of dollars in exports. The less severe, but prolonged drought affecting the Missouri River drainage from 2003-2010 diverted products totaling many billions of dollars away from barges and onto less cost-effective trains and trucks. If climate change were to cause more droughts in the Midwest or generally dry out the area, then transportation costs and, subsequently, food costs would rise.
Water Quantity and Quality
Wet and dry periods have major impacts on the water quantity and water quality of both surface water and groundwater systems. Water quantities go up during wet spells and down during dry spells. Dams and reservoirs help solve surface water quantity problems by helping to control floods during wet periods, holding back floodwaters and allowing them to release gradually, thereby reducing the impact of the flood wave generated by nature. At the same time, dams and reservoirs help maintain adequate water supplies during dry periods by impounding water -- perhaps generated during earlier wet periods -- and releasing it as needed. Climate change could therefore necessitate more dams and reservoirs, with the large economic and environmental costs associated with them, such as the impacts on communities submerged by reservoirs or the impacts on ecosystems caused by changes in the quantities and timings of streamflows.
Groundwater quantities are also greatly influenced by wet and dry periods, with water tables rising when climate is wetter and falling when climate dries. One effect of rising and falling water tables is rising and falling streams. Many people do not realize that most water in streams comes not from storm water, but instead from groundwater. Streams occur at low points where the land surface intersects the water table, so when groundwater rises, stream levels rise. Conversely, when the water table falls below the streambed, the stream dries up, running only when a storm temporarily washes water into the channel. Climate change impacts on groundwater therefore will result in changing streams. Another, more purely human, technology associated with groundwater levels is wells. Wells experience few problems when water tables are high, but when they fall it becomes more difficult for wells to pump water, requiring well owners to purchase bigger pumps or -- in those cases when the water table falls below the well depth--dig deeper wells. Deeper wells and stronger pumps result in overpumping and a further drawdown in the regional water table. Consequently, those areas dependent on groundwater where climate change lowers the water table should expect less and more expensive water.
Water quantity is not the only aspect of water resources affected by climate; climate change will also affect water quality. Where net water quantities increase by moderate amounts, surface water quality will generally improve as streams and lakes fill and dilute their pollutants; where available surface water decreases, pollutants will concentrate and water quality will go down. In those areas where water quantities go up dramatically, or where intense precipitation events become more common, water quality will deteriorate substantially as more pollutants are washed into water supplies. Moreover, overloaded storm and sewage systems will spill effluent into streams and water supplies, producing important health hazards. Exceeded capacities will lead to damages, not only causing health hazards but also costing taxpayers large sums to repair, modify, or replace inadequate and damaged systems. Groundwater quality is declining, too, with climate change. Increasing heavy downpours are washing pollutants into wells more frequently, compromising local drinking water supplies after each heavy precipitation event. Sea level rise is causing more frequent cases of saltwater intrusion into groundwater supplies, making coastal drinking water unpleasant in many instances and undrinkable in others.
Water Competition
Climate change is also increasing competition for water resources. Competition for water already exists in drier areas. The U.S. and Mexico compete over Colorado River water, and Northern and Southern California compete for meltwater from the Sierra Nevada Mountains, for example. Such rivalries will increase as climate continues to dry in the Southwest, snowpacks continue to shrink in California, and other regions experience decreases in water resources. There will be competition not only within regions, but also between regions as water-poor regions fight for survival and water-rich regions seek to maintain competitive economic advantage.
In addition, climate change is bringing growing competition between and within market sectors. For example, in many regions of the nation, competition already exists as agricultural interests, municipalities, and energy production companies vie for shrinking water resources; that struggle is growing more combative over time, even resulting in calls for changes in longstanding water laws. Within sectors, such as agriculture, economically and politically entrenched water-intense activities are competing for water with less powerful, more environmentally sensitive, and less water-intense practices. Such competition will continue to intensify as the distribution of water over time and space changes with the climate.
North America is not the only continent facing this problem. The Murray River in Australia, for instance, is drying up and not reaching the population centers near its mouth. The cause of this drying is a combination of long-term drought and overuse by upstream farmers growing such water-intensive crops as rice. Severe competition therefore exists between agricultural and urban interests.
Summary
This week, we've been looking at some of the ways climate change impacts people in very up close and personal ways: our health, our food supply, and our water supply. We learned that climate change is having significant impacts on human health today; it will have even more dramatic impacts on health in the future. Those impacts either are direct, such as heatstroke, or indirect, such as disease transmission through mosquito vectors. One of the key takeaways, as we think about the effects on our health, is that they are varied, pervasive, and expected to become more severe as climate change impacts become even more acute.
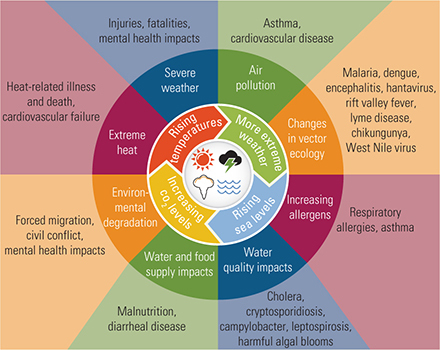
Rising Temperatures
More Extreme Weather
Rising Sea Levels
Increasing CO2 levels
Severe Weather: Injuries, fatalities, mental health impacts
Air Pollution: Asthma, cardiovascular disease
Changes in vector ecology: Malaria, dengue, encephalitis, hantavirus, rift valley fever, Lyme disease, chikungunya, West Nile virus
Increasing allergens: respiratory allergies, asthma
Water quality impacts: cholera, cryptosporidiosis, campylobacter, leptospirosis, harmful algal blooms
Water and food supply impacts: malnutrition, diarrheal disease
Environmental degradation: Forced migration, civil conflict, mental health impacts
Extreme Heat: Heat-related illness and death, cardiovascular failure
We've also looked at impacts on water and food. It doesn't get more integral to our survival than this (remember - not [just] about polar bears).
The story of food security and climate change is one of geography and compounding vulnerabilities. The shifts in where we can grow certain types of food is inherently a geographic problem to understand and carries economic, environmental, and social consequences of great import. Water poses more risks for competition-related issues. Both exacerbate vulnerable populations that may be experiencing insecurity for these basic necessities even before the impacts of climate change really take hold.
"When the well is dry, we know the worth of water." (Benjamin Franklin, Poor Richard’s Almanac, 1746.) Many of you seemed to come to a similar sentiment in your Write to Learn assignments that asked you to talk about what aspects of climate change impacts on human health you were most concerned about or how you personally felt most vulnerable to climate change, and as I told some of you, nothing else really matters if we don't have water. (Ben Franklin and I are clearly on the same page, except about kites and thunderstorms.)
Climate change is profoundly changing Earth’s hydrology, giving us too much water in some places, but too little water in others; giving us too much water at one time, but not enough water over time, and giving us rain, but not snow. (Instead of the line from The Rime of the Ancient Mariner water, water, everywhere but not a drop to drink (a sailor surrounding by salty seawater he cannot drink) it's more like water, water - not there, not like that, not then!!!) Perhaps the greatest challenge posed by climate change is deciding how to adjust our water resource use to address the new normals of hydrology.
Decision-making takes place at all scales of human endeavor, from individual and household levels to community, state, national, and international levels. People regularly make decisions about water use at all these scales, including decisions that have time horizons of decades to centuries. Humanity, therefore, appears to be equipped to handle the water resource challenge presented by climate change. Although competing economic, political, cultural, and social interests will undoubtedly make this task more difficult than it needs to be, humans are infinitely resourceful and will figure out how to meet this challenge and, in many cases, turn it to their advantage.
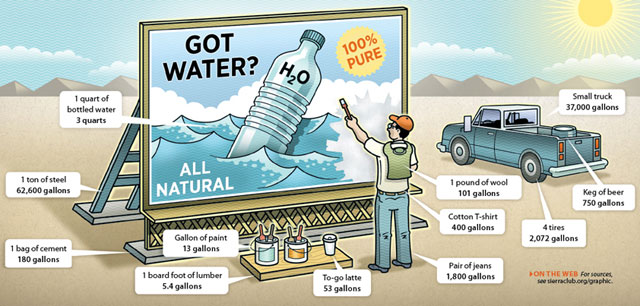
| Product | Amount of Water |
|---|---|
| 1 quart bottled water | 3 quarts |
| 1 ton of steel | 62,600 gallons |
| 1 bag of cement | 180 gallons |
| 1 gallon of paint | 13 gallons |
| 1 board food of lumber | 5.4 gallons |
| To-go latte | 53 gallons |
| Pair of jeans | 1,800 gallons |
| Cotton T-Shirt | 400 gallons |
| 1 pound of wool | 101 gallons |
| 4 tires | 2,072 gallons |
| Small Truck | 37,000 gallons |
| Keg of Beer | 750 gallons |
Reminder - Complete all of the Lesson 6 tasks!
You have reached the end of Lesson 6! Double-check the lesson assignments in the corresponding lesson module in Canvas to make sure you have completed all of the tasks listed there.