2: Emissions By Sector
Now that we've established the scientific context for climate change and understand that its emissions that primarily drive these changes, let's take a closer look at these emissions by sector. As we work our way through this lesson, be thinking carefully about how these emissions sectors relate both to the proximate causes and driving forces of climate change we learned about last week.
What will we learn?
By the end of this lesson, you should be able to:
- understand the role of each emissions sector in the overall emissions profile;
- describe the growth in GHG emissions from these sectors;
- identify and explain differences in emissions sectors in various geographic areas.
What is due this week?
This lesson will take us one week to complete. Please refer to the corresponding module in Canvas for specific assignments, deliverables, and due dates.
Questions?
If you have questions, please feel free to post them to the "Have a question about the lesson?" discussion forum in Canvas. While you are there, feel free to post your own responses if you, too, are able to help a classmate.
Energy
To understand emissions sources, it's useful to categorize those emissions. One such way to do that is by sector. This lesson is going to look specifically at Energy, which is the biggest source of anthropogenic GHG emissions (by far!). More specifically, we are going to break down energy into a few subcategories: power generation, transportation, and industrial processes, as shown below. This lesson, we'll be focusing on the subset of that big almost-the-whole-piece-of-the-pie energy sector.
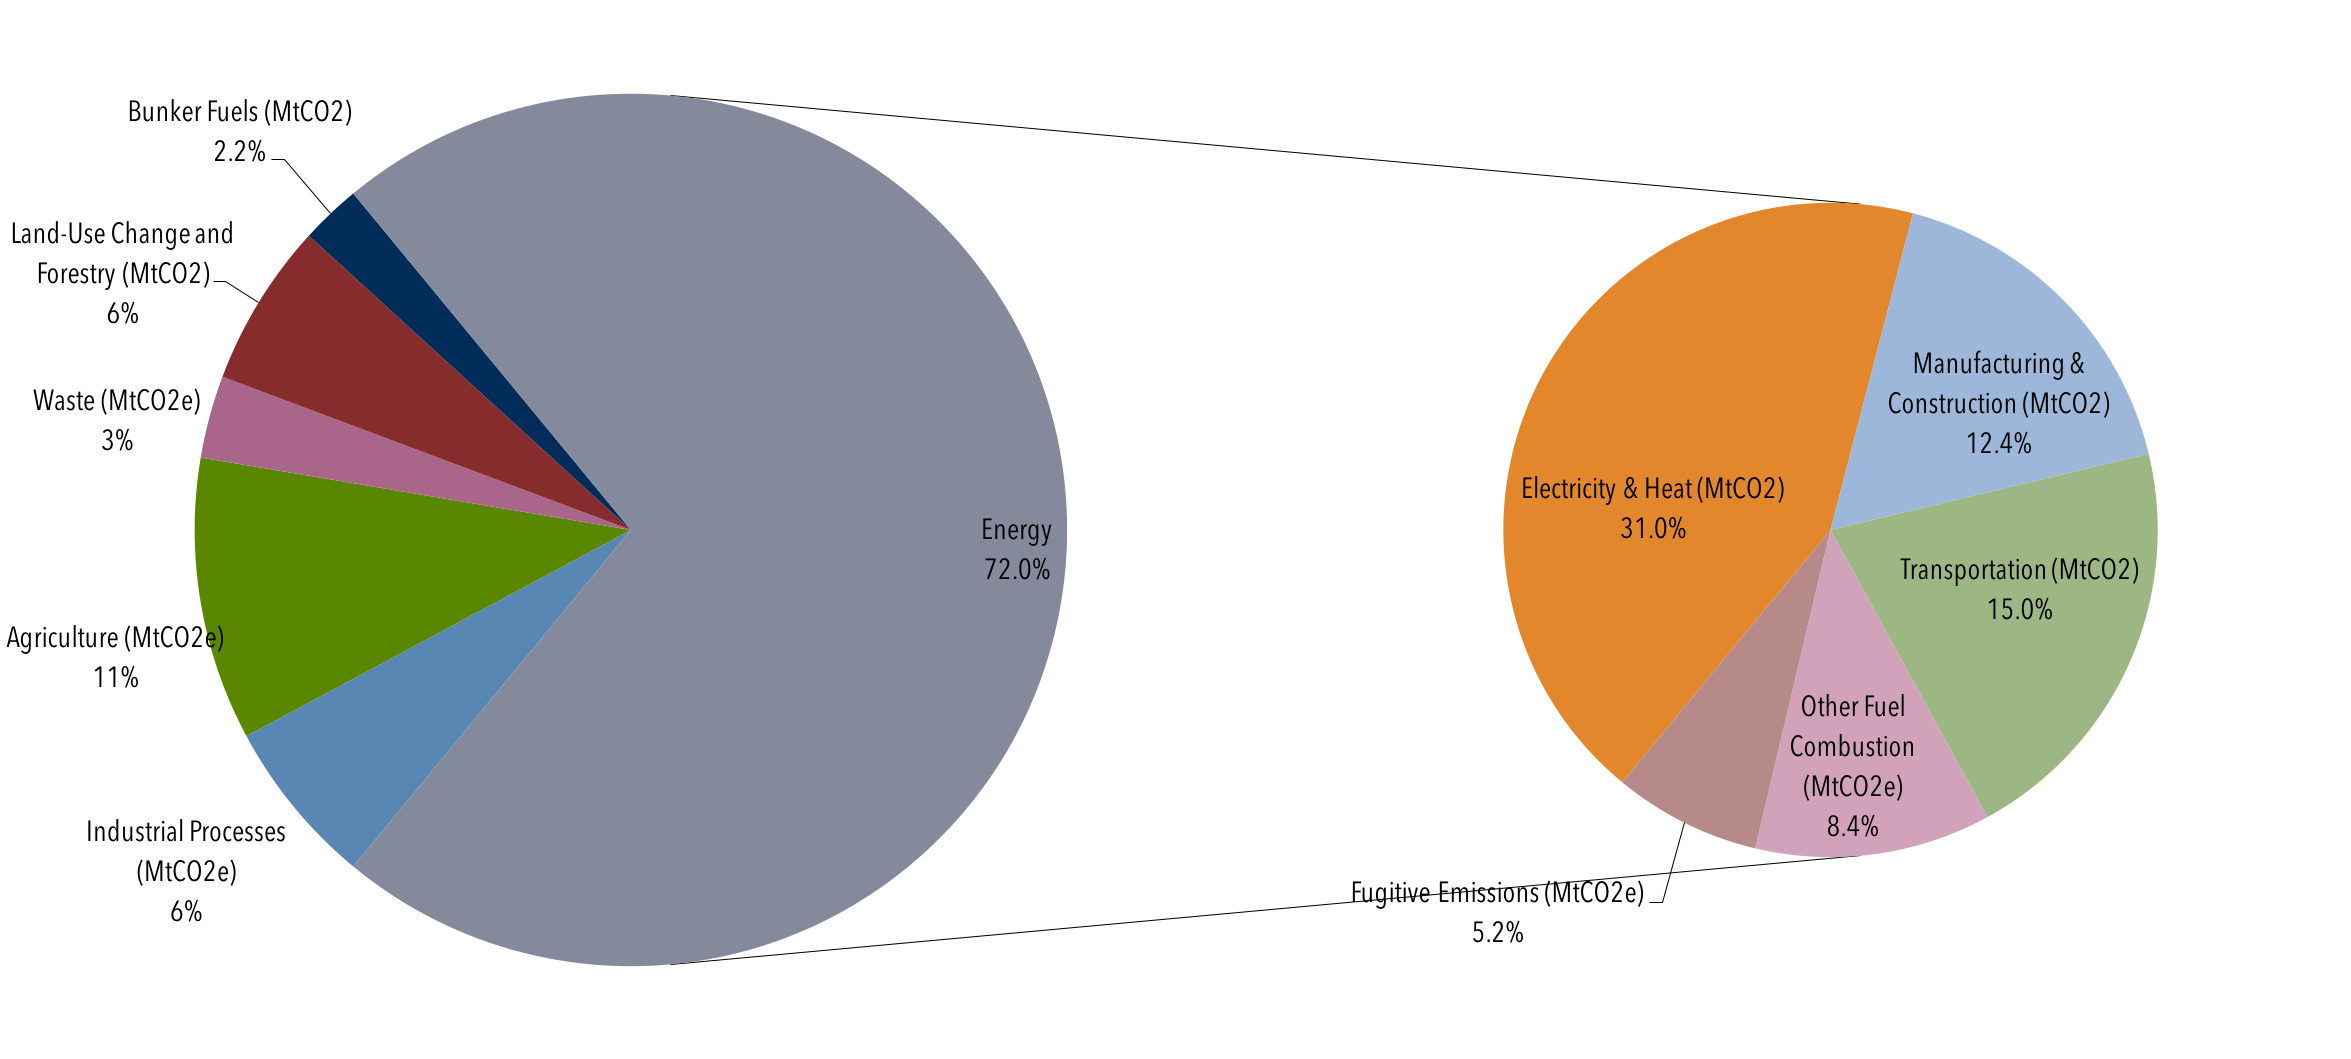
| Sector | Percentage |
|---|---|
| Energy | 72% |
| Agriculture (MtCO2e) | 11% |
| Industrial (MtCO2e) | 6% |
| Land Use Change and Forestry (MtCO2e) | 6% |
| Waste (MtCO2e) | 3% |
| Bunker Fuels(MtCO2e) | 2.2% |
| Source | Percentage |
|---|---|
| Electric and Heat (MtCO2e) | 31.0% |
| Transportation (MtCO2e) | 15% |
| Manufacturing and Construction (MtCO2e) | 12.4% |
| Other Fuel Combustion (MtCO2e) | 8.4% |
| Fugitive Emissions (MtCO2e) | 5.2% |
Energy use and consumption produce more GHG emissions than any other realm of human endeavor. A brief look at the socioeconomic drivers of energy use and consumption helps explain some of the reasons why. Current technologies for generating energy focus on GHG-intensive fossil fuels; the economic system favors producing the greatest amount of energy at the lowest cost and does not account for the environmental costs of energy production; political and legal institutions promote and protect fossil-fuel industries and typically fail to foster alternative energy sources adequately, and Western lifestyles are energy-intensive but many non-Westerners aspire to a Western lifestyle. Add to that the exponential growth of Earth’s human population and it is no wonder that GHG emissions continue to grow rapidly.
Introduction to the Energy Sector and Its Greenhouse Gas Emissions
Global GHG emissions from energy use and production far outweigh emissions from other activities. The industrial processes, agriculture, land-use change and forestry, and waste management sectors together account for 37 percent of all global GHG emissions in the accompanying pie chart. However, a significant proportion of the emissions from agriculture and from land-use change and forestry involve fossil fuel consumption, so the percentage of emissions from energy is greater than the graphic implies. Consequently, far more than two thirds of all GHG emissions result from energy use and production.
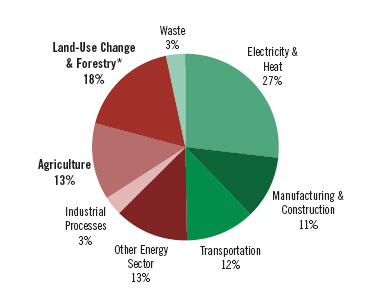
This is a pie chart showing the percent of GHG emission from various activities. Below it is represented as a table.
| Source of GHG Emission | Percent of total |
|---|---|
| Electricity and Heat | 27% |
| Manufacturing and Construction | 11% |
| Transportation | 12% |
| Other Energy Sector | 13% |
| Industrial Processes | 3% |
| Agriculture | 13% |
| Land-Use Change and Forestry | 18% |
| Waste | 3% |
In the pie chart, electricity and heat production is clearly the largest emitter of GHGs, being responsible for over one quarter of total emissions. Most of these emissions are attributable to society’s dependence on coal and secondarily on natural gas. The remaining energy categories –– manufacturing and construction, transportation, and “other” –– each contribute approximately equal proportions of the global GHG emissions.
Going beyond this particular graphic, when compiling the national GHG emissions inventory, the US breaks its energy sector emissions into three broad categories: mobile sources, stationary sources, and fugitive sources.
The stationary sources category is large and includes many activities.
- Most prominent in terms of GHG emissions is the electricity and heat generation subsector, mentioned above.
- Most of these emissions come from coal-fired power plants that generate electricity, heat, or both (through co-generation). Increasingly, because supplies are becoming cheaper and more plentiful, natural gas is replacing some of the generation capacity provided by coal, thereby reducing GHG emissions when there is a direct substitution of natural gas for coal.
- Power generation from natural gas emits about one half the emissions of coal, but is nevertheless still a potent source of GHGs.
- Moreover, developing countries such as China and India are building huge numbers of coal-fired power plants and –– although the newer ones use more advanced technologies that emit about one third fewer GHGs than old technologies –– are adding vast quantities of GHGs to the atmosphere.
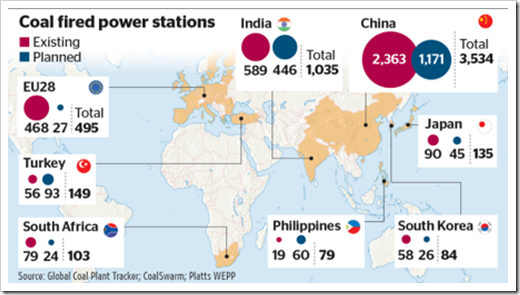
| Country | Existing | Planned | Total |
|---|---|---|---|
| EU28 | 468 | 27 | 495 |
| Turkey | 56 | 93 | 149 |
| South Africa | 79 | 24 | 103 |
| Philippines | 19 | 60 | 79 |
| South Korea | 58 | 26 | 84 |
| Japan | 90 | 45 | 135 |
| India | 589 | 446 | 1035 |
| China | 2363 | 1171 | 3534 |
There are many other important categories of GHG-producing activities:
- manufacturing and construction together are the second-largest emitters among the stationary sources behind electricity generation;
- mining (excluding coal mining) and the fossil fuel industries (including coal mining, petroleum and natural gas extraction, and fuel processing) are also major emitters;
- as noted earlier, agriculture and forestry consume fossil fuels;
- stationary sources involve food-processing and forest product-processing facilities, for instance;
- compared to the other stationary sources, commercial (e.g., corporate buildings, small businesses), institutional (e.g., government buildings, universities, prisons), and residential energy sources produce relatively modest quantities of GHGs through direct consumption of fossil fuels.
Even so, these enterprises consume huge amounts of electricity, and most of this electricity comes from fossil fuel-powered power plants, so these categories are indirectly responsible for a very large proportion of GHG emissions.
In addition to transportation and stationary sources, fugitive CH4 emissions from coalmines and from oil and natural gas drilling sites, as well as from natural gas pipelines, were thought to be a relatively small source of GHG emissions. Recent work, however, suggests that fugitive emissions may in fact be a major source of atmospheric CH4, so this part of the energy sector is coming under increased, intense scrutiny.
- Explained: Fugitive methane emissions from natural gas production [4](Carbon Brief, 2014) gives a nice overview of some of the more recent studies that have tried to answer this question.
- A close look at fugitive methane emissions from natural gas [5] (Bradbury and Obeiter, 2013) also gives a nice brief summary of the context of the problem and ways of trying to quantify its severity.
The relationships among energy production, energy storage and distribution, energy marketing, and energy demand and consumption are extremely complex. Thus, trying to pin GHG emissions to any one component in this complex web is arbitrary. Indeed, calculating emissions from the energy sector is fraught with error because of this complexity. It is best to think not in terms of exact proportions of GHG emissions from any one activity or subsector, but in terms of which categories are the big players.
Global Energy Demand and Consumption
The world consumes massive quantities of energy, with much of that energy embodied by GHG-emitting fossil fuels.[1] This image shows primary energy consumption by world region in 2015. Together, China and the United States represent 40% of global energy consumption. This is why our cooperation to solve climate change-related challenges is so pivotal.
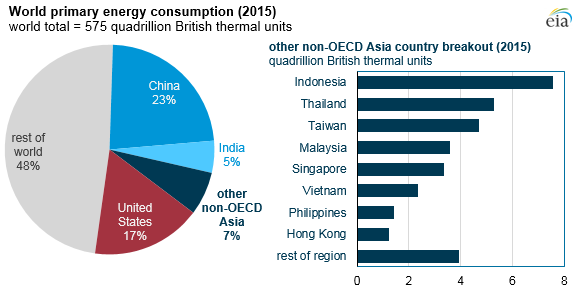
| United States | 17% |
|---|---|
| Other non-OECD Asia | 7% |
| India | 5% |
| China | 23% |
| Rest of the World | 48% |
| Country | Quadrillion British THermal Units |
|---|---|
| Indonesia | 7.5 |
| Thailand | 5.5 |
| Taiwan | 5 |
| Malaysia | 3.7 |
| Singapore | 3.5 |
| Vietnam | 2.5 |
| Philippines | 1.26 |
| Hong Kong | 1.2 |
| Rest of the Region | 4 |
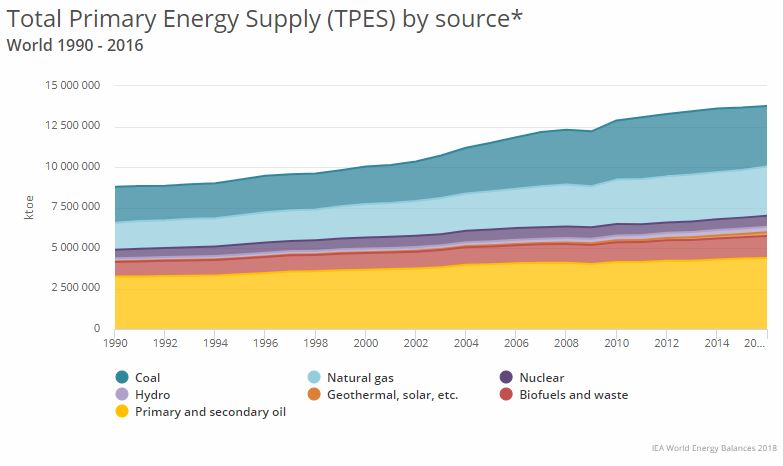
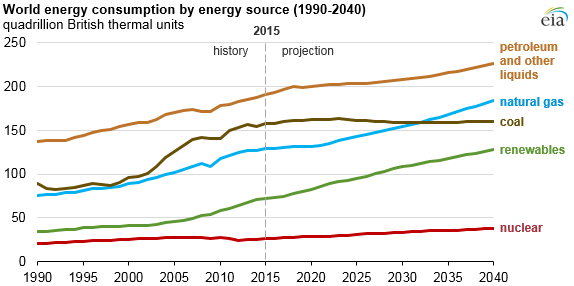
The next image shows a graph of global consumption by fuel type for 1990-2016. Overall consumption has almost doubled in this time period (and has more than doubled if we went back 40 years). The three fossil fuels (oil, coal, and natural gas) dominate, encompassing between 80 to 90 percent of energy consumption throughout the period. Oil provides the largest proportion of energy, but proportionally has lost ground to coal and especially natural gas (why might that be?). Coal has had an upsurge in the 21st century, especially after 2005, and may become the leading fossil fuel in the future as oil supplies drop and demand for energy increases in places such as China and India, with massive coal reserves but little oil and natural gas. Biomass and hydroelectric power grew a little. Other renewables are a trivial proportion of the global energy picture. Clearly, the grip of the GHG-producing fossil fuels on the world energy picture is strong.
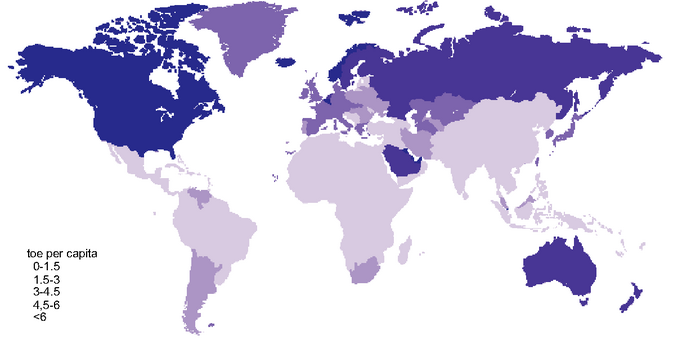
The next image shows a map of per capita energy consumption across the globe. An obvious general pattern emerges: low-latitude countries have very low per capita consumption –– and therefore low per capita GHG emissions –– while mid- to high-latitude countries have high per capita consumption and emissions. (Exceptions exist. For example, Saudi Arabia has anomalously high per capita energy consumption compared to surrounding countries because it is a wealthy, oil-rich country with a low population.) On the one hand, the pattern suggests that low-latitude countries with very low per capita energy consumption and very high populations such as China, India, and Indonesia, will become significant sources of GHGs as their per capita consumption figures rise. Indeed, China, which has the world’s largest population, has rapidly rising per capita energy consumption. Combined with its focus on coal as its primary energy source, China is now the world’s largest emitter of GHGs. India is hot on China’s heels, with a rapidly expanding coal-based economy. On the other hand, the pattern also suggests global inequities because the mid- to high-latitude countries have such very high per capita energy consumption figures. Opportunities exist for these countries to reduce per capita consumption by undertaking energy efficiency measures, adopting non-GHG-producing energy types, and modifying their energy-intensive lifestyles. This contrast between the low latitudes (the global South) and the mid- to high latitudes (the global North) is at the heart of the ongoing United Nations climate negotiations.
[1] Most of the remainder of this lesson is based on figures presented in Sims, et al., 2007. Energy supply. In: Climate Change 2007: Mitigation. Contribution of Working Group III to the Fourth Assessment Report of the Intergovernmental Panel on Climate Change [B. Metz, et al. (eds)], Cambridge University Press.
Greenhouse Gas Emissions from the Energy Sector
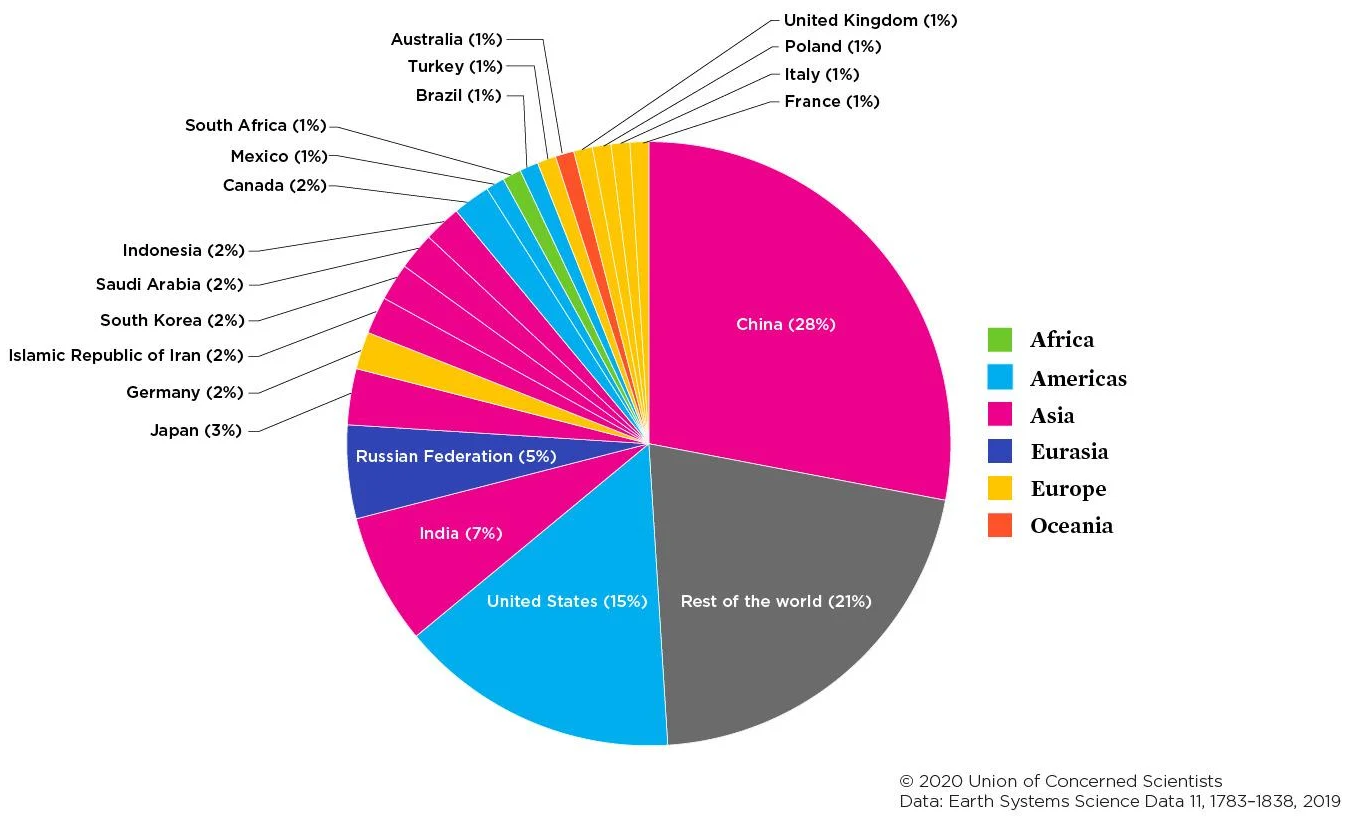
The next image shows CO2 emissions from fossil fuel combustion by country. In 2015, China's share was 28 percent of the world’s CO2, while the US share was 15 percent. The next closest country, India, emitted about 6 percent of the CO2. Clearly, to bring down global emissions from the energy sector, China and the US must lead the way.
| Country | Percentage |
|---|---|
| China | 28% |
| USA | 15% |
| India | 7% |
| Russian Federation | 5% |
| Japan | 3% |
| Germany | 2% |
| South Korea | 2% |
| Iran | 2% |
| Canada | 2% |
| Saudi Arabia | 2% |
| Rest of the World | 30% |
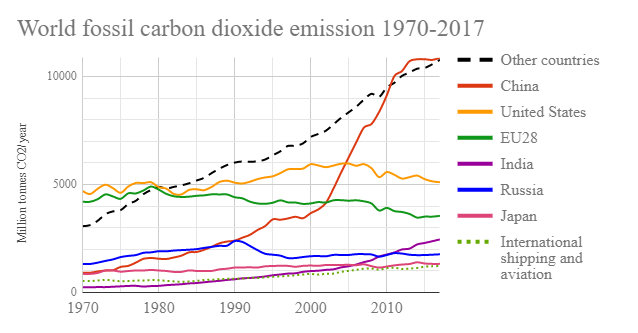
The next image is a graph depicting fossil fuel-based CO2 emissions for the US, China, several other key emitters, and the aggregate rest of the world between 1970-2017. What jumps out at you?
- China’s emissions rose sharply after the turn of the century, while the U.S. emissions started to flatten out and drop at the end of that same period. These trends have continued. It is important to note that estimates (Liu et al., 2013. Block, n.d.) attribute one-third of China’s emissions to their exports and 20 percent of those exports come to the U.S. Thus, this fact implies that U.S. CO2 emissions should be higher and China’s emissions lower. In any case, both nations dominate global carbon dioxide emissions.
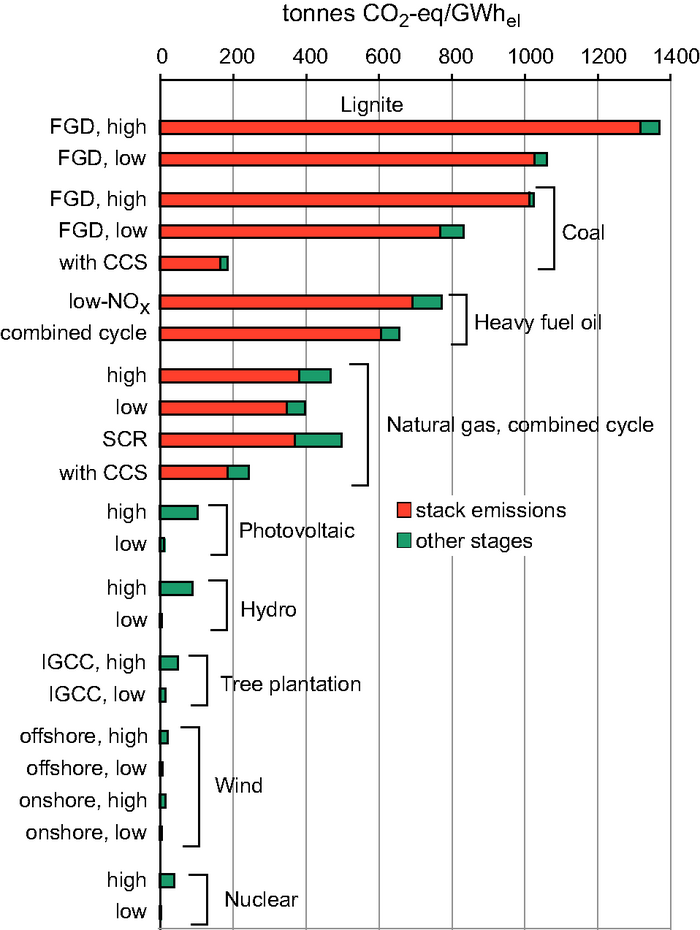
The next image displays the GHG emissions from the various systems used to generate electricity. Clearly, coal and its close cousin lignite produce the most GHG per unit of energy produced. Fuel oil is the next most GHG-intensive generation system. Natural gas, which is often touted as the clean alternative to coal, certainly emits about half as many GHGs per unit of energy but is still extremely GHG-intensive compared to non-fossil fuel alternatives. Renewables and nuclear produce trivial quantities of GHGs compared to the three fossil fuel types –– coal, oil, and natural gas.
| Electricity Generation System | Stack Emissions (tonnes CO2-eq/GWhel) |
Other stages |
|---|---|---|
| Lignite (FGD, high) | 1300 | 1300-1350 |
| Lignite (FGD, low) | 1025 | 1025-1050 |
| Coal (FGD, high) | 1020 | 1020-1025 |
| Coal (FGD, low) | 750 | 750-825 |
| Coal (with CCS) | 150 | 150-175 |
| Heavy fuel oil (low-NOx) | 700 | 700-775 |
| Heavy fuel oil (combined cycle) | 600 | 600-650 |
| Natural Gas, combined cycle (high) | 375 | 375-500 |
| Natural Gas, combined cycle (low) | 350 | 350-400 |
| Natural Gas, combined cycle (SCR) | 375 | 375-500 |
| Natural Gas, combined cycle (with CCS) | 175 | 175-250 |
| Photovoltaic (high) | - | 125 |
| Photovoltaic (low) | - | 25 |
| Hydro (high) | - | 100 |
| Hydro (low) | - | 5 |
| Tree plantation (IGCC, high) | - | 50 |
| Tree plantation (IGCC, low) | - | 20 |
| Wind (offshore, high) | - | 25 |
| Wind (offshore, low) | - | 5 |
| Wind (onshore, high) | - | 20 |
| Wind (onshore, low) | - | 5 |
| Nuclear (high) | - | 50 |
| Nuclear (low) | - | 0 |
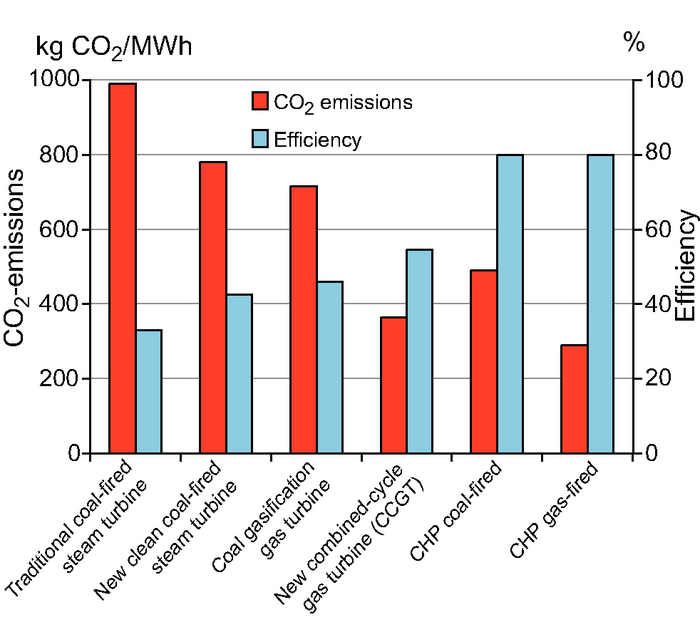
The final graphic in this section illustrates the fact that CO2 emissions go down as efficiency in burning fossil fuel in power generation goes up. For coal, new technologies improve efficiencies and reduce emissions –– but they are still exceptionally high compared to the alternatives. New natural gas power generation is about half as CO2-intensive as the best single-purpose coal-fired power plant. Cogeneration (also known as CHP, combined heat and power) is dual-purpose and drastically improves the efficiency of any fossil fuel power generating system, halving the efficiency of single-purpose systems.
| Energy Generation System | CO2 Emissions (kg CO2/MWh | Efficiency (Percentage) |
|---|---|---|
| Traditional coal-fired steam turbine | 995 | 30 |
| New clean coal-fired steam turbine | 775 | 40 |
| Coal gasification gas turbine | 700 | 45 |
| New combined-cycle gas turbine (CCGT) | 375 | 55 |
| CGP coal-fired | 500 | 80 |
| CHP gas-fired | 275 | 80 |
Transportation
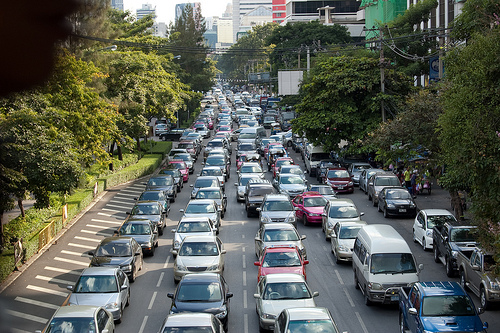
Transportation is a fundamental activity causing climate change. The transport sector includes air, sea, rail, road, and off-road transport and depends on petroleum for 95 percent of its energy. Consequently, it produces 23 percent of the energy-based GHGs, with 75 percent of those GHGs coming from road transport. Moreover, GHG emissions from this sector are the fastest-growing of all emissions. It is imperative that society figures out ways to reduce emissions from transport ––especially road transport –– in the near future.
Escalation of Global Transport Emissions
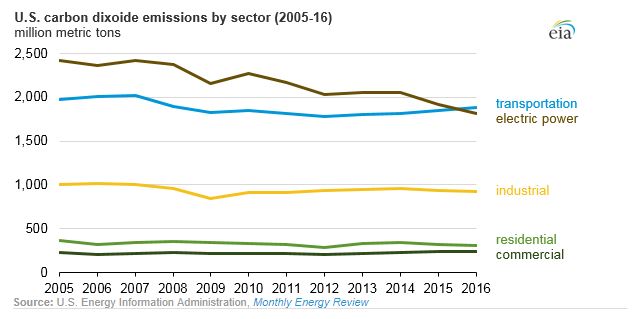
Transportation emissions have historically been the second-biggest sector for most countries (or other geographic scales of measurement), coming in only behind stationary energy sources. But, as the energy sector makes consistent strides in efficiency, these scales are tilting. Look at 2016 in the next image. Transportation emissions overtake emissions from electric power generation.
- Want to read more about this? Check out Yale Environment 360's Transportation Replaces Power in US as Top Source of CO2 Emissions [13] from December 2017.
CO2 emissions from historical and projected energy consumption by the transportation sector in the next image shows a five-fold increase in emissions between 1970 and 2050. Emissions growth from sea transport is relatively small, whereas air and road transport increases are bigger with the highest growth rates projected for air transport. However, despite the higher growth rates, road transport still maintains the vast majority of transportation-related emissions and therefore represents the biggest opportunities for reductions.
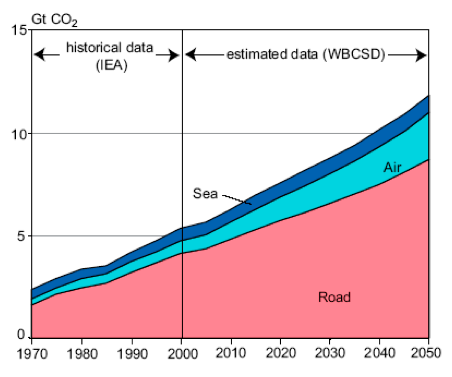
The image is a line chart described in text below. Numbers are approximate
- Road Sector
- Historical data from IEA (1970 - 2000), increase from 1.5 Gt CO2 to 4.5 Gt CO2
- Estimated data from (WBCSD) (2000 - 2050), increase from 4.5 Gt CO2 to 8 Gt CO2
- Air Sector
- Historical data from IEA (1970 - 2000), increase from 1.75 Gt CO2 to 4.75 Gt CO2
- Estimated data from (WBCSD) (2000 - 2050), increase from 4.75 Gt CO2 to 11 Gt CO2
- Sea Sector
- Historical data from IEA (1970 - 2000), increase from 2 Gt CO2 to 5.25 Gt CO2
- Estimated data from (WBCSD) (2000 - 2050), increase from 5.25 Gt CO2 to 12 Gt CO2
The US EIA finds that energy-related CO2 emissions in the transportation sector will remain relatively constant after 2030 because of little change in the carbon intensity of transportation fuels (EIA Annual Energy Outlook 2017 [16]).
- But what about the rapidly developing economies of the world?
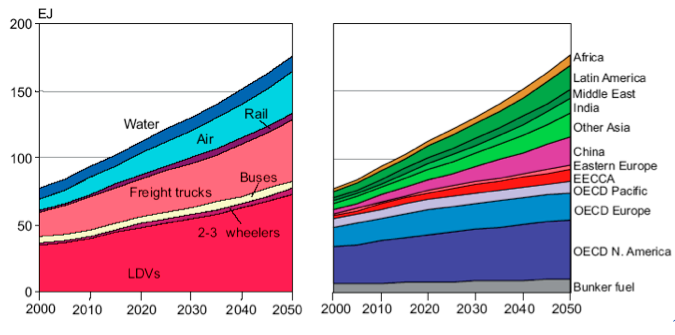
Projections of energy consumption (Figure 5.3) suggest that China will not be alone in its dash to institute private car ownership. Experts project that energy consumed for transport will more than double between 2000 and 2050. The strongest growth is expected to take place in the air, freight trucks, and light-duty vehicles (LDVs), which includes cars, pickup trucks, minivans, and sport utility vehicles (SUVs). That growth will be greatest in the developing countries, especially China, India, other areas of Asia, and Latin America. Note that this projection drastically underestimated the growth in China during the first decade of the millennium.
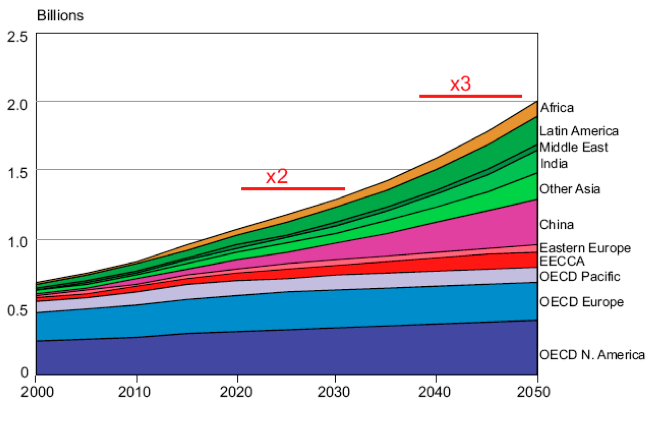
Focusing on LDVs in the next image, projections for the total stock see a doubling of LDVs in the 2020s and tripling of this vehicle type by mid-century. The least growth is projected to take place in developed countries, while robust increases are expected in developing countries. The biggest increases are projected for China, but those increases are happening now, so growth may be slower for that country later in the century.
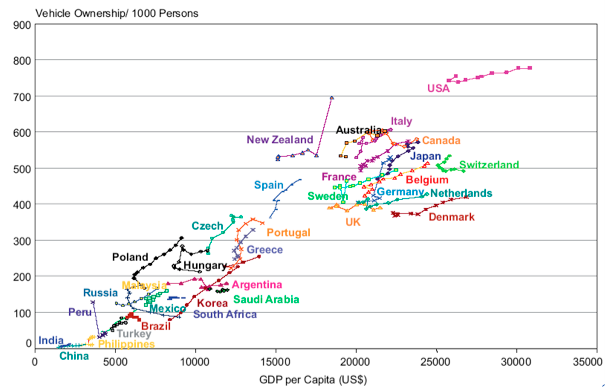
Vehicle ownership is a function of per capita income: as income goes up, rates of car ownership increase (Figure 5.5). The wealthiest major country –– the United States –– has much higher ownership rates than any other nation. Vehicle ownership is still very high among the next richest countries, essentially Canada, western and northern Europe, Japan, Australia, and New Zealand. Next comes southern and eastern Europe and Korea, followed by other developing countries around the world.
The take-home message from this series of graphs is that global energy consumption and GHG emissions from transport are increasing rapidly and are expected to continue grow significantly in the future. The largest subsector responsible for this growth is personal vehicles, which is projected to grow strongly over the coming decades as nations and their people emerge from poverty and are able to afford ownership.
The material for this section comes from Kahn Ribeiro, S., S. Kobayashi, M. Beuthe, J. Gasca, D. Greene, D. S. Lee, Y. Muromachi, P. J. Newton, S. Plotkin, D. Sperling, R. Wit, P. J. Zhou, 2007: Transport and its infrastructure. In Climate Change 2007: Mitigation. Contribution of Working Group III to the Fourth Assessment Report of the Intergovernmental Panel on Climate Change, B. Metz, O.R. Davidson, P.R. Bosch, R. Dave, L.A. Meyer (eds.), Cambridge University Press, Cambridge and New York.
US Transportation Emissions
Given car ownership rates for the U.S., transportation emissions are a major concern in this country. Transportation is responsible for 29 percent of the nation’s emissions as demonstrated in the next image. This sector is the fastest growing, accounting for almost half (48 percent) of the net increase in U.S. emissions since 1990. This rapid growth and sizeable portion of the overall emissions profile also means that there is ample opportunity for reductions.
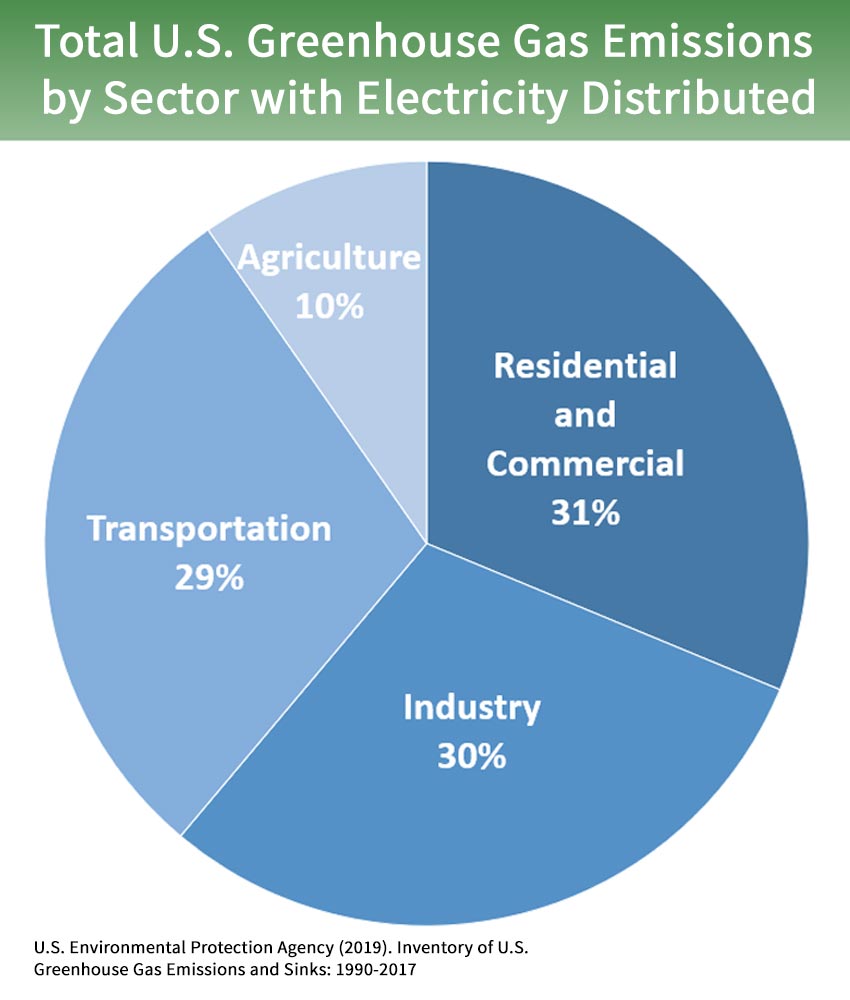
The image is a pie chart described in a table below
| Sector Producing GHG | Percentage |
|---|---|
| Residential and Commercial Electricity | 31% |
| Transportation | 29% |
| Industry | 30% |
| Agriculture | 10% |
Subsectors of Transportation Emissions
Let's break the US transportation sector down in more detail to get a better look at where these emissions originate:
- Light-duty vehicles - those are the passenger cars, trucks, and SUVs we all drive. Want to know more about what that really looks like? Check out EPA's GHG Emissions from a Typical Passenger Vehicle [18].
- Medium and heavy-duty trucks - construction vehicles and tractor-trailers and the sort fall into this category.
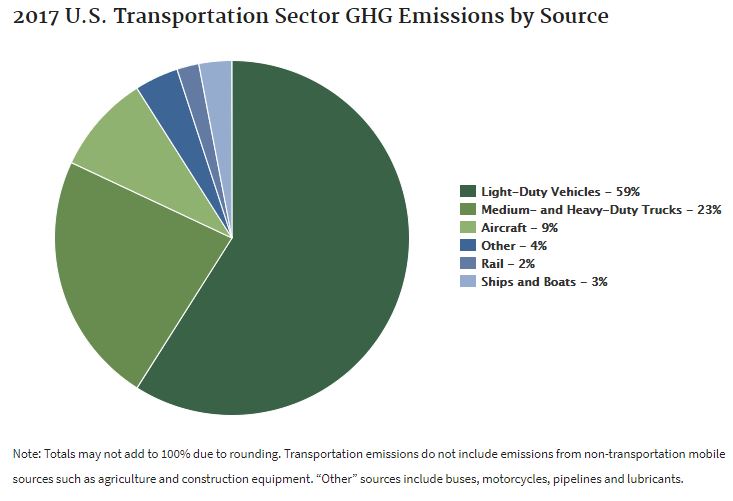
The image is a pie chart described in a four tables below.
| Type of Vehicle | Percentage of total transportation greenhouse emissions |
|---|---|
| Light-Duty Vehicles | 59% |
| Medium- and Heavy-Duty Trucks | 23% |
| Aircraft | 9% |
| Other (buses, motorcycles, pipelines, and lubricants) | 4% |
| Rail | 2% |
| Ships and Boats | 3% |
Global Transportation Emissions
According to the EPA [21], 95% of the world's transportation energy comes from fossil fuels. Ninety five percent! (That's higher than I expected, how about you?) This is predominantly comprised of gasoline and diesel for on-road use.
As global demand for personal transport goes up (World Economic Forum, 2016 [22]), we'll need to think creatively about how to reduce emissions while accommodating an increasingly mobile global population.
How do we handle twice as many cars worldwide in 2040 while also seeking to aggressively reduce global GHG emissions?
Reducing energy intensity and switching to low/no carbon fuel sources are just a few of the ways we might be able to achieve those goals. Check out some of the proposed solutions outlined in Project Drawdown's Transport Sector Summary [23].
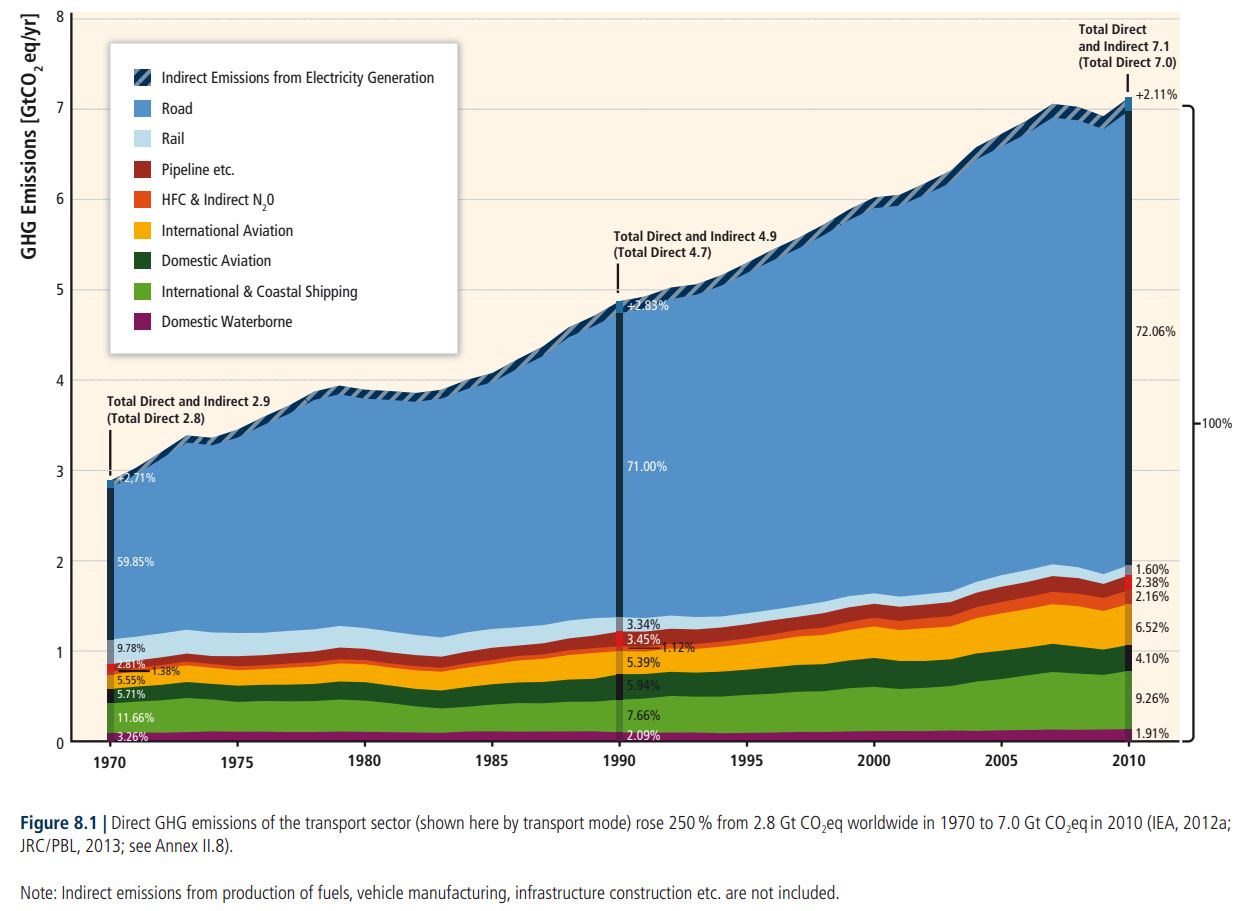
| Year |
Total Direct/Indirect (GTCO2 eq/yr) |
Total Direct (GTCO2 eq/yr) |
|---|---|---|
| 1970 | 2.9 | 2.8 |
| 1990 | 4.9 | 4.7 |
| 2010 | 7.1 | 7.0 |
| Year | Indirect | Road | Rail | Pipeline | HFC & Indirect N20 | International aviation | Domestic Aviation | International and Costal Shipping | Domestic Waterborn |
|---|---|---|---|---|---|---|---|---|---|
| 1970 | 2.71% | 59.85% | 9.78% | 2.81% | 1.38% | 5.55% | 5.71% | 11.66% | 3.26% |
| 1990 | 2.83% | 71.00% | 3.34% | 3.45% | 1.12% | 5.39% | 5.94% | 7.66% | 2.09% |
| 2010 | 2.11% | 72.06% | 1.60% | 2.38% | 2.16% | 6.52% | 4.10% | 9.26% | 1.91% |
The two takeaways from this graph are (1) transportation emissions have more than doubled since 1970 and are expected to continue increasing and (2) the vast majority of those emissions come from on-road sources (light duty vehicles and medium-heavy duty vehicles).
Are Electric Vehicles Really More Environmentally Friendly?
People often wonder, "But is an electric car really a better bet for the climate?" After all, we have to plug them in to charge them, and in many cases that electricity is generated with fossil fuels. And what about hybrid cars? Where do they stack up?
The video below from the Union of Concerned Scientists compares an average passenger car with a traditional internal combustion engine to that of an electric passenger car with an 84 mile range to answer this question. Take a look.
PRESENTER: Here's a question. How much cleaner are battery-electric cars compared to gasoline-powered cars? To find out, the Union of Concerned Scientists studied the total global warming emissions of each vehicle throughout every stage of its life, from manufacturing to driving to disposal. And there's a big difference.
Both cars start out on the assembly line with similar parts made of raw materials like steel and aluminum. For a gasoline car, this manufacturing and assembling stage generates about 7 tons of emissions. Battery-electric cars, meanwhile, are powered by-- you guessed it-- a large battery. This requires more energy and materials to produce for an 84-mile range battery-electric car, bringing its emissions tally up to roughly 8 tons.
But what happens when they hit the road? Gas-powered cars produced pollution with every gallon of gas they burn with even more emissions coming from extracting, refining, and transporting the fuel to gas stations. Electric cars, on the other hand, run on electricity, which can be much cleaner than gasoline depending on how the electricity is made.
2/3 of Americans live in regions where charging an electric car produces fewer global warming emissions than driving even a 50-mile per gallon gasoline car. By the end of their lives, the average gas car will rack up 57 tons of global warming emissions compared to 28 tons for a battery-electric car.
Disposing and recycling each car adds less than 1 ton of emissions. And remember that electric car battery? It can be recycled or reused. In the final tally, an 84-mile range battery-electric car cuts global warming emissions by more than 50% compared with a similar sized gas-powered car, making up for the batteries manufacturing emissions within one year of driving.
And as the country adds more and more renewable sources of electricity, driving electric will get even better. So there you have it straight from the engineers at the Union of Concerned Scientists. Electric cars-- clean and getting cleaner.
For more analysis of the charging emissions from electric vehicles, check out:
- Charging an Electric Vehicle is Far Cleaner Than Driving on Gasoline Everywhere in America [25] (Silvio Marcacci, 2018)
- Climate Explained: The Environmental Footprint of Electric Versus Fossil Cars [26] (Hasan and Chapman, 2019) - this is a nice summary broken down by phase - manufacturing, use, and recycling
The Department of Energy offers this handy tool [27]for consumers who want to understand the relative emissions if they buy (and charge) an EV where they live based on the fuel sources for electricity in their state.
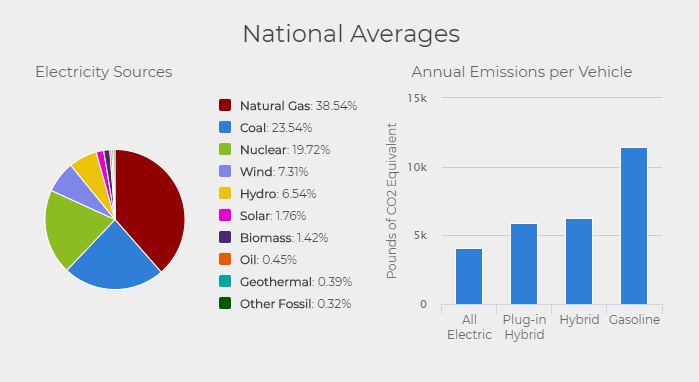
| Source | Percentage |
|---|---|
| Natural Gas | 38.54 |
| Coal | 23.54 |
| Nuclear | 19.72 |
| Wind | 7.31 |
| Hydro | 6.54 |
| Solar | 1.72 |
| Biomass | 1.42 |
| Oil | 0.45 |
| Geothermal | 0.39 |
| Other Fossil Fuels | 0.32 |
| Type | Thousands of Pounds of CO2 Equivalent |
|---|---|
| All electric | 4 |
| Plug-in hybrid | 6 |
| Hybrid | 7 |
| Gasoline | 12 |
Agriculture
When we talk about agricultural emissions, that can mean a lot of different things as these emissions are dependent on the type of activities occurring on a farm. For our purposes for this lesson, we'll look broadly at emissions from crop production and livestock production.
It can be tricky to understand the overall role agriculture plays in global emissions because of how some of these smaller sectors are grouped together sometimes. To take a closer look, we're going to take these pieces of pie and slice them even thinner.
The graphic below demonstrates that agriculture, land use, and forestry (often called AFOLU [29]) account for about a quarter of global greenhouse gas emissions.
- Of that quarter, about half of those emissions come from agriculture (most estimates are between 9-14%).
- If we keep drilling down, of that half of the quarter of global emissions (are you still with me, hang on!), more than half come from enteric fermentation, manure management, and fertilizer use.
We'll focus our attention this week on these bigger subsector areas. And then, to keep things fun, I've included food waste in this section too. It's not technically categorized as an agricultural emissions source here, but I think in the context of our thinking about where emissions are coming from and what we can do about them, it makes sense to talk about it here (and, we're also covering waste this week - so it fits nicely with that, too).
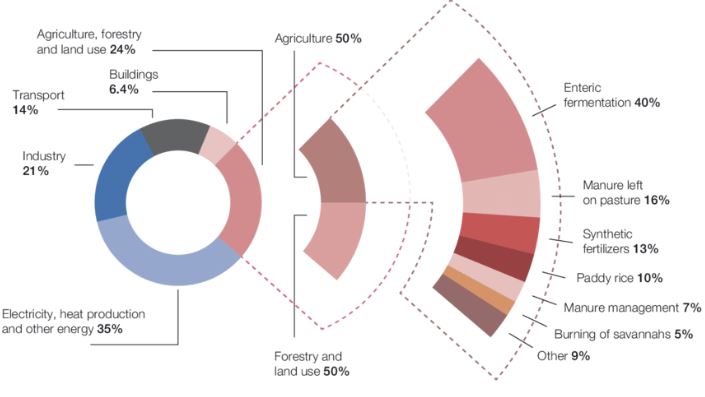
| Source | Percentage |
|---|---|
| Electricity, heat production, and other energy | 35% |
| Industry | 21% |
| Transport | 14% |
| Buildings | 6.4% |
| Agriculture | 12% |
| Forestry and Land Use | 12% |
| Source | Percentage |
|---|---|
| Enteric Fermentation | 40% |
| Manure Left on Pasture | 16% |
| Synthetic Fertilizers | 13% |
| Paddy Rice | 10% |
| Manure Management | 7% |
| Burning of savannahs | 5% |
| Other | 9% |
In the following video, Penn State Professor (and METEO 469 course author) Michael Mann discusses the systemic changes we need - primarily in agriculture but also in other contexts of our emissions behaviors (remember proximate causes and driving forces?). He talks about the need for both individual and collective action and how those efforts work together. (This video is required course content and fair game for the content quiz/exam 1.)
Christiane Amanpour: Welcome to the program, Michael Mann.
Michael Mann: Thanks, Christiane. It’s good to be with you.
Christiane Amanpour: So, I just want to pick up a little bit from where correspondent Bill Weir left off. Because he actually showed us some very hopeful innovation and hopeful farming methods that are already taking place. Let’s just talk about how that one farmer talked about being able to plant his land, allowing it to become a constant carbon sink, and you know, to be able to really even feed vast amounts of people. Tell us what good and what’s right about those sorts of farming methods right now.
Michael Mann: Sure, so the bad news, of course, is that our farming methods: agriculture, land use, deforestation are contributing substantially to the climate crisis as this report lays bare. But, at the same time, the good news is that there is ample room for mitigation. There are things that we can do to lower those carbon emissions from the agricultural sector, from the livestock and food production. Among those, as we’ve heard, is more careful methods of planting and agriculture, no-till agriculture, growing potentially different cultivars, feeding livestock different food. Different food sources can actually lower carbon emissions, methane emissions, for example, from cows and ruminants, so there is a lot of room to decrease those carbon emissions, which collectively are a little less than 25 percent. That means that this isn’t the bulk of the problem. The bulk of the problem remains our burning of fossil fuels for energy and transportation. But this is a significant piece of the pie. We need to focus on it, and there is ample opportunity for reducing those carbon emissions in a very win-win sense. Limiting deforestation, more productive agricultural methods that will feed more people can also help us sequester carbon so it doesn’t build up so quickly in the atmosphere.
Christiane Amanpour: So then tell me because you have contributed to other IPCC reports. Tell me what the significance is, in your view, of this latest report. We know that the first one which came out warned that we had until 2030 to get our act together as a world, to meet that 1.52-degree critical temperature rise. What is this one telling us, specifically?
Michael Mann: Yes, so these interim reports, this special report, for example, on land, that occurs between the major IPCC reports like the one that was published last year are important because they focus on specific topics which are of vital importance. In this case, this report focuses on land. That’s where seven and half-billion and growing people live. It’s where we live, and climate change is already having adverse impacts on that land. It is, for example, leading to a loss of coastal land because of sea-level rise and more devastating tropical storms that are inundating our coastlines. Because of the warming of the planet, a large part of the tropics is starting to become unliveably hot. And we have seen rampant wildfires in Eurasia, in the US, that, of course, are a threat to our infrastructure. So, we have these problems, these growing problems, associated with climate change, that threaten the amount of land that we have, at a time when we have a growing global population, again, of 7 and a half billion and growing, and, as we’ve already alluded to, the warming is having an impact, for example, on our ability to raise crops and livestock, and feed that 7 and a half billion and growing people. All of these things are intertwined; all of these challenges are intertwined.
Christiane Amanpour: Can I just ask you then. Again, let’s just go back to the farmer in Iowa who talked about how you don’t really even need more retraining like maybe other sectors of the economy might. You can make these and implement these changes without a massive overhaul. But, a lot of the overhaul that is necessary, according to the report, does require a lot of government resource, and a lot of, I mean, re-education, and making an awareness-raising of how you change your habits, the use of machinery, the intensity of the farming, etc., and just the wilding that the farmer was talking about. Tell us the challenges to the overhaul of the land production and use.
Michael Mann. Yeah, this gets at the heart of the problem, which is that is that any real solution, any comprehensive solution to the climate crisis is going to have to involve both individual behavior and collective and systemic change. There are many things that individuals, that we can do in our everyday lives, including changing our dietary patterns, changing our diets, that can lower our own personal carbon footprint. And in many cases, that makes us healthier, it saves us money, it makes us feel better. So, this is low-hanging fruit. These are things that we ought to do. But, at the same time, we need incentives, governmental incentives, policies, for example, to help shift us away from our reliance on fossil fuels to renewable energy. And that can take the form of a price on carbon, or explicit subsidies for renewable energy. That’s critical, because, again, the burning of fossil fuels is more than 2/3 of the problem. But we can also have policies that help farmers and help the agricultural industry adopt practices that are more carbon-friendly, that help us draw down that carbon from the atmosphere, which is an important part of the solution, while actually increasing agricultural productivity. We can’t do that without governmental incentives that sort of point us in the right direction, that shift the collective behavior the right direction. And, how do we achieve those policies? Well, we have to make sure that we elect politicians who will vote in our interest, who will act in our interest, rather than on the part of polluting interests who too often fund their campaigns, and have them in their hip pockets.
Christiane Amanpour: So, my thought in that regard. The farmer at the very end of Bill Weir’s report was quite poignant. Because on the one hand, you know, he didn’t want to talk about the politics. He didn’t want to admit or recognize that human(s) have an involvement in climate. He’s talking about deregulation. But then he says, “But look, you know, we’re doing the right thing and it’s important that we do the right thing. It helps.” And so, he’s kind of conflicted between, what’s the right way to farm, what is the right way to look at his land, and, what are the right politics around it? So, let’s just talk, because this report does focus mostly on land, and not so much on the fossil fuels that we’ve all heard of so much already. The whole business of consumption. So, the farmers will say, “Well, ok. Fine. You tell us to plant more whole foods, more grains, plant-based food. Cut back on our cattle. Cut back on the sheep. But, what if demand doesn’t change.” And let’s just remind people what demand is about. According to IPCC, food-calories per capita has increased by 1/3. Changes in consumption patterns contribute to 2 billion overweight adults. An estimated 821 million people are still undernourished, though. 25 to 30 percent of total food produced is lost or wasted. So, there are a lot of changes that need to be made. Not just going more into plant-based and whole foods.
Michael Mann: No. That’s absolutely right and, again, gets back to the heart of the matter. There are obviously things that we can do in our everyday lives. Being less wasteful of food, and in eating food that is less harmful to the environment, that is less carbon-intensive. And shifting away from meat is an important way of doing that, if it fits, you know, within the constraints of your lifestyle. That having been said, once again, we need incentives, educational efforts, government-funded and supported outreach in the form of public service announcements and programs, to inform people about the choices they make and how they can make healthier choices. And we come up once again against some pretty entrenched interests, for example, the fast-food industry. Of course, there are other challenges when it comes to our efforts to sort of transition to healthier diets, less, again, meat -and fat-intensive diets. That’s part of the problem, but to achieve that, we need changes. We need shifts in human behavior, and those shifts won’t happen on their own. They do require coordinated efforts, through educational programs by governmental and non-governmental entities.
Christiane Amanpour: Do you - before I want to play a little clip of an interview I had with Director James Cameron and his wife Susie, and they’ve come up with a book called OMD, essentially one meal a day, and it’s about being plant-based. But before I do that, I want to ask you. Is there a comparable shift in human behavior and habits that have occurred in the past with government help and public service announcements and all the rest of it – that has worked? Because that’s what everybody says. I mean, how are we going to shift human behavior in such a dramatic way?
Michael Mann: Yeah, well, we have seen efforts of this sort succeed in the past. When it comes to global, environmental problems like ozone depletion and acid rain. Ultimately, these problems arose from practices that do occur at the individual scale. In the case of ozone depletion, it was spray cans and old leaky refrigerators — refrigerators that used chlorofluorocarbons or freons, these chemicals that ultimately get into the stratosphere and destroy it. So it was individual behavior that was putting those chemicals into the atmosphere. And yet, what we saw was that a market-oriented program to place incentives that move the industry away from using those ozone-depleting chemicals ultimately did lead to the solution of the problem. We’ve seen massive recovery now of the ozone hole around Antarctica, because of those systemic changes that ultimately simply provided better choices to individuals and consumers, choices that don’t damage the planet.
Christiane Amanpour: I think that is really an optimistic and important reminder, that actually these things can work and can work in a way that is not just beneficial to the planet, but beneficial to individuals as well. It doesn’t cost them much. Here is what, though, on the planet and food and land issue that we are talking about particularly with this report, Director James Cameron and his wife told me a while ago.
Susie Cameron: What you’re putting on your plate actually makes a huge difference, towards not only climate change, but your health as well.
Director James Cameron: Um-hmm!
Interviewer: And, I guess….
Director James Cameron: And, the health of the planet. I …
Interviewer: Yeah. Go ahead…
Director James Cameron: Just the health of the planet. I mean, the quickest and easiest way for an individual to be, to feel empowered and to make a difference and to be able to look at their face in the mirror in the morning, and think: I’m making a difference, I’m doing something positive, not just for myself, my own health and my family’s health, but for the health of the planet, is to change how we eat.
Christiane Amanpour: So again, how does one shift populations? But you sort of indicated. Interestingly, in the report that we heard from Bill Weir, the farmers say, that the harsher the climate gets, the worse it is for them and for their land, and for their ability to make it economically. So, just wondering. We’ve had the hottest July on record here in Europe. You’ve got wildfires, a massive, massive amount, in Siberia. Even President Putin is talking about having to direct the state towards figuring out what to do. But of course, their economy kind of depends on fossil fuels. And so, I guess, how long do you think we have? And how? … You know, the ship of state, it says, is so difficult to turn around. How much effort and time is it going to take to just deal with the land issue?
Michael Mann: Yeah, and it’s important to realize that while there are economies that still rely on fossil fuels, the health of the planet relies on us getting off fossil fuels. And that’s of course, of far greater importance. We won’t have an economy to talk about if we don’t have a livable planet. So, you know, James Cameron makes some important points here. There is agency. There are things we can do in our everyday lives that do help solve this problem. And, by the way, they put us on a path. As we engage in these actions, we become more invested in solving this problem and more likely to participate in collective efforts, putting pressure on policy-makers, doing all those other things we can do to make sure that there is the systemic change that we need, that moves us away from fossil fuels, that moves us away from a carbon-intensive food system. There are all of these things we can do in our everyday lives, and changing your diet is one of the simplest things to do. I have chosen to not eat meat for a number of reasons, and I feel good about that choice. I feel healthier for having made that choice. But I don’t want to mandate other people’s choices. What I want to do is to provide them with the information necessary for them to make informed choices about their own individual actions, and more importantly to get them on that path of engagement, where they participate in the broader, collective action necessary for this dramatic systemic change that we need. By the way, as you allude to, over really just a decade, we need to bring those carbon emissions down by a factor of 50% and then down to near zero – 50% by 2030 and near 0 by 2050 if we are to avert the most catastrophic impacts of climate change.
Christiane Amanpour: OK
Michael Mann: But the good news there: the preliminary numbers are in for 2019. Obviously, 2019 isn’t finished yet, and there are lots of things that can happen. But based on the preliminary numbers, we’re seeing a significant drop of more than a percent in carbon emissions this year.
Christiane Amanpour: Wow!
Michael Mann: Another hint that maybe we’re starting to bend that curve downward, and we need to bend it down rapidly. But the first step is to bring those emissions to a plateau and start that decline…
Christiane Amanpour: That’s great!
Michael Mann: …towards 2030 and 2050 where we need to be.
Christiane Amanpour: That is very, very good news. And particularly what you say, Individuals can make a difference. And we’re obviously seeing it amongst young people, who put this issue of climate and environment at the very top of their political agenda. Michael Mann. Thank you very much indeed.
Crop Emissions
While we spend a lot of effort thinking about the role of livestock production as agricultural emissions, crop production also plays a significant role in several ways.
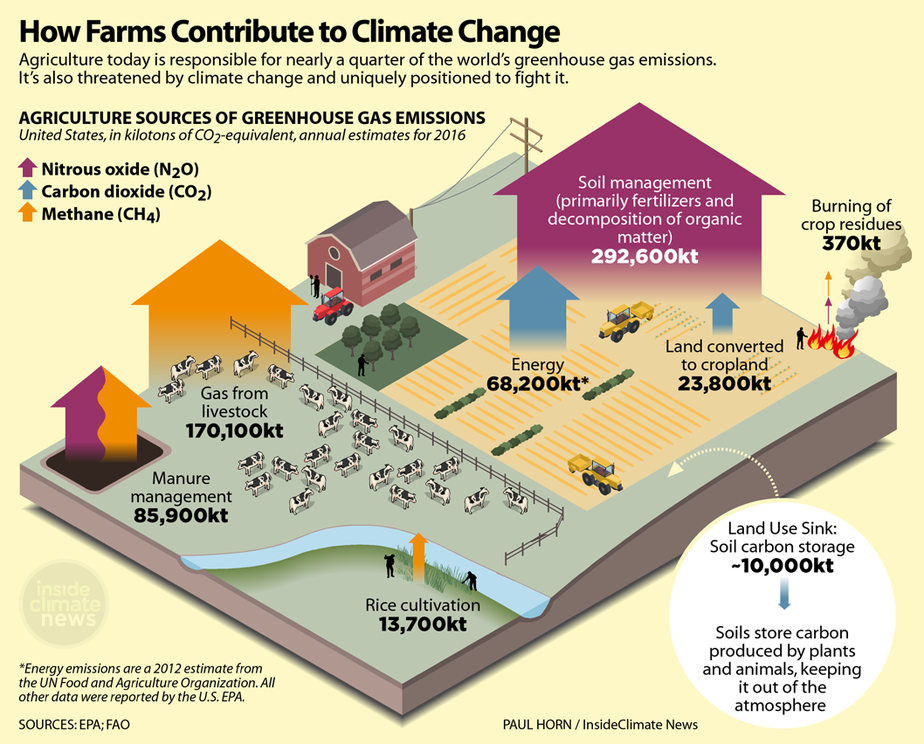
Image Reads: How Farms Contribute to Climate Change
Agriculture today is responsible for nearly a quarter of the world’s greenhouse gas emissions. It’s also threatened by climate change and is uniquely positioned to fight it.
Agriculture Sources of Greenhouse Gas Emissions: US, in kilotons of CO2-equivalent, annual estimates for 2016
Manure Management: Methane and Nitrous Oxide – 85,900kt
Gas from livestock: Methane – 170,100kt
Rice Cultivation: Methane – 13,700kt
Energy: Carbon Dioxide – 68,200kt
Land Converted to Cropland: Carbon Dioxide – 23,800kt
Burning of crop residue: Nitrous oxide and methane – 370kt
Soil Management (primarily fertilizers and decomposition of organic matter): Nitrous Oxide – 292,600kt
Land Use Sink: Soil Carbon ~-10,000kt. Soils store carbon produced by plants and animals, keeping it out of the atmosphere!
- conversion of land to cropland - changing land uses alter that area's ability to sequester carbon. Forests in the US are sequestering about 13% of our annual greenhouse gas emissions (USDA, n.d. [33]). Cropland isn't nearly as productive for sequestration.
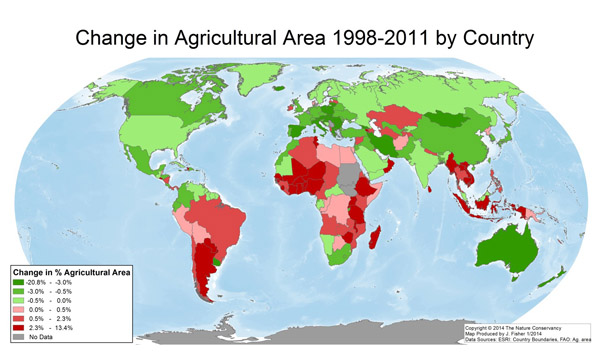
- fertilizer use - nitrogen-based fertilizer leads to increases in nitrous oxide emissions (UC Berkeley, 2012 [35]). Nitrous oxide's global warming potential is roughly 265-298 times that of carbon dioxide - yikes! (EPA, n.d. [36]).
- energy use in crop production - it takes energy to grow our food - take a look at this chart. If we were in class together, before I showed you this chart, I'd ask for a show of hands - Who thinks it takes more energy to raise livestock? Ok, who thinks it takes more energy to raise crops? I'm guessing most of you would have raised your hand for livestock (and I might have been included in that group myself!). But it turns out, the direct energy consumption for raising crops is more. But, if you go to the EIA discussion of this graph, you'll see that they caveat it that this livestock number does not include the energy it takes to grow livestock feed - that's an indirect energy use not captured here. This is a good example of why it's always important to make sure you understand the data you're looking at.
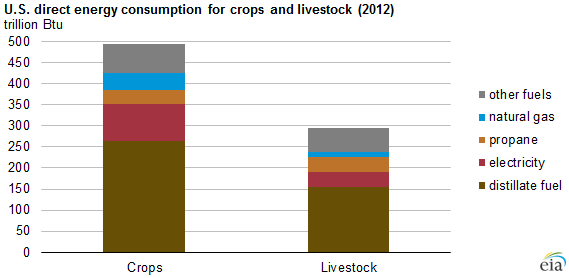
| Energy Source | Trillion Btu's for Crops | Trillion BTU's for LiveStock |
|---|---|---|
| Distillate Fuel | 265 | 155 |
| Electricity | 85 | 40 |
| Propane | 32 | 32 |
| Natural Gas | 40 | 12 |
| Other Fuels | 60 | 55 |
Livestock Emissions
The livestock we raise for meat and dairy consumption has a sizable impact on the global emissions profile.

Sometimes, the popular media likes to capitalize on the sensational nature of talking about cow burps and farts and greenhouse gas emissions (see Forbes article [40] for proof). And maybe this isn't all bad if it gets people talking (and possibly giggling) about the role our diet plays in the global climate crisis. (Did the instructor really use the word 'farts' in class? I think so...). And while that's certainly part of the puzzle, livestock-related emissions are much more complex and varied. We're going to take a look at several broad categories (as outlined by the Food and Agriculture Organization of the United Nations).

| Type | Percentage |
|---|---|
| Enteric, CH4 | 39.1 |
| Applied & Deposited manure, N2O | 16.4 |
| Feed, CO2 | 13.0 |
| Fertilizer & Crop Residues, N2O | 7.7 |
| LUC: pasture expansion, CO2 | 6.0 |
| Manure Management, N2O | 5.2 |
| Manure management, CH4 | 4.3 |
| LUC: soybean, CO2 | 3.2 |
| Postfarm CO2 | 2.9 |
| Direct Energy, CO2 | 1.5 |
| Feed: rice, CH4 | 0.4 |
| Indirect Energy CO2 | 0.3 |
The emissions profile for livestock production varies by species. For example, if you look at this graphic below, you'll notice that almost all of the emissions associated with beef production come from enteric fermentation (the often satirized burps and farts, if you will), while chickens - not ruminant animals like cows - have no emissions from enteric fermentation and instead, their emissions are coming exclusively from manure management.
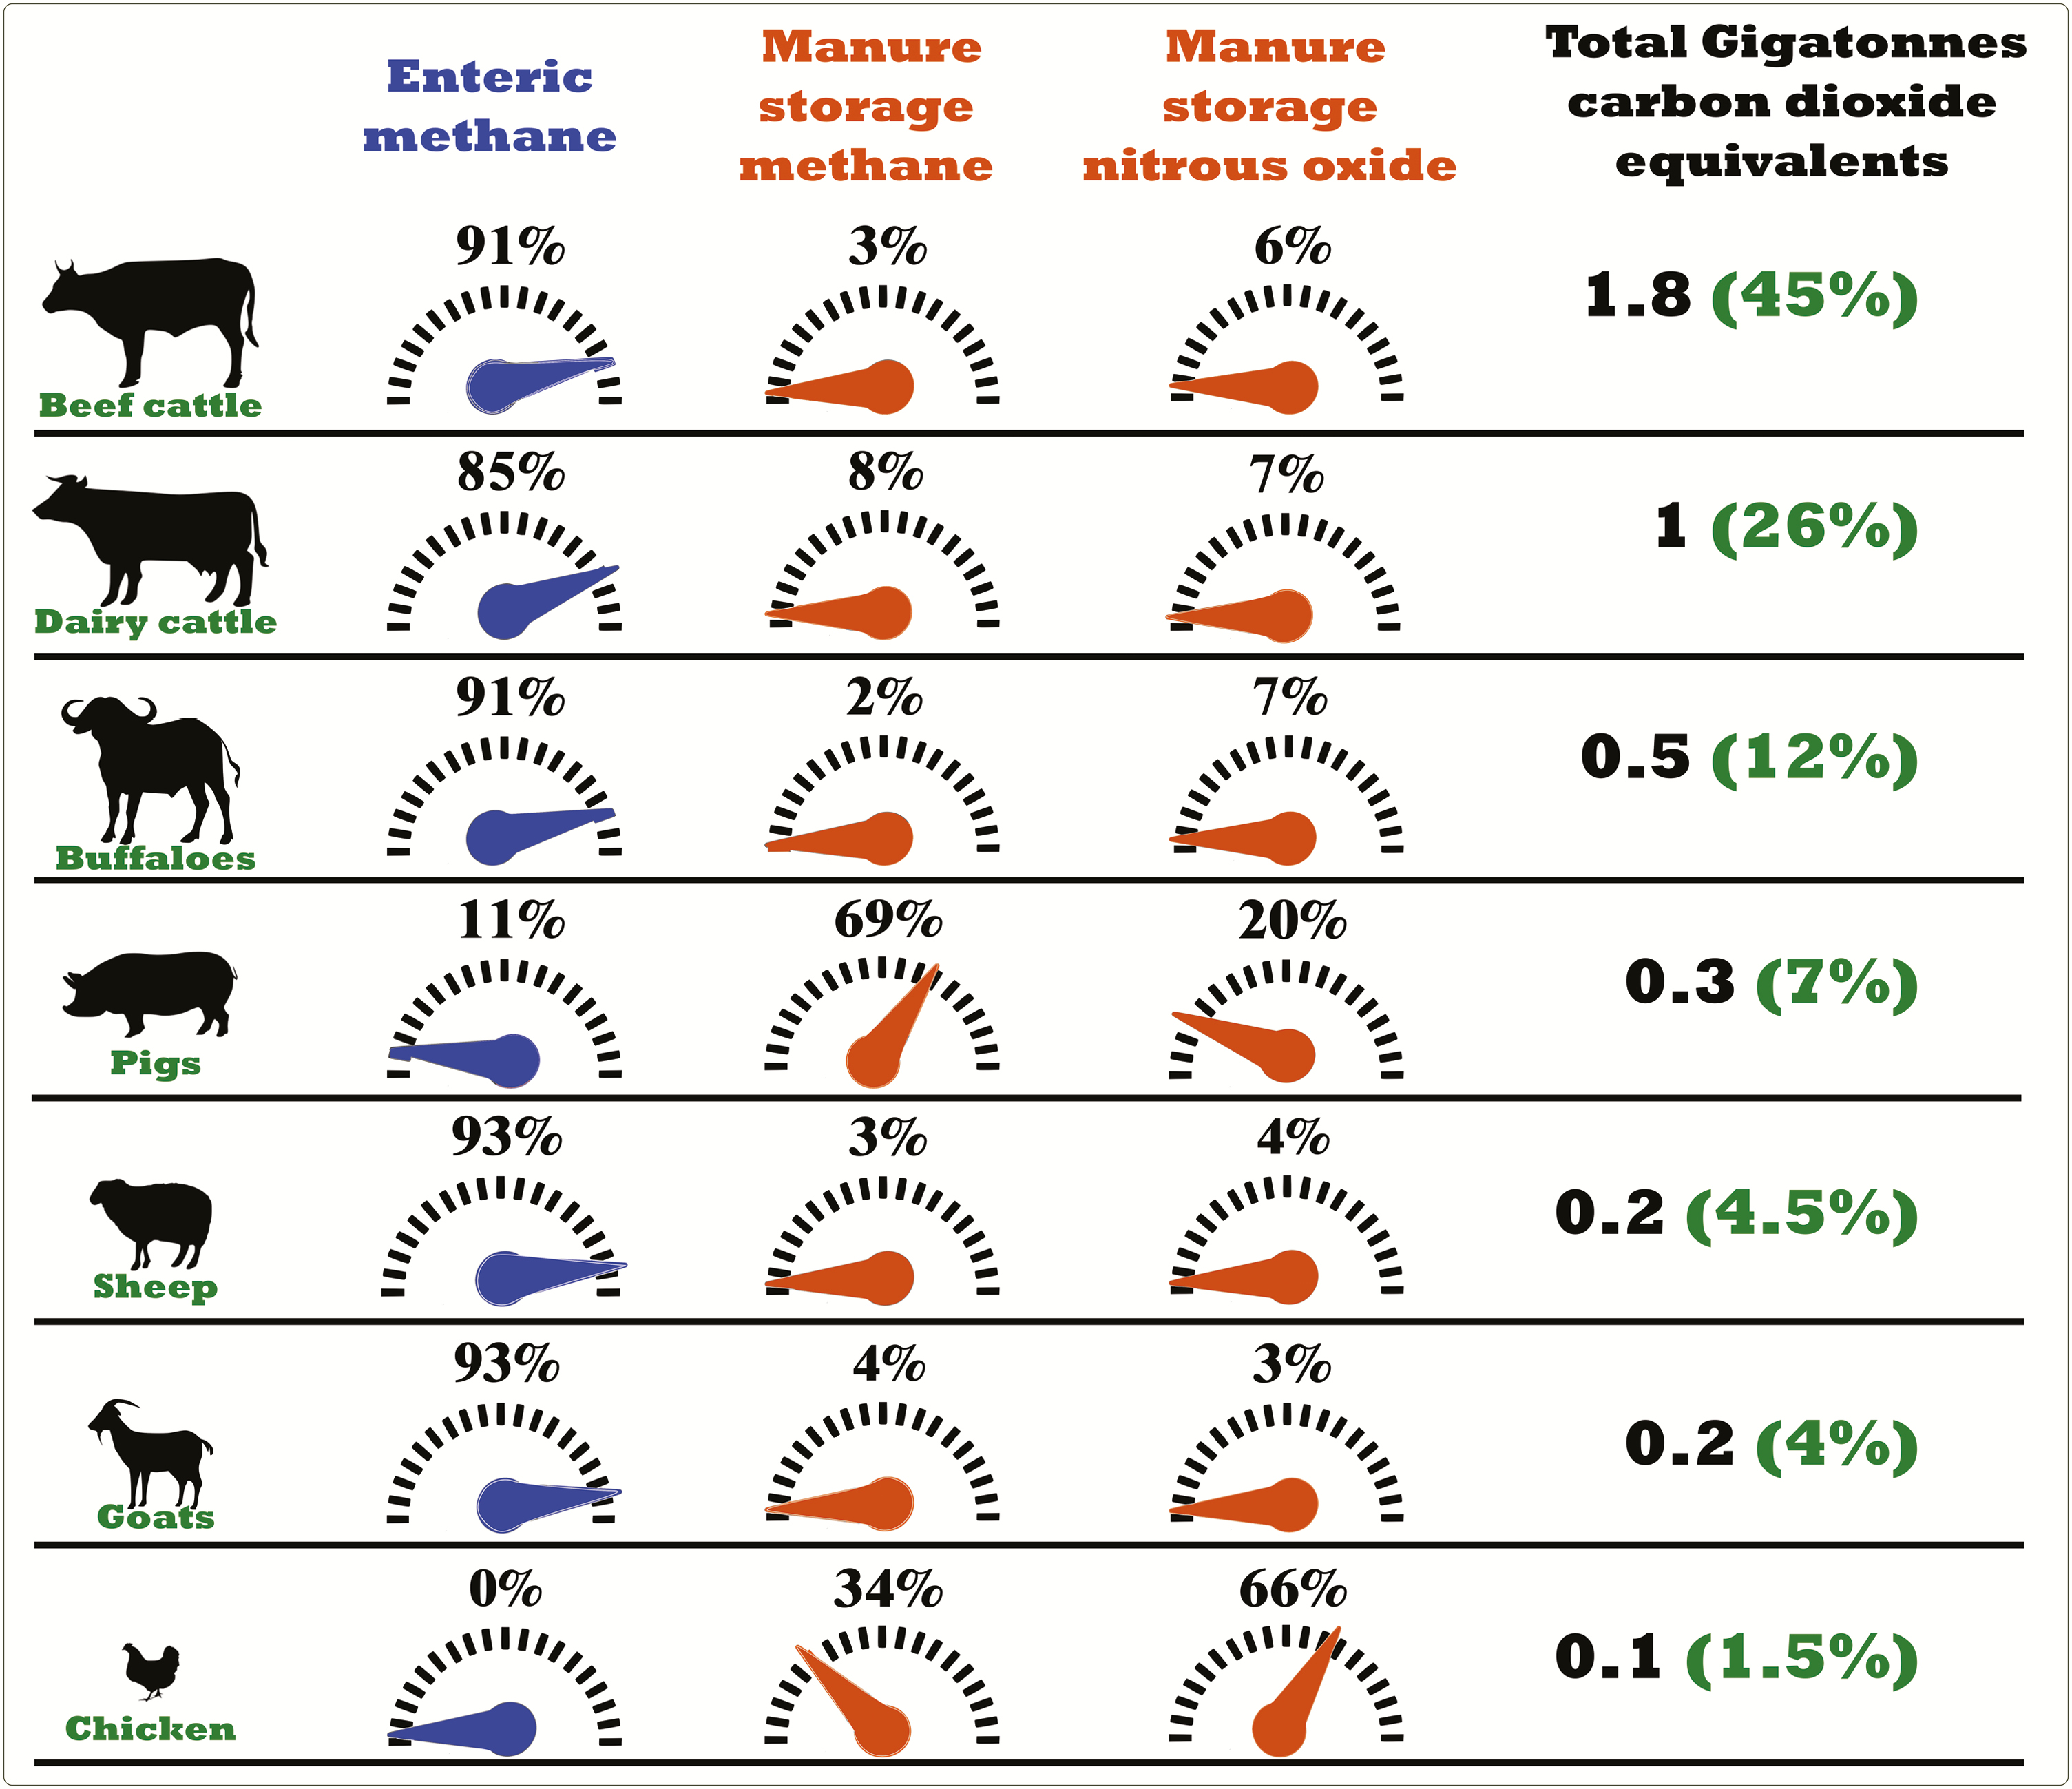
| Animal | Enteric Methane | Manure Storage Methane | Manure Storage Nitrous Oxide | Total Gigatonnes cO2 equivalents |
|---|---|---|---|---|
| Beef Cattle | 91% | 3% | 6% | 1.8 (45%) |
| Dairy Cattle | 85% | 8% | 7% | 1 (26%) |
| Buffalos | 91% | 2% | 7% | .5 (12%) |
| Pigs | 11% | 69% | 20% | 0.3 (7%) |
| Sheeps | 93% | 3% | 4% | 0.2 (4.5%) |
| Goats | 93% | 4% | 3% | 0.2 (4%) |
| Chickens | 0% | 34% | 66% | 0.1 (1.5%) |
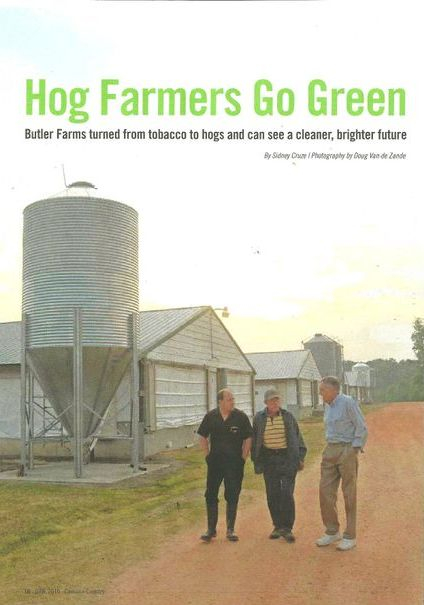
Before returning to Penn State to teach in the ESP Program, I worked as a Policy Analyst and Account Manager for a greenhouse gas offset project developer called Environmental Credit Corp. (now ClimeCo). Most of the offset projects we developed were related to manure management on hog and dairy farms. So, while all this chatter about manure this week may seem a bit unconventional or even gross to you, I guess I'm just used to knowing more about animal poop than I ever imagined I might! I thought I'd share a little bit of that experience with you here, as it relates to reducing greenhouse gas emissions from manure management practices on large-scale farming operations.
Many dairy and hog farmers use 'manure lagoons' for long-term storage of their manure. To put this bluntly, if you have a thousand (or in many cases way more than a thousand) anythings going to the bathroom every day, you need to figure out where all of that waste is going to go. For many farmers, manure lagoons offer a cost-effective and logical solution. They pump the manure into lagoons (they look like ponds, only you don't want to swim there!) and then several times a year, draw the manure out and land apply it to their fields as fertilizer. But, for the time, it's just sitting there, the manure is decomposing aerobically (with oxygen) and releasing methane directly into the atmosphere (and stinking up the neighborhood). The company I worked for partnered with USDA to offer farmers a simple alternative - covers for their manure lagoons. In the most simplistic of terms, we put tarps over these big ponds to capture the gas. In reality, it's a bit more complicated than that, and under those tarps (which are really 60 mm thick high density plastic), is a series of pipes to collect the gas. Now, the manure is decomposing anaerobically (because we took away the oxygen) and we can capture that gas.
What would we do with a bunch of captured methane? Well, there are a few options. The first, and less ideal option is simply to flare it. When it combusts, it combusts as carbon dioxide. So, there's still a greenhouse gas emission which occurs, but remember, its global warming potential is so much less than methane, there is a benefit to this. But it seems wasteful to just flare it when we can use it.
I'd like you to 'meet' Tom Butler. Tom was one of my favorite clients. He's a hog farmer in Lillington, NC and runs an 8,000 head feeder to finish operation. We covered Tom's manure lagoons in 2006 or thereabouts. Initially, we just flared the gas. But over the years, Tom has built a renewable energy empire on that hog farm, and he's now using all of his gas on-site to power his farm. How neat is that? And, lagoon covers offer some ancillary benefits worth noting, too. Think about Hurricane Dorian - do you want a hurricane's worth of rain dumping into a manure lagoon and possibly causing it to run over? No, you do not. With a covered lagoon, Tom doesn't have to worry about (increasingly more frequent) extreme weather events. Also, covered lagoons drastically reduce odor issues. I'll admit, I was nervous the first time I pulled up to Tom's farm. My husband had lived in North Carolina and assured me there was no smell quite like a hog farm. But, it actually was pretty tolerable.
Tom's a great example of a progressive farmer who is trying his best to do right by land, his animals, and the planet, and I thought it'd be nice to share this story with you, even if it is mostly about manure.
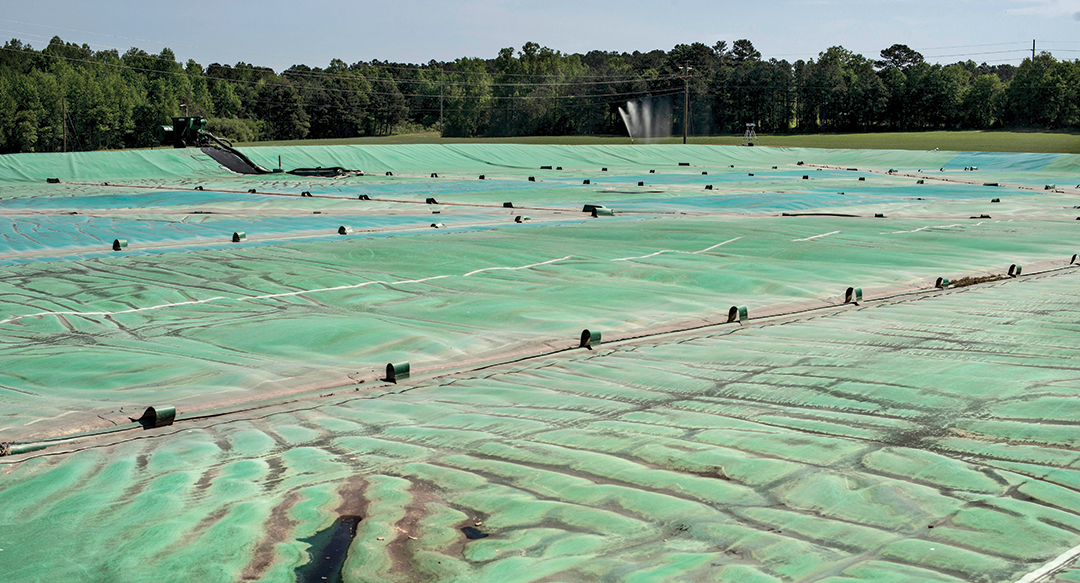
I couldn't dig up the picture, but I have a picture of me standing out on this lagoon. It's like standing on a water bed, only that's not water underneath the cover. Joking aside, Tom's crew and ours had to manage the cover very carefully - methane is highly combustible (obviously) and dangerous to work around. The life expectancy on a cover like this is 20-30 years, so Tom's still has a fair bit of life in it, and I'm excited to see what he'll do next. For perspective, this lagoon is over an acre in size.
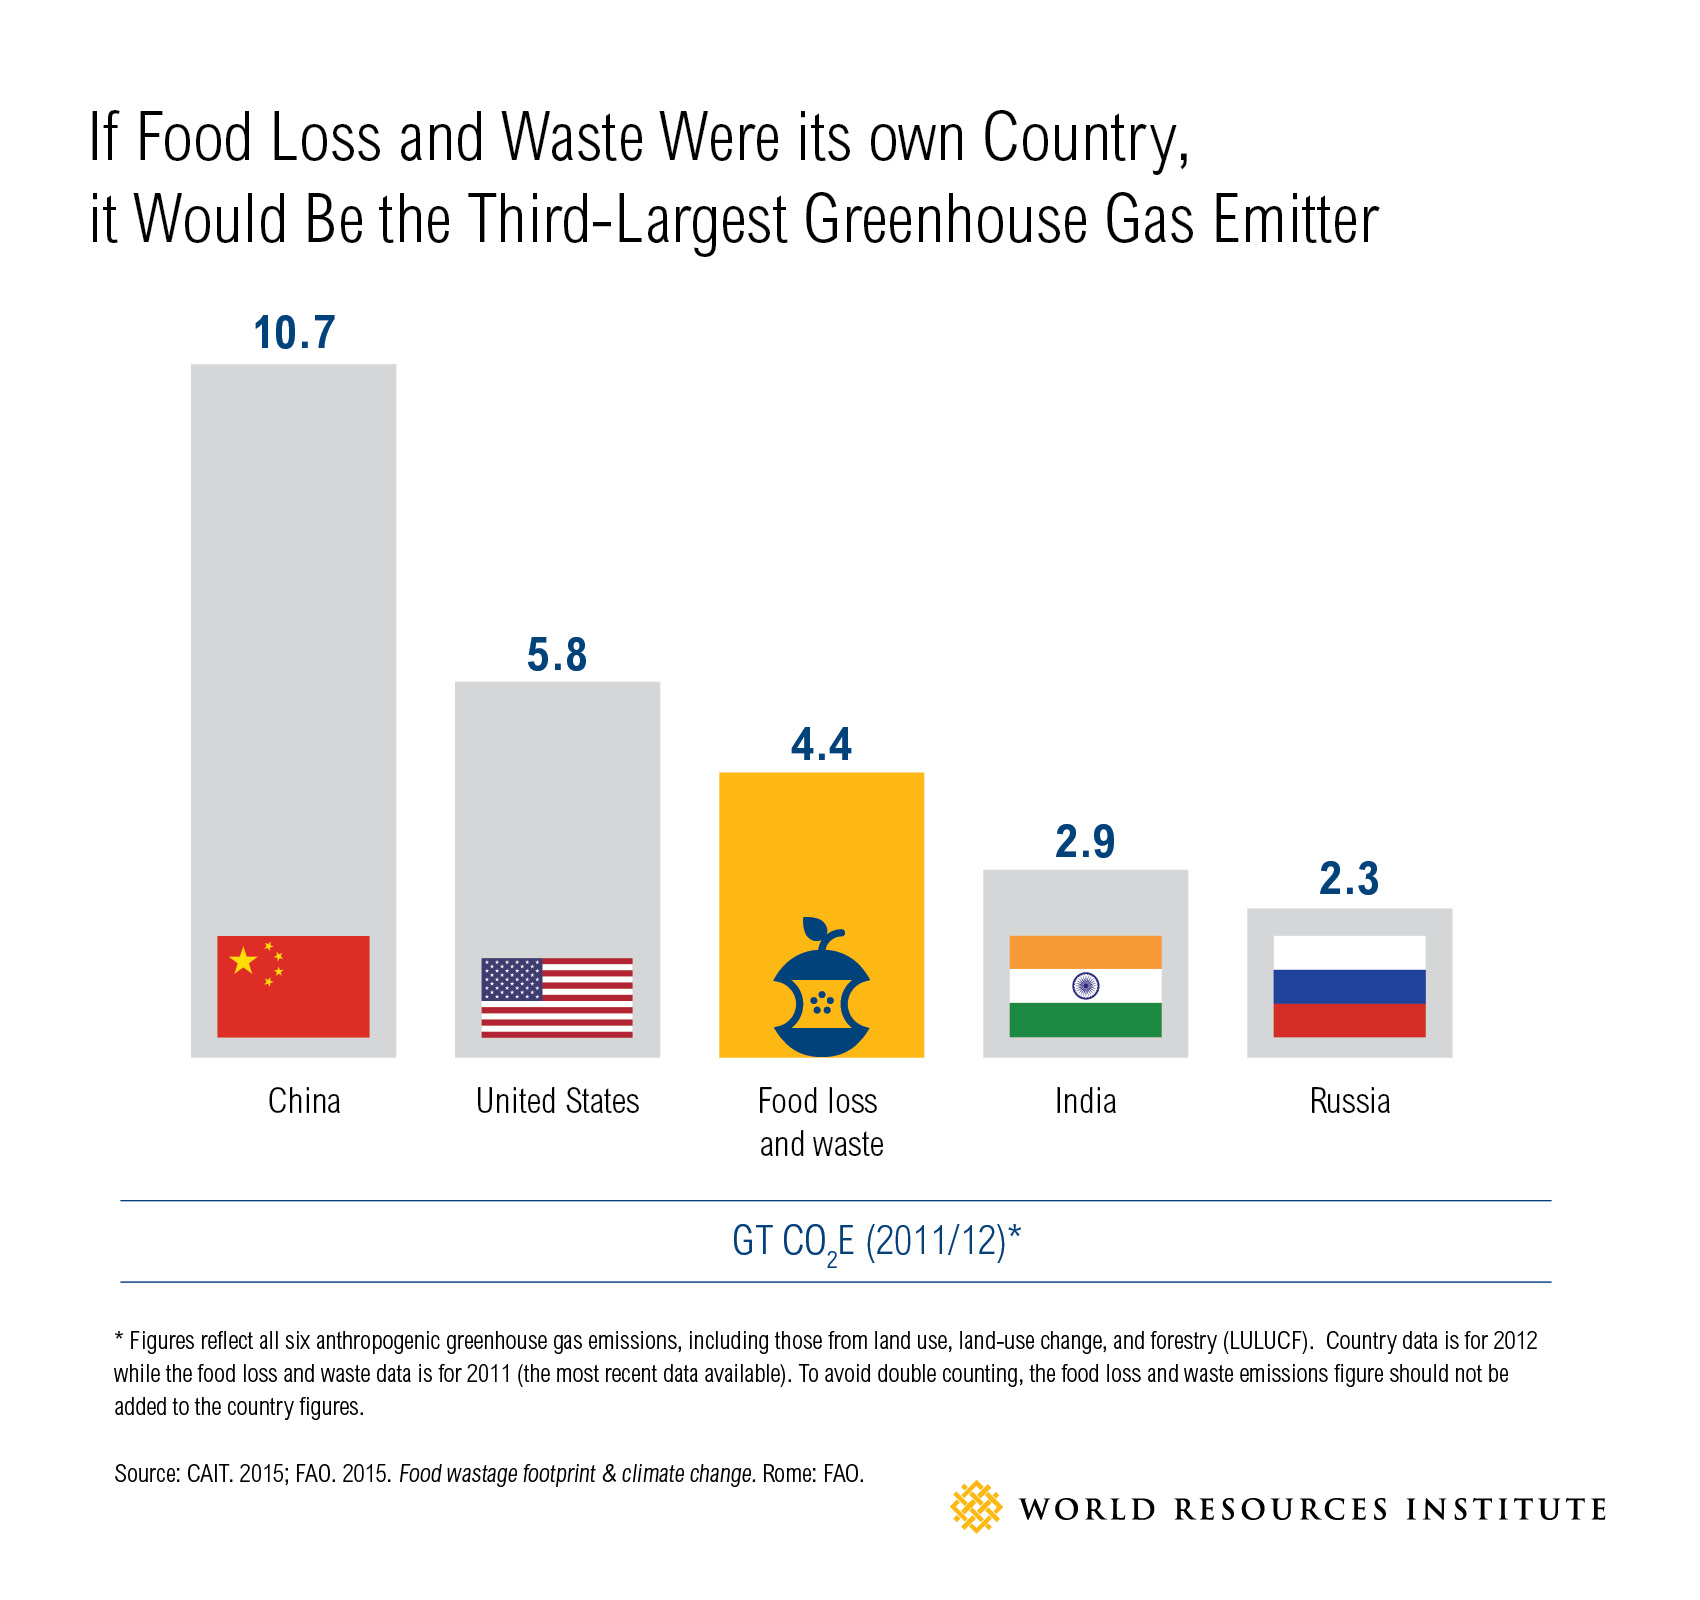
Food Waste Emissions
We're choosing to look at emissions from food waste within the context of agriculture this lesson (though waste is also covered in Lesson 3), but ultimately, this is one that's hard to really pinpoint to a specific sector because it touches so many sectors. From land use, livestock, transportation, energy, and water - anytime we throw away food, we're throwing away all the embodied emissions in its production, harvest, processing, and transport to reach us. We could talk about food waste at very specific scales, but for our purposes in this lesson, we're going to think about food waste a bit more generally. It could be occurring during production, on its way to the grocery store, at the retail outlets, or in our own refrigerators (insert hand-raising emoji).
We don't hear much about food waste in the context of climate change, but it's really a sleeping giant. Take a look.
Land Use
Land use and land cover change affect our overall greenhouse gas emissions profile because some types of land use do a great job of pulling carbon out of the atmosphere and storing it away while other types of land use have just the opposite effect. Understanding how are decisions related to land use fit into the overall emissions profile helps us make informed decisions.
Just how big of a factor is land use? Let's take a look.
As the FA 2019 semester began, fires raged (and continue to rage) across the Amazon. While this problem is inherently complicated and tangled up in the politics of the region, it's also one highly relevant to the human dimensions of climate change. Obviously, fires burn more in dry seasons. This region isn't particularly dry right now (compared to recent years at the same time) and yet more fires are burning. This is due at least in part to intentionally set fires to clear the land for agriculture. As we're learning in this lesson, agricultural land isn't as effective at sequestering carbon, and of course agriculture carries with it its own set of emissions. Additionally, the Amazon rainforest is one of the most biodiverse regions in the world, and while that might not feel directly connected to climate change. It's often the case that we see the human dimensions of climate change in the news throughout the course of our semester together, so I thought it was worth talking a bit specifically about the wildfires in the Amazon burning right now and how that relates to our changing climate (both cause and consequence). Here are some useful resources about the situation if you're interested (though they are not required reading for the course):
- Media Reaction: Amazon Fires and Climate Change [47] (Carbon Brief, August 27, 2019)
- How Amazon Forest Loss May Affect Water - and Climate - Far Away [48] (National Geographic, August 27, 2019)
- Amazon Fires Could Accelerate Global Warming and Cause Lasting Harm to a Cradle of Biodiversity [49] (The Washington Post, August 22, 2019)
During the FA 2020 semester, we had several students enrolled in the course impacted by the fires burning across the western US.
Waste - there is no 'away' when we throw things away
Let's take a quick look at the emissions from our waste sector. Generally, we can break these down into four categories for direct emissions from waste:
- municipal landfills (81.9%)
- solid waste combustion (8.7%)
- industrial landfills (7.7%)
- wastewater treatment (1.8%)
Remember, these are just direct emissions from waste - so what you don't see captured here are the emissions from hauling waste to landfills, or collecting it from your front yard or the dumpster behind your apartment. Those are indirect emissions.
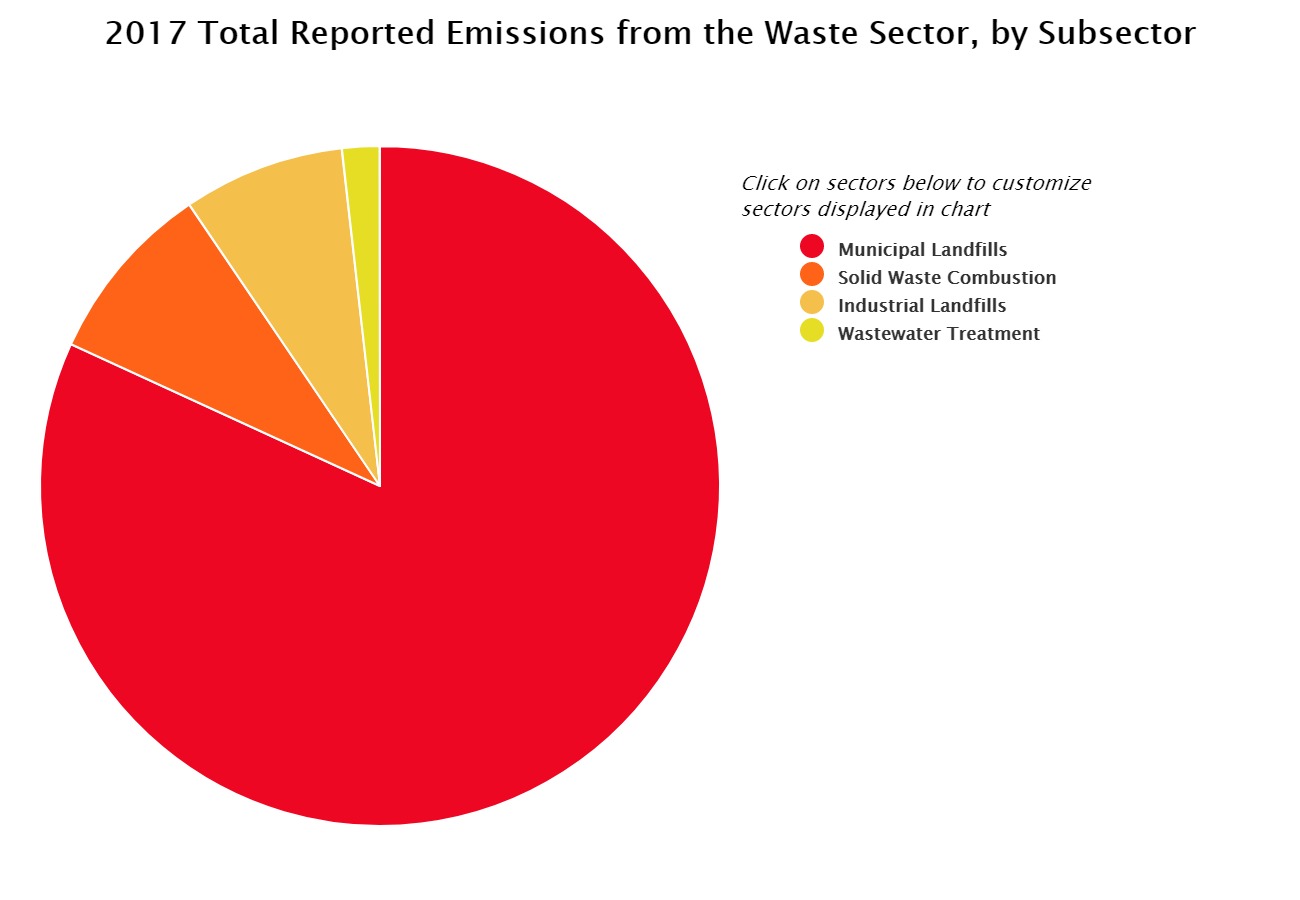
Since municipal landfills represent such an enormous piece of the waste sector pie, let's focus on what that looks like (so we can start thinking about what we might be able to do about it).
When we send our trash to the landfill, there's a fair bit of organic matter in the mix - things like food waste and yard waste. This organic matter will decompose anaerobically and release methane. Much like the lagoon covers we just talked about earlier in this lesson, there are a few options for what we can do to minimize those emissions. We can flare the gas, or the landfill can harness the gas and either use it on site or sell it back to the grid. But beyond that, we can work do divert that organic matter from ever reaching the landfill in the first place. Composting food waste and yard waste is a great place to start! Does your community offer organic waste collection or dropoff? You should check it out! Perhaps you can put your organics out for collection so even if you're not an aspiring backyard composter (I'm not), you can help keep it out of the landfill.
Take a close look at the biggest culprit of methane emissions from landfills on this bar graph from the Methane Landfill Initiative. This is 2010 data, so perhaps China is catching up to the US a bit, but for this snapshot in time, landfill emissions in the US were almost 3x that of the next closest country.
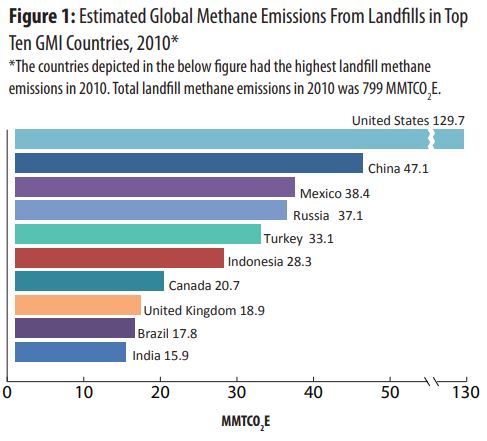
| Country | MMTCO2E |
|---|---|
| United States | 129.7 |
| China | 47.1 |
| Mexico | 38.4 |
| Russia | 37.1 |
| Turkey | 33.1 |
| Indonesia | 28.3 |
| Canada | 20.7 |
| United Kingdom | 18.9 |
| Brazil | 17.8 |
| India | 15.9 |
In the US, landfills over a certain size (containing 2.5 million metric tons of waste or 2.5 million cubic meters of waste) must capture their gas under Clean Air Act regulations. The EIA estimates that in 2017, about 370 landfills across the country were collecting their gas as part of this regulation (EIA, 2019 [53]). There are additional voluntary projects around the country as part of the Landfill Methane Outreach Program [54].
Summary
This lesson is devoted to understanding the emissions that drive climate change. We've broken them down by sector to try to understand how our actions result in a changing climate (we'll need to know this if we have any hope of doing something to solve it!). As you consider these emissions sectors, also think about the proximate causes [55] and driving forces [56] contributing to the emissions patterns. What do you see?
- Energy demand and consumption are growing rapidly, especially in many of the most heavily populated and underdeveloped areas of the globe. You saw that so-called clean coal technologies still produce huge quantities of GHGs and that natural gas generates significantly fewer GHGs, but that only non-fossil fuel technologies emit negligible amounts of GHGs. The energy sector contributes to climate change through power production and industrial processes. Because this sector contributes more GHGs to the atmosphere than any other, it's important for us to understand it thoroughly (as we'll see later this semester - it'll represent some of our biggest opportunities for turning this around).
- Transportation is a major and growing contributor to global GHG emissions. Road transport is the fastest-growing portion of this sector because rapidly increasing numbers of the world's population are becoming sufficiently affluent to afford cars and light trucks. Although it seems to have saturated its market potential, the United States is still the biggest contributor to global emissions from transportation, which is really no surprise when we consider the cultural values promoting the freedom of individual car ownership, the layout of our cities, and the relatively limited availability of affordable, reliable public transportation options.
- Agriculture is energy- and land-intensive, and this varies of course based on the type of crop or livestock being produced. There are direct emissions associated with livestock and crop production (ventilation in the barns, fuel for tractors, etc.) and there are indirect emissions (energy to produce animal feed or crop fertilizers).
- Various types of land use sequester carbon (some more efficiently than others), so this is a consideration for us as we think about land use change on a global scale. What type of land sequesters carbon the most? Forests! Agricultural soils also sequester carbon.
- Waste - even when we've discarded something, its emissions story is not over. Landfills produce a significant amount of greenhouse gas emissions (mostly methane) from the decomposition of organic matter like our food waste and yard waste.
Reminder - Complete all of the Lesson 2 tasks!
You have reached the end of Lesson 2! Double-check the lesson assignments in the corresponding lesson module in Canvas to make sure you have completed all of the tasks listed there.