Transportation
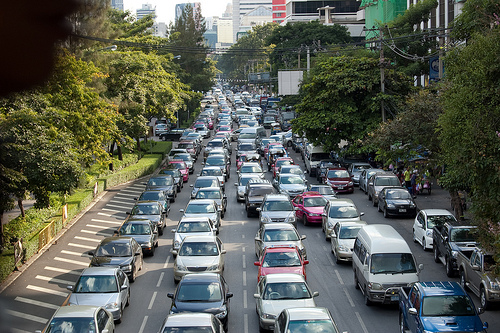
Transportation is a fundamental activity causing climate change. The transport sector includes air, sea, rail, road, and off-road transport and depends on petroleum for 95 percent of its energy. Consequently, it produces 23 percent of the energy-based GHGs, with 75 percent of those GHGs coming from road transport. Moreover, GHG emissions from this sector are the fastest-growing of all emissions. It is imperative that society figures out ways to reduce emissions from transport ––especially road transport –– in the near future.
Escalation of Global Transport Emissions
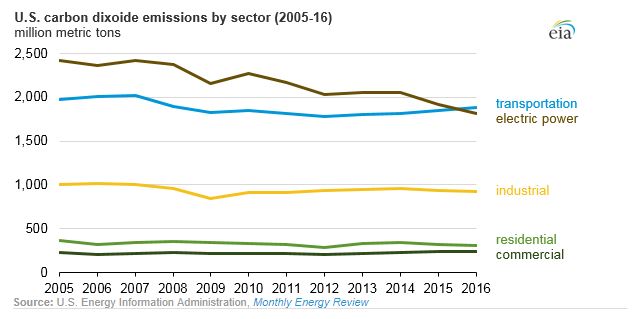
Transportation emissions have historically been the second-biggest sector for most countries (or other geographic scales of measurement), coming in only behind stationary energy sources. But, as the energy sector makes consistent strides in efficiency, these scales are tilting. Look at 2016 in the next image. Transportation emissions overtake emissions from electric power generation.
- Want to read more about this? Check out Yale Environment 360's Transportation Replaces Power in US as Top Source of CO2 Emissions [4] from December 2017.
CO2 emissions from historical and projected energy consumption by the transportation sector in the next image shows a five-fold increase in emissions between 1970 and 2050. Emissions growth from sea transport is relatively small, whereas air and road transport increases are bigger with the highest growth rates projected for air transport. However, despite the higher growth rates, road transport still maintains the vast majority of transportation-related emissions and therefore represents the biggest opportunities for reductions.
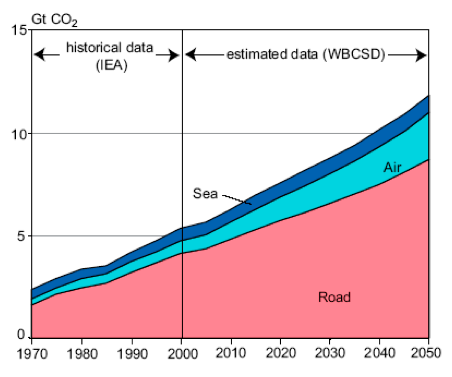
The image is a line chart described in text below. Numbers are approximate
- Road Sector
- Historical data from IEA (1970 - 2000), increase from 1.5 Gt CO2 to 4.5 Gt CO2
- Estimated data from (WBCSD) (2000 - 2050), increase from 4.5 Gt CO2 to 8 Gt CO2
- Air Sector
- Historical data from IEA (1970 - 2000), increase from 1.75 Gt CO2 to 4.75 Gt CO2
- Estimated data from (WBCSD) (2000 - 2050), increase from 4.75 Gt CO2 to 11 Gt CO2
- Sea Sector
- Historical data from IEA (1970 - 2000), increase from 2 Gt CO2 to 5.25 Gt CO2
- Estimated data from (WBCSD) (2000 - 2050), increase from 5.25 Gt CO2 to 12 Gt CO2
The US EIA finds that energy-related CO2 emissions in the transportation sector will remain relatively constant after 2030 because of little change in the carbon intensity of transportation fuels (EIA Annual Energy Outlook 2017 [7]).
- But what about the rapidly developing economies of the world?
Projections of energy consumption (Figure 5.3) suggest that China will not be alone in its dash to institute private car ownership. Experts project that energy consumed for transport will more than double between 2000 and 2050. The strongest growth is expected to take place in the air, freight trucks, and light-duty vehicles (LDVs), which includes cars, pickup trucks, minivans, and sport utility vehicles (SUVs). That growth will be greatest in the developing countries, especially China, India, other areas of Asia, and Latin America. Note that this projection drastically underestimated the growth in China during the first decade of the millennium.
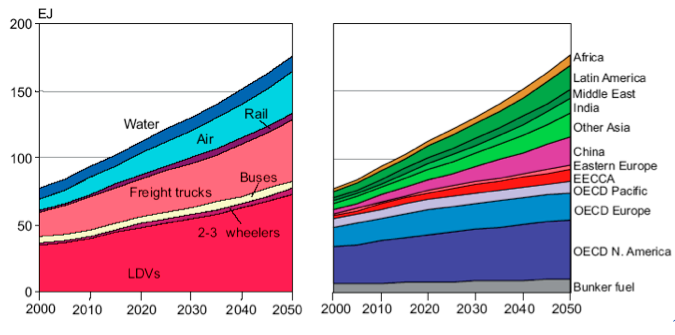
Focusing on LDVs in the next image, projections for the total stock see a doubling of LDVs in the 2020s and tripling of this vehicle type by mid-century. The least growth is projected to take place in developed countries, while robust increases are expected in developing countries. The biggest increases are projected for China, but those increases are happening now, so growth may be slower for that country later in the century.
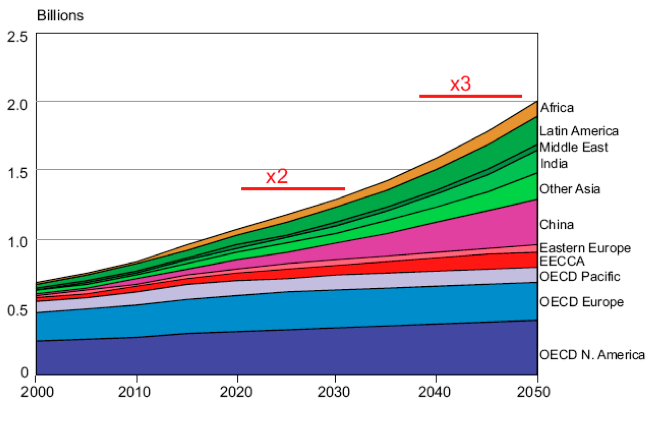
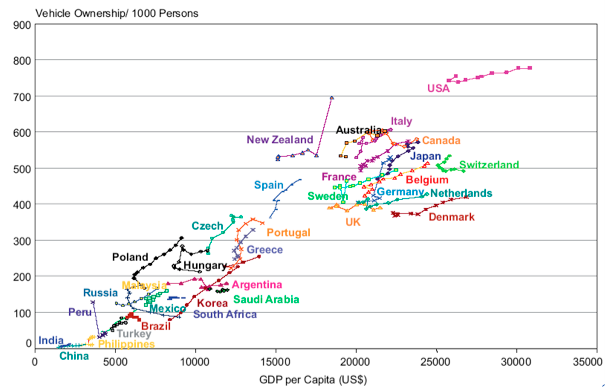
Vehicle ownership is a function of per capita income: as income goes up, rates of car ownership increase (Figure 5.5). The wealthiest major country –– the United States –– has much higher ownership rates than any other nation. Vehicle ownership is still very high among the next richest countries, essentially Canada, western and northern Europe, Japan, Australia, and New Zealand. Next comes southern and eastern Europe and Korea, followed by other developing countries around the world.
The take-home message from this series of graphs is that global energy consumption and GHG emissions from transport are increasing rapidly and are expected to continue grow significantly in the future. The largest subsector responsible for this growth is personal vehicles, which is projected to grow strongly over the coming decades as nations and their people emerge from poverty and are able to afford ownership.
The material for this section comes from Kahn Ribeiro, S., S. Kobayashi, M. Beuthe, J. Gasca, D. Greene, D. S. Lee, Y. Muromachi, P. J. Newton, S. Plotkin, D. Sperling, R. Wit, P. J. Zhou, 2007: Transport and its infrastructure. In Climate Change 2007: Mitigation. Contribution of Working Group III to the Fourth Assessment Report of the Intergovernmental Panel on Climate Change, B. Metz, O.R. Davidson, P.R. Bosch, R. Dave, L.A. Meyer (eds.), Cambridge University Press, Cambridge and New York.
US Transportation Emissions
Given car ownership rates for the U.S., transportation emissions are a major concern in this country. Transportation is responsible for 29 percent of the nation’s emissions as demonstrated in the next image. This sector is the fastest growing, accounting for almost half (48 percent) of the net increase in U.S. emissions since 1990. This rapid growth and sizeable portion of the overall emissions profile also means that there is ample opportunity for reductions.
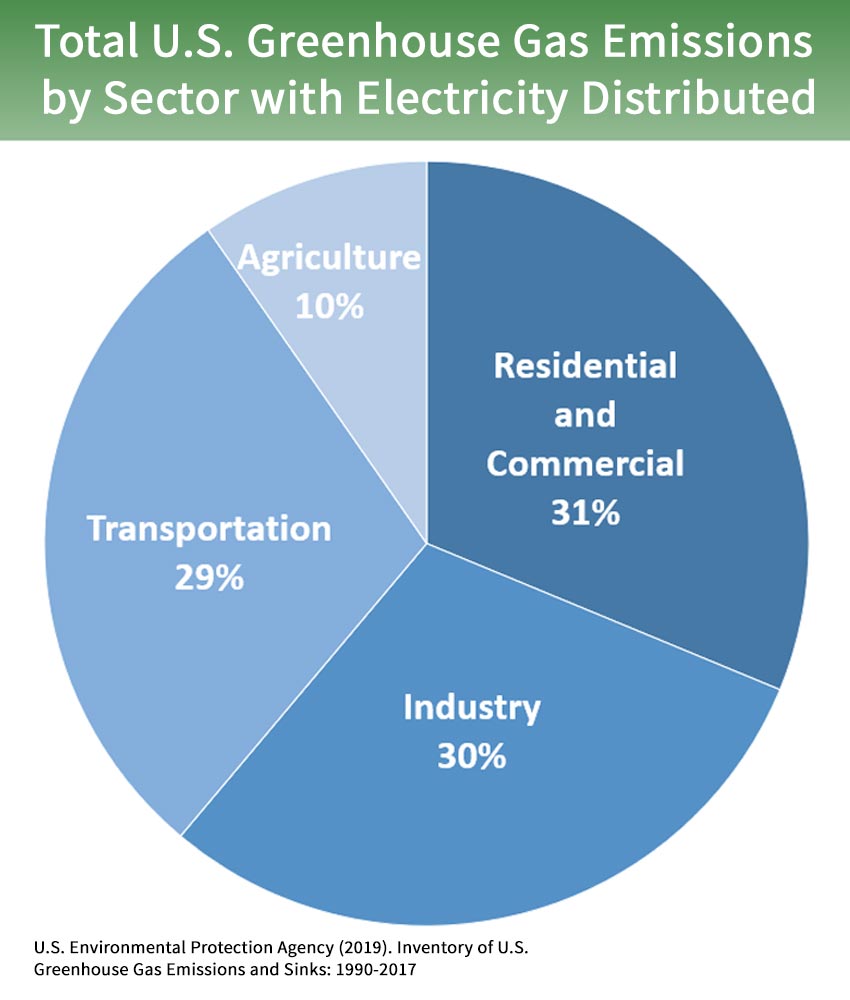
The image is a pie chart described in a table below
| Sector Producing GHG | Percentage |
|---|---|
| Residential and Commercial Electricity | 31% |
| Transportation | 29% |
| Industry | 30% |
| Agriculture | 10% |
Subsectors of Transportation Emissions
Let's break the US transportation sector down in more detail to get a better look at where these emissions originate:
- Light-duty vehicles - those are the passenger cars, trucks, and SUVs we all drive. Want to know more about what that really looks like? Check out EPA's GHG Emissions from a Typical Passenger Vehicle [9].
- Medium and heavy-duty trucks - construction vehicles and tractor-trailers and the sort fall into this category.
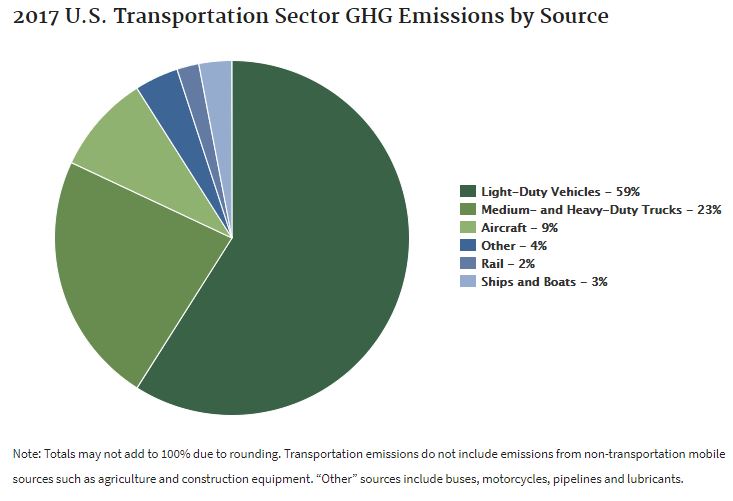
The image is a pie chart described in a four tables below.
| Type of Vehicle | Percentage of total transportation greenhouse emissions |
|---|---|
| Light-Duty Vehicles | 59% |
| Medium- and Heavy-Duty Trucks | 23% |
| Aircraft | 9% |
| Other (buses, motorcycles, pipelines, and lubricants) | 4% |
| Rail | 2% |
| Ships and Boats | 3% |
Global Transportation Emissions
According to the EPA [12], 95% of the world's transportation energy comes from fossil fuels. Ninety five percent! (That's higher than I expected, how about you?) This is predominantly comprised of gasoline and diesel for on-road use.
As global demand for personal transport goes up (World Economic Forum, 2016 [13]), we'll need to think creatively about how to reduce emissions while accommodating an increasingly mobile global population.
How do we handle twice as many cars worldwide in 2040 while also seeking to aggressively reduce global GHG emissions?
Reducing energy intensity and switching to low/no carbon fuel sources are just a few of the ways we might be able to achieve those goals. Check out some of the proposed solutions outlined in Project Drawdown's Transport Sector Summary [14].
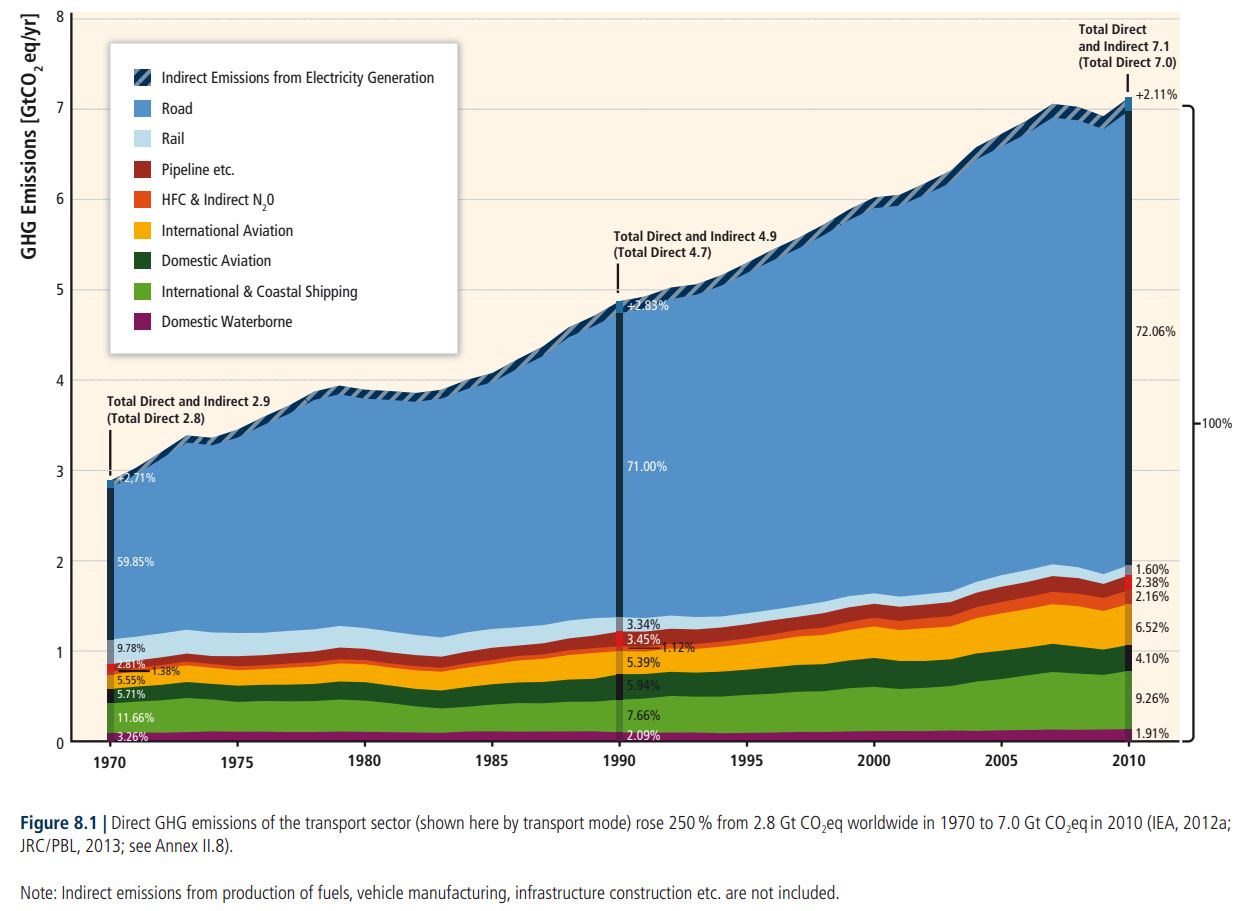
| Year |
Total Direct/Indirect (GTCO2 eq/yr) |
Total Direct (GTCO2 eq/yr) |
|---|---|---|
| 1970 | 2.9 | 2.8 |
| 1990 | 4.9 | 4.7 |
| 2010 | 7.1 | 7.0 |
| Year | Indirect | Road | Rail | Pipeline | HFC & Indirect N20 | International aviation | Domestic Aviation | International and Costal Shipping | Domestic Waterborn |
|---|---|---|---|---|---|---|---|---|---|
| 1970 | 2.71% | 59.85% | 9.78% | 2.81% | 1.38% | 5.55% | 5.71% | 11.66% | 3.26% |
| 1990 | 2.83% | 71.00% | 3.34% | 3.45% | 1.12% | 5.39% | 5.94% | 7.66% | 2.09% |
| 2010 | 2.11% | 72.06% | 1.60% | 2.38% | 2.16% | 6.52% | 4.10% | 9.26% | 1.91% |
The two takeaways from this graph are (1) transportation emissions have more than doubled since 1970 and are expected to continue increasing and (2) the vast majority of those emissions come from on-road sources (light duty vehicles and medium-heavy duty vehicles).
Are Electric Vehicles Really More Environmentally Friendly?
People often wonder, "But is an electric car really a better bet for the climate?" After all, we have to plug them in to charge them, and in many cases that electricity is generated with fossil fuels. And what about hybrid cars? Where do they stack up?
The video below from the Union of Concerned Scientists compares an average passenger car with a traditional internal combustion engine to that of an electric passenger car with an 84 mile range to answer this question. Take a look.
PRESENTER: Here's a question. How much cleaner are battery-electric cars compared to gasoline-powered cars? To find out, the Union of Concerned Scientists studied the total global warming emissions of each vehicle throughout every stage of its life, from manufacturing to driving to disposal. And there's a big difference.
Both cars start out on the assembly line with similar parts made of raw materials like steel and aluminum. For a gasoline car, this manufacturing and assembling stage generates about 7 tons of emissions. Battery-electric cars, meanwhile, are powered by-- you guessed it-- a large battery. This requires more energy and materials to produce for an 84-mile range battery-electric car, bringing its emissions tally up to roughly 8 tons.
But what happens when they hit the road? Gas-powered cars produced pollution with every gallon of gas they burn with even more emissions coming from extracting, refining, and transporting the fuel to gas stations. Electric cars, on the other hand, run on electricity, which can be much cleaner than gasoline depending on how the electricity is made.
2/3 of Americans live in regions where charging an electric car produces fewer global warming emissions than driving even a 50-mile per gallon gasoline car. By the end of their lives, the average gas car will rack up 57 tons of global warming emissions compared to 28 tons for a battery-electric car.
Disposing and recycling each car adds less than 1 ton of emissions. And remember that electric car battery? It can be recycled or reused. In the final tally, an 84-mile range battery-electric car cuts global warming emissions by more than 50% compared with a similar sized gas-powered car, making up for the batteries manufacturing emissions within one year of driving.
And as the country adds more and more renewable sources of electricity, driving electric will get even better. So there you have it straight from the engineers at the Union of Concerned Scientists. Electric cars-- clean and getting cleaner.
For more analysis of the charging emissions from electric vehicles, check out:
- Charging an Electric Vehicle is Far Cleaner Than Driving on Gasoline Everywhere in America [16] (Silvio Marcacci, 2018)
- Climate Explained: The Environmental Footprint of Electric Versus Fossil Cars [17] (Hasan and Chapman, 2019) - this is a nice summary broken down by phase - manufacturing, use, and recycling
The Department of Energy offers this handy tool [18]for consumers who want to understand the relative emissions if they buy (and charge) an EV where they live based on the fuel sources for electricity in their state.
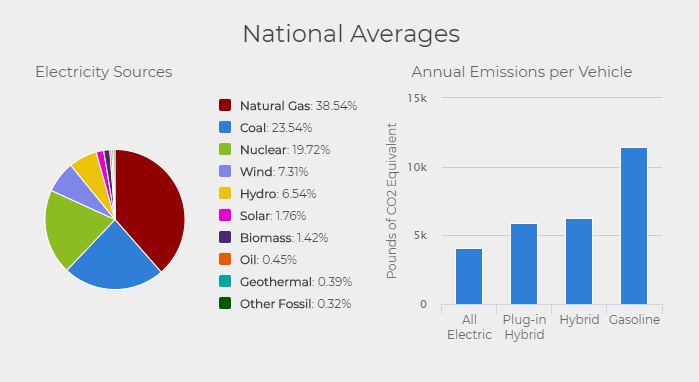
| Source | Percentage |
|---|---|
| Natural Gas | 38.54 |
| Coal | 23.54 |
| Nuclear | 19.72 |
| Wind | 7.31 |
| Hydro | 6.54 |
| Solar | 1.72 |
| Biomass | 1.42 |
| Oil | 0.45 |
| Geothermal | 0.39 |
| Other Fossil Fuels | 0.32 |
| Type | Thousands of Pounds of CO2 Equivalent |
|---|---|
| All electric | 4 |
| Plug-in hybrid | 6 |
| Hybrid | 7 |
| Gasoline | 12 |