Lessons
Lesson 1: The Nature of the GIS Design Problem
The term "Wicked problem" is a phrase used to describe a problem that is difficult to solve because of incomplete, contradictory, and changing requirements that are often difficult to recognize. Moreover, because of complex interdependencies, the effort to solve one aspect of a wicked problem may reveal or create other problems.
Lesson Learning Objectives:
- Recognize the nature of the design problem
- Understand the goals of the course
- Understand the course syllabus
Questions?
If you have any questions now or at any point during this lesson, please feel free to post them to the Threaded Discussion Forum. (That forum can be accessed at any time by clicking on the Communicate tab, above, and then scrolling down to the Discussion Forum section.)
Now, let's begin Lesson 1...
Checklist
To finish this lesson, you must complete the activities listed below. You may find it useful to print this page out first so that you can follow along with the directions.
Steps to Completing Lesson 1
| Step | Activity | Access/Directions |
|---|---|---|
| 1 | Read the lesson Overview and Checklist. | You are in the Lesson 1 online content now. The Overview page is previous to this page, and you are on the Checklist page right now. |
| 2 |
There are three different styles of reading that are referred to in the lessons:
|
|
| 3 | View the Lesson Introduction. | You are in the Lesson 1 online content now. Click on the "Next Page" link to access the Lecture/Discussion. |
| 4 |
Geospatial Think-Piece (Template) [2] |
Using Word (or a word processing program compatible with Microsoft® Word): identify and briefly discuss (<200 words) a "wicked problem" that has some geospatial aspect. Name your file Lsn1_YourName.doc, Please turn-in your document the Lesson 1 Dropbox in ANGEL. What is a “Think Piece”? A “think piece” is a form of writing that is less polished than a formal paper or presentation but more fully developed than an entry in a personal journal. Think pieces are written to discover what an individual is thinking about a particular topic. Within this course, the writing of think pieces is a way of helping learners connect with the subject matter. Within this context, think pieces reduce the grading risk associated with an “all or nothing” term paper and allow the instructor to communicate with learners throughout the semester, to see the evolution of thinking, and to suggest resources that can further the learners’ understanding. What does a Think Piece look like? The starting point for a think piece for this course lie in the author’s immediate past experience. Because think pieces are as much a reflection of one’s ideas, there is no standard or uniform format for a think piece. In other words, each of us is writing from personal experience. We are not claiming to be objective not are we offering prescriptive, how-to, formulas or guidelines. |
| 5 | Read lesson Summary. | You are in the Lesson 1 online content now. |
Wicked Problems
Our geospatial infrastructure is well past the initial development for the most part. The easy problems have been addressed. Designing systems to meet our current problems is often more difficult because there is typically no consensus on what the problems are, let alone how to resolve them. In their landmark article, "Dilemmas in a General Theory of Planning" (Policy Sciences, Vol. 4, Elsevier Scientific Publishing Company Inc., Amsterdam, 1973), Horst Rittel and Melvin Webber dubbed these "Wicked Problems."
According to Rittel and Webber, wicked problems have 10 characteristics:
- Wicked problems have no definitive formulation. Formulating the problem and the solution is essentially the same task. Each attempt at creating a solution changes your understanding of the problem.
- Wicked problems have no stopping rule. Since you can't define the problem, it's difficult to tell when it's resolved. The problem-solving process ends when resources are depleted, stakeholders lose interest or political realities change.
- Solutions to wicked problems are not true-or-false, but good-or-bad. Since there are no unambiguous criteria for deciding if the problem is resolved, getting all stakeholders to agree that a resolution is "good enough" can be a challenge.
- There is no immediate or ultimate test of a solution to a wicked problem. Solutions to such problems generate waves of consequences, and it's impossible to know how these waves will eventually play out.
- Every implemented solution to a wicked problem has consequences. Once the Web site is published or the new customer service package goes live, you can't take back what was online or revert to the former customer database.
- Wicked problems don't have a well-described set of potential solutions. Various stakeholders have differing views of acceptable solutions. It's a matter of judgment as to when enough potential solutions have emerged and which should be pursued.
- Each wicked problem is essentially unique. There are no "classes" of solutions that can be applied to a specific case. As Rittel and Webber wrote in "Dilemmas in a General Theory of Planning," "Part of the art of dealing with wicked problems is the art of not knowing too early what type of solution to apply."
- Each wicked problem can be considered a symptom of another problem. A wicked problem is a set of interlocking issues and constraints that change over time, embedded in a dynamic social context.
- The causes of a wicked problem can be explained in numerous ways. There are many stakeholders who will have various and changing ideas about what might be a problem, what might be causing it and how to resolve it.
- The planner (designer) has no right to be wrong. Scientists are expected to formulate hypotheses, which may or may not be supportable by evidence. Designers don't have such a luxury—they're expected to get things right.
Summary and Final Tasks
Wicked projects are rife with conflict in stakeholder requirements and changes in management constraints.What kinds of problems are wicked? Locating a new freeway or homeless shelter are examples. In short, attempting to state the problem is a major problem in itself.
Lesson 2: GIS Basics for System Design
This is an intensive review of GIS basics. This is a lot of information to review and it is a lot like drinking from the firehose: Drink what you can.
Lesson Learning Objectives:
- Review basic GIS concepts and principles.
Questions?
If you have any questions now or at any point during this lesson, please feel free to post them to the Threaded Discussion Forum. (That forum can be accessed at any time by clicking on the Communicate tab, above, and then scrolling down to the Discussion Forum section.)
Now, let's begin Lesson 2...
Checklist
To finish this lesson, you must complete the activities listed below. You may find it useful to print this page out first so that you can follow along with the directions.
Steps to Completing Lesson 2
| Step | Activity | Access/Directions |
|---|---|---|
| 1 | Read the lesson Overview and Checklist. | You are in the Lesson 2 online content now. The Overview page is previous to this page, and you are on the Checklist page right now. |
| 2 | GIS Bootcamp, Part I [3] | There are three different styles of reading that are referred to in the lessons:
|
| 3 | View the Lesson Introduction. | You are in the Lesson 2 online content now. Click on the "Next Page" link to access the Lecture/Discussion. |
| 4 |
Complete the Online Quiz. |
Please complete the Lesson 2 Quiz in ANGEL. (That Quiz can be accessed at any time by going to the ANGEL link in the Resources menu and then selecting the Lessons tab and then scrolling down to the Lesson Quizzes and Examination section.) |
| 5 | Read lesson Summary. | You are in the Lesson 2 online content now. |
What is GIS?
The following is directly quoted from a 3/01/10 GIS Lounge post by Caitlin Dempsey [5] (What is GIS? [6]).
This is probably the most asked question posed to those in the Geographic Information Systems (GIS) field and is probably the hardest to answer in a succinct and clear manner.
GIS is a technological field that incorporates geographical features with tabular data in order to map, analyze, and assess real-world problems. The key word to this technology is Geography – this means that the data (or at least some portion of the data) is spatial, in other words, data that is in some way referenced to locations on the earth. Coupled with this data is usually tabular data known as attribute data. Attribute data can be generally defined as additional information about each of the spatial features. An example of this would be schools. The actual location of the schools is the spatial data. Additional data such as the school name, level of education taught, student capacity would make up the attribute data. It is the partnership of these two data types that enables GIS to be such an effective problem solving tool through spatial analysis.
GIS operates on many levels. On the most basic level, GIS is used as computer cartography, i.e. mapping. The real power in GIS is through using spatial and statistical methods to analyze attribute and geographic information. The end result of the analysis can be derivative information, interpolated information or prioritized information.
Other quotes to answer “What is GIS?”
“In the strictest sense, a GIS is a computer system capable of assembling, storing, manipulating, and displaying geographically referenced information, i.e. data identified according to their locations. Practitioners also regard the total GIS as including operating personnel and the data that go into the system.” USGS [7]
A geographic information system (GIS) is a computer-based tool for mapping and analyzing things that exist and events that happen on earth. GIS technology integrates common database operations such as query and statistical analysis with the unique visualization and geographic analysis benefits offered by maps.” ESRI [8]
“GIS is an integrated system of computer hardware, software, and trained personnel linking topographic, demographic, utility, facility, image and other resource data that is geographically referenced.” NASA [9]GIS has already affected most of us in some way without us even realizing it. If you’ve ever using an Internet mapping program to find directions, congratulations, you’ve personally used GIS. The new supermarket chain on the corner was probably located using GIS to determine the most effective place to meet customer demand.
Components of GIS
The next step in understanding GIS is to look at each component of GIS and how they work together. These components are:
Hardware [10]
Hardware comprises the equipment needed to support the many activities of GIS ranging from data collection to data analysis. The central piece of equipment is the workstation, which runs the GIS software and is the attachment point for ancillary equipment. Data collection efforts can also require the use of a digitizer for conversion of hard copy data to digital data and a GPS data logger to collect data in the field. The use of handheld field technology is also becoming an important data collection tool in GIS. With the advent of web-enabled GIS, web servers have also become an important piece of equipment for GIS.
Software [11]
Different software packages are important for GIS. Central to this is the GIS application package. Such software is essential for creating, editing and analyzing spatial and attribute data, therefore these packages contain a myriad of GIS functions inherent to them. Extensions or add-ons are software that extends the capabilities of the GIS software package. Component GIS software is the opposite of application software. Component [12] GIS seeks to build software applications that meet a specific purpose and thus are limited in their spatial analysis capabilities. Utilities are stand-alone programs that perform a specific function. For example, a file format utility that converts from on type of GIS file to another. There is also web GIS [13] software that helps serve data through Internet browsers.
Data [14]
Data [15] is the core of any GIS. There are two primary types of data that are used in GIS. A geodatabase is a database that is in some way referenced to locations on the earth. Geodatabases are grouped into two different types: vector and raster. Vector data is spatial data represented as points, lines and polygons. Raster data is cell-based data such as aerial imagery and digital elevation models. Coupled with this data is usually data known as attribute data. Attribute data generally defined as additional information about each spatial feature housed in tabular format. Documentation of GIS datasets is known as metadata [16]. Metadata contains such information as the coordinate system, when the data was created, when it was last updated, who created it and how to contact them and definitions for any of the code attribute data.
People
Well-trained people knowledgeable in spatial analysis and skilled in using GIS software are essential to the GIS process. There are three factors to the people component: education, career path, and networking. The right education is key; taking the right combination of classes [17]. Selecting the right type of GIS job is important. A person highly skilled in GIS analysis should not seek a job [18] as a GIS developer if they haven’t taken the necessary programming classes. Finally, continuous networking with other GIS professionals is essential for the exchange of ideas as well as a support community.
Summary and Final Tasks
This was a rapid reintroduction to the basics of GIS which form a foundation for future geospatial system design.
Lesson 3: Spatial and Geospatial Thinking in System Design
Geospatial thinking is key to designing GIS functionality. Here, geospatial thinking is spatial thinking related to the earth. Spatial thinking includes processes that support exploration and understanding. An expert spatial thinker visualizes relations, imagines transformations from one scale to another, mentally rotates an object to look at its other sides, creates a new viewing angle or perspective, and remembers images in places and spaces. Spatial thinking also allows us to externalize these operations by creating representations such as a map.
Lesson Learning Objectives:
- Review basic concept of spatial and geospatial thinking.
Questions?
If you have any questions now or at any point during this lesson, please feel free to post them to the Threaded Discussion Forum. (That forum can be accessed at any time by clicking on the Communicate tab, above, and then scrolling down to the Discussion Forum section.)
Now, let's begin Lesson 3...
Checklist
To finish this lesson, you must complete the activities listed below. You may find it useful to print this page out first so that you can follow along with the directions.
Steps to Completing Lesson 3
| Step | Activity | Access/Directions |
|---|---|---|
| 1 | Read the lesson Overview and Checklist. | You are in the Lesson 3 online content now. The Overview page is previous to this page, and you are on the Checklist page right now. |
| 2 |
Online content (Read) |
There are three different styles of reading that are referred to in the lessons:
|
| 3 | View the Lesson Introduction. | You are in the Lesson 3 online content now. Click on the "Next Page" link to access the Lecture/Discussion. |
| 4 |
Geospatial Think-Piece (Template) [2] |
Using Word (or a word processing program compatible with Microsoft® Word) and the Geospatial Thinking Aid provided in this lesson, briefly describe (< 500 Words): the (1) behavioral, (2) physical, and(3) cognitive geospatial aspects of a "town and gown" problem such a noise code violation. Town and gown are two distinct communities of a university town; "town" being the non-academic population and "gown" metonymically being the university community. Name your file Lsn3_YourName.doc, Please turn-in your document the Lesson 3 Dropbox in ANGEL. |
| 5 | Read lesson Summary. | You are in the Lesson 3 online content now. |
Spatial Thinking
Spatial thinking begins with the ability to use space as a framework. An object can be specified relative to the observer, to the environment, to its own intrinsic structure, or to other objects in the environment. Each instance requires the adoption of specific spatial frames of reference or context. The process of interpretation begins with data which is generally context-free numbers, text, or symbols. Information is derived from data by implying some degree of selection, organization, and preparation for a purpose — in other words, the data is placed into a spatial context. For example, the elevation at a specific location is an example of data; however, the elevation only has meaning when placed in context of sea level. The spatial context is critical because it is the space the data is in that ultimately determines its interpretation. There are three spatial contexts within which we can make the data-to-information transition; these include behavioral spaces, physical spaces, and cognitive spaces. In all cases, space provides an interpretive context that gives meaning to the data.
- Behavioral (life) space is the four-dimensional space-time where spatial thinking is a means of coming to grips with the spatial relations between self and objects in the physical environment. This is cognition in space and involves decisions about the world in which we live. It is exemplified by navigation and the actions that we perform in space.
- Physical space is also built on the four-dimensional world of space-time, but focuses on a scientific understanding of the nature, structure and function of phenomena. This is cognition about space and involves thinking about the ways in which the "world" works. An example might be how an earthquake creates a tsunami.
- Cognitive (Intellectual) space is in relationship to concepts and objects. The nature of the space is defined by the particular problem. This is cognition with space and involves thinking with or through the medium of space in the abstract. An example might be the territorial dispute between two ethnic groups.
Learning to think spatially is to consider objects in terms of their context. This is to say, the object's location in behavioral space, physical space, or cognitive space, to question why objects are located where they are, and to visualize relationships between and among these objects. The key skills of spatial thinking include the ability to:
- Understand the context. The significance of context was discussed above, but it is important to say that if the data upon which the decision is based are placed into the wrong spatial context, for example, physical space rather than cognitive space, it is likely the analysis will be flawed.
- Recognize spatial schemes (patterns and shapes). The successful spatial thinker needs to retain an image of the simple figure in mind, and look for it by suppressing objects irrelevant to a task at hand. This ability allows a geospatial analyst to identify patterns of significance in a map, such as an airfield.
- Recall previously observed objects. The ability to recall an array of objects that was previously seen is called object location memory.
- Integrate observation-based learning. Synthesizing separately made observations into an integrated whole. The expert analyst moves through the data, gathering information from separately observed objects and views, and integrates this information into a coherent mental image of the area.
- Mental rotating an object and envisioning scenes from different viewpoints. The ability to imagine and coordinate views from different perspectives has been identified by Piaget and Inhelder (1967) as one of the major instances of projective spatial concepts. Mental-rotation ability or perspective-taking ability could be relevant to those analysis tasks that involve envisioning what an object, such as a building, would look like if seen from another position.
Golledge’s First-Order Primitives constitute a broad list of cognitive schemes for geospatial analysis (R. G. Golledge "Do People Understand Spatial Concepts: The case of First-Order Primitives", Theories and Models of Spatio-Temporal Reasoning in Geographic Space. Pisa: Springer-Verlag, 1992). The schemas are:
- Location. This includes a descriptor with identity, magnitude, location and time. An additional cognitive component might be familiarity. Occurrences are often called environmental cues, nodes, landmarks, or reference points.
- Spatial distributions. Distributions have a pattern, a density, and an internal measure of spatial variance, heterogeneity or dispersion; occurrences in distributions also have characteristics such as proximity, similarity, order, and dominance.
- Regions. Areas of space in which either single or multiple features occur with specified frequency (uniform regions) or over which a single feature dominates.
- Hierarchies. Multiple levels or nested levels of phenomena including features.
- Networks. Linked features having characteristics, connectivity, centrality, diameter, and density. Networks may also include physical links such as transportation systems, or nonvisual systems.
- Spatial associations. Associations include spatial autocorrelation, distance decay, and contiguities. Examples of these associations include interaction frequencies or geographic and areal associations. For example, the coincidence of features within specific areas (i.e., squirrels are normally near trees) is a spatial association.
- Surfaces. There are generalizations of discrete phenomena, including densities of occurrence, flows over space and through time (as in the spatial diffusion of information or phenomena).
Geospatial Reasoning
Reasoning
The three well known reasoning processes trace the development of analytic beliefs along different paths. Inductive reasoning reveals “that something is probably true," deductive reasoning demonstrates “that something is necessarily true.” It is generally accepted that both are limited: inductive reasoning leads to multiple, equally likely solutions, and deductive reasoning is subject to error. Therefore, a third aid to judgment, abductive reasoning, showing “that something is plausibly true,” is used to offset the limitations of the others. While analysts who employ all three guides to sound judgment stand to be the most persuasive, fallacious reasoning or mischaracterization of rules, cases, or results in any of the three can affect reasoning using the others.
- Inductive reasoning, moving from the specific case to the general rule, suggests many possible outcomes, or the range of what might happen in the future. However, inductive reasoning lacks a means to distinguish among outcomes. An analyst has no way of knowing whether a solution is correct.
- Deductive reasoning, on the other hand, moves from the general to the specific. Deductive reasoning becomes essential for predictions. Based on past perceptions, certain facts indicate specific outcomes. If, for example, troops are deployed to the border, communications are increased, and leadership is in defensive bunkers, then war is imminent. However, if leadership remains in the public eye, then these preparations indicate that an exercise is imminent.
- Abductive reasoning reveals plausible outcomes. Abductive reasoning is the process of generating the best explanation for a set of observations. When actions defy accurate interpretation through existing paradigms, abductive reasoning generates novel means of explanation. In the case of predictions, an abductive process presents an “assessment of probabilities.” Although abduction provides no guarantee that the analyst has chosen the correct hypothesis, the probative force of the accompanying argument indicates that the most likely hypothesis is known and that actionable intelligence is being developed.
Geospatial Reasoning
It is not too far of a stretch to say that people who are drawn to the discipline of geography have minds accustomed to assembling information into three-dimensional mental schemas. We construct schemas in our mind, rotate them, and view them from many angles. Furthermore, the experienced geospatial professional imagines spatial schemas influenced in the fourth dimension, time. We mentally replay time series of the schema. So easy is the geospatial professional’s ability to assemble multidimensional models that the expert does it with incomplete data. We mentally fill in gaps, making an intuitive leap toward a working schema with barely enough data to perceive even the most rudimentary spatial patterns. This is a sophisticated form of geospatial reasoning. Expertise increases with experience because as we come across additional schemas, our mind continuously expands to accommodate them. This might be called spatial awareness. Being a visual-spatial learner, instead of feeling daunted by the abundance and complexity of data, we find pleasure in recognizing the patterns. Are we crazy? No, this is what is called a visual-spatial mind. Some also call these people right brain thinkers.
The concept of right brain and left brain thinking developed from the research of psychobiologist Roger W. Sperry. Sperry discovered that the human brain has two different ways of thinking. The right brain is visual and processes information in an intuitive and simultaneous way, looking first at the whole picture then the details. The left brain is verbal and processes information in an analytical and sequential way, looking first at the pieces then putting them together to get the whole. Some individuals are more whole-brained and equally adept at both modes.
The qualities of the Visual-Spatial person are well documented but not well known (Visual-Spatial Resource [20]). Visual-spatial thinkers are individuals who think in pictures rather than in words. They have a different brain organization than sequential thinkers. They are whole-part thinkers who think in terms of the big picture first before they examine the details. They are non-sequential, which means that they do not think and learn in the step-by-step manner. They arrive at correct solutions without taking steps. They may have difficulty with easy tasks, but show a unique ability with difficult, complex tasks. They are systems thinkers who can orchestrate large amounts of information from different domains, but they often miss the details.
Sarah Andrews [21] likens some contrasting thought processes to a cog railway. Data must be in a set sequence in order to process it through a workflow. In order to answer a given question, the thinker needs information fed to him in order. He will apply a standardized method towards arriving at a pragmatic answer, check his results, and move on to the next question. In order to move comfortably through this routine, he requires that a rigid set of rules be in place. This is compared with the geospatial analyst who grabs information in whatever order, and instead of crunching down a straight-line, formulaic route toward an answer, makes an intuitive, mental leap toward the simultaneous perception of a group of possible answers. The answers may overlap, but none are perfect. In response to this ambiguity, the geospatial analyst develops a risk assessment, chooses the best working answer from this group, and proceeds to improve the estimate by gathering further data. Unlike, the engineer, whose formulaic approach requires that the unquestioned authority of the formula exist in order to proceed, the geospatial intelligence professional questions all authority, be it in the form of a human or acquired data.
Geospatial Thinking Aid
Geospatial thinking is the essence of designing GIS functionality. Geospatial thinking is spatial thinking related to the earth. The following geospatial thinking process is simply offered as a structure to make sure that key concepts are not overlooked. Nothing here is likely new to the skilled geospatial thinker, but it is purely a reminder of the actions that can help the designer think about geospatial problems.
Action 1: Identify the entity or event the system is being designed to address or manipulate. This entity can be natural and human phenomena relative to the problem.
Action 2: Think about the entity or event in the space contexts. The definition of the spatial presence of an entity is the prerequisite for spatial thinking. The spatial context is critical because it is the space the entity is in that ultimately determines its interpretation. There are three spatial contexts within which we can make the data-to-information transition. These are:
- behavioral space
- physical space
- cognitive space
In all cases, space provides an interpretive context that gives meaning.
Action 3: Place the phenomena in the context of the earth. When making sense about the space (Gershmehl and Gershmehl, 2006) the spatial thinker first asks the fundamental spatial questions:
- Where is this place?
- What is at this place?
- How is this place linked to other places?
Action 4: Examine the qualities of the objects or events. The spatial thinking then proceeds to examine the places by asking the following questions:
- How are places similar or different?
- What effect(s) does a feature have on nearby areas?
- What nearby places are similar to each other and can be grouped together?
- Where does this place fit in a hierarchy of nested areas?
- Is the change between places abrupt, gradual, or irregular?
- What distant places have similar situations and therefore may have similar conditions?
- Are there clusters, strings, rings, waves, other non-random arrangements of features?
- Do features tend to occur together (have similar spatial patterns)?
Return to Action 2 if you have not explored all of the space contexts. Note the qualities for each space.
Action 5: Recalling the results of Action 4, examine the space-time relationship between the objects and/or event. Last, the comparisons are placed into the context of space and time. Spatial thinking goes beyond a simple identification of locations. It involves comparing locations, considering the influence of nearby features, grouping regions and hierarchies, and identifying distant places that have similar conditions. It is also the consideration of change, movement and diffusion through time and place. This is spatiotemporal thinking which asks the questions:
- How do spatial features change through time?
- How do conditions change at a place over time?
- What is the change in position of something over time?
- What is the change in extent of something over time?
- Where are places that do not seem to follow an observed “rule”?
Note the time-space relationships.
Summary and Final Tasks
The geospatial professional is a “knowledge worker” or “symbol analyst” (a term used by the U.S. Department of Labor) who carries out multi-step operations, manipulates abstract and complex symbols and ideas, acquires new information efficiently, and remains flexible enough to recognize change. Successful knowledge work requires intensive study, practice, and commitment. Professionalism in the area calls for a broad experience and understanding of the basic concepts of the profession. The individual who is only interested in technology, important as it is, is therefore not fully professional. Nor is the technical expert ipso facto a professional.
Lesson 4: What is Design?
My experience has shown that many people find it hard to make their design ideas precise. They are willing to express their ideas in loose, general terms, but are unwilling to express them with the precision needed to make them into patterns. Above all, they are unwilling to express them as abstract spatial relations among well-defined spatial parts. I have also found that people aren't always very good at it; it is hard to do..... If you can't draw a diagram of it, it isn't a pattern. If you think you have a pattern, you must be able to draw a diagram of it. This is a crude, but vital rule. A pattern defines a field of spatial relations, and it must always be possible to draw a diagram for every pattern. In the diagram, each part will appear as a labeled or colored zone, and the layout of the parts expresses the relation which the pattern specifies. If you can't draw it, it isn't a pattern.
Christopher Alexander (1979) in The Timeless Way of Building.
One anxiety inherent in the design methods is the hierarchical nature of complexity. This anxiety moves in two directions, escalation and infinite regression. I will use a story, "The Warning of the Doorknob," to illustrate the principle of escalation.
This has been my experience in Washington when I had money to give away. If I gave a contract to a designer and said, "The doorknob to my office doesn't have much imagination, much design content. Will you design me a new doorknob?" He would say "Yes," and after we establish a price he goes away. A week later he comes back and says, "Mr. Eberhard, I have been thinking about that doorknob. First we ought to ask ourselves whether a doorknob is the best way of opening and closing a door." I say, "Fine, I believe in imagination, go to it." He comes back later and says, "You know, I have been thinking about your problem, and the only reason you want a doorknob is you presume you want a door to your office. Are you sure that a door is the best way of controlling egress, exit, and privacy?" "No, I'm not sure at all." "Well, I want to worry about that problem." He comes back a week later and says, "The only reason we have to worry about the aperture problem is that you insist on having four walls around your office. Are you sure that is the best way of organizing this space for the kind of work you do as a bureaucrat?" I say, "No, I'm not sure at all." Well, this escalates until (and this has literally happened in two contracts, although not exactly through this process) our physical designer comes back with a very serious face. "Mr. Eberhard, we have to decide whether capitalistic democracy is the best way to organize our country before I can possibly attack your problem."
On the other hand is the problem of infinite regression. If this man faced with the design of the doorknob had said, "Wait. Before I worry about the doorknob, I want to study the shape of man's hand and what a man is capable of doing with it," I would say, "Fine." He would come back and say, "The more I thought about it, there's a fit problem. What I want to study first is how metal is formed, what the technologies are for making things with metal in order that I can know what the real parameters are for fitting the hand." "Fine." But then he says, "You know, I have been looking at metal forming and it all depends on metallurgical properties. I really want to spend three or four months looking at metallurgy so that I can understand the problem better." "Fine." After three months he will come back and say, "Mr. Eberhard, the more I look at metallurgy, the more I realize that it is the atomic structure that's really at the heart of this problem." And so, our physical designer is in atomic physics from the doorknob. That is one of our anxieties, the hierarchical nature of complexity.
Eberhard (1970) quoted in Teague & Pidgeon (1985) and Yourdon (1989).
Spatial system capabilities and reach have undergone rapid changes in recent years, moving from networks of expensive high-end workstations to "clouds" of inexpensive desktop personal computers. During this time, organizations have addressed data quality and redundancy issues by moving from project-level systems to enterprise-wide solutions and service-oriented architecture. These developments have dramatically increased the accessibility and efficiency of spatial systems. However, the design and implementation of such systems and their support within organizations often does not meet the promise and expectation. Investigations into the problems provide evidence of human and political issues that lead to the success or failure of such systems. This includes social forces such as fear of losing control, autonomy, independence, complexity, or power.
There are many available design approaches to increase the possibility of meeting expectations. These include participatory design, soft-systems methodology, rapid prototyping, human-computer interaction, and computer-supported cooperative work. However, each of these approaches requires "people" skill to successfully understand and articulate the goals of the design process, evaluate the work environment, and effectively interact with the people in it. The key interactions with people in design might be described as negotiations. There is an implied assumption, however, that all participants in the negotiations are expecting to benefit from a successful outcome, which may not always be the case in organizational contexts.
Lesson Learning Objectives:
- Recognize design as a human experience concerned with our ability to mold the environment to suit our needs
- Understand the uniqueness of spatial system analysis and design
- Understand the role of the leader in spatial system design
Questions?
If you have any questions now or at any point during this lesson, please feel free to post them to the Threaded Discussion Forum. (That forum can be accessed at any time by clicking on the Communicate tab, above, and then scrolling down to the Discussion Forum section.)
Now, let's begin Lesson 1...
Checklist
To finish this lesson, you must complete the activities listed below. You may find it useful to print this page out first so that you can follow along with the directions.
| Step | Activity | Access/Directions |
|---|---|---|
| 1 | Read the lesson Overview and Checklist. | You are in the Lesson 4 online content now. The Overview page is previous to this page, and you are on the Checklist page right now. |
| 2 | Goodchild, Finding the Mainstream (Skim) [22] Norman, Cautious Cars and Cantankerous Kitchens: How Machines Take Control (Skim) [23] Senge, The Leader’s New Work (Skim) [24] Online Content [25] |
There are three different styles of reading that are referred to in the lessons:
|
| 3 | View the Lesson Introduction. | You are in the Lesson 4 online content now. Click on the "Next Page" link to access the Lecture/Discussion. |
| 4 | Geospatial Think-Piece (Template) [2] |
Using Word (or a word processing program compatible with Microsoft®), identify and briefly discuss (<200 words): one fundamental concept in the Norman or Senge reading and describe how you would apply the concept in the design of a geospatial system. The Goodchild reading provides helpful ideas about spatial systems in general. Name your file Lsn4_YourName.doc, Please turn-in your document the Lesson 4 Dropbox in ANGEL. What is a “Think Piece”? A “think piece” is a form of writing that is less polished than a formal paper or presentation but more fully developed than an entry in a personal journal. Think pieces are written to discover what an individual is thinking about a particular topic. Within this course, the writing of think pieces is a way of helping learners connect with the subject matter. Within this context, think pieces reduce the grading risk associated with an “all or nothing” term paper and allow the instructor to communicate with learners throughout the semester, to see the evolution of thinking, and to suggest resources that can further the learners’ understanding. What does a Think Piece look like? The starting point for a think piece for this course lie in the author’s immediate past experience. Because think pieces are as much a reflection of one’s ideas, there is no standard or uniform format for a think piece. In other words, each of us is writing from personal experience. We are not claiming to be objective not are we offering prescriptive, how-to, formulas or guidelines. |
| 5 | Read lesson Summary. | You are in the Lesson 4 online content now. |
Overview of Design
The word design can be used as both a noun and a verb. As a verb, "to design" refers to the process of originating and developing a plan for a product, structure, system, or component. As a noun, "a design" is used for either the final plan or the result of implementing that plan. Here's the bottom line; there’s probably no one definition everyone will agree on since design can be:
- A discipline that explores the dialogue between products, people, and contexts.
- A process that defines a solution to help people achieve their goals.
- An artifact produced as the result of solution definition.
Implementing a spatial system will result in modifications to existing roles and responsibilities; it may require a modification of responsibilities within the organization, resulting in a new organizational philosophy, new lines of communication, and a realignment of the business process. Before initiating an implementation you need to understand the existing organizational framework, how it operates and how this new technology will change the structure. You will also need to create a governance framework under which the impacts of change can be managed within the existing Information Technology architecture. When viewed in a positive light, the design process is an opportunity to tune-up virtually every job and function performed within an enterprise and deliver the following benefits:
- Improved operations. One of the basic precepts of efficiency is managing the process, not the function. When this holistic approach is applied, the entire process—rather than individual functionality—is analyzed. This results in improved operational efficiency.
- Integration of functions. Integrating essential functions streamlines the whole process and has the potential to improve the organization's ability to accomplish essential tasks. Integration of functions encourages cross talk and helps to identify and correct deficiencies prior to funds investment.
- Improved effectiveness. An integrated process provides management the opportunity to view and analyze multiple data sets and to base decisions on the most accurate information available.
- Improved communication. Organizational communications are improved by allowing stakeholders to synthesize and summarize data in an easily understood form (e.g., maps).
- Consistent information. Redundant information is reduced, resulting in more consistent information for decision makers.
- Reduced costs. One-time data entry, multiple access to the data reduces the cost of data maintenance. Better decisions based on accurate information reduce the costs. Data sharing facilitates efficient use of limited resources.
- Continuity of information. An integrated process preserves the integrity of data even when key personnel rotate.
Despite the power of spatial technology, the success or failure depends almost entirely on the designers of the system. This was not necessarily appreciated when GISs first came on the scene and many of these systems failed. Some did not work at all as analytical tools; others produced faulty results. Still others tended to stop functioning altogether. These systems did not survive because the designers:
- Failed to use a tractable design methodology. Failure to use a design methodology leads to the omission of crucial steps.
- Failed to plan. Spending time on designing a GIS is frequently viewed as inefficient use of time and efforts. As such, organizations do not engage in a formal planning process. Instead they bypass the process of establishing the high-level conceptual issues, and jump directly to construction.
- Failed to breed an enterprise perspective. People support actions that they find rational based on their immediate circumstances and needs. These may not necessarily be the broader objectives of the organization. The complexity of GIS, combined with its broad organizational scope causes such parochial views and creates inefficiencies.
- Lacked a common vision and goals. There is a tendency to move straight to tangible hardware and software details without connecting the outcome of the effort to a shared organizational vision. Thus, poor or nonexistent project vision will result in poor goal definition.
- Had poorly defined requirements. The delivered GIS should be a reflection of the system functionality requirements. If the requirements are poorly defined, the system will not meet the organization's needs.
- Failed to anticipate the complexity. Development efforts should be begun with the understanding that they will be completed in an established period of time in order to meet a need.
- Lacked deliverables. Tangible results early in a project are essential. Results foster support, morale, and interest.
- Were isolation. The design process should be an effort of the entire organization, from the managers to the users. Each level provides valuable and crucial insights, of which only members of that level are aware. Omitting prospective users from the design process results in a lack of ownership.
- Had poor communications. GIS projects require sound communication since such efforts involve individuals with differing backgrounds and perspectives, from executives to managers to end users. In an enterprise environment, each party has a role in the design process and the effort must be coordinated among the different parties so that all are moving toward a common goal.
- Lacked of knowledge. GIS has complex underlying technical and conceptual elements not common to other information system technologies. This complexity is usually underestimated and the costs and benefits not well understood.
- Failed to account for organizational dynamics. Regardless of how well a GIS is technically designed and the program managed, problems will still occur due to organizational issues that are not obvious at the outset. These dynamics include resistance to change within the organization and power struggles. These are always more difficult to solve than technical issues.
It should be clear that when we talk about spatial systems or GIS design, we are not necessarily talking about the actual software design, although this is an important part of the process. When implementing spatial systems across an organization's enterprise, designers will have critical non-technical, as well as some technical issues to consider. The key to addressing the non-technical issues is governance, and the key to effective governance is appropriate control. Project governance is also key to aligning spatial technology resources to business goals and providing value. Governance is needed that will not hinder project delivery while addressing the architecture requirements across the enterprise. Organizations that do not implement effective governance will be unable to achieve architecture integration and will have no effective means to manage business goals.
Philosophical Outlooks to Design
The designer's (or organization's) philosophy and management perspective may dictate a specific approach. Some approaches guide the overall goal of the design while other approaches guide the tendencies of the designer. Typically, a combination of approaches may be used if they don't conflict.
In a large perspective, Dino Dini (see Dino Dini at wikipedia.org [26]) suggests that design can be defined as "the management of constraints" and he identifies two kinds of constraints, negotiable and non-negotiable. Taking this view, the first step in the design is the identification, classification, and selection of constraints. Design then proceeds from here by manipulating design variables so as to satisfy the non-negotiable constraints and optimizing those which are negotiable. It is possible for a set of non-negotiable constraints to be in conflict resulting in a design with no solution; in this case, the non-negotiable constraints must be revised. Some common approaches that address the management of constraints include:
- User-centered design, which focuses on the needs, wants, and limitations of the end user of the designed artifact.
- Use-centered design, which focuses on the goals and tasks associated with the use of the artifact, rather than focusing on the end user.
- KISS principle, (Keep it Simple, Stupid), which strives to eliminate unnecessary complications.
- There is more than one way to do it (TMTOWTDI), a philosophy to allow multiple methods of doing the same thing.
- Seat-of-the-pants (my favorite), which is doing things in an ad hoc manner.
Assuming one takes a more structured path to design (i.e., not the seat-of-the-pants approach), design Methods, the actual steps one might take, typically include:
- Exploring possibilities and constraints by focusing critical thinking skills to research and define problem spaces for existing products or services—or the creation of new categories.
- Redefining the specifications of design solutions which can lead to better guidelines for traditional design activities (graphic, industrial, architectural, etc.).
- Managing the process of exploring, defining, creating artifacts continually over time.
- Prototyping possible solutions that incrementally or significantly improve the situation.
The old phrase of "Well, back to the old drawing board" teaches us that designs can fail and redesign is often necessary. Something that is redesigned requires a different process than something that is designed for the first time. A redesign often includes an evaluation of the existent design and the discovery of redesign needs. These findings often drive the redesign process.
The Designer as a Leader
The Designer as a Leader*
In the world of enterprise-wide spatial systems, there is no checklist to work through that will guarantee a designer is thinking in a way that will capture the big picture or identify root causes of difficult design problems. However, experience shows that focus needs to be on the vision of what the system will accomplish, not on the processes and procedures of a bureaucratic entity. This means that designers need to think in terms of behavior of the whole system, in preference to thinking about component parts. They need to think in term of strategic objectives, and to measure success in terms of achieving strategic objectives. Here activity is not a measure of success; busyness and excessive focus on the short term interfere with system development. Designers must see what is actually happening, not just what they want to see happen. Designers of large enterprise spatial system need to think of themselves as leaders of a living system that attunes the mind to the important aspects of organizational behavior and allows one to understand what keeps the system alive in terms of ongoing development and support. I will suggest that there is a framework of three key areas that can be identified:
1. Thinking
Albert Einstein argued that "problems cannot be solved at the same level of awareness that created them.” The coming of the Industrial Age with complex processes and ever-larger organizations led to the development of management as a profession. In the Information Age of the present day, spatial organizations are increasingly networked, and leadership has evolved the task-focused "matrix organization". With spatial organizations, our challenge is to facilitate teaming techniques, and to evolve another level of leadership. The assignment of oversight to outside and high level panels, boards, or ad hoc groups expands the insight and impact of the leader --- it raises problems above the level in which they arise. Additionally, this high level and “parallel thinking” provides unconstrained thought unbound by routine processes, and introduces different perspectives, ensures objective analysis, and enhances the credibility of results.
With “parallel thinking” all parties are thinking in parallel in the same direction. There is co-operative and coordinated thinking. The direction itself can be changed in order to give a full scan of the situation. But at every moment each thinker is thinking in parallel with all the other thinkers. There does not have to be agreement. Statements or thoughts which are contradictory are not argued out but laid down in parallel. In the final stage the way forward is 'designed' from the parallel thoughts that have been laid out.
2. Vision and Climate
A Leader with a clear vision creates a climate that encourages and recognizes viable innovation when it emerges, while allowing the freedom to make mistakes. Throughout the system’s life-cycle, an effective leader maintains focus on the behavior system as a whole, and on the roles it plays and functions it performs in terms of the overall purpose of the system. Few would disagree, in principle, that the effective leader should see not only the parts, but also the big picture. But, why is maintaining a consistent vision so difficult in spatial system development? One reason is because many leaders are so immersed in the myriad day-to-day nuts-and-bolts technology management details it is easy for them to lose sight of the bigger picture. We all know the saying that “Fighting off the alligators takes precedence over draining the swamp.” The problem of “busyness” often compounds the problem of beating off the alligators since it seems as though officials work excessive hours as a matter of pride. This crisis management combined with a culture of busyness has resulted in decision makers who favor short-term view to long-term problems without taking time to think about the actual impact of the fix or the emergent patterns.
A vision needs to be tempered with reality. In his book Why Smart Executives Fail, Sydney Finkelstein examined some of the world’s most notorious business failures. His analysis indicated that in almost every case, the failures were not attributable to stupidity or lack of attention. On the contrary, the leaders were exceptionally bright, energetic, and deeply involved in the operation of their businesses. Up to the point of massive corporate failure, they were all extremely successful. In most instances, the executives failed to see or accept what was actually happening. In some cases, they were blinded by their own prior successes; in other cases, they inexplicably held tenaciously to a vision despite plenty of evidence that the chosen strategic direction was ill-advised.
Mistakes are learning tools that are inevitable in an era of change and advancement, and leadership needs to create an environment whereadmitting to a mistake is a sign of strength. The paradigm that mistakes are bad; they ought to be avoided at all cost; and never admit a mistake needs to be changed. The Leader's pragmatic focus on determining what is actually happening serves as a preventative to self-delusional thinking. Seeing and accepting what is really happening is the hardest part of the job. The continuous assessment process, brought about by broad-based governance, is characteristic of systems thinking and is essential in a volatile, rapidly changing environment. It takes time and good habits of critical reflection to engage in this kind of learning, both for individuals and organizations. A systemic approach to learning from failure is more likely to result in effective long-term solutions. While inspired leadership can make a difference under the worst of conditions, we might ask just how heroic we expect our leaders to be on a regular basis. When a system is so obviously stacked against our leaders, there is a moral imperative to change the system.
3. The Whole and the Parts
Effective leaders are systems thinkers. They see things in terms of loops and patterns, and are aided by constant assessment of what is happening and the changing relationships between elements, rather than flow charts and final output. Peter Senge submits, in The Fifth Discipline, that systems thinking provides just the type of discipline and toolset needed to encourage the seeing of “interrelationships rather than things, for seeing patterns of change rather than static ‘snapshots'.” Senge argues that this shift of mind is necessary to deal with the complexities of dynamic social systems. He suggests that we think in terms of feedback loops as a substitute for simple cause-and-effect relationships.
Leadership in Spatial System Design Is Often the Antithesis of Good Management Practice
As I said, there is no checklist to work through that will guarantee a successful spatial system. However, there is a basic concept that can be very helpful when considering the development of a spatial system. This is to focus on the broader purpose for which the system is being created, NOT to focus on the processes and procedures of a bureaucratic entity. A recent Wall Street Journal article by Terry Leap, “Keys to Spotting a Flawed CEO-Before It's Too Late,” suggests avoiding leaders “with a fondness for rules and numbers that overshadows or ignores a broader vision.” This is sage advice when building a large enterprise-wide spatial system.
* Much of this is drawn from an article I wrote with Dennis Bellafiore and David Arctur about spatial data infrastructure development. Here is a link to the entire article. [28]
Summary and Final Tasks
Design involves finding solutions that fit the user, task, and context of use. Properly designed objects – including software, tools, and web sites --fit their context so well that they are easy to use and beneficial to the user. Building a spatial system is no different and is typically a long and complex process. Much of the challenge of building a spatial system is that it impacts many parts of the enterprise and requires a substantial investment to construct and maintain. Experience has demonstrated that, as we approach the challenge of meeting the demand for the development and management of information systems, a strategic approach is necessary to ensure its success. The approach must be logical, tractable, and documented. It must embrace a vision that reflects the organizational goals and objectives. Importantly, spatial technology is not a hammer looking for a nail. Design is not a solution seeking a problem; it is focused in a problem seeking a spatial solution.
Lesson 5: Capstone Introduction
The capstone assumes you have a basic understanding of geospatial system analysis and design. The objectives of this design problem are to:
- Provide a real-world context around which you can organize your knowledge about geospatial system analysis and design.
- Reinforce prior learning.
- Provide a setting in which new knowledge may be elaborated upon and applied.
Questions?
If you have any questions now or at any point during this lesson, please feel free to post them to the Threaded Discussion Forum. (That forum can be accessed at any time by clicking on the Communicate tab, above, and then scrolling down to the Discussion Forum section.)
Checklist
To finish this lesson, you must complete the activities listed below. You may find it useful to print this page out first so that you can follow along with the directions.
| Step | Activity | Access/Directions |
|---|---|---|
| 1 | Read the lesson Overview and Checklist | You are in the Lesson 5 online content now. The Overview page is previous to this page, and you are on the Checklist page right now. |
| 2 | Online material (Read) Geospatial System Requirements Specification (Scan) [29] |
There are three different styles of reading that are referred to in the lessons:
|
| 3 | Begin Capstone Activity | Complete:
Using Word (or a word processing program compatible with Microsoft® Word), identify your team and briefly discuss (Less than 200 words) your proposed design problem. Name your file Lsn5_TeamName.doc, Please turn-in your document the Lesson 5 Dropbox in ANGEL. |
| 4 | Read lesson Summary | You are in the Lesson 5 online content now. Click on the "Next Page" link to access the Summary. |
Step Activity Access/Directions
1. Read the lesson Overview and Checklist.
You are in the Lesson 5 online content now. The Overview page is previous to this page, and you are on the Checklist page right now.
2. Online material (Read)
Geospatial System Requirements Specification (Scan) [29]
There are three different styles of reading that are referred to in the lessons:
- Scan: Do not deal with all of the content, but search through the material for a specific word (or its synonym) or for another specific purpose, such as finding the answer to a question.
- Skim: To skim, read a page by reading the headings and first sentences of each paragraph or section.
- Read: The purpose of this style is to understand the concepts and arguments that the text contains and it should be preceded by the Skim reading style.
3. Begin Capstone Activity. Complete:
- Task A: Identify the Design Team (include a 1-page résumé for each team member)
- Task B: Develop a Design Problem
Using Word (or a word processing program compatible with Microsoft® Word), identify your team and briefly discuss (Less than 200 words) your proposed design problem.
Name your file Lsn5_TeamName.doc, Please turn-in your document the Lesson 5 Dropbox in ANGEL.
4. Read lesson Summary.
You are in the Lesson 5 online content now. Click on the "Next Page" link to access the Summary.
Task A: Identify the Design Team
Purpose: Task A is to identify and organize your design team.
Deliverable: A list of team members with possible roles. Be certain to identify the team leader.
Background: It can be said that GIS design is a team sport. What does this mean? This is a vision in which design is an enterprise with the focus of collaboration shifting away from coordination of draft products toward regular discussion of design early in the research phase. It is driven in part by the growing complexity and need for multidisciplinary input when developing a design; the need to share information across organizational boundaries; and the need to identify and explore the validity of alternatives. It is enabled by advances in social networking practices. It is important to note that team-based design brings a new set of challenges comparable to the cognitive limitations and pitfalls faced by the individual design. Design and teams have become inseparable because of the:
- complexity of space-time problems;
- requirement for multidisciplinary input;
- need to share more information more quickly;
- growing dispersion of expertise, and;
- need to identify and evaluate the validity of alternative approaches.
A “design team” is a network of individuals devoted to vetting ideas which helps make better geospatial systems. This team is more akin to debating team than a sympathetic support group. An effective team:
- Identifies and shares supporting and contrary information;
- includes subject matter experts to help address key issues;
- develops information that can be used for benchmarking analysis, and;
- develops feedback that benefits problem solving.
Our team should be a rich mix of individuals meeting the following:
- Qualities include:
- Individual thinkers, working in sync, with the combined geospatial skills, technical skills, and domain experience that spans the problem domain.
- A dynamic, likely conflicted team that expresses alternate perspectives, but still has energy and purpose that propels it forward in achieving its purpose.
- Individuals willing and responsible for expressing their perspective.
- The contrast with a group. A group is like a bunch of people on a bus all heading in the same direction driven by the bus driver. People do not talk with each other on the bus. They get on and off as they please. The only commonality is the vehicle.
- Actions of the team:
- demonstrate accountability;
- demonstrate a high order of geospatial awareness;
- involve conflict;
- focus on problem-solving including the geospatial perspective;
- have a formal leader;
- have informal leaders;
- are temporary, and;
- have individual roles that are critical to and subordinate to team goals. "I" is each of the parts that forms the "we" that pull together to make it about the bigger "us."
- Images that fit teams include:
- an aircraft carrier,and;
- a surgical team.
Perform the following: Identify and organize your design team. Include a 1-page résumé for each member.
Task B: Develop a Design Problem
The design problem can be viewed as an active two-way interface between the client requiring the information and the geospatial analyst supplying it. The problem defines the geospatial functionality the designer is seeking. A question that leads to the GIS design process must meet three criteria of:
- At least one plausible design exists with some geospatial aspect.
- Counter-designs are possible.
- The outcomes can be defined sufficiently with respect to the geospatial aspects to allow gather requirements.
Before beginning, ask the following questions:
- Who is the key person for whom the design is being completed?
- Do I understand the problem? (If necessary, clarify this before proceeding)
- What is the most important information to give this client?
- How is the client expected to use this information?
- How much time does the client have?
- What means would convey the information most effectively?
- What is the client’s level of tolerance for technical geospatial specific language? How much detail and what geospatial accuracy does the client expect?
- Would the client expect the design to reach out to other entities within or outside the enterprise?
- To whom, or to what source, might the client turn for alternative views on this topic? What data or analysis might others provide that could influence how the client reacts to what is being designed?
The problem focuses the requirements analysis on the nature of the spatial and temporal patterns the designer is seeking to identify, understand, and/or communicate. Many new geospatial designers struggle to translate the problem into the context of spatial concepts. To overcome this, we stress the importance of understanding the problem and developing a spatial aspects.
What is a sufficient design problem? There are significant differences between a “problem of fact or factoid” and an “design problem.” A factoid seeks a piece of information that would be answered with a corresponding true statement.
In general, a factoid question usually has just one correct answer that can be easily judged for its truthfulness. Answers to factoid are important as elements of requirements but are not to be the focus of a design effort.
In general, a significant design problem has many possibly correct answers that cannot be easily judged for correctness. A design is generally quite flexible in the sense that there is always a strong possibility that we may not arrive at the "right" solution. Thus, a change of analytic strategy, and even the initial expectations of the design, may be warranted. This suggests a solution to a design problem must involve iterative information.
Geospatial Aspects
The Geospatial Aspects follow from the broader problem, and suggest a narrowly focused spectrum of issues. The geospatial requirements contributes to the larger body of requirements of the initial design problem; the spatial aspects might not be be as significant to the stakeholder as those of initial design problem. The development of this involves an active two-way discussion between the client requiring the information and the geospatial professional. The problem must be “analytic” which means four conditions are met:
- It must be at least one spatial quality or relationship to be expressed in the requirements;
- At least one plausible design must address the spatial requirement;
- Counter-designs are possible and the requirements analysis must include an investigation of alternative designs; and
- The requirements must be capable of being defined sufficiently to allow us to design the system.
Summary
Lesson 5 is the first of three lessons in the course capstone experience.
Lesson 6: Building the Team
Checklist
To finish this lesson, you must complete the activities listed below. You may find it useful to print this page so that you can follow along with the directions.
| Step | Activity | Access/Directions |
|---|---|---|
| 1 | Read the lesson Overview and Checklist. | You are in the Lesson 6 online content now. The Overview page is previous to this page, and you are on the Checklist page right now. |
| 2 | Online material (Read) Building the Team [30] |
There are three different styles of reading that are referred to in the lessons:
|
| 3 | Begin Capstone Activity. | Complete:
|
| 4 | Read lesson Summary. | You are in the Lesson 6 online content now. Click on the "Next Page" link to access the Summary. |
Building a Team
Groups and Teams
A group is a collection of individuals who gather and interact for a common purpose. For example, a study group. They gather and usually focus their attention on an activity or common interest. They may or may not have stated goals or rules to govern membership in the group. Being a member of a group probably requires minimal expertise and may or may not be professional in nature. A team is a specialized group. Team members also have a common objective or purpose, but focus on performance and collective improvement. An example would be an emergency medical team. Teams frequently have structure and certain criteria for membership. Teams almost always have stated goals. Team members frequently have an area of expertise and may be professionals.
How Groups and Teams Differ
Teams and groups differ most in their focus on performance and improvement. A team focuses on its collective performance and usually offers members opportunity to improve incrementally over time. Individuals on a team are dependent on one another to achieve their goal. Their performance affects others on the team and its results. Team members take mutual responsibility and are accountable for results. Groups do interact and may work together well, but they usually do not have a requirement for collective and incremental performance. Success in the group is not dependent on how others perform and individuals take responsibility for their own successes. Accountability is usually at the individual level, not the group level. In short, all teams are groups, but not all groups are teams.
Characteristics of Effective Teams
Effective teams don’t succeed by happenstance. They all have certain things in common in addition to their focus on performance and collective improvement. In general, members are clear on the team objective. They are capable and committed to meeting the objective. They work in a trusting, collaborative way to achieve the objective. Those two concepts, trust and commitment, are the glue that holds teams together.
Why Teamwork?
- To improve communication. For teambuilding to be effective everyone must be involved. By developing teamwork students will learn to encourage one another by talking and by listening to each other in order to solve a challenge.
- To learn different roles. By working together in groups natural leaders and followers will emerge. Students put into new activities and into new positions will establish new roles and be able to experience new things.
- To improve risk taking. When students have the support of a group around them they are more willing to take greater risks and to try new things. In short like the saying goes: the greater the risk, the greater the reward. Students will often develop more self confidence when they have the comfort of others behind them.
- To develop a more positive work environment. When students have to work together to solve a common goal it can reinforce current friendships and develop a new respect for others. Teamwork can
Nine Key Attributes of Effective Teams
The structure of any effective team rests on a foundation of trust and commitment. Trust comes from the confidence the members have in you, the leader, and in each other—and from their sense of how much they can rely on you and each other. Commitment is each individual’s motivation and willingness to belong to the team and help achieve the defined goals. Both are equally essential to the team’s effectiveness. The leader's job is to foster these two aspects of the team, ensure they continue to grow, and sustain them in the face of other variables and obstacles during your mission. These nine attributes of effective teams show you where to focus.
- Competence
- Integrity
- Concern for Others
- Communication
- Motivation to Participate
- Perception of Value for Your Team’s Purpose
- Rewards and Recognition
- Opportunity to Learn and Grow
- Positive Environment
Stages of Team Development
Like individuals, teams mature at different rates. But almost every team goes through the following three key stages. Generally, as your teams progress through these stages, members will demonstrate or develop the nine key elements of effective teams.
- Formation. In this stage, the team is fragile. Individuals may not know one another very well yet. Communication among members can be basic and noncontroversial. The team may tend to focus on immediate tasks, and members’ level of trust is medium to high. The team is thinking short term and members’ focus is more on the task at hand than on process improvement (your strategic or longer-term result). But team members may also have conflicting opinions, backgrounds, ethics, and approaches to problems. They may even resist leadership as the team begins to develop.
- Enrichment. During the enrichment stage of team building, personalities may well clash. The team members may tend to lose focus on the task and the process. They may start to focus on
their own needs rather than the team’s. Communication becomes more sophisticated, but can be unproductive and even damaging (e.g. sarcasm, innuendo, teasing). At this stage, the leader must focus on integrity and communication to improve trust. Members will slowly recognize the merits of working together. This is the point when “I” becomes “We.” Team members adopt teamwork methods and processes. - Sustainment. At the sustainment stage, the team has fully matured. Work methods become fine-tuned and a process has emerged for each team member. Communication is candid—members
feel free to share their views and are comfortable doing so. Members feel confident and receive high levels of support from the team. At this point, the leader is able to orchestrate efforts rather than micromanage specific tasks by your team members. Team members operate with minimal direction or supervision, and they take the initiative.
What is Team Building?
Team building can be defined as group cooperative learning to try and solve a challenge.
Important Parts of Team Building
- Perseverance. It is important to understand that success doesn't always come easy. Failure only means the need to try again or to re-think strategies.
- Rules. In team building there must be clear rules that are followed. Whether the rules are for a game or for expected behaviors, they must be set up to promote respect, responsibility, and safety but at the same time they must be open enough to allow for student creativity, exploration, and experimentation.
- Social Development. In Team Building the focus is how the group works together to try and complete the task at hand.
have a long lasting positive influence throughout your classroom in many different areas.
Task A: Identify the Design Team
Purpose: Task A is to identify and organize your design team.
Deliverable: A list of team members with possible roles. Be certain to identify the team leader.
Background: It can be said that GIS design is a team sport. What does this mean? This is a vision in which design is an enterprise with the focus of collaboration shifting away from coordination of draft products toward regular discussion of design early in the research phase. It is driven in part by the growing complexity and need for multidisciplinary input when developing a design; the need to share information across organizational boundaries; and the need to identify and explore the validity of alternatives. It is enabled by advances in social networking practices. It is important to note that team-based design brings a new set of challenges comparable to the cognitive limitations and pitfalls faced by the individual design Design teams have become inseparable because of the:
- complexity of space-time problems;
- requirement for multidisciplinary input;
- need to share more information more quickly;
- growing dispersion of expertise, and;
- need to identify and evaluate the validity of alternative models.
A “design team” is a network of individuals devoted to vetting ideas which helps make better geospatial decisions. This team is more akin to debating team than a sympathetic support group. An effective team:
- Identifies and shares supporting and contrary information;
- includes subject matter experts to help address key issues;
- develops information that can be used for benchmarking analysis, and;
- develops feedback that benefits the analyst problem solving.
Our team should be a rich mix of individuals meeting the following:
- Qualities include:
- Individual thinkers, working in sync, with the combined geospatial skills, technical skills, and domain experience that spans the problem domain.
- A dynamic, likely conflicted team that expresses alternate perspectives, but still has energy and purpose that propels it forward in achieving its purpose.
- Individuals willing and responsible for expressing their perspective.
- The contrast with a group. A group is like a bunch of people on a bus all heading in the same direction driven by the bus driver. People do not talk with each other on the bus. They get on and off as they please. The only commonality is the vehicle.
- Actions of the team:
- demonstrate accountability;
- demonstrate a high order of geospatial awareness;
- involve conflict;
- focus on problem-solving including the geospatial perspective;
- have a formal leader;
- have informal leaders;
- are temporary, and;
- have individual roles that are critical to and subordinate to team goals. "I" is each of the parts that forms the "we" that pull together to make it about the bigger "us."
- Images that fit teams include:
- an aircraft carrier,and;
- a surgical team.
Perform the following: Identify and organize your design team.
Summary
Lesson 6 is the second of three lessons in the course capstone experience.
Lesson 7: Foundations of Geospatial System Development
As an introduction, this lesson includes the history and key concepts of the systems framework approach. A spatial system can be a method or an algorithm which fits with the definition of components which are connected together. A spatial system is also a framework, be it people, software, and/or hardware, of integrated entities performing spatial tasks. When you put the word information in front of system, the term information system refers to a system of people, data records and activities that process the data and information in an organization, and it includes the organization's manual and automated processes. A Geographic Information System (GIS) is a spatial system for capturing, storing, analyzing, managing and presenting data which are spatially referenced to the Earth. In the strictest sense, it is any information system capable of integrating, storing, editing, analyzing, sharing, and displaying geographically referenced information. In a more generic sense, GIS applications are tools that allow users to create interactive queries (user created searches), analyze spatial information, edit data and maps, and present the results of all these operations. Geographic information science is the science underlying the geographic concepts, applications and systems taught in degree and GIS Certificate programs at many universities.
Lesson Learning Objectives:
- Describe what constitutes a system.
- Describe who the key stakeholders of the system are.
- Describe the principles for systems development.
- Describe how to categorize the major problems, opportunities, and directives when undertaking a systems development project.
- Define the major phases of a development effort.
- Describe the major development processes of geospatial systems analysis and design.
Questions?
If you have any questions now or at any point during this lesson, please feel free to post them to the Threaded Discussion Forum. (That discussion forum can be accessed at any time by clicking on the Communicate tab, above, and then scrolling down to the Discussion Forums section.)
Checklist
To finish this lesson, you must complete the activities listed below. You may find it useful to print this page out first so that you can follow along with the directions.
| Step | Activity | Access/Directions |
|---|---|---|
| 1 | Read the lesson Overview and Checklist. | You are in the Lesson 7 online content now. The Overview page is previous to this page, and you are on the Checklist page right now. |
| 2 | Online Material (Read) | There are three different styles of reading that are referred to in the lessons:
|
| 3 | View the Lesson Overview. | You are in the Lesson 7 online content now. Click on the "Next Page" link to access the Lecture/Discussion. Foundations of Geospatial System Development |
| 4 | Geospatial Think-Piece (Template) [2] |
Using Word (or a word processing program compatible with Microsoft®), identify and briefly discuss (<200 words): what is unique about designing a geospatial system (GIS)? |
| 5 | Read lesson Summary. | You are in the Lesson 6 online content now. |
Tomlinson's Methodology: The first design methodology specifically for GIS
Introduction
This following page presents a historic summary number of methodologies created specifically for use in the design and implementation of Geographic Information Systems. They were developed so that issues specific to GISs were formally addressed: issues that were not addressed in general software design models of the time.
Tomlinson's Methodology
The first design methodology specifically for GISs was presented in 1972 by Roger Tomlinson (See figure 2.01 [33]) (Calkins 1982, p, 92). The methodology follows a traditional, linear waterfall model structure. The steps are broken down into four stages, each proceeding in sequence. The four stages of the methodology are described below.
Stage one begins with an assessment of the vision and goals of the project. The second step of this stage defines the organization's functional needs and requirements followed by the identification of data needs. Stage one concludes with the definition of specifications for the objective system. The steps of stage one reflect the first three steps of the traditional waterfall model. A feedback mechanism is shown that returns the project back to the beginning. This feedback mechanism allows the specifications to be compared with the initial definitions of objectives and requirements.
Stage two is a departure from the traditional waterfall model. The steps in this stage identify the current situation of the organization. These include hardware and software resources and the culture and structure of the organization. These steps identify the resources and constraints of the GIS project.
Stage three involves the comparison of the system specification derived in stage one with the resources and constraints identified in stage two. Necessary modifications are made to the initial specification and a revised design of the system is derived. The implications of the system's implementation in the organization are assessed. A notable inclusion is step 24, which calls for the description of user education needs (See figure 2.01 [33]). This is an important step, which is often omitted. As exemplified by this model, consideration of the organizational context has been recognized as an essential component of GIS design and implementation from the beginnings of GIS-specific design methodologies.
The final stage, stage four, entails a final evaluation of the system. From this point, the project proceeds in one of three directions. The system can be implemented, if it is deemed satisfactory. The project can return to the first step of stage one to reassess the original requirements of the system. The other alternative path is to stage three, where an alternative system can be defined to meet the previously determined needs.
This methodology is straightforward and simple to follow. It has served as the starting point for the development of subsequent GIS design methodologies. However, this methodology contains certain characteristics that may lead to some of the problems.
In the initial definition of requirements, user involvement is not specified. This aspect of the methodology has led to a number of unsuccessful GIS design projects where requirements were not satisfactorily defined (Calkins 1982, p. 95). To obtain an adequate assessment of an organization's needs and requirements, representatives from all levels of the organization must be explicitly involved, users in particular.
A second problematic characteristic of this methodology is the placement of user education needs in a step toward the end of the design process. An organization cannot accurately assess its needs and requirements unless it has a knowledge of GIS concepts and capabilities. The education of all participating members of the organization must take place early in the process. Also, the diagram implies that users are regarded as outsiders to the process.
The feedback mechanisms in this methodology are important and necessary. Returning the process to the objectives and requirements definition is crucial to ensure that the project is on the right track. The feedback paths in this particular methodology can be improved upon, however. In this methodology, only the intangible specifications of the objective system are compared with the initial requirements; a physical product is not available. A tangible product gives users and other organization members an increased ability to assess the strengths of a system.
An issue related to the feedback mechanisms is the lack of a means for changing requirements if necessary. Often users will incrementally discover requirements during the process, particularly when they see a physical product. In this methodology, a change to the requirements would require repeating all of the steps from the beginning. Although this is possible, a great deal of time would be consumed. A feedback mechanism that allows for less time-consuming and disruptive requirements changes would be an improvement.
This methodology partially meets only two of the requirements: (1) an iterative feedback mechanism exists, however, it does not enable interaction with a tangible product; and (2) user education is specified, but not until step 24 toward the end of the process; participants may be inadequately educated during the early stages of the project. The other requirements (i.e., organization-wide participation, emphasis on communication, and effective group-work environments) are not explicitly addressed.
Calkins' Methodology: A User Centric Approach
Hugh Calkins developed a methodology as a modification of the original 1972 methodology (Calkins 1982) (See figure 2.02 [34]). The Calkins methodology begins with the definition of objectives and requirements. The methodology then divides into two paths: one pursues issues of data, and the other pursues the issue of acquiring hardware and software. By dividing the methodology in such a way, a stronger emphasis is placed on the data requirements and needs. This is important because in a geographic information system the data is as important as, if not more important than, the hardware and software.
Aside from the separation of data from the hardware and software, the methodology follows the same general linear path as the original 1972 methodology. One striking difference is the omission of feedback mechanisms. At no point in the methodology is there an explicit return to the initial objectives and requirements. This opens the possibility that the final product may not be what was needed or expected. The lack of feedback mechanisms also denies users the opportunity to interact with the system and make changes to its specification, or more importantly, to the requirements.
Rather than feedback mechanisms, the Calkins methodology encourages continual user input throughout the process. Rather than iteratively modifying the system to accommodate changing user requirements, the Calkins methodology takes more of an incremental approach. Although not illustrated in the diagram, at each step of the process the system is evaluated by the users and minor changes can be made. This methodology, however, does not accommodate radical changes to the users' requirements. Rather, the idea in this methodology is to prevent the need for radical changes.
Calkins places strong emphasis on the involvement of users. This is an important and crucial factor. Changes that need to be made to the system commonly come from the users. Calkins acknowledges that changes will undoubtedly be necessary, and he states that a plan needs to be developed to deal with modifications after the system's implementation. This is an important strategy in any project. However, it is best to implement a system that meets the needs of the organization when it is first produced. Earlier sections have discussed the costly and time-consuming problems associated with significant backtracking in the process. A design methodology that accommodates change and the refinement of requirements before implementation is necessary.
This methodology explicitly addresses the participation of all levels of an organization. In particular, Calkins stresses the continual involvement of users in the design process. Other requirements (i.e., iterative discovery, communication emphasis, effective group-work environments, and education) are not formally presented in the Calkins methodology.
Marble and Wilcox Methodology: Looking Toward Software Engineering Practice
Marble and Wilcox developed a methodology that combines the Calkins methodology with concepts from software engineering and stresses the importance of involving all levels of an organization in the design process (Marble and Wilcox 1991). Figure 2.03 [35] indicates the different parties that Marble and Wilcox recommend for participation in the process. These parties include members from within the organization as well as external parties relevant to the process. The external parties supplement the expertise and knowledge of the organization. This expertise includes knowledge of specific GIS software and digital data products and knowledge of the design process itself. The interaction of all of these parties contributes to the success of a GIS implementation project.
Figure 2.04 [36] is a generalized diagram of the Marble and Wilcox methodology. The first step of functional and organizational feasibility is emphasized in this methodology. During this step not only are the objectives and requirements for the system defined, but the organizational implications of the system are also assessed (Marble and Wilcox 1991). The role that the system will play in the organization, the impacts the system will have on its members, the need for and value of implementing a GIS, and other such issues are addressed and made known to all members of the organization. This process of planning for both the technical and organizational specifications and impacts greatly reduces the possibility of later difficulties.
The explicit identification of organizational factors is the cornerstone of a successful GIS implementation according to the Marble and Wilcox methodology. The general ordering is similar to the other methodologies, but the emphasis is distinctly different. Listed below are a number of the specific issues that are stressed in this methodology (Marble and Wilcox 1991, pp. 9-11):
- The design must explicitly define any changes in the structure of the organization, especially with respect to those areas directly affected by the implementation of the GIS.
- The designer should produce not the most technically elegant solution, but the best technical solution that will realistically function within the organization.
- The staff must view the GIS as both valuable and non-threatening.
The Marble and Wilcox methodology is significant with regard to its emphasis on the organizational aspects of GIS design and implementation. A factor that seems to be lacking, however, is a feedback mechanism to account for the incremental discovery of requirements. It is an overall linear process with no opportunity to return to the fundamental step of system objectives and requirements definition.
Figure 2.05 [37] shows a detailed graphical description of the methodology. In this diagram, a step for optional pilot studies is shown. The omission of this step introduces risk by not allowing for feedback and incremental discovery of system requirements. The pilot study step consists of a reduced version of the entire methodology, where a physical product is generated, usually consisting of a simplified database and some commercial GIS software package acquired for evaluation purposes. The users evaluate the pilot system and reassess their needs and requirements. Feedback mechanisms and the implementation of the pilot system are key means to ensure that the requirements are correct and the ultimately implemented system is appropriate.
The Marble and Wilcox methodology, however, lacks an explicit education process. As stated earlier, the users cannot accurately assess their needs unless they are acquainted with the technology and understand its concepts. An initial step that consists of training and education is essential for an accurate definition of requirements. The pilot system will also provide a significant amount of education for the users as they interact with the system.
Marble and Wilcox strongly encourage broad organizational participation and illustrate this in a diagram (see Figure 2.03 [35]). By emphasizing the participation of many participants, Marble and Wilcox also address the communication requirement. The iterative discovery requirement is only partially addressed by Marble and Wilcox. There is no significant feedback mechanism back to requirements definition; however, an optional pilot study is included. This pilot study, if required and made a more prominent component of the methodology, would yield a better definition of requirements. The requirements of effective group work environments and education are not explicitly addressed in this methodology.
Prototyping and Other Previous GIS Design Methodologies
Peuquet and Bacastow (Peuquet and Bacastow 1991) recognize the problems that linear waterfall models present in GIS development and propose the use of prototyping as the preferred alternative. Prototyping not only increases the accuracy of requirements definition, but also increases support and morale within the organization. This methodology is predominantly concerned with the issue of iterative discovery and refinement. They note the following:
"Putting a system in the hands of the users was also highly effective in developing critical support for topographic automation and challenging established procedures within the research and development community by, first, demonstrating the immediacy of the need for topographic automation to managers, and second, by raising the users' level of expectations simultaneously with their level of frustration at not having a complete system." (Peuquet and Bacastow 1991, p. 308)
Another significant benefit of the prototyping model is its responsiveness to change. Prototyping encourages and accommodates change as an inherent part of the process (Peuquet and Bacastow 1991, p. 371). Changes in user requirements and other factors during the design process are inevitable. A methodology that acknowledges this fact and accommodates change produces a superior product. Linear models do not accommodate change.
Other GIS design methodologies exist, some of which are geared toward very specific applications. The Local Government GIS Development Guides, produced by the New York State Archives and Records Administration, is one such methodology (Becker et al. 1999). This methodology describes a generalized model with specific procedures and activities describing each step.
Figure 2.06 [38] shows a diagram of the New York State Archives and Records Administration methodology. The methodology has a linear appearance but has a step for the production of a pilot or benchmark system, similar to the Marble and Wilcox methodology. This pilot step is advantageous, although this methodology, like the Marble and Wilcox methodology, does not allow for the reevaluation and change of user requirements.
Although education does not show up as a formal step in the methodology diagram, the procedures of this methodology call for the project participants to attend introductory GIS seminars and workshops and other means of acquiring GIS knowledge (Becker et al. 1999, p. 11). This education step should be explicitly denoted in the design diagram as an indication of its importance. As discussed earlier, education at the start of the process is critical to successful requirements definition.
Another note in the methodology procedure is that the order of the steps in the methodology is not important, but rather that the steps are accomplished, in the authors' words, "one way or another" (Becker et al. 1999, p. 12). The loose structure of the Local Government GIS Development Guides allows the design and implementation process to wander and leads to poor decisions due to a lack of proper preparation. This is particularly likely given the technical and organizational complexity of GIS projects. This is therefore a highly risky means of proceeding. Part of the reason for using a design methodology to guide a GIS project is to avoid an unstructured, wandering project. The structure of a methodology is just as important as its steps to help move projects toward a successful completion.
Summary and Final Tasks
First, this lesson was an overview of the historic and foundational aspects of implementing a spatial system. Tomlinson's discussion is of importance since so many organizations focus only on the technical parts of implementing a computer system, and in the process don't really get the whole organizational picture of what is unique about spatial system and waste a great deal of time and money. A main theme through this lesson is that spatial system design is a team sport..
Second, the lesson introduced the role of systems analyst along with other stakeholders in the context of systems analysis and design. It also introduced the building blocks of Zackman’s Framework for Information Systems Architecture and is compatible with the idea that a system consists of four distinct layers: data, logic, presentation, and networks. These layers become the basis for distributed spatial systems which partitions or distributes various aspects of each of the first three layers (data, process, and interface) across the fourth layer (networks). Whitten’s Chapter 3 provided an introduction to the principles and processes used to develop information systems.
Lesson 8: Geospatial Systems Analysis and Fact-Finding
This lesson builds on the introduction to spatial system development from the previous lesson. Specifically, this lesson provides a more detailed look at the phases that are collectively called systems analysis. This analysis process reinforces the information system building blocks that were developed previously. Included is a look at the requirements gathering, and analysis concepts, tools, and methods. Whitten addresses the seven common fact-finding methods (Sampling, Research, Observation, Questionnaires, Interviews, Prototyping, Joint Requirements Planning) which are introduced as a means to discover requirements.
Lesson Learning Objectives:
- Evaluate the importance of the human component to design.
- Describe systems analysis.
- Describe the difference between functional and nonfunctional requirements.
- Explain when to use the key system analysis approaches.
Questions?
If you have any questions now or at any point during this lesson, please feel free to post them to the Threaded Discussion Forum. (That forum can be accessed at any time by clicking on the Communicate tab, above, and then scrolling down to the Discussion Forum section.)
Checklist
To finish this lesson, you must complete the activities listed below. You may find it useful to print this page out first so that you can follow along with the directions.
| Step | Activity | Access/Directions |
|---|---|---|
| 1 | Read the lesson Overview and Checklist. | You are in the Lesson 8 online content now. The Overview page is previous to this page, and you are on the Checklist page right now. |
| 2 | Effective SDI Leadership: The Antithesis of Good Management Practice? [39] (Read) Keen, Information Systems and Organizational Change (Read) [40] |
There are three different styles of reading that are referred to in the lessons:
|
| 3 | View the Lesson Overview. | You are in the Lesson 8 online content now. Click on the "Next Page" link to access the Lecture/Discussion. PowerPoint. [41] |
| 4 | Geospatial Think-Piece (Template) [2] |
Using Word (or a word processing program compatible with Microsoft®), identify and briefly discuss (<300 words total for both questions): (1) An experience with social inertia, resistance or counterimplementation to an information technology. (2) Why include the Keen reading in this course when it is over 30 years old? Name your file Lsn8_YourName.doc. Please turn-in your document the Lesson 8 Dropbox in ANGEL. What is a “Think Piece”? A “think piece” is a form of writing that is less polished than a formal paper or presentation but more fully developed than an entry in a personal journal. Think pieces are written to discover what an individual is thinking about a particular topic. Within this course, the writing of think pieces is a way of helping learners connect with the subject matter. Within this context, think pieces reduce the grading risk associated with an “all or nothing” term paper and allow the instructor to communicate with learners throughout the semester, to see the evolution of thinking, and to suggest resources that can further the learners’ understanding. What does a Think Piece look like? The starting point for a think piece for this course lie in the author’s immediate past experience. Because think pieces are as much a reflection of one’s ideas, there is no standard or uniform format for a think piece. In other words, each of us is writing from personal experience. We are not claiming to be objective not are we offering prescriptive, how-to, formulas or guidelines. |
| 5 | Read lesson Summary. | You are in the Lesson 8 online content now. Click on the "Next Page" link to access the Summary. |
Geospatial Technology Development and the Organizational Aspects
While the growth of and increase in the capabilities of geospatial applications has been explosive, the extent to which we satisfy a customer is still dependent on a number of other factors including employee education, training, the material and cultural work environments, job satisfaction, compensation, growth opportunity, the effectiveness of business processes, as well as the very structure of the organizations in which it all functions. Without a doubt, inspired, effective people remain one of the principal factors in any business. It is people that envision and implement strategy, interpret information into products and services; master business processes and create value for customers and shareholders alike. It should seem obvious that technology in general, and geospatial technologies more specifically, are affected by organizational factors.
Why then are we not more aware of the importance of the organizational framework in which we implement a geospatial technology? There are several possible reasons. First, the topic of the organizational structures seldom appears on the radar screen of the geospatial professional. The geospatial professional is typically so preoccupied with the technical and analytical challenges of day-to-day operations that the opportunity to study the social and the related organizational aspects is often lost. Second, the prevailing ideas of organizational, and therefore the related social, structure are institutionalized in our traditional management hierarchies of layered control and decision making. These multiple layers of management structure are the result of the same kind of functional orientation also present in models of mass production and military-like command and control organizations.
Keen’s 1981 article is a classic in the field of information systems. The age of the article notwithstanding, it is highly relevant today and in the realm of geospatial technology. The point here is that geospatial technology failures are commonly the result of non-technical defects; so a geospatial technology failure is more often to be a social outcome.
Summary and Final Tasks
This lesson taught the tools and techniques of systems analysis and provided a look at the requirements gathering and analysis activities. Reading both Whitten and Tomlinson provided a broad perspective of spatial and nonspatial aspects. The lesson built on the introduction to system development in the previous lesson and provided a more detailed look at the phases that are collectively called systems analysis. This systems analysis process reinforces the information system building blocks that were developed in the previous lesson. Whitten’s “The Framework for the Application of System Techniques” is included to illustrate the implementation of a systems analysis process with a current paradigm which might include structured analysis, information engineering, object-oriented analysis, and accelerated development. The second part of this lesson introduced concepts, tools, and methods, which are used by today’s systems analysts to discover requirements. A requirement was defined and common fact-finding methods (Sampling, Research, Observation, Questionnaires, Interviews, Prototyping, Joint Requirements Planning) were introduced as a means to discover requirements. Each method has advantages and disadvantages, and some guidelines were provided for their use.
Lesson 9: Developing Designs
In Lesson 9 we will slow down the pace and volume of material to examine use case modeling as a technique for documenting spatial system requirements. This is an extremely important lesson because no other part of the spatial system design is as difficult as establishing the detailed technical requirements. This lesson is also important because of the growing application of use case modeling, a tool that aids the communication between analysts and users in documenting requirements. We will discuss use-case modeling and the somewhat abstract definitions of actors, associations, and extends, uses, depends on, and inheritance relationships. It is also the first lesson on modeling which serves as a bridge from the earlier lesson on the techniques of systems analysis.
Lesson Learning Objectives:
- Describe a use-case.
- Evaluate the benefits of a use-case modeling.
- Apply use-cases with current spatial system development practices.
- Apply the tools and techniques to document systems requirements.
Questions?
If you have any questions now or at any point during this lesson, please feel free to post them to the Threaded Discussion Forum. (That forum can be accessed at any time by clicking on the Communicate tab, above, and then scrolling down to the Discussion Forum section.)
Checklist
To finish this lesson, you must complete the activities listed below. You may find it useful to print this page out first so that you can follow along with the directions.
| Step | Activity | Access/Directions |
|---|---|---|
| 1 | Read the lesson Overview and Checklist. | You are in the Lesson 9 online content now. The Overview page is previous to this page, and you are on the Checklist page right now. |
| 2 | There are three different styles of reading that are referred to in the lessons:
|
|
| 3 | View the Lesson Overview. | You are in the Lesson 9 online content now. Click on the "Next Page" link to access the Lecture/Discussion. PowerPoint [42]. |
| 4 | Geospatial Think-Piece (Template) [2] |
Using Word (or a word processing program compatible with Microsoft® Word), identify and briefly discuss (<200 words): what benefit the concept of use cases brings to your team's design project. Name your file Lsn9_YourName.doc. Please turn-in your document the Lesson 9 Dropbox in ANGEL. What is a “Think Piece”? A “think piece” is a form of writing that is less polished than a formal paper or presentation but more fully developed than an entry in a personal journal. Think pieces are written to discover what an individual is thinking about a particular topic. Within this course, the writing of think pieces is a way of helping learners connect with the subject matter. Within this context, think pieces reduce the grading risk associated with an “all or nothing” term paper and allow the instructor to communicate with learners throughout the semester, to see the evolution of thinking, and to suggest resources that can further the learners’ understanding. What does a Think Piece look like? The starting point for a think piece for this course lie in the author’s immediate past experience. Because think pieces are as much a reflection of one’s ideas, there is no standard or uniform format for a think piece. In other words, each of us is writing from personal experience. We are not claiming to be objective not are we offering prescriptive, how-to, formulas or guidelines. |
| 5 | Read lesson Summary. | You are in the Lesson 9 online content now. |
Use Cases in a Nutshell
Why develop use cases?
Use case development begins in the early inception phase of a project. Initially, you only gather their names (e.g., "Draw map of poles") and a sentence or two for a description and put them in a list. These are used to determine the system scope. You revisit each use case and add just a bit more detail to it - a paragraph or two of text sufficient to get a high level understanding of the use case (these are called High-level use cases, and each is a separate document). At the end of inception, you choose a group of related use cases for development in the elaboration phase. Use cases go through several iterations of development in elaboration.
How do you develop a use case?
Use cases are analyzed and designed in meetings with the design team (at least one other person) and a subject matter expert. They will be developed in several phases, each of which will require a separate meeting. The users participate in developing use cases - they understand what they do, and you don't. For a given use case or group of related use cases, identify the people that perform that particular job or task and invite one or two to participate in a meeting between you and one or two other members of the design team.
Actors
An actor is a role adopted by someone or something that interacts with the system. It can be a person or another software system. Actors are always external to the system; that is, an actor is something that interacts with your system but that you have no control over. Actors typically initiate some interaction with your system. However, external systems may be an exception. For example, you might have a use case that asks the tax billing system for a list of owners for a parcel. A given user may play the role of several actors. Use cases are a series of interactions between an actor and the system to accomplish some task. As such, they are the fundamental element of your design effort. Full analysis of a use case will lead to a definition of the data the actor needs to do the task, the interface the actor works with and the process followed to accomplish the task. Here are some questions that can help you identify potential actors:
- Who manages your system?
- Who uses the data in your system?
- Who maintains the data in your system?
- Who needs to be notified when data changes?
- What other systems might use your system?
- Does anything happen automatically?
Actor tasks and use cases
As you define an actor, consider the types of tasks she would perform with the GIS. These become candidate use cases. Also, some of your project requirements may become use cases. You document actors and use cases in several ways. Your initial meetings with management will identify many of them, and you'll probably start with simple lists. For a complex project, you should put them in database tables because project details are easier to manage with a database.
Use case diagrams
This UML artifact is a system diagram that shows the relationships between the use cases and the actors that use them. Use case diagrams are important tools that help you to visualize the overall system architecture, to specify and document the behavior of system elements (actors and use cases) and to organize and model the behavior of your system.
Writing use cases
Use cases are considered part of the UML, but there is no standard for use case structure or content. You are free to develop any format you like. The key point is to clearly capture the business process in a textual, narrative form. The primary goal from a data modeling perspective is to ensure that all the important concepts (potential classes in the geodatabase) required by the use case get mentioned.
The basic structure of all levels of use case is the same - you include "header" information that names the use case, states its level, summarizes it, identifies the actors and the pre- and post-conditions. The major structural difference is in how the description is written. For business and design level use cases, you replace the description with more detailed "scenarios" that describe the typical path through the use case (the primary scenario), any alternate paths (the secondary scenarios) and how errors are handled (the exception scenarios).
Levels of use cases
Use cases are written at several levels of details. Each level is a refinement of the one before, until you have captured the essential actor I system interactions. A use case normally goes through several iterations before it is finalized. The levels are:
- High level use case (written in the late inception phase). The high level use case is simply a summary description of the task, written as unstructured text a paragraph or two in length. Its purpose is to provide just enough detail to give you a feel for its complexity and to help you group related use cases for development in the Elaboration phase.
- Business level use case (written in the early elaboration phase). The business level use case captures the business process (the "user view") as a time-ordered sequence of steps. It does not show the human/computer interactions - you write it as though the actors do all the work. It identifies the process (for application development) and domain objects (for data modeling). It is written in a meeting with the design team and a subject matter expert and may take hours or a day or two to write clearly and with sufficient detail for data modeling. Conceptual models are often simultaneously developed.
- Design level use case (written in the late elaboration phase). The design level use case captures the interaction between the actors and the system - you determine which steps in the use case are the responsibility of the system. The description is written as a dialog between the actors and the system. Writing a design-level use case is actually the beginning of application design, and may proceed through several iterations of refinement until it introduces interface controls.
- Product use case (created in the elaboration phase). These aren't really use cases at all. They are simply detailed specifications used to generate products.
Scenarios
Business level and design level use cases generally have scenarios. The types of scenarios are:
- Primary scenario. Documents the most common path through the use case. Required for all use cases.
- Secondary scenario(s). Documents alternate paths through a use case.
- Exception scenario(s). Documents possible errors and recovery mechanisms.
Elements of a Use Case Diagram
A use case diagram captures the business processes carried out in the system. Normally, domain experts and business analysts should be involved in writing use cases. Use cases are created when the requirements of a system need to be captured. A use case diagram is quite simple in nature and depicts two types of elements: one representing the business roles and the other representing the business processes. Let us take a closer look at use at what elements constitute a use case diagram.
- Actors: An actor portrays any entity (or entities) that perform certain roles in a given system. The different roles the actor represents are the actual business roles of users in a given system. An actor in a use case diagram interacts with a use case. For example, for modeling a banking application, a customer entity represents an actor in the application. Similarly, the person who provides service at the counter is also an actor. But it is up to you to consider what actors make an impact on the functionality that you want to model. If an entity does not affect a certain piece of functionality that you are modeling, it makes no sense to represent it as an actor. An actor is shown as a stick figure in a use case diagram depicted "outside" the system boundary, as shown in the below figure.
To identify an actor, search in the problem statement for business terms that portray roles in the system. For example, in the statement "patients visit the doctor in the clinic for medical tests," "doctor" and "patients" are the business roles and can be easily identified as actors in the system.
- Use case: A use case in a use case diagram is a visual representation of a distinct business functionality in a system. The key term here is "distinct business functionality." To choose a business process as a likely candidate for modeling as a use case, you need to ensure that the business process is discrete in nature. As the first step in identifying use cases, you should list the discrete business functions in your problem statement. Each of these business functions can be classified as a potential use case. Remember that identifying use cases is a discovery rather than a creation. As business functionality becomes clearer, the underlying use cases become more easily evident. A use case is shown as an ellipse in a use case diagram.

The above figure shows two uses cases: "Make appointment" and "Perform medical tests" in the use case diagram of a clinic system. As another example, consider that a business process such as "manage patient records" can in turn have sub-processes like "manage patient's personal information" and "manage patient's medical information." Discovering such implicit use cases is possible only with a thorough understanding of all the business processes of the system through discussions with potential users of the system and relevant domain knowledge.
- System boundary: A system boundary defines the scope of what a system will be. A system cannot have infinite functionality. So, it follows that use cases also need to have definitive limits defined. A system boundary of a use case diagram defines the limits of the system. The system boundary is shown as a rectangle spanning all the use cases in the system.
The figure shows the system boundary of the clinic application. The use cases of this system are enclosed in a rectangle. Note that the actors in the system are outside the system boundary.
The system boundary is potentially the entire system as defined in the problem statement. But this is not always the case. For large and complex systems, each of the modules may be the system boundary. For example, for an ERP system for an organization, each of the modules such as personnel, payroll, accounting, and so forth, can form the system boundary for use cases specific to each of these business functions. The entire system can span all of these modules depicting the overall system boundary.
Relationships in Use Cases
Use cases share different kinds of relationships. A relationship between two use cases is basically a dependency between the two use cases. Defining a relationship between two use cases is the decision of the modeler of the use case diagram. This reuse of an existing use case using different types of relationships reduces the overall effort required in defining use cases in a system. A similar reuse established using relationships, will be apparent in the other UML diagrams as well. Use case relationships can be one of the following:
- Include: When a use case is depicted as using the functionality of another use case in a diagram, this relationship between the use cases is named as an include relationship. Literally speaking, in an include relationship, a use case includes the functionality described in another use case as a part of its business process flow. An include relationship is depicted with a directed arrow having a dotted shaft. The tip of the arrowhead points to the child use case and the parent use case is connected at the base of the arrow. A key here is that the included use case cannot stand alone, i.e., one would not validate the patient record without making an appointment. The stereotype "<<include>>" identifies the relationship as an include relationship.
For example, you can see that the functionality defined by the "Validate patient records" use case is contained within the "Make appointment" use case. Hence, whenever the "Make appointment" use case executes, the business steps defined in the "Validate patient records" use case are also executed.
- Extend: In an extend relationship between two use cases, the child use case adds to the existing functionality and characteristics of the parent use case. An extend relationship is depicted with a directed arrow having a dotted shaft, similar to the include relationship. The tip of the arrowhead points to the parent use case and the child use case is connected at the base of the arrow. The stereotype "<<extend>>" identifies the relationship as an extend relationship, as shown:
- Generalizations: A generalization relationship is also a parent-child relationship between use cases. The child use case in the generalization relationship has the underlying business process meaning, but is an enhancement of the parent use case. In a use case diagram, generalization is shown as a directed arrow with a triangle arrowhead. The child use case is connected at the base of the arrow. The tip of the arrow is connected to the parent use case.
On the face of it, both generalizations and extends appear to be more or less similar. But there is a subtle difference between a generalization relationship and an extend relationship. When you establish a generalization relationship between use cases, this implies that the parent use case can be replaced by the child use case without breaking the business flow. On the other hand, an extend relationship between use cases implies that the child use case enhances the functionality of the parent use case into a specialized functionality. The parent use case in an extend relationship cannot be replaced by the child use case.
Let us see if we understand things better with an example. From the diagram of a generalization relationship, you can see that "Store patient records (paper file)" (parent) use case is depicted as a generalized version of the "Store patient records (computerized file)" (child) use case. Defining a generalization relationship between the two implies that you can replace any occurrence of the "Store patient records (paper file)" use case in the business flow of your system with the "Store patient records (computerized file)" use case without impacting any business flow. This would mean that in future you might choose to store patient records in a computerized file instead of as paper documents without impacting other business actions.
Now, if we had defined this as an extend relationship between the two use cases, this would imply that the "Store patient records (computerized file)" use case is a specialized version of the "Store patient records (paper file)" use case. Hence, you would not be able to seamlessly replace the occurrence of the "Store patient records (paper file)" use case with the "Store patient records (computerized file)" use case.
Questions?
If you have questions at any time during this lesson, please feel free to post them to the Discussion Forum. (Click on the Communicate tab to access our course discussion forums.)
Summary and Final Tasks
In this lesson you learned about use cases. A use case diagram shows which actors interact with each use case. In more detail, the basic elements of a use case diagram are:
- Use cases. A use case describes a sequence of actions that provide something of measurable value to an actor and is drawn as a horizontal ellipse.
- Actors. An actor is a person, organization, or external system that plays a role in one or more interactions with your system. Actors are drawn as stick figures.
- Associations. Associations between actors and use cases are indicated in use case diagrams by solid lines. An association exists whenever an actor is involved with an interaction described by a use case. Associations are modeled as lines connecting use cases and actors to one another, with an optional arrowhead on one end of the line. The arrowhead is often used to indicate the direction of the initial invocation of the relationship or to indicate the primary actor within the use case. The arrowheads are typically confused with data flow and as a result I avoid their use.
- System boundary boxes (optional). You can draw a rectangle around the use cases, called the system boundary box, to indicate the scope of your system. Anything within the box represents functionality that is in scope, while anything outside the box represents functionality that is not in scope. System boundary boxes are rarely used, although on occasion I have used them to identify which use cases will be delivered in each major release of a system.
If you were analyzing a sentence in English, the subject in the sentence could be identified as a potential actor and the verb part of the sentence could be a potential use case. Remember, this may or may not apply to the problem at hand, but is a good starting point for use case modeling.
This lesson is a bridge from the discussion of general techniques of systems analysis to modeling a system. It was an extremely important lesson because of the growing application of use case modeling. The next lesson will be much faster in pace and focus on the skill of data and object modeling. The next lesson will also address feasibility analysis of alternative systems solutions.
Lesson 10: Documenting Solutions
This lesson is an introduction to UML or, more properly, the Unified Modeling Language. The Unified Modeling Language (UML) was developed during the 1990s, starting with Rational Software Corporation and three prominent individuals in the information technology industry, Grady Booch, James Rumbaugh, and Ivar Jacobson. UML is becoming the standard for building Object-Oriented software and databases. The language has achieved industry support through the UML Partners Consortium and is approved standard of the Object Management Group (OMG).
The entity-relationship diagram (ERD) is, in fact, the grandfather of ULM. Developed in the 1970s, ER modeling was created to provide a diagramming notation that could directly map to a relational database schema. As the definitions of entities, attributes, and relationships have become more sophisticated, we refined our data modeling methods. Although ER modeling was essential to the development of UML, the focus on a graphical notation that helped database designers better understand the problem space has changed to the discovery and representation of the users' needs.
Most new GIS development tools emphasize object-oriented (OO) features and therefore suggest that an OO analysis and design (OOAD) methodology is appropriate. What is different about an OOAD? According to Donald Firesmith in the Dictionary of Object Technology (SIGS Books, 1995), analysis is "the development activity consisting of the discovery, modeling, specification and evaluation of requirements," while OO analysis is "the discovery, analysis and specification of requirements in terms of objects with identity that encapsulates properties and operations, message passing, classes, inheritance, polymorphism and dynamic binding." Firesmith states further that OO design is "the design of an application in terms of objects, classes, clusters, frameworks, and their interactions."
When comparing the traditional analysis with that of OOAD, the only aspect that differs is classifying a problem in terms of objects and object classes. A class is any uniquely identified abstraction of a set of logically related instances that share the same or similar characteristics. An object is any abstraction that models a single thing, and the term "object" is synonymous with instance. Classes have attributes and methods. For an object class named Roads, attributes might be Name and Width, and methods might be Update and Delete. The class definition defines the Roads class attributes and methods, and a real road, such as "Main Street", is an instance of the class. If you have different kinds of roads, such as Interstate Highways and Local Roads, you can create two new classes of roads that are descendants of the Roads class. These descendants use inheritance to gain access to all of the Roads class attributes and methods, but can override any of the ancestor attributes and methods, as well as contain any required new attributes and methods. There are three types of relationships between classes: inheritance, aggregation, and association. Inheritance (also referred to as generalization/specialization) is usually identified by the phrase "is a kind of."
The UML is neither a software development methodology nor a systems development life cycle. It is simply a notation for documentating a system design. UML simply provides a standardized means of visualizing, specifying, constructing, and documenting software and data systems. It allows the designer to evaluate business processes, system functions, software components, and database schemas. In other words, it is the language that the blueprint for a system is written in. UML defines the notation and meanings for the following areas:
- Use Case Models which describe the boundary and interaction between the system and users.
- Collaboration Models which describe how objects in the system will interact with each other to get work done.
- Dynamic Models where state charts describe the states or conditions that classes assume over time. Activity graphs can be used to describe the workflows the system will implement.
- Logical Models which describe the classes and objects that will make up the system.
- Physical Component Models which describe the software of the system.
- Deployment Models which describe the physical architecture and the deployment of components.
As you can see, UML is quite extensive and describes the whole system including software and hardware.
Lesson Learning Objective:
- Develop an understanding of the methods and tools associated with documenting and evaluating a design
Questions?
If you have any questions now or at any point during this lesson, please feel free to post them to the Threaded Discussion Forum. (That forum can be accessed at any time by clicking on the Communicate tab, above, and then scrolling down to the Discussion Forum section.)
Checklist
To finish this lesson, you must complete the activities listed below. You may find it useful to print this page out first so that you can follow along with the directions.
| Step | Activity | Access/Directions |
|---|---|---|
| 1 | Read the lesson Overview and Checklist. | You are in the Lesson 10 online content now. The Overview page is previous to this page, and you are on the Checklist page right now. |
| 2 | There are three different styles of reading that are referred to in the lessons:
|
|
| 3 | View the Lesson Overview. | You are in the Lesson 10 online content now. Click on the "Next Page" link to access the Lecture/Discussion. PowerPoint [43]. |
| 4 | Geospatial Think-Piece (Template) [2] |
Using Word (or a word processing program compatible with Microsoft® Word), briefly discuss (<200 words): why "model" a system? Name your file Lsn10_YourName.doc, Please turn-in your document the Lesson 10 Dropbox in ANGEL. What is a “Think Piece”? A “think piece” is a form of writing that is less polished than a formal paper or presentation but more fully developed than an entry in a personal journal. Think pieces are written to discover what an individual is thinking about a particular topic. Within this course, the writing of think pieces is a way of helping learners connect with the subject matter. Within this context, think pieces reduce the grading risk associated with an “all or nothing” term paper and allow the instructor to communicate with learners throughout the semester, to see the evolution of thinking, and to suggest resources that can further the learners’ understanding. What does a Think Piece look like? The starting point for a think piece for this course lie in the author’s immediate past experience. Because think pieces are as much a reflection of one’s ideas, there is no standard or uniform format for a think piece. In other words, each of us is writing from personal experience. We are not claiming to be objective not are we offering prescriptive, how-to, formulas or guidelines. |
| 5 | Next Class | Each team will bring to class a document containing their project's:
|
| 6 | Read lesson Summary. | You are in the Lesson 10 online content now. Click on the "Next Page" link to access the Summary. |
Object Oriented Analysis and Design
There was a time when GIS data was simply represented as points, lines, and polygons with attached attributes. As GIS continues to build on an Object Oriented (OO) technology, advancements in database design have expanded the simple storage of geometry and attributes to include object states, enhanced relationships, validation rules, connectivity requirements, and intricate geometric networking. As you should know by now, OOA&D (Object Oriented Analysis and Design) is a methodology for system design and data modeling, consisting of assessment, decomposition, conceptualization, and physical modeling techniques to meet the user's needs. Since it is user-centric, the OOA&D approach is incremental in nature, comprised of many reusable pieces or elements, which are created as needed, or when identified by the user. It is also iterative in nature, offering the flexibility of continuous or successive testing and revision throughout the entire process. This allows the user to test and register feedback as the functionality is explored or added rather than during the final testing phase, as found in many of the older development methodologies.
The OOA&D approach is structured into a process of work flow procedures which progress through the phases of inception, elaboration, construction, and transition. Each phase contains specific tasks or activities that produce pieces of information, termed artifacts, which are created in incremental stages and refined through iterations or development cycles. UML (Unified Modeling Language) is a graphical notation language, used to visualize and store system objects, actions, and relationships in a sort of software blueprint fashion. The Unified Modeling Language (UML) is a simple and extensible modeling language that we will discuss in more detail in a later lesson. This discussion is just a brief introduction. UML does not dictate nor require that a particular process is followed, however, the developers of the language do encourage users to follow a use case driven, architecture-centric, iterative and incremental process that is object oriented and component based. It is a modeling language specification. Tools used to implement UML can range from pen and paper through to sophisticated off-the-shelf applications. The UML is not a visual programming language; it is a visual modeling language. It is not simply a notation but a language for capturing knowledge and expressing knowledge about the system under design. UML has become the industry-standard language for system modeling. UML is not a process; UML is process independent.
UML diagrams provide many perspectives of a system during analysis and development. UML defines a set of graphical diagrams that are used for many planning, design and implementation tasks depending on the angle that you are viewing the system. The major views of the system that UML supports are: 1) the user view, 2) the structural view, 3) the behavioral view, and 4) the implementation view. One or more diagrams for each view is defined by the UML, and each provides a unique window into the system. UML diagrams are to be treated as a set of resources for system modeling. Take care to utilize only those diagrams that provide a useful and beneficial view of your system. Some UML diagrams are more critical than others for system modeling. The general order is: 1) use case diagrams, 2) structural and behavioral diagrams, 3) component diagram, and 4) deployment diagram. UML diagrams are briefly described below.
The User View
Use Case Diagram. The user view provides a window into the system from the users perspective, in that the functionality of the system is modeled in terms of the user and what the user expects of the system. In UML-ese, the user of the system is called an actor, which can represent either a human user or users as other systems. The functionality of the system is defined by the use cases. The lines connecting the actors and the use cases show that the actors interact with the functionality provided by the use case. Use cases are usually described in greater detail in Functional Requirements.
Business Use Case Diagram. The business use case diagram is an extension to the use case diagram and is defined in and supported by UML. The first step in business modeling using the UML is identifying the interactions between the business processes and those entities outside the business, such as customers and suppliers.
The Structural View
Class Diagram. Class diagrams describe the static structure of a system. The focus of the class diagram is to describe how a system is structured rather than how it behaves. Class diagrams are probably the most versatile of the UML diagrams. Data models, software components, software classes, and business objects are modeled using the class diagram, each in its own diagram.
The Behavior View
The Sequence Diagram. Sequence diagrams describe the behavior of a use case by diagramming the classes and the messages exchanged between them arranged in chronological order. Sequence diagrams do not describe object relationships; that view of the system is reserved for collaboration diagrams. Object and actor instances can be displayed in the sequence diagram along with how the objects communicate by sending messages to one another.
Collaboration Diagram. The collaboration diagram is a view of the interactions of objects, and, unlike the sequence diagram that describes the objects messaging over time, collaboration diagrams display the relationships between objects. Some UML tools can automatically generate collaboration diagrams from sequence diagrams, and vice versa. Collaboration and sequence diagrams express similar information, but they display it from different perspectives.
Activity Diagram. The activity diagram is a specialization of the state diagram and it displays the dynamics of a system by showing the work flow. The activity diagram complements the business use case diagram in that it shows the process flow behind the use case.
State Diagram. The state diagram describes the sequence of states that an object goes through during its lifetime. The state diagram displays the events that act upon the object that enables the transition from one state to the next.
The Implementation View
Component Diagram. The component diagram displays the static structure of the implementation view. The component diagram shows the organizations and dependencies of the components, subsystems, and their relationships. The diagram models the interface that can be used to show the externally visible operations of a class or component.
Deployment Diagram. The deployment diagram shows the configuration of run-time processing elements and the software components, processes and objects that execute on them. The deployment diagram can be used for business modeling where employees and organizations are displayed as run-time processing elements and the procedures and documents that they use are displayed as the software components.
Summary and Final Tasks
This lesson taught the important skill of object modeling during systems analysis. You learned about the unified modeling language (UML) diagrams and built the ones that apply to systems analysis.
Lesson 11: Software Architectures
In this lesson we will move from systems analysis to systems design. Requirements have been studied and documented; logical modeling has been completed; an implementation has been decided upon; so we are ready to do the detailed system design to guide programmers and/or system integrators. The first part of this lesson addresses the systems design phase of systems development. Although some of the techniques of systems design are introduced in this lesson, it is not the intent to teach the techniques of systems design. This lesson only teaches the process and introduces you to some of the techniques. The second key part of this lesson addresses how to make the up-front architectural decisions that we used to refer to as general systems design, and how to model those decisions using physical data flow diagrams. This part of the lesson serves to stimulate the reader’s imagination and creativity with respect to the many architectural and technological choices that can and should be made during general systems design inclusive of network, database, interface, and software development technologies.
Lesson Learning Objectives:
- Describe the design phase.
- Identify and differentiate between several spatial system design strategies.
- Describe the design phase in terms of developing software in-house and procuring commercial software.
- Define a system's architecture.
- Describe the strategies for developing or determining the architecture of a geospatial system.
Questions?
If you have any questions now or at any point during this lesson, please feel free to post them to the Threaded Discussion Forum. (That forum can be accessed at any time by clicking on the Communicate tab, above, and then scrolling down to the Discussion Forum section.)
Checklist
To finish this lesson, you must complete the activities listed below. You may find it useful to print this page out first so that you can follow along with the directions.
| Step | Activity | Access/Directions |
|---|---|---|
| 1 | Read the lesson Overview and Checklist. | You are in the Lesson 11 online content now. The Overview page is previous to this page, and you are on the Checklist page right now. |
| 2 | GIS Software Technology (Scan) [44] GIS Product Architecture (Scan) [45] |
There are three different styles of reading that are referred to in the lessons:
|
| 3 | View the Lesson Overview. | You are in the Lesson 11 online content now. Click on the "Next Page" link to access the Lecture/Discussion. Geospatial System Architectures PowerPoint [46] |
| 4 | Geospatial Think-Piece (Template) [2] |
Using Word (or a word processing program compatible with Microsoft® Word), identify and briefly discuss (<200 words): Name and discuss a geospatial architecture. .Name your file Lsn11_YourName.doc, Please turn-in your document the Lesson 11 Dropbox in ANGEL. What is a “Think Piece”? A “think piece” is a form of writing that is less polished than a formal paper or presentation but more fully developed than an entry in a personal journal. Think pieces are written to discover what an individual is thinking about a particular topic. Within this course, the writing of think pieces is a way of helping learners connect with the subject matter. Within this context, think pieces reduce the grading risk associated with an “all or nothing” term paper and allow the instructor to communicate with learners throughout the semester, to see the evolution of thinking, and to suggest resources that can further the learners’ understanding. What does a Think Piece look like? The starting point for a think piece for this course lie in the author’s immediate past experience. Because think pieces are as much a reflection of one’s ideas, there is no standard or uniform format for a think piece. In other words, each of us is writing from personal experience. We are not claiming to be objective not are we offering prescriptive, how-to, formulas or guidelines. |
| 5 | Read lesson Summary. | You are in the Lesson 11 online content now. Click on the "Next Page" link to access the Summary. |
Geospatial System Architecture
System Architecture. A system architecture is the conceptual design that defines the structure and/or behavior of a system. There is no universally agreed definition of which aspects constitute a system architecture, and various organizations define it in different ways. Systems architecture can best be thought of as a representation of an existing or a To Be Created system. The set of relations which an architecture describes may be expressed in hardware, software, or organizational management. It is a representation because it is used to convey the informational content of the elements comprising a system, the relationships among those elements, and the rules governing those relationships. It is also a process because a sequence of steps is prescribed to produce or change the architecture, and/or a design from that architecture, of a system within a set of constraints. It can also be a discipline because a body of knowledge is used to inform practitioners as to the most effective way to design the system within a set of constraints.
So, you can see that a geospatial architecture is a strategic blueprint that is developed, implemented, maintained, and used to explain and guide how geospatial technology and management elements work together to efficiently accomplish the mission. Broadly, geospatial architecture effort addresses the following views:
- business processes,
- system sstructures including data sets and information flows,
- technical framework, and
- product technologies.
Having an architecture with specific goals does not mean that a geospatial system must immediately change all of its parts. Part of the architecture is a plan that addresses how the organization will migrate to the new targets over time.
The best reasons for a geospatial architecture are the benefits it brings to the precipitating organization. Benefits include the improved ability to share and efficiently process information, the ability to respond faster to changes in technology and business needs, and reductions in costs because of economies of scale and resource sharing. An architecture promotes consistency across a geospatial community by guiding development towards using a common set of approaches and enables both efficient reuse of components and interoperability. The architecture itself is built out through the efforts of the geospatial community’s stakeholders who are responsible for their data, security, network, and hardware infrastructures
A Federal Enterprise Architecture (FEA) is promoted by the Office of Management and Budget as a methodology to assist in the consistent modeling, description, and execution of business practices in all agencies. The FEA is based on a common set of reference models in use by the public and private sector that collectively define the operations of an organization in support of its mission. The Federal government found the following challenges associated with geospatial information and services supporting government business activities:
- Organizations are frequently limited in interoperability and their ability to share information and to collaborate with other government agencies or organizations particularly in times of emergencies or where rapid decisions are needed for business purposes
- Providers and consumers of geospatial data and services do not share semantics and functional capabilities, limiting interoperability
- Organizations often do not take advantage of information resources that are available through existing spatial data infrastructure services and networks, and therefore unknowingly create redundant capabilities
- Organizations do not know what other geospatial information exists
- Spatial data infrastructure services and networks may exist but are not adequately described for discovery or to permit the assessment of quality for re-use
- Organizations often do not use the best geospatial information resource because data is in too many places, too many possible sources exist, source are of unknown “pedigree”, sources not properly documented, and sources not easily searched
- Geospatial information and services are not planned, acquired, managed, and shared consistently within and across organizations
- Geospatial data and services are not readily available to users and applications over the Web or via service-oriented architectures
In the Federal domain, a Geospatial Profile [47]provides cross-government guidance intended to promote common, consistent enterprise architecture practice that results in improved business performance. Here’s an example of a Reference Architecture that was developed for the Pennsylvania Map (PAMAP) [48].
An Analogy. Consider a community that maintains an infrastructure for a public service to homes and businesses. This infrastructure might include:
- Electricity producers
- Drinking water purification and distribution
- Sewage treatment
- Other waste disposal
- Natural gas distribution
- Public transport
- Cable television and telephones
- Roads and toll ways
Imagine trying to build just the community’s water system if there were no standard pipe sizes, no standard fittings etc. It would be nearly impossible. Imagine a world of plumbing standards that had some vague objective of "this working with that", with a conversation among water system designers taking place largely outside the context of other systems such as interconnecting water systems, sewage systems etc. This would not be a productive direction. Not only standards are needed but the community also needs some infrastructure concepts to inform the planners as to what components are required (hence what sort of interfaces need to be defined), and to provide a means or assigning priorities to those interface definitions. In this case, there is a balanced discussion of interoperability and infrastructure. A large geospatial system is a community with similar infrastructure requirements.
Views of a System Architecture. For any given information processing system, there are a number of user “roles” that have an interest in the system. Examples include the members of the enterprise who use the system, the system analysts, who specify it, the system designers, who implement it, and the system administrator, who install it. Each role is interested in the same system, but their relative views of the system are different, they see different issues, they have different requirements, and they use different vocabularies (or languages) when describing the system. RM-ODP attempts to recognize these different interests by defining different viewpoints. The ISO Reference Model of Open Distributed Processing (RM-ODP) [49] defines the following five viewpoints. Together they provide the complete description of the system: enterprise viewpoint, information viewpoint, computational viewpoint, engineering viewpoint, and technology viewpoint. The concerns addressed in each of the viewpoints are briefly sketched below:
- Enterprise Viewpoint: It is directed to the needs of the users of an information system. It describes the (distributed) system in terms of answering what it is required to do for the enterprise or business. It is the most abstract of the framework of viewpoints stating high level enterprise requirements and policies.
- Information Viewpoint: It focuses on the information content of the enterprise.The information modelling activity involves identifying information elements of the system, manipulations that may be performed on information elements, and the information flows in the system.
- Computational Viewpoint: It deals with the logical partitioning of the distributed applications independent of any specific distributed environment on which they run. It hides from the application designer the details of the underlying machine (distributed platform) that supports the application.
- Engineering Viewpoint: It addresses the issues of system support (platform) for distributed applications. It identifies the functionality of the distributed platform required for the support of the computational model.
- Technology Viewpoint: The technology model identifies possible technical artifacts for the engineering mechanisms, computational structures, information structures, and enterprise structures.
The purpose of viewpoints is to position services relative to one another, to guide the selection of appropriate models of services, and to help in the placement of boundaries. Using the five viewpoints to examine system issues encourages a clear separation of concerns, which in turn leads to a better understanding of the problems being addressed.
Architecture Development. Program managers of geospatial projects should take a broader view than just networks and applications. The workflow for the geospatial architecture development is shown below.
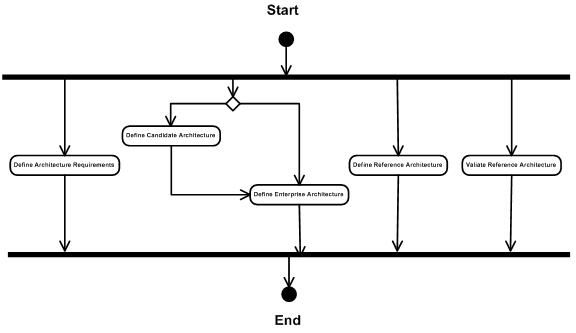
It is not just about modeling the "big picture;" it is a definition of the structure and distribution of technical and business assets across the entire enterprise. Elements of the process, reading from left to right, are:
a. Defining Architecture Requirements. A geospatial architecture must reflect a set of requirements. The primary goal of the requirements is to enable the system to meet the community’s goals and objectives, not simply the objectives of a single stakeholder. Architecture in general is the "grey area" between what stakeholders aspire to and what can be specified and engineered as a solution. A geospatial architecture requirements are therefore invariably subject to drivers and constraints, many of which by their very nature are beyond the control of the program or a single stakeholder (changing technology, new legislation, etc.).
b. Defining a Candidate Architectures. A Candidate Architecture is an architecture that has not been fully detailed; in other words, it may be as nebulous as the statement "start exposing our applications to a wider audience of users, possibly via web services". The purpose is to evolve an architecture gradually so that we can successfully adopt a new infrastructure in a low-risk manner. The approach is to identify and then validate candidate architectures, which are the building blocks from which the geospatial enterprise architecture is built. An important next step is to show that the candidate architecture actually works and fits into the larger architecture of the organization’s enterprise.
c. Defining Enterprise Architecture. With a suitable candidate architecture in hand, the architects integrate it into an enterprise architecture model. The enterprise architecture model will follow accepted enterprise administration guidance, such as security and data standards and guidelines, which reflects the enterprise development guidance that the enterprise architects develop and support the geospatial activity
d. Defining Reference Architectures. A Reference Architecture is a working example designed and proven for use in by the participants; it serves as an example and provides the basis for creating an application architecture. The reference architectures helps application teams to craft application architecture that utilize the geospatial system. A proven architecture will greatly speed application development effort and minimize support costs because applications are architected in standard, proven ways.
e. Validating a Reference Architecture. A vital part of a reference architecture is testing and validation. A spatial system’s reference architectures is not a theoretical model of how things might work. It is a proven pattern of how things do work and the architects must work with project teams to help them succeed at adopting and following the enterprise architecture. They do this by helping them to apply reference architectures and to craft application architectures with enterprise needs in mind.
Summary and Final Tasks
We all know that geospatial technology is widely utilized to support various applications including asset management, emergency management, managing natural resources, assessing taxes, and designing entire highway systems. While spatial data and related technology is applicable to hundreds of commercial applications, businesses are only now realizing the need to build enterprise geospatial systems and to spatially enable the existing data. Geospatial information has become an integral part of the IT infrastructure at all levels of industry. Having traditional GIS enter the age of the Internet with its inherent very thin client, geospatial systems now are moving away from the tradition architectures and embrace a new architecture suitable for enterprise applications. There is a pressing need to introduce architectures for spatial technologies operating in this environment. This can only be successfully done by adapting and using methods to ensure the creation of a solid infrastructure foundation.
Creating a common infrastructure for an enterprise-wide geospatial system involves methods and techniques for scoping, analysis, design, implementation, and deployment. When building an enterprise-wide geospatial system, a well thought-out approach facilitates transition and application migration. It provides a consistent and reliable way to interface to external systems; increased application availability and performance; reduction in failure; load balancing; scalability; security; legacy system support; and last but not least, support for your clients.
Lesson 12: Geospatial Systems Modeling
Object-oriented technology is widely used in GIS research and software development. In addition to the advantages that object-oriented technology brings to software analysis and design, it also benefits the data modeling of GIS. This is the second of two lessons on object-oriented tools and techniques for geospatial system development. This lesson addresses the important skill of object modeling during systems design. Here you will learn about various unified modeling language (UML) diagrams and object-oriented design concepts. While object-oriented data models have been extensively used for modeling geographic applications, the models present limitations, since they do not provide appropriate primitives for representing spatial data. There are efforts to provide primitives for modeling the geometry and the topology of spatial data, supporting different topological structures, multiple views of objects, and spatial relationships. In this way, UML is being enhanced to overcome the limitations of the existing models, thus providing more adequate tools for modeling geographic applications.
Lesson Learning Objectives:
- Describe the activities involved in object-oriented design.
- Differentiate between a design use-case narrative and an analysis use-case narrative.
- Model class interactions with sequence diagrams.
- Understand the use of communications diagrams, component diagrams, and deployment diagrams.
Questions?
If you have any questions now or at any point during this lesson, please feel free to post them to the Threaded Discussion Forum. (That forum can be accessed at any time by clicking on the Communicate tab, above, and then scrolling down to the Discussion Forum section.)
Checklist
To finish this lesson, you must complete the activities listed below. You may find it useful to print this page out first so that you can follow along with the directions.
| Step | Activity | Access/Directions |
|---|---|---|
| 1 | Read the lesson Overview and Checklist. | You are in the Lesson 12 online content now. The Overview page is previous to this page, and you are on the Checklist page right now. |
| 2 | Online material (Read) | There are three different styles of reading that are referred to in the lessons:
Geographic Markup Language [51] |
| 3 | Geospatial Think-Piece (Template) [2] |
Using Word (or a word processing program compatible with Microsoft® Word), identify and briefly discuss (<300 words): Why is UML described as a language? Name and discuss a geospatial concept that is or should be part of the UML language. Name your file Lsn12_YourName.doc, Please turn-in your document the Lesson 12 Dropbox in ANGEL. What is a “Think Piece”? A “think piece” is a form of writing that is less polished than a formal paper or presentation but more fully developed than an entry in a personal journal. Think pieces are written to discover what an individual is thinking about a particular topic. Within this course, the writing of think pieces is a way of helping learners connect with the subject matter. Within this context, think pieces reduce the grading risk associated with an “all or nothing” term paper and allow the instructor to communicate with learners throughout the semester, to see the evolution of thinking, and to suggest resources that can further the learners’ understanding. What does a Think Piece look like? The starting point for a think piece for this course lie in the author’s immediate past experience. Because think pieces are as much a reflection of one’s ideas, there is no standard or uniform format for a think piece. In other words, each of us is writing from personal experience. We are not claiming to be objective not are we offering prescriptive, how-to, formulas or guidelines. |
| 4 | Read lesson Summary. | You are in the Lesson 12 online content now. Click on the "Next Page" link to access the Summary. |
OOA&D, GIS, and UML Diagram Views
There was a time when GIS data was simply represented as points, lines, and polygons with attached attributes. As GIS continues to build on an Object Oriented (OO) technology, advancements in database design have expanded the simple storage of geometry and attributes to include object states, enhanced relationships, validation rules, connectivity requirements, and intricate geometric networking. As you should know by now, OOA&D (Object Oriented Analysis and Design) is a methodology for system design and data modeling, consisting of assessment, decomposition, conceptualization, and physical modeling techniques to meet the user's needs. Since it is user-centric, the OOA&D approach is incremental in nature, comprised of many reusable pieces or elements, which are created as needed, or when identified by the user. It is also iterative in nature, offering the flexibility of continuous or successive testing and revision throughout the entire process. This allows the user to test and register feedback as the functionality is explored or added, rather than during the final testing phase, as found in many of the older development methodologies.
The OOA&D approach is structured into a process of workflow procedures which progress through the phases of inception, elaboration, construction, and transition. Each phase contains specific tasks or activities that produce pieces of information, termed artifacts, which are created in incremental stages and refined through iterations or development cycles. UML (Unified Modeling Language) is a graphical notation language, used to visualize and store system objects, actions, and relationships in a sort of software blueprint fashion. The Unified Modeling Language (UML) is a simple and extensible modeling language. That does not dictate nor require that a particular process is followed, however, the developers of the language do encourage users to follow a use case driven, architecture-centric, iterative and incremental process that is object oriented and component based. It is a modeling language specification. Tools used to implement UML can range from pen and paper through to sophisticated off-the-shelf applications. The UML is not a visual programming language; it is a visual modeling language. It is not simply a notation, but a language for capturing knowledge and expressing knowledge about the system under design. UML has become the industry-standard language for system modeling. UML is not a process; UML is process independent.
UML diagrams provide many perspectives of a system during analysis and development. UML defines a set of graphical diagrams that are used for many planning, design and implementation tasks which depend upon the angle from which you are viewing the system. The major views of the system that UML supports are: 1) the user view, 2) the structural view, 3) the behavioral view, and 4) the implementation view. One or more diagrams for each view is defined by the UML and each provides a unique window into the system. UML diagrams are to be treated as a set of resources for system modeling. Take care to utilize only those diagrams that provide a useful and beneficial view of your system. The general order is: 1) use case diagrams, 2) structural and behavioral diagrams, 3) component diagram, and 4) deployment diagram. UML diagrams are briefly described below. You can also view the UML Diagrams Overview presentation [52] (PowerPoint).
The User View
Use Case Diagram. The user view provides a window into the system from the user's perspective, in that the functionality of the system is modeled in terms of the user and what the user expects of the system. In UML-ese, the user of the system is called an actor, which can represent either a human user or users as other systems. The functionality of the system is defined by the use cases. The lines connecting the actors and the use cases show that the actors interact with the functionality provided by the use case. Use cases are usually described in greater detail in Functional Requirements.
Business Use Case Diagram. The business use case diagram is an extension to the use case diagram and is defined in and supported by UML. The first step in business modeling using the UML is identifying the interactions between the business processes and those entities outside the business, such as customers and suppliers.
The Structural View
Class Diagram. Class diagrams describe the static structure of a system. The focus of the class diagram is to describe how a system is structured rather than how it behaves. Class diagrams are probably the most versatile of the UML diagrams. Data models, software components, software classes, and business objects are modeled using the class diagram, each in its own diagram.
The Behavior View
The Sequence Diagram. Sequence diagrams describe the behavior of a use case by diagramming the classes and the messages exchanged between them, arranged in chronological order. Sequence diagrams do not describe object relationships; that view of the system is reserved for collaboration diagrams. Object and actor instances can be displayed in the sequence diagram along with how the objects communicate by sending messages to one another.
Collaboration Diagram. The collaboration diagram is a view of the interactions of objects and unlike the sequence diagram that describes the objects, messaging over time, collaboration diagrams display the relationships between objects. Some UML tools can automatically generate collaboration diagrams from sequence diagrams, and vice versa. Collaboration and sequence diagrams express similar information but they display it from different perspectives.
Activity Diagram. The activity diagram is a specialization of the state diagram and it displays the dynamics of a system by showing the workflow. The activity diagram complements the business use case diagram in that it shows the process flow behind the use case.
State Diagram. The state diagram describes the sequence of states that an object goes through during its lifetime. The state diagram displays the events that act upon the object that enables the transition from one state to the next.
The Implementation View
Component Diagram. The component diagram displays the static structure of the implementation view. The component diagram shows the organizations and dependencies of the components, subsystems, and their relationships. The diagram models the interface that can be used to show the externally visible operations of a class or component.
Deployment Diagram. The deployment diagram shows the configuration of run-time processing elements and the software components, processes and objects that execute on them. The deployment diagram can be used for business modeling where employees and organizations are displayed as run-time processing elements and the procedures and documents that they use are displayed as the software components.
Summary and Final Tasks
This lesson addressed the various unified modeling language (UML) diagrams and object-oriented design concepts and was the second of two lessons on object-oriented tools and techniques for system development. This addressed the important skill of object modeling during systems design. We discussed the models limitations of not providing primitives for representing spatial data and provided information of how UML is being enhanced to overcome the limitations of the existing models, thus providing more adequate tools for modeling geographic applications.
Lesson 13: Geospatial Systems Design and Human Factors
This lesson attempts to introduce to you the basic concepts that describe people with respect to designing geospatial technology for them. I describe this aspect of people throughout this lesson by speaking about users. This lesson could easily be a semester-long course on users, human-computer interaction, human factors, or interface design. There is a wide range of issues, and while I cannot cover them all here, you should be prepared by this lesson to learn about these additional issues and know how to put them in context of a geospatial system.
As Tonda Bone and Dena Johnson state in their article, little has been done in the way of delimiting key human factors that mediate an individual’s use of a GIS to solve spatial problems." Understanding the individual factors of interaction should determine how designers approach system development. This lesson addresses the important skill of user interface design. Students learn how to design a spatial system user interface that will provide a means by which the user can interact with the application to process inputs and obtain outputs. The lesson introduces the role of operating systems, Web browsers, and other technologies that impact user interface design. These factors and a number of human interface considerations and guidelines are presented along with several strategy styles for designing the user interface for a system.
Lesson Learning Objectives:
- Distinguish between the types of users.
- Apply human factors to the design of a spatial system.
Questions?
If you have any questions now or at any point during this lesson, please feel free to post them to the Threaded Discussion Forum. (That forum can be accessed at any time by clicking on the Communicate tab, above, and then scrolling down to the Discussion Forum section.)
Checklist
To finish this lesson, you must complete the activities listed below. You may find it useful to print this page so that you can follow along with the directions.
| Step | Activity | Access/Directions |
|---|---|---|
| 1 | Read the lesson Overview and Checklist | You are in the Lesson 13 online content now. The Overview page is previous to this page, and you are on the Checklist page right now. |
| 2 | Bone: Human Factors in GIS Use: A Review and Suggestions for Research [53] | There are three different styles of reading that are referred to in the lessons:
|
| 3 | Geospatial Think-Piece (Template) [2] |
Using Word (or a word processing program compatible with Microsoft® Word), identify and briefly discuss (<200 words): a unique human factor to be considered when designing a geospatial system. Name your file Lsn13_YourName.doc, Please turn-in your document the Lesson 13 Dropbox in ANGEL. What is a “Think Piece”? A “think piece” is a form of writing that is less polished than a formal paper or presentation but more fully developed than an entry in a personal journal. Think pieces are written to discover what an individual is thinking about a particular topic. Within this course, the writing of think pieces is a way of helping learners connect with the subject matter. Within this context, think pieces reduce the grading risk associated with an “all or nothing” term paper and allow the instructor to communicate with learners throughout the semester, to see the evolution of thinking, and to suggest resources that can further the learners’ understanding. What does a Think Piece look like? The starting point for a think piece for this course lie in the author’s immediate past experience. Because think pieces are as much a reflection of one’s ideas, there is no standard or uniform format for a think piece. In other words, each of us is writing from personal experience. We are not claiming to be objective not are we offering prescriptive, how-to, formulas or guidelines. |
| 4 | Read lesson Summary. | You are in the Lesson 14 online content now. Click on the "Next Page" link to access the Summary. |
Revisiting the Payoffs of Understanding the User
Optimizing how people use geospatial systems requires an understanding not only of geospatial technologies used but also of how human beings respond to maps and graphics, how they achieve their goals using devices, and how they come to choose the particular actions they choose. More generally it requires knowing why and how users do what they do when they do it. The payoffs of understanding the user generally falls into three categories.
- Understanding the user can save lives. I do not have a geospatial example but in other areas there are numerous examples illustrating where ignoring the user can lead to loss of life. Understanding the user (i.e., the pilot and air traffic controllers) has made airplanes the safest transportation per passenger. Medicine has numerous examples as well. For example, it was found that for nurses to type in the digits of a drug dose is inherently more dangerous than when users dial them in using a wheel for each digit. When typing, a repeated digit can increase the dosage by a factor of ten. This mistake is just not possible with the dial-based interface.
- Understanding the user can lead to new and better products. Understanding the user can make a system that is more usable, more learnable, and more efficient. For example, the rise of Internet mapping and mashups has to be acknowledged as one of the driving forces in the increase in the use of digital geospatial technologies. Traditional GIS historically targeted formal applications that require an informed user. By contrast, the web's new neogeography tends to apply to the areas of approachable, colloquial applications. The two realms can have overlap as the same problems are presented to different sets of users: experts and non-experts.
- Understanding the user can save money. Designing to support users can save development and use cost. One of the best known examples comes from Nynex, the New York telephone company in the early 1990's. The toll and assistance (T AO) operators are the people who help you when you dial "0". They help customers with collect calls, billing, and other more complex calls. In the early 1990's Nynex was considering upgrading their T AO workstation. They had a room with about 100 of these operators located on the East Coast and it was believed that new graphical user workstations could improve productivity. The cost of upgrading all the workstations was going to be about $500,000. To be on the safe side, they had a team of applied psychologists look at just how much faster the new workstations would be. Their analysis suggested that the new workstations would not be faster, but would, in fact, be 4% slower to operate. This may seem like a small difference, but a 4% reduction in productivity was going to cost Nynex $2.4 million a year - in addition to the cost of the workstations. Of course, Nynex did not find it easy to accept this analysis, and so they ran a user study to discover how much faster the new workstations would really be. After allowing time for the operators to learn the workstations, the operators' performance plateaued about where it was predicted - 4% slower. NYNEX now claims that this study saved them $2.4 million per year. It's been ten years since the analysis and the user study - a study that paid for itself in the first week (Gray, John, & Atwood, 1992; Gray, John, & Atwood, 1993).
However, understanding the user does not guarantee success. Getting the usability right may increase the time to get the product to the market, it may make the price inappropriate, or reliability may be poor. Likewise, systems with poor usability can still be successful since they may offer a functionality that is unique. DOS computers, shoebox-size satellite phones, and command line GIS interfaces were all difficult to use, but successful because of their unique functionality.
When do you need to study the user? As early as possible! It is a well known and true statement in the area of design that changes to a design cost much more later in the process. The take-away message from this lesson should be that support for the users and their tasks should be incorporated from the start. Having said this, it is particularly important to get the users involved early when:
- There are lots of them or they are uniquely important
- You (the designer) are not like them
- Lives are at risk
Summary and Final Tasks
The lesson is a primer in the critical and reflective questions about how geospatial systems users work with the technology being created. While there is some discussion, the lesson's focus is not about interface technologies since the choice of the technology changes rapidly. You learned how to design a system user interface that provides a means by which the user can effectively interact with the application to process inputs and obtain outputs. These unique geospatial factors and a number of human interface considerations and guidelines are presented. You will be presented with several strategy styles for designing the user interface for a system.
In summary, the purpose of the human factors (HF) practice in geospatial systems design is to ensure the usability of tools, devices and artifacts in general. More specifically, human factors are concerned with providing a good “fit” between people and their work environments. The “fit” can be made in either direction. You can “fit” the environment to the person or we can fit the person to the environment. Therefore, ultimately HF work is a trade-off between considering the user and economic and political constraints. Key points are:
- HF is concerned with fitting the environment to the person.
- HF is a human centered design philosophy.
- HF in design is complemented with consideration of worker selection and training.
- Design decisions have consequences for the user's behavior/performance.
- "Errors" and "mistakes" may often be circumvented by good design.
- Often design decisions are made on the basis of perceived need and market forces which drive a focus on functionality and not suitability and learnability.
- Design options are enormous, although a number of factors reduce the design options: e.g. standards, cost, and time.
- There are always constraints and trade-offs involved in design.
- Human adaptability is incredible, but it comes with a cost of time and mental and physical resources.
Lesson 14: Evaluating GIS Systems
In our very first lesson, we introduced the concept that GIS System Analysis & Design was an iterative process that featured multiple stages and should include evaluation components at each step whenever possible. In this lesson, we will focus specific attention on methods and techniques for evaluating GIS systems. Such techniques include methods you might already be familiar with - surveys, interviews, and focus groups. But the range of available evaluation methodologies also includes a variety of technology-enabled methods to automatically capture usage statistics and to capture/visualize what users see on a screen, for example.
In this lesson, you will have the chance to learn about some common methods for evaluation, and you will also have the opportunity to do a bit of research on your own to discover what else is available. Every year brings substantial innovation in the human-computer interaction community - and it usually takes some time for such innovations to trickle down into what is used to evaluate GIS systems specifically.
Objectives
At the successful completion of Lesson 13, students should be able to:
- Develop an understanding of the methods and tools associated with evaluating a GIS
- Review the technology trend of eye-tracking and discuss how it relates to GIS Design
- Complete a research assignment to identify available tools and techniques for evaluating a GIS
- Continue making progress toward completion of Team Project
Questions?
If you have any questions now or at any point during this lesson, please feel free to post them to the Threaded Discussion Forum. (That forum can be accessed at any time by clicking on the Communicate tab, above, and then scrolling down to the Discussion Forum section.)
Checklist
To finish this lesson, you must complete the activities listed below. You may find it useful to print this page so that you can follow along with the directions.
| Step | Activity | Access/Directions |
|---|---|---|
| 1 | Read the lesson Overview and Checklist | You are in the Lesson 14 online content now. The Overview page is previous to this page, and you are on the Checklist page right now. |
| 2 | "Usability Engineering for GIS: Learning From a Screenshot [55]" by Muki Haklay and Antigoni Zafiri (Read) On line material (Read) Review PowerPoint [56] |
There are three different styles of reading that are referred to in the lessons:
|
| 3 | Geospatial Think-Piece (Template) [2] |
Using Word (or a word processing program compatible with Microsoft® Word), identify and briefly discuss (<200 words): What circumstances in which you might employ the methods tested by Haklay and Zafiri? Name your file Lsn14_YourName.doc, Please turn-in your document the Lesson 14 Dropbox in ANGEL. What is a “Think Piece”? A “think piece” is a form of writing that is less polished than a formal paper or presentation but more fully developed than an entry in a personal journal. Think pieces are written to discover what an individual is thinking about a particular topic. Within this course, the writing of think pieces is a way of helping learners connect with the subject matter. Within this context, think pieces reduce the grading risk associated with an “all or nothing” term paper and allow the instructor to communicate with learners throughout the semester, to see the evolution of thinking, and to suggest resources that can further the learners’ understanding. What does a Think Piece look like? The starting point for a think piece for this course lie in the author’s immediate past experience. Because think pieces are as much a reflection of one’s ideas, there is no standard or uniform format for a think piece. In other words, each of us is writing from personal experience. We are not claiming to be objective not are we offering prescriptive, how-to, formulas or guidelines. |
| 4 | Read lesson Summary | You are in the Lesson 14 online content now. Click on the "Next Page" link to access the Summary. |
Why Evaluate?
Evaluating GIS Tools and Systems
We previously focused attention on a design process for GIS that involves needs assessment, concept development, prototyping, and implementation. Underlying each stage is a focus on evaluation - with the implication that evaluation is something that occurs during and between each stage of design.
Evaluation is needed to ensure that the progress made between design stages is based at least in part on input from end-users or customers. Rather than testing out the system with users at the very end of the process, you test in each of the stages along the way to add/subtract features and capabilities according to user needs. Failing to evaluate "along the way" can result in wasted effort if fully implemented systems must be fundamentally revised based on user feedback gathered at the end of design and development.
What is Evaluation?
Evaluation is typically categorized into two broad areas: formative evaluation and summative evaluation. Formative evaluations focus on developing and refining designs. Summative evaluations compare an implemented system to an alternative system with the goal of measuring differences in performance or user satisfaction between the two systems. Quite often, formative evaluations happen in the early/middle stages of a design exercise and summative evaluations take place toward the end when a system has been implemented.
Common methods used in both types of evaluation include:
- Heuristic examinations [57] - measure user responses to the system based on a set of common system design criteria
- Surveys - use open or close-ended questions to identify system needs or areas for improvement
- Focus groups [58] - involve group discussion of design options, user experiences, or other topics to inform or critique a design
- Interviews - make use of one-on-one questioning with users or customers to explore design options or gather feedback on tools
- Card-sorting [59] - is an activity in which users organize system tools / functions using paper cards to suggest interface organization
- Expert evaluation - has system design and usability experts critique designs, prototypes, or final systems
- Field Exercises - put the system through a "test run" using realistic data, scenarios, and tasks
- Cost-Benefit Analysis [60] - uses metrics to measure the costs of developing/using a system versus the benefits associated with its products
I have provided links to additional content explaining some of the evaluation methods that may not be familiar to you. Check them out!
Formal vs. Informal Evaluation
Not everyone can afford to spend time & money on conducting in-depth evaluations at each stage of the design process while developing a new GIS system. Like everything else associated with GIS system design, trade-offs are involved and it is important for you, the designer, to figure out how to balance the need to make sure your progress is meaningful against the need to make progress toward the final system.
A distinction used quite often is to characterize evaluation efforts as formal or informal depending on the degree to which the evaluation activity makes use of rigorous methods to ensure unbiased participants, sound methodology, and careful analysis of results. An informal evaluation might make use of a few of your coworkers to look over a prototype design, while a formal evaluation could involve a dozen real end-users who complete a realistic exercise using the new GIS system and complete a post-activity interview and survey to gather structured and unstructured feedback.
The point here is that there are times when an informal evaluation will help you make progress on design and development goals, but there will come a time when you really want to conduct something formal to measure your success.
Technology Trends: Eye Tracking*
Eye tracking is a technology that is becoming more and more popular for use in software evaluations. Eye tracking makes use of infrared and other types of sensors to detect and track where a user looks while working. Modern eye tracking equipment can be mounted underneath the computer screen to face the user, or can come in head-mounted configurations. Eye tracking studies typically involve task analysis of one type or another, with the goal of capturing what users saw while they were completing their work. Analysis of eye tracking data can reveal which parts of an interface a person spent the most time using, which parts they missed entirely, and which areas of an analytical graphic were studied the most to inform analytical conclusions.
One challenge associated with eye tracking is that it generates a tremendous volume of data in a very short amount of time, so often there is substantial effort involved with analyzing the results of eye tracking studies. Using eye tracking along with other common usability methods (talk aloud protocols in particular) is quite popular, as eye tracking can provide insight into what someone was looking at, while verbal reports and other methods can reveal what the user was thinking at the time.
The first video (2:13) I'd like you to look at is a short demonstration on how eye tracking works and what some of the common outputs look like: Eye Tracking Demo [61]. Next, I'd like you to look at another short (1:56) video describing how eye tracking can be used specifically for usability studies. Both videos this week are from marketing materials, so keep that in mind as you watch: Tobii Usability Eye Tracking [62].
* Content derived from Geog 583, GEOG 583: Geospatial Systems Analysis and Design [63], which is part of Penn State's OER initiative. Author/Instructor: Anthony Robinson.
Summary
In this lesson, we have taken a look at the range of evaluation methods available for gauging the results of each step in GIS Design. As you have seen, there are lots of types of evaluation, and evaluations can be formal or informal depending on the time/capital resources you have at your disposal. There are simple low-cost methods you can use that require no technology at all, and there are more advanced methods that require substantial technology investments. In our reading assignment, you encountered a couple (quite different) academic studies on evaluating GIS systems that hopefully suggest some good ideas (and some limitations) you can take to heart with respect to evaluations you might conduct in your future work.
Lesson 15: Capstone
The overarching purpose of the Capstone Project is for you to demonstrate your ability to identify and rapidly investigate a real-world problem using the analytic techniques and tools introduced during your past coursework.
Lesson Learning Objectives:
- Utilizing the concepts you learned, perform an analysis to define the requirements of a geospatial system.
- Develop a system requirements specification document following the provided Project Template [64].
- Present your system requirements specification.
Questions?
If you have any questions now or at any point during this lesson, please feel free to post them to the Threaded Discussion Forum. (That forum can be accessed at any time by clicking on the Communicate tab, above, and then scrolling down to the Discussion Forum section.)
Checklist
To finish this lesson, you must complete the activities listed below. You may find it useful to print this page so that you can follow along with the directions.
| Step | Activity | Access/Directions |
|---|---|---|
| 1 | Read the lesson Overview and Checklist | You are in the Lesson 15 online content now. The Overview page is previous to this page, and you are on the Checklist page right now. |
| 2 | There are three different styles of reading that are referred to in the lessons:
|
|
| 3 | Read lesson Summary | You are in the Lesson 15 online content now. Click on the "Next Page" link to access the Summary. |
| 4 | Continue Capstone Activity | Complete:
|
| 5 | Complete the Final Exam (Individual Work) | Instructions and review questions are accessed on the Course Outline. The examination is found in the FINAL EXAM folder under the ANGEL Lessons Tab. The examination is timed (1 hour) and individual work. |
Summary
Based on the detailed analysis, the new database was designed. Our example was extremely simplified and compressed. Normally, the design proceeds in two stages:
- Logical design
- Physical design
In the Logical Design, the features of the new system are specified. The costs of implementing these features and the benefits to be derived are estimated. If the project is still considered to be feasible, we move to the detailed design stage. In the Physical Design stage, computer oriented work begins in earnest. At this stage, the design of the system becomes more structured.