GEOG 469 Course Outline
Lesson 1 - Roles of GIS in Energy System Siting Decisions
Is ArcGIS Pro Installed on your computer?
We will begin using this software next week. If you have not yet received your free copy, please contact our Program Assistant immediately, Susan Spaugh, at sns4@psu.edu [1] or toll-free (U.S.) at 877-713-7778!
An Overview of Lesson 1
Geographic Information Systems (GIS) have evolved to the point where they are now being used in almost every segment of the economy. A familiarity with GIS and how GIS can be leveraged to solve business, engineering, environmental, and social problems is a skill that is in demand in all business sectors. In the energy sector, GIS is used to assist with the siting of new generation facilities, help determine the optimum route for new transmission and distribution lines, to determine demographic changes as part of long-range planning, and to develop emergency evacuation plans around nuclear-generating facilities, just to name a few. The problem-solving potential for the use of GIS in the energy sector is unlimited.
What will we learn in Lesson 1?
In this lesson, we will introduce GIS and learn about its history, the hardware and software requirements to make it operate, and the sources of software, from free/open-source to commercially available programs. By reading the referenced case study, we will see how GIS is used in the siting of an electric transmission line.
By the end of this lesson, you should be able to:
- identify and describe the key components of a GIS framework, including:
- hardware and software requirements,
- types of geographic/spatial data,
- publicly available software;
- critically evaluate the use of GIS in an energy system siting decision;
- discuss the benefits and drawbacks of an energy system siting public participation study.
What is due for Lesson 1?
This lesson will take us one week to complete. Please refer to the Calendar for specific time frames and due dates. Specific directions for the assignments below can be found in this lesson.
- Take a short quiz.
- Engage in a class discussion of the case study.
Questions?
If you have any questions, please post them to our Questions? discussion forum. I will check that discussion forum daily to respond. While you are there, feel free to post your own responses if you, too, are able to help out a classmate.
Definition and Characteristics of GIS
GIS is defined as an:
Acronym for Geographic Information System--an integrated collection of computer software and data used to view and manage information about geographic places, analyze spatial relationships, and model spatial processes. A GIS provides a framework for gathering and organizing spatial data and related information so that it can be displayed and analyzed.
[URL:http://resources.arcgis.com/glossary/term/533 [2]. Accessed: 2010-05-19. (Archived by WebCite®at http://www.webcitation.org/5pqO1iWZ4)] [3]
GIS is used in engineering, environmental science, land surveying, urban planning, emergency management, business intelligence, and Web mapping applications. As GIS becomes more mainstream, more applications and uses are being introduced. As society becomes more mobile, GIS and GIS applications are finding their way to smartphones, tablet PCs, and other Wi-Fi connected devices.
Applications make up the heart of a GIS. These applications are used to edit data, create queries on data, model and analyze geospatial relationships, and create and display maps. Web-based applications such as Google Earth [4] have revolutionized how we edit, view, and display geospatial information.
Watch this!
The following Penn State video (5 minutes) gives you a good introduction to GIS, its uses, and capabilities.
Click for a transcript of "Penn State" video.
KASS GREEN, American Society for Photogrammetry & Remote Sensing: Say you're in California, where I live, and you want to know how susceptible your house is to a wildfire.
[SIRENS]
So we put sensors, like our eyes, on satellites. We collect information, and then computers create maps. OK, now you have a map, so you want to analyze that map. Well, you'll take the information about the slope. Are you on a dead-end street? Do you have a lot of fuel around your house? You put all that information into a computer. And it can tell you how at risk you are for losing your home to a wildfire.
MARK BRENDER, GeoEye: Ever since the Babylonians etched the lay of the land on clay tablets in 2300 BC, mankind has needed accurate representations of the earth.
KASS GREEN: Maps used to be made on horseback in the 1800s. They took a long time to make, so we evolved to aerial photography, and that's made a huge difference with how humans understand the earth.
[PILOT'S VOICE]JACK DANGERMOND, ESRI GIS & Mapping Software: In the '60s, people began to think about the notion of encapsulating or abstracting geography in a computer. And people could look at the database and visualizations or analytics. And that was just a magical idea.
[CROWD CHEERING]
PRESIDENT OBAMA: I, Barack Hussein Obama, do solemnly swear that I will preserve, protect, and defend the Constitution of the United States.
CHIEF JUSTICE ROBERTS: So help you God?
PRESIDENT OBAMA: So help me God.
CHIEF JUSTICE ROBERTS: Congratulations, Mr. President.
KASS GREEN: They knew what voters to target. They knew where the marginal voter was. And, frankly, the ones that use it the most effectively get elected.
MARK BRENDER: After 9/11, US troops went into Afghanistan, and they went in with Russian maps because who would ever think you'd have to have maps of Afghanistan.
VICE ADMIRAL ROBERT MURRETT: Geospatial intelligence has become really the foundation for just about anything that happens in the military. It has to do with understanding in a very time-sensitive fashion things that may be developing in different parts of the world.
HON. JAMES R. CLAPPER: It's the ability to enable decision makers, whether they're someone sitting in the White House or someone sitting in the foxhole.
MARK BRENDER: More than half the world's population now lives in urban areas. Thirteen of the 20 largest cities are on coastlines. So how do you model in potential rise of sea level because of climate change?
RICHARD ALLEY, Geoscientist, Nobel Prize Winner, Penn State: We simply could not know how the earth works without geospatial technologies telling us where things are, how they're related, how it's put together to tell us the story of what really is happening.
SCOTT EDWARDS, Amnesty International: The conflict in Darfur is over five years old now. Somewhere around 400,000 people have died. We wanted to go to the place, collect testimony, take photographs. The Sudanese government had very little interest in having us on the ground. So we purchased satellite imagery, and we saw whole villages destroyed. We took those images to the Sudanese government to let them know that people around the world were watching these villages remotely.
DAVID DIBIASE, Mapping Scientist, Penn State: For the insiders, the transition to digital geography has been truly revolutionary. We can navigate our world with much greater confidence then we could have before. It's changed the science agenda. It's changed the technology. It's created new occupations. But for those outside, who may not even be aware that there is a field called geospatial, it has made geography ordinary, which is the most revolutionary thing of all.
Reading Assignment
Other definitions of GIS have also been offered as alternatives. Review example definitions [5] collected by Kenneth E. Foote and Margaret Lynch from the Department of Geography, the University of Texas at Austin.
USGS [6] defines GIS as "... a computer system capable of capturing, storing, analyzing, and displaying geographically referenced information; that is, data identified according to location. Practitioners also define a GIS as including the procedures, operating personnel, and spatial data that go into the system.
Characteristics or Components of a GIS
A GIS consists of five components or characteristics:
- hardware
- software
- data
- people
- applications
The combination of these five characteristics makes a GIS. Without all these components, a GIS would have limited value as a tool for analyzing and characterizing spatial information.
Reading Assignment
- Read "What are the Parts of a Geographic Information System? [7]" to learn more about these five components.
- Learn more about data representation [8]at Wikipedia, including the sections titled "Raster," "Vector," "Advantages and Disadvantages," and "Non-spatial Data."
- Use of GIS for Efficient Transmission Line Siting. [9]
Lesson Assignment
An Example of a Case Study
We will see how GIS is used in siting an electric transmission line by reading the referenced case study. This case study uses GIS to evaluate the best alternative for a proposed electric transmission line. The purpose for reading this case study is to familiarize you with a typical energy industry siting problem and with how GIS is used in the evaluation process.
Discussion Activity Directions
Start by reviewing the "Transmission Line Siting Report [10]” case study. (34 Mb -- The report is 116 pages long...but don't panic!). The project is dated, but the concepts, approach and decision making used in this report are the same used today.
- Scan the entire document to familiarize yourself with the siting process.
- Read the Executive Summary and Sections 1.0 through 4.5 in detail. As you read, consider the following questions:
- Why do you think the Archeological and Natural Heritage Sites are not published?
- Why is it important to involve the public early on in the siting process?
- Only 12.6 percent of the residents either responded to the siting questionnaire or attended the siting workshop.
- What do you believe caused the other 87.4 percent to not respond, even though this project may have had a direct impact on them? What is the basis for your answer?
- If the public is so concerned about siting and Not in My Back Yard (NIMBY), why do you think there was such a small response?
- In what other ways could utility planners increase awareness and participation?
- Based on the results of the workshop, do you believe this public participation strategy successfully addresses public concerns? Would you consider this to be a model for how public participation should be conducted? If not, what changes would you suggest to improve the process?
- What if Route G was in the middle from a cost standpoint. Do you believe the utility would have selected Route G, even though it was clearly the best alternative to minimize environmental/cultural/visibility impacts? Why or why not?
Now it is time to discuss your observations. Your initial post must be posted by Wednesday evening.
Go to the "Lesson 1 GRADED Discussion - Transmission Line Siting" discussion forum and:
- Post an original answer to two of the questions from above.
- Indicate whether you agree or disagree with what another person posted and why. A useful technique is a 2x2 technique—give 2 instances where you agree with the post and 2 instances where you disagree with the post.
- Ask another person a question.
- Contribute a "war story" that relates to the topic. These can be from your work, volunteering, personal life, or elsewhere.
- Relate a recent news event, article you have read, or something similar to the class.
- Continue the discussion until we have exhausted our debate and/or I have to draw the discussion to a close!
Note
In order for this activity to work, everyone needs to check in to the discussion regularly and participate frequently ...don't procrastinate!Grading Criteria
All students are expected to participate in the questions in their group discussions in a concise, well-organized, and scholarly manner. Saying, “I agree with Jennifer” is not adequate. You need to say why you agree (or disagree) and support your comments. Comments should be based on information obtained from appropriate reference sources, including lesson materials, previous coursework, Web-based information, or personal experience. You must use proper grammar and spelling for all contributions.
Your contributions to this assignment will be graded on a 15-point scale. Look at the discussion rubric [11] for more details about my expectations.
Summary and Final Tasks
As you saw in the video, geospatial technology has made geography an ordinary part of life for those not involved in the geospatial profession. In this lesson, you were introduced to GIS, the role GIS plays in energy-related siting decisions, and GIS software and hardware. Finally, you were asked to review an example of a transmission line siting study to help you understand that process.
As geospatial technologies become integrated into our daily lives, an understanding of what GIS is and how it can be used to solve real-world problems will be an asset you can leverage in your careers. For those who have a desire to explore GIS further and to develop an in-depth knowledge of GIS software and applications, many new and exciting opportunities will be open in business, industry, and government.
Reminder - Complete all of the lesson tasks!
You have finished Lesson 1. Double-check the list of requirements on the first page of this lesson to make sure you have completed all of the activities listed there before beginning the next lesson.
Tell us about it!
If you have anything you'd like to comment on, or add to, the lesson materials, feel free to post your thoughts in the Discussion Forum. For example, what did you have the most trouble with, what was the most surprising, etc.?
Lesson 2 - Major Siting Challenges in the Energy Enterprise, Part 1
An Overview of Lesson 2
The siting of energy distribution and transmission is a complex maze of political, regulatory, legal, and environmental challenges. It is estimated that by 2035 the demand for new electric transmission lines will increase by 35 percent. In addition, it is estimated the number of oil and natural gas transmission lines will increase by 14 percent by 2030. National Public Radio reported on both energy demand and transmission grid needs in a series of 2009 articles on reinventing the U.S. power grid with an interactive presentation [12] visualizing the U.S. electric grid.
In this lesson, we learn how the electrical transmission system works in the United States. Specifically, we will learn how it originated, how federal government regulations have influenced the development of the transmission grid, how siting criteria from state to state varies, and some of the major problems we have experienced with the grid over the years.
What will we learn in Lesson 2?
By the end of this lesson, you should be able to:
- explain the history of the electrical transmission system;
- explain how and when the system originated;
- explain how the oil, natural gas, and gasoline pipeline transmission system operates;
- discuss the major issues undermining the reliability of the electrical transmission system.analyze and be able to discuss the major roadblocks to expanding the U.S. electrical grid and natural gas pipelines;
- analyze and be able to discuss the major roadblocks to expanding the U.S. electrical grid and natural gas pipelines;
- learn the basic operations of the Esri ArcGIS Pro system by meeting all of the requirements of the "Getting Started with ArcGIS Pro" Esri training;
- reflect on what you learned through the ArcGIS training courses.
What is due for Lesson 2?
This lesson will take us one week to complete. Please refer to the course Calendar for specific time frames and due dates. Specific directions for the assignments below can be found within this lesson.
- Take the Lesson 2 Quiz.
- Participate in the class discussion: What do you see as the major roadblocks to expanding the U.S. electrical grid and natural pipelines?
- Begin the "Getting Started with ArcGIS Pro" Esri training (due by the end of Lesson 4).
- Take the Introduction to ArcGIS Reflection Quiz once you have completed all of the courses (due by the end of Lesson 4).
Questions?
If you have any questions, please post them to our Questions? discussion forum. I will check that discussion forum daily to respond. While you are there, feel free to post your own responses if you, too, are able to help out a classmate.
Electric Transmission and Distribution Network
The electric grid in the United States is a complex maze of more than 150,000 miles of high-voltage transmission lines fed by more than 5,400 generating facilities.
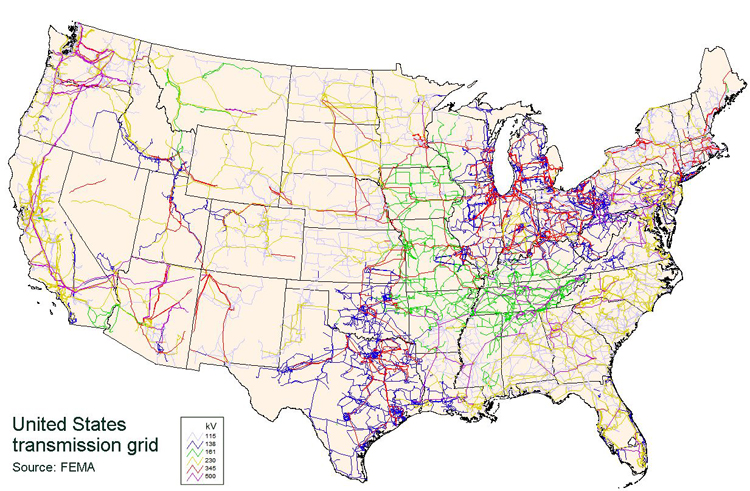
Figure 2.1: United States Electrical Grid
Credit: FEMA
There are four major utility types responsible for the generation and transmission of electricity in the United States. These types include investor-owned utilities, public utilities, electric cooperatives, and non-utility power producers. The largest amount of energy in the United States is generated by investor-owned electric utilities, which accounts for about 73 percent of the total electric power generated. Public utilities made up of federal, state, and local governments are the second-largest type of electric power generators, generating about 14 percent of the total electric power. Electric cooperatives provide an additional 12 percent of the total electric power generated, followed by the non-utility power producers, making up the remainder of the total. In contrast, non-utility power producers are the largest in number (2,100), followed by public utilities (2,000), electric cooperatives (930), and then investor-owned utilities (213).
There was no master plan in place for the grid; it evolved over time as the demand for electricity increased. To meet this ever-growing demand, utilities established links with their neighboring utilities to provide power where it was needed. Utilities realized they needed to improve reliability. They also realized that economies of scale could be leveraged by linking the transmission lines.
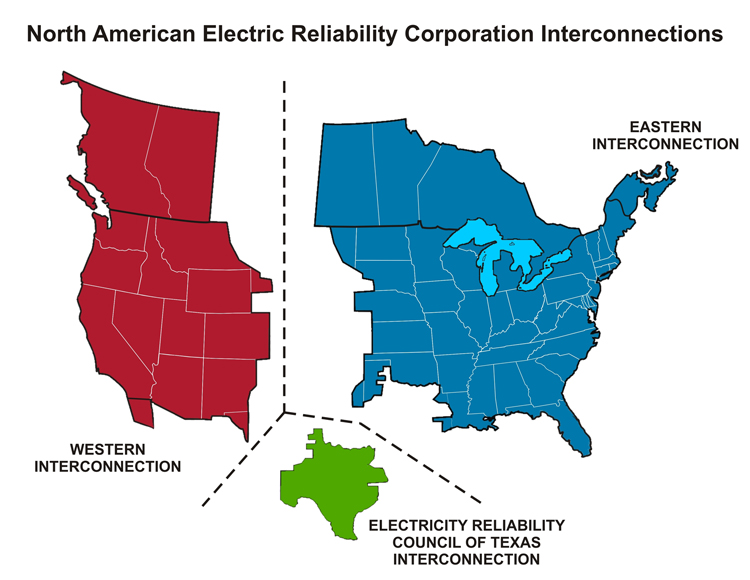
A huge Northeast blackout occurred in 1965 (see why: Northeast Blackout of 1965 [13]), and as a result, much of the grid control shifted to regional operations. This regional framework consists of the Eastern Interconnection, the Western Interconnection, and the Texas Interconnection. These interconnections maintain connections with Canada and Mexico. Overall reliability planning and coordination of the electric grid is provided by the voluntary North American Electric Reliability Council (NERC), created after the 1965 Northeast blackout. NERC functions to "develop and enforce reliability standards; assess reliability annually via 10-year and seasonal forecasts; monitor the bulk power system; and educate, train, and certify industry personnel." (NERC Website) [14]
To meet future demands for electricity, the current generation and transmission system requires heavy investment in new, conventional, and alternative generation, including efficiency improvements. In concert with this new investment in generation comes a similar need to upgrade and expand in next-generation transmission and distribution systems. The current transmission and distribution system is congested because of the growing demand for electricity, poor planning, and insufficient investment to keep pace with changes. A consequence of this lack of planning prohibits the planned outages necessary for routine maintenance, which can lead to system-wide failures in the event of unplanned outages.
Oil, Gasoline, and Natural Gas Pipelines
Based on petroleum supply estimates from the Energy Information Administration [16], oil and petroleum products consumed in the United States totaled 7.284 billion barrels in 2017, and increase of 1% from 2016. Petroleum used for electrical generation accounted for 0.5 percent of that total. The remainder of the consumption included transportation (70.3 percent), industrial (24.2 percent), and residential and commercial (5.0 percent) (Statistica.com [17]).
Figure 2.3: United States Natural Gas Pipeline Network
Credit: Energy Information Administration
The Energy Information Administration [18] records show total natural gas consumption in 2017 totaled 27,110,271 million cubic feet. Of that total, 24,824,283 million cubic feet was delivered to the final consumer. Consumption used for electrical generation accounted for 9,250,066 million cubic feet or 37.2 percent of this total, residential use consumed 17.6 percent and industrial use consumed 32.0 percent. The remainder of the total (13.2 percent) was used for commercial and vehicle purposes (EIA: Natural Gas Consumption by End-Use [19]).
Similar to the electric transmission grid, the current oil and natural gas transmission infrastructure was not designed to meet the expected rate of natural gas consumption growth that the nation will see in the next decade. More than 90 percent of all planned new power generation in the United States will be fueled by natural gas. Almost all small, supplemental back-up generating units (such as those used by hospitals and schools) are powered by natural gas.
According to a report of recommendations prepared by the National Association of Regulatory Utility Commissioners (NARUC), one of the key challenges to energy availability is an adequate natural gas pipeline and distribution system to provide an ever-increasing gas demand across the country. The National Petroleum Council (NPC) estimates over 38,000 miles of new transmission lines will be needed, as well as 263,000 miles of new distribution lines. That much pipeline will require the attention of every state, and many regulatory bodies within the states. It will also require the attention of the Federal Energy Regulatory Commission (FERC), the Bureau of Land Management (BLM), the U.S. Forest Service, and many other federal entities.
The efficient and effective movement of natural gas from producing regions to consumers requires an extensive transmission system. In many instances, natural gas produced from a particular well will have to travel a great distance to reach its point of use. The transmission system for natural gas consists of a complex network of pipelines, pumping stations, and storage facilities. The transmission of natural gas is closely linked to its storage. When natural gas demand is low, it can be put into storage facilities until needed.
Natural gas pipelines include pipelines used in the gathering system, and in interstate transmission and final distribution. The gathering system consists of low-pressure, low-diameter pipelines that transport raw natural gas from the wellhead to the processing plant.
Pipelines can be characterized as interstate or intrastate. Interstate pipelines carry natural gas across state boundaries, in some cases, across the country. Intrastate pipelines, on the other hand, transport natural gas within a particular state. We will focus on the fundamentals of interstate natural gas pipelines, because the technical and operational details discussed are essentially the same for intrastate pipelines.
Natural gas pipelines are subject to regulatory oversight, which in many ways determines the manner in which pipeline companies must operate.
Want to learn more?
See the following sites to learn more about the
- storage of natural gas [20],
- processing of natural gas [21],
- regulation of natural gas [22], and
- fracking [23]
Interstate pipelines are the 'highways' of natural gas transmission. Natural gas that is transported through interstate pipelines travels at high pressure in the pipeline, at pressures anywhere from 200 to 1500 pounds per square inch (psi). This reduces the volume of the natural gas being transported (by up to 600 times), as well as providing propellant force to move the natural gas through the pipeline. For more information on interstate pipelines in general, visit the website of the Interstate Natural Gas Association of America.
The Federal Energy Regulatory Commission [24](FERC) and other Federal agencies are encouraging and sometimes requiring interstate natural gas pipeline operators to use existing rights-of-way (ROW), where possible when proposing routes for new construction. This is occurring throughout the country, even in more rural, sparsely populated areas.
What Can Happen When Something Goes Wrong?
The PJM Network Failure
Let's look at a real-life example of what can go wrong. The following excerpt, describing a PJM Network failure, was taken from a July, 2010, National Geographic Magazine article. PJM Interconnection is the regional transmission organization that coordinates the movement of wholesale electricity in all or parts of 13 eastern states and the District of Columbia.
August 14, 2003. Most of PJM's network escaped the disaster, which started near Cleveland. The day was hot; the air conditioners were humming. Shortly after 1 p.m EDT, on August 14, 2003, grid operators at First Energy, the regional utility, called power plants to plead for more volts. At 1:36 p.m. on the shore of Lake Erie, a power station whose operator had just promised to "push it to my max max" responded by crashing. Electricity surged into northern Ohio from elsewhere to take up the slack.
At 3:05 a 345-kilovolt transmission line near the town of Walton Hills picked that moment to short out on a tree that hadn't been trimmed. That failure diverted electricity onto other lines, overloading and overheating them. One by one, like firecrackers, those lines sagged, touched trees, and short-circuited.
Grid operators have a term for this: "cascading failures." The First Energy operators couldn't see the cascade coming because an alarm system had also failed. At 4:06 a final line failure sent the cascade to the East Coast. With no place to park their electricity, 265 power plants shut down. The largest blackout in North American history descended on 50 million people in eight states and Ontario.
At the Consolidated Edison control center in lower Manhattan, operators remember that afternoon well. Normally the power load there dips gradually, minute by minute, as workers in the city turn off their lights and computers and head home. Instead, at 4? p.m. lights went out in the control room itself. The operators thought: 9/11. Then the phone rang, and it was the New York Stock Exchange. "What's going on?" someone asked. The operators knew at once that the outage was citywide.
There was no stock trading then, no banking, and no manufacturing; restaurants closed, workers were idled, and everyone just sat on the stoops of their apartment buildings. It took a day and a half to get power back, one feeder and substation at a time. The blackout cost six billion dollars. It also alarmed Pentagon and Homeland Security officials. They fear the grid is indeed vulnerable to terrorist attack, not just to untrimmed trees.
Full text available at National Geographic. [25]
Since 1990, electric demand has increased by about 25 percent, while expansion of existing transmission infrastructure has decreased by about 30 percent over this same time period. While annual investment in new transmission facilities has generally declined or been stagnant during the last 30 years, substantial investment in generation, transmission, and distribution are expected over the next two decades. Both industry and government estimate that electric utility investment needs could be as much as $1.5 to $2 trillion by 2030. Some progress in grid reinforcement has been made since 2005, but public and government opposition, difficult permitting processes, and environmental requirements are often restricting the much-needed modernization.
In a congestion study [26] prepared by the U.S. Department of Energy, congested transmission paths now affect many parts of the grid across the country. One recent estimate concludes that power outages and power quality disturbances cost the economy between $25 billion and $180 billion annually. These costs could soar if outages or disturbances become more frequent or longer in duration. There are also operational problems in maintaining voltage levels. Again, an excerpt from the National Geographic Magazine article shows just how little tolerance there is in maintaining a reliable voltage in the system:
PJM engineers try to keep the current alternating at a frequency of precisely 60 hertz. As demand increases, the frequency drops, and if it drops below 59.95 hertz, PJM sends a message to power plants asking for more output. If the frequency increases above 60.05 hertz, they ask the plants to reduce output. It sounds simple, but keeping your balance on a tightrope might sound simple too until you try it. In the case of the grid, small events not under the control of the operators can quickly knock down the whole system.Full text available at National Geographic. [25]
Many new transmission lines have been proposed to either alleviate congested paths or to provide redundancy so that existing portions of the transmission system can be temporarily taken out of service for proper maintenance and modernization. In many cases, funding is not the primary reason why these critical lines are not being built. Overly stringent permitting requirements, lawsuits, and other regulatory issues often inhibit transmission line construction.
Just as high voltage transmission needs have increased, so has the need to increases distribution. Distribution includes the system of substations, wires, poles, metering, and billing involved in delivering electricity to the consumer. The need to expand the distribution infrastructure and install new distribution equipment to meet population and demand growth will require continued investment. It is estimated that electric companies will spend $14 billion per year on average over the next 10 years on distribution investment. Over the next decade, distribution investment is likely to exceed capital spending on generation capacity as well.
Lesson Activity: Getting Started with ArcGIS Pro
Knowing how to use GIS software is an important skill to have in your professional portfolio, because GIS is used by business, industry, and government to solve complex geospatial problems such as location based services, vehicle routing, complex business analytics, and tracking the latest disaster. As the use of geospatial information becomes more widespread, those who have a good understanding of GIS will be a valuable asset to any organization.
Activity Part 1
For this activity, you will complete the "Getting Started with ArcGIS Pro" Esri online GIS training course.
This tutorial will give you the essentials needed to complete the term project that will begin in Lesson 9. These essential concepts will jumpstart your productivity with ArcGIS Pro. This course introduces the ribbon-style interface, project-based organization, key capabilities, and ArcGIS Pro terminology.
Learning Objectives:
- After completing this course, you will be able to perform the following tasks:
- Identify the components of the ArcGIS Pro interface.
- Create a project in ArcGIS Pro.
- Use editing tools in ArcGIS Pro to modify or create vector data.
- Use geoprocessing tools in ArcGIS Pro to analyze data.
- Use the Raster Functions pane in ArcGIS Pro to visually analyze raster data.
- Use ArcGIS Pro to share a project.
Accessing and completing the tutorial
- Go to the Esri Academy [27] (www.esri.com/training/ [27]) and log in with your Esri username and password to go to the Esri Training page.
- Use the search function to search for the course “Getting Started with ArcGIS Pro”.
- Select "Support & Training" in the top menu.
- Select the “Getting Started with ArcGIS Pro” course from the list to begin.
- Read the overview and then select the "Launch Course" button.
- Follow the course outline on the left sidebar to navigate and complete the course.
- Print or save a copy of the Certificate of Completion to a place where you can easily locate it.
Activity Part 2
After you have completed the training course take the " Getting Started with ArcGIS Pro" quiz.
Deliverables
By the end of Lesson 4, submit your Certificate of Completion to the Getting Started with ArcGIS Pro Dropbox drop box by the due date indicated on the course calendar.
Grading Criteria
The course completion activity will be graded on a simple pass/fail basis, but it is worth a full 10% of your course grade. You will "pass" by submitting your Certificates of Completion!
Note
The Getting Started with ArcGIS Pro tutorial will take you at least 5 hours and 30 minutes to complete, so schedule your time accordingly. You have three weeks to complete them, so feel free to spread it out. I do not, however, recommend that you wait until the end of Lesson 4 to begin.
Lesson Discussion Assignment
Discussion Activity
For this week, I want to engage you in a whole-class discussion of the following question:
What do you see as the major roadblocks to expanding the U.S. electrical grid and natural gas pipelines?
This discussion will take place in a special discussion forum created for this purpose.
Note
In order for this activity to "work," you will need to participate in this discussion on a daily basis in order to catch up on postings and to contribute your own thoughts.
Directions
- In the discussion forum, post your response to the following question:
- What do you see as the major roadblocks to expanding the U.S. electrical grid and natural gas pipelines?
- Read the postings made by the other GEOG 469 students.
- Respond to at least one other posting by asking for clarification, asking a follow-up question, expanding on what has already been said, etc.
Make sure your posting is meaningful! I do not want to see "I agree" type postings! Your responses should add value to the discussion. - Return to the discussion forum daily to read new postings, answer questions directed specifically to you, and to respond to any other postings of interest with your own questions or thoughts!
Grading Criteria
All students are expected to participate in the questions in their group discussions in a concise, well-organized, and scholarly manner. Saying, “I agree with Jennifer” is not adequate. You need to say why you agree (or disagree) and support your comments. Comments should be based on information obtained from appropriate reference sources, including lesson materials, previous coursework, Web-based information, or personal experience. You must use proper grammar and spelling for all contributions.
Your contributions to this assignment will be graded on a 15-point scale. Look at the discussion rubric [11] for more details about my expectations.
Summary and Final Tasks
In this lesson, you learned about the origin of the grid, how and why it was constructed, and how and why it was regulated. We all take the grid to be a smooth-running invisible operation; but when it fails, we see how it impacts us. Through a real-life example, we saw how a failure in one part of the country can impact individuals and businesses in other parts of the country and how, in fact, the grid is interrelated. Finally, we were exposed to the other major energy transmission system, the interstate pipeline system, and how the siting criteria for this system is very similar to the electric grid.
Reminder - Complete all of the lesson tasks!
You have finished Lesson 2. Double-check the list of requirements on the first page of this lesson to make sure you have completed all of the activities listed there before beginning the next lesson.
Tell us about it!
If you have anything you'd like to comment on, or add to, the lesson materials, feel free to post your thoughts in the Questions? Discussion Forum. For example, what did you have the most trouble with in this lesson?
Lesson 3 - Major Siting Challenges in the Energy Enterprise, Part 2
An Overview of Lesson 3
This week, we will continue our consideration of the major siting challenges in the energy enterprise by reviewing a 10-article series by NPR titled Power Hungry: Reinventing the U.S. Electric Grid. This series will give you an additional overview of the electric grid in the United States and provide you with a backdrop for the challenges in siting criteria we will explore in future lessons.
What will we learn in Lesson 3?
You will learn about the grid history, how "green energy" will impact the grid, how siting new lines will be a significant national challenge, how conservation of energy at all levels of use will become an important component of the smart grid and how the smart grid will assist each of us in regulating our energy use. We will learn the new energy grid could become the 21st Century "National Highway System," and, finally, what will be the price tag for the new smart grid and who will pay for it.
By the end of this lesson, you should be able to:
- define a Smart Grid and smart meters and how they can reduce energy consumption;
- explain what utilities are doing to create a smart grid;
- discuss how renewable energy sources are impacting the current grid infrastructure and what is being proposed to mitigate the impact;
- discuss the challenges of building a new energy economy;
- explain how the new grid will be the "National Highway System" of the 21st Century;
- discuss the real cost for the new grid and who should pay for it;
- Learn the basic operations of the Esri ArcMap system by meeting all of the requirements of the "Learning ArcGIS" and "ArcGIS Essential Training" courses via Lyndia.com;
- reflect on what you learned in the ArcGIS training.
What is due for Lesson 3?
This lesson will take us one week to complete. Please refer to the Calendar for specific timeframes and due dates. Specific directions for the assignments below can be found in this lesson.
- Participate in a class discussion based on the Power Hungry series from NPR.
- Take the Lesson 3 Quiz.
- Continue working on the Esri "Getting Started with ArcGIS Pro" training course (due by the end of Lesson 4).
- Take the "Getting Started with ArcGIS Pro" Reflection Quiz once you have completed the ArcGIS courses (due by the end of Lesson 4).
Questions?
If you have any questions, please post them to our Questions? discussion forum. I will check that discussion forum daily to respond. While you are there, feel free to post your own responses if you, too, are able to help out a classmate.
The Smart Grid
The Smart Grid website is maintained by the Federal government to provide the latest information on the progress of updating the electrical grid to a smart grid system. The smart grid initiative was authorized by Congress under Title XIII of the Energy Independence and Security Act of 2007. The information contained on this smart grid website will give you a comprehensive look at what the Smart Grid is and how the Federal government, working with industry, is bringing the electrical grid into the 21st century.
Required Reading
Learn more about the Smart Grid at SmartGrid.gov [28]
Explore each aspect of the website by clicking on "Read More" under "Recovery Act Projects" and then navigating through each of the topics on the right sidebar of the website.
As you explore the website take time to understand what a smart grid is, how the smart grid is being implemented throughout the country, what efforts are being made to train the next generation of grid technicians and professionals, and what efforts are being implemented to standardize the system and protect it from cyber attacks.
Introducing the Power Hungry Series
The electric grid is interwoven into the fabric of our everyday lives just as the highway systems are. Without a vision and a systematic plan to upgrade and modernize the grid, we will experience outages that compromise our way of life, impact our economy, and jeopardize our security. The National Public Radio series Power Hungry: Reinventing the U.S. Electric Grid presents the history of the grid and the challenges of creating a new, smarter, "green" grid for the future. This series will give you a good introduction to these challenges and what is being discussed to take the grid into the 21st Century, and it will provide an excellent backdrop for the remainder of the course.
Listen to this!
 [29]
[29]The Power Hungry series is a collection of National Public Radio broadcasts that have been placed on the Web and accompanied by text and visuals. Go to the Power Hungry website [29] and read the information and listen to the broadcasts for the entire series. It will take you one hour to listen to all of the broadcasts.
As you read and listen to the series, keep the following questions in mind...we will be discussing these in our lesson discussion assignment!
- What do you think are the major congestion issues Mr. Mansoor of EPRI is referring to, and do you see the utility industry solving these? Do you believe these congestion issues will require a standardized, nationwide transmission siting criteria?
- Many utilities are now looking at installing rooftop solar collection systems on commercial buildings to generate electricity for the commercial entity and store the remainder for the grid. If we can take this one step further—economical, easy-to-install rooftop solar systems for residential use—what do you think the utility industry's response will be? Will they embrace it? Will they attempt to offer the service to homeowners?
- "Eisenhower was a master of military art," McNichol says. "He understood from his readings and history that the best road systems were built by the central government," including the roads built by Rome, Napoleon, and Hitler. Each state transportation department managed its own highway-building program, but the central plan was put forth and managed by the federal government. In today's culture of NIMBY ("Not in My Back Yard"), and congressional gridlock, how do you see the final act of a national grid authority being played out? Should it be a central top-down program managed by the government? Or, should it be managed by the private sector, with minimal government oversight?
- The electric grid may be more important for the country's national security than the federal highway system is. If you accept this premise, then how should the grid be financed? Should it be funded by the federal government, just like the national highway system, or should it be a public-private venture or solely privately funded?
- Currently, wind and solar energy generation have a greater cost per kilowatt hour than other sources of energy such as coal, hydro, nuclear, and natural gas. Do you see the cost of wind and solar dropping to compete with the other sources of energy? If so, why do you believe that will happen? If not, do you believe we will see a "green energy bubble"? What do you see as the major impediment to the mass use of solar and wind energy in the United States?
Lesson Assignment
Discussion Activity
For this week, I want to you answer one of the questions listed below and comment on another student's post. This discussion will take place in a special discussion forum created for this purpose.
Note
Because we will be using an online discussion forum that is asynchronous for this activity, you will need to begin work right away! Be sure to log into your group's discussion forum multiple times over the course of each day this week so that you can keep the discussion going.
Directions
- Post your response to at least two of these questions in the discussion forum
- What do you think are the are the major congestion issues Mr. Mansoor of EPRI is referring to, and do you see the utility industry solving these? Do you believe these congestion issues will require a standardized, nation-wide transmission siting criteria? Explain your answer.
- Many utilities are now looking at installing rooftop solar collection systems on commercial buildings to generate electricity for the commercial entity and store the remainder for the grid. If we can take this one step further – economical, easy-to-install rooftop solar systems for residential use – what do you think the utility industry's response will be? Will they embrace it? Will they attempt to offer the service to homeowners? Explain your answers.
- "Eisenhower was a master of military art," McNichol says. "He understood from his readings and history that the best road systems were built by the central government," including the roads built by Rome, Napoleon, and Hitler. Each state transportation department managed its own highway-building program, but the central plan was put forth and managed by the federal government. In today's culture of NIMBY ("Not in My Back Yard"), and congressional gridlock, how do you see the final act of a national grid authority being played out? Should it be a central top-down program managed by the government? Or, should it be managed by the private sector, with minimal government oversight?
- The electric grid may be more important for the country's national security than the federal highway system is. If you accept this premise, then how should the grid be financed? Should it be funded by the federal government, just like the national highway system, or should it be a public-private venture or solely privately funded?
- Currently, wind and solar generation have a greater cost per kilowatt hour than other sources of energy, such as coal, hydro, nuclear, and natural gas. Do you see the cost of wind and solar dropping to compete with the other sources of energy? If so, why do you believe that will happen? If not, do you believe we will see a "green energy bubble"? What do you see as the major impediments to the mass use of solar and wind energy in the United Sates?
- Read the postings made by the other GEOG 469 students.
- Respond to at least one other posting by asking for clarification, asking a follow-up question, expanding on what has already been said, etc. Make sure your posting is meaningful! I do not want to see "I agree" type postings! Your responses should add value to the discussion.
- Return to the discussion forum daily to read new postings, answer questions directed specifically to you, and to respond to any other postings of interest with your own questions or thoughts!
Grading Criteria
All students are expected to participate in the questions in their group discussions in a concise, well-organized, and scholarly manner. Saying, “I agree with Jennifer” is not adequate. You need to say why you agree (or disagree) and support your comments. Comments should be based on information obtained from appropriate reference sources, including lesson materials, previous coursework, Web-based information, or personal experience. You must use proper grammar and spelling for all contributions.
Your contributions to this assignment will be graded on a 15-point scale. Look at the discussion rubric [11] for more details about my expectations.
Summary and Final Tasks
In this lesson, you were introduced to a great NPR production about the electric transmission grid in the United States. This 10-part series took you from an aged grid looking for a brighter future to a new grid and habits. Along the way, you read about how the grid evolved, the problems the grid has in meeting current and future demands, and how those demands will require a reinvention of the grid as we know it. I hope you came away with a better understanding of how the grid operates and how important a modern grid is to the security and economic viability of not only the United States but also to every industrialized nation in the world.
Reminder - Complete all of the lesson tasks!
You have finished Lesson 3. Double-check the list of requirements on the first page of this lesson to make sure you have completed all of the activities listed there before beginning the next lesson.
Tell us about it!
If you have anything you'd like to comment on, or add to, the lesson materials, feel free to post your thoughts in the Questions? Discussion Forum. For example, what did you have the most trouble with in this lesson?
Lesson 4 - Facilitating Public Participation with GIS
An Overview of Lesson 4
In this lesson, we’ll consider what it means to involve the public in decision-making processes like choosing routes for electric transmission lines. You’ll also learn more about how GIS can facilitate public participation, and even about the limitations of GIS analysis as a consensus-building methodology.
What will we learn in Lesson 4?
By the end of this lesson, you should be able to:
- understand all of the educational objectives of the two units in Geographic Information Science and Technology report;
- define environmental equity and environmental justice;
- identify and discuss four kinds of equity;
- discuss the claim that environmental equity is an inherently geographic problem;
- evaluate the status of research on environmental equity at the time the article was written, and consider how to evaluate its current status;
- evaluate the level of public participation in a case study using the Spectrum;
- evaluate the level of public participation in a case study;
- learn the basic operations of the Esri ArcMap system by meeting all of the requirements of the "Learning ArcGIS" and "ArcGIS Essential Training" courses via Lyndia.com.
GIS is one of the central technologies in the multidisciplinary research field known as “Geographic Information Science and Technology” (GIS&T). In 2006, the University Consortium for Geographic Information Science (UCGIS) published a “GIS&T Body of Knowledge” to help define the field. Two of its 329 topics focus on public participation. This lesson addresses several of the educational objectives of those two units, which are outlined below.
Topic GS3-2 Public participation in governing
- Differentiate among universal/deliberative, pluralist/representative, and participatory models of citizen participation in governing.
- Compare the advantages and disadvantages of group participation vs. individual participation.
- Describe the six “rungs” of increasing participation in governmental decision-making that constitute a “ladder” of public participation.
- Describe the range of spatial scales at which community organizations operate.
- Describe an example of “local knowledge” that is unlikely to be represented in the geospatial data maintained routinely by government agencies.
- Defend or refute the argument that local knowledges are contested.
- Explain how community organizations represent the interests of citizens, politicians, and planners.
- Explain and respond to the assertion that “capturing local knowledge” can be exploitative.
- Explain how legislation, such as the Community Reinvestment Act of 1977, provides leverage to community organizations.
Topic GS3-3 Public Participation GIS
- Explain how geospatial technologies can assist community organizations at each rung of the ladder of public participation.
- Explain why some community organizations may encounter more difficulty than others in acquiring geospatial data from public and private organizations.
- Explain how community organizations’ use of geospatial technologies can alter existing community power relations.
- Critique the assertion that public participation GIS promotes democracy.
- Explain the challenge involved in representing local knowledge that is not easily mapped or verified within current GIS software.
- Discuss advantages and disadvantages of six models of GIS availability, including community-based GIS, university-community partnerships, GIS facilities in universities and public libraries, “map rooms,” Internet map servers, and neighborhood GIS centers.
What is due for Lesson 4?
This lesson will take us one week to complete. Please refer to the Calendar for specific time frames and due dates. Specific directions for the assignments below can be found in this lesson.
- Lesson 4 Quiz
- Discussion assignment
- Submit your Certificate of Completion for the Esri "Getting Started with ArcGIS Pro" course if you haven't already done so.
- Answer a short answer essay quiz reflecting on the ArcGIS course you completed if you haven't already done so.
- Extra Credit opportunity
Questions?
If you have any questions, please post them to our Questions? discussion forum. I will check that discussion forum daily to respond. While you are there, feel free to post your own responses if you, too, are able to help out a classmate.
DiBiase, D, M. DeMers, A. Johnson, K. Kemp, A. Luck, B. Plewe, and E. Wentz, Eds. (2006). The Geographic Information Science and Technology Body of Knowledge. University Consortium for Geographic Information Science. Washington, DC: Association of American Geographers.
Environmental Justice
To frame our consideration of public participation GIS, let's first consider the concepts of “environmental justice” and “environmental equity.”
Watch this!
To get a feel for these concepts, watch the 9-minute video “Chester Environmental Justice”:
Click for a transcript of "Chester Environmental Justice" video.
PROTESTER 1: Go stand in line. Stand in the line. Somebody get back in the line.
PROTESTER 2: Get it out of here!
PROTESTER 3: We live here, we're tired of the trash. So you need to go back where you were, and just tell them we wouldn't let you in. It's not your fault.
PROTESTER 4: That's just what I'm telling him.
PROTESTER 3: You're just caught up in the middle--
PROTESTER 4: --that's right.
PROTESTER 3: --but you ain't getting in there today.
Note on screen: In 1992 residents of Chester, PA, came together to fight against polluting waste facilities in their communities.
MAN 1: I don't know what's coming from that plant, but it's a stench that you've never smelled before. It is horrible.
WOMAN 1: We have a high rate of cancer here. We have a high rate of leukemia here. We have high rates of a lot of things that we don't have answers to.
MAN 2: Trash finds its way from Maryland. Trash finds its way from Virginia. Trash finds its way from Jersey to Chester.
MAN 3: When the plants come here, they're bringing us jobs. You're bringing us jobs, but at the same time, you're killing us.
MAN 4: Lord like I said, as long as--
MAN 3: --They're setting us up for defeat--
MAN 4: --as long as they're making their money they don't care. WOMAN 2: All they're going to do is be successful in driving away people like me who have the ability to stay here to pay the taxes, to buy the homes. They're going to drive us the hell out of here. And those of us that they don't drive off, they're going to kill them, slowly.
AUDIENCE MEMBER: If they put another plant in Chester, we will tear it down. Red-handed.
[APPLAUSE]
Note on screen: In the past 12 years there have been victories, but the time has come to fight again.
WOMAN 3: They said to us that they weren't going to bring any more of this type of industry into Chester. And now they're sneaking it in.
WOMAN 4: You still have other companies coming in. A lot of them are from out of the country, overseas. Names that are disguised. Trying to move in and get permits.
MAN 5: There are proposals for what would be the world's largest tire incinerator and other waste to fuel schemes that are targeting the city.
WOMAN 3: Because we are black, we are poor, low economics, low jobs. They think this is the ideal place to come and dump their trash and waste.
MAN 5: It's actually become known as one of the nation's worst cases of environmental racism. And we're trying to figure out ways to get the community reorganized, like we had in the mid '90s, to be a powerful force for change and make sure that those things get stopped.
MAN 2: There was a time in Chester where a person could quit a job, walk down the street and get another job that same day. That was the industrial boom. We had the ship building down here. It was a town where you saw people getting up in the mornings, going to work. You saw people working in three shifts. And it was just a real moving town. All of a sudden, things began to change. Industry world began to change, began to move out. A lot of things in the city were done wrong politically, and businesses and industry were basically sold off or sold out. And now we live in a city where industry is not booming, where jobs are scarce. So we're encouraging everything and anything to come into the community to provide jobs for the citizenship.
[APPLAUSE]
[SHOUTING]
PROTESTER 3: I said you need to understand that we're not going to move. And if you keep going forward, you're going to run over somebody because we're not moving.
MAN 6: I'd like to extend an official apology to the community for this type of action. Because he jumped in the truck and he drove the truck. And then I understand he almost hit somebody. There will be a more official statement coming from our corporation as soon as possible.
The purpose of this facility is to process or burn the county's trash. We are capable of processing 2,688 tons of trash per day. That's a lot of trash.
WOMAN 2: The is the office of Chester Residents Concern for Quality Living. We're a grassroots organization that has been fighting environmental injustice in our city.
Because it's going to take that kind of personal effort for people to become knowledgeable about this problem. You know what, they think that it's only an isolated thing. It only affects a certain portion of Chester. Which is a lie. It affects all of us. We're dealing with a lot of different issues. We're dealing with some environmental problems. We also have to deal with the governmental aspect of it, because that's what got us some of these environmental problems.
The economic benefits that they give the city are negated by the war that they have caused on our health.
AUDIENCE MEMBER: I have all kinds of health problems within the church community. And you know what, I've been going to these kind of meetings for 30 years. And I've seen all the games. I know how they're played, and I know that the players aren't here.
MAN 8: Just let me say, and then I'll turn to Ms. [INAUDIBLE] to respond, this problem is not going to be solved if you rely on other people to solve it. Now I'm saying things that I could not say when I was the administrator of EPA. If Mr. McCade could do it, I'm sure he would. He can't. If Ms. [INAUDIBLE] would do it, I'm sure she would. She can't. There are sources and powers higher than both of them.
WOMAN 2: We have found out that-- and it has taken us three and a half years to determine-- what is the force, who is the force, who is the faction, that has been behind these companies coming to our little teeny city in Chester. We don't want it. Hell no. We don't want it. It is that basic. It's that basic. It is that basic.
[APPLAUSE]
We have a terrible problem in Chester. We would like to speak to the people who are bringing the waste facilities to our city. We want to get them stopped.
MAN 9: This is a legal matter. It should be dealt with--
WOMAN 2: --It's a moral matter. It's something that you wouldn't want done to your worst enemy.
MAN 9: It's a moral matter that may have to be dealt with legally. But in any event, this is not--
WOMAN 2: --If you know how it'll be done, it's being dealt with our blood--
MAN 9: --You're wasting your time--
WOMAN 2: --Well it's OK--
MAN 9: You're wasting your time--
WOMAN 2: --We've got it to waste.
MAN 10: I think there was a lack of foresight to build a facility of this size so close to residences. It doesn't make people feel comfortable to know that the fourth largest resource recovery facility in the nation is right in their backyard. It's something that will still need to be dealt with.
Note on screen: In 2008, 12 years later, the incinerator continues to burn thousands of tons of trash every day. A number of new facilities are now proposed for Chester, including the world’s largest tire incinerator.
WOMAN 3: It's just important that we continue to fight this battle. And that is why I am just so involved, and so excited that we're back on the battlefield again.
Note on screen: In 2007 the DelCo Alliance for Environmental Justice was formed by members of the community to continue the fight. To get involved, contact the Alliance at: http://www.ejnet.org/chester/ [30] or (484) 302-0385.
WOMAN 2: It is not a person out there that can shake them, that could tell me that my life is insignificant. It would just never happen.
Note on screen: This video includes a section of the documentary “Laid to Waste” 1996 by R. Bahar and G. McCollough. Used with permission. Images from 2007 were filmed by advocates of the DelCo Alliance for Environmental Justice. The complete documentary “Laid to Waste” is available to universities, colleges, and libraries at https://www.berkeleymedia.com/product/laid_to_waste/ [31].
Reading Assignments
Reading assignment 1
After you’ve watched the video, read the article “Race, Class and Environmental Justice” by Susan Cutter, located in the Lesson 4 folder. [This article can also be accessed through a local library. The full citation is: Cutter, Susan L. (1995). Race, class and environmental justice. Progress in Human Geography 19(1), 111-122.]
Read, don’t just skim the article. It should take you only 35-45 minutes to read carefully and take notes. Here are some of the things you should learn by reading the article. You’ll be quizzed on these objectives at the end of the lesson.
- Define environmental equity and environmental justice.
- Identify and discuss four kinds of equity.
- Discuss the claim that environmental equity is an inherently geographic problem.
- Evaluate the status of research on environmental equity at the time the article was written, and consider how to evaluate its current status.
Reading assignment 2
Visit the EJSCREEN: EPA's Environmental Justice Mapping application [32] website.
- Read how to use the application and then enter your home location to determine if EJ impacts are nearby.
- Explore the Table of Contents on the right hand side to see information about EPA regulated sites, health statistics, demographic statistics and much more.
Optional reading
The United States Environmental Protection Agency Environmental Justice page [33]. This page is a gateway to environmental justice activities administered by the USEPA.
An excellent series on Environmental Justice presented by "Environmental Health News".
- Pollution, Poverty [34]and [34] People of Color: Living with Industry [35]
- Pollution, Poverty and People of Color: Children at Risk [36]
- Pollution, Poverty and People of Color: Don't Drink the Water [37]
- Pollution, Poverty [38]and [38] People of Color: A Michigan Tribe Battles a Global Corporation [38]
- Pollution, Poverty and People of Color: Falling into the Climate Gap [39]
- Pollution, Poverty [35]and [35] People of Color: Asthma and the Inner City [35]
- Pollution, Poverty [40]and [40] People of Color: Dirty Soil and Diabetes [40]
- Pollution, Poverty [41]and [41] People of Color: Can Multiculturalism Create Environmental Justice? [41]
Levels of Public Participation
Just how involved should the public be in decisions like where to put a 100Kv electric transmission line, or an incinerator, or a hazardous waste storage facility? Professional planners and others have thought about this question for a long time.
A milestone in this vein of planning scholarship was Sherry Arnstein’s article "A Ladder of Citizen Participation [42]." In it, she describes eight “rungs” or levels of participation, from “nonparticipation” at the lowest rung to “citizen control” at the top. (The full citation of the original published article is: Arnstein, Sherry R. [1969]. A Ladder of Citizen Participation. Journal of the American Institute of Planners, 35[4], 216-224.)
Reading assignment
Numerous authors have reconsidered and refined Arnstein’s idea. Today the definitive treatment may be the “Spectrum of Public Participation [43]” (pictured below) published by the International Association for Public Participation. Read the Spectrum carefully. (It’s just one page.) At the end of the lesson, you’ll be expected to use the Spectrum to evaluate the level of public participation in the case study presented in Lesson 1. Then you’ll use the Spectrum again in Lesson 10.
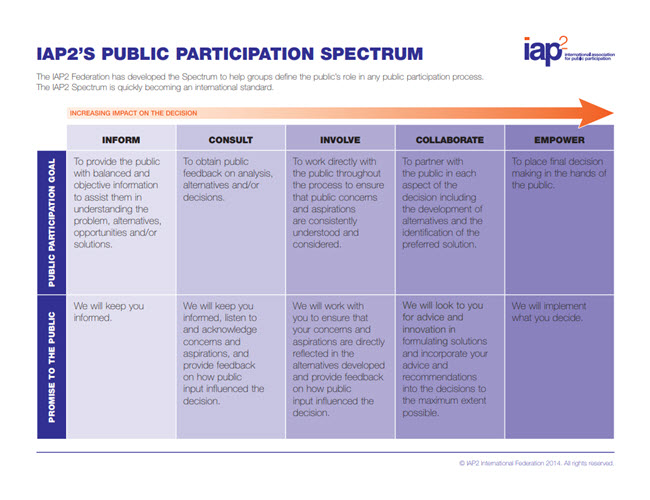
Figure 4.1: Spectrum of Public Participation
Click here to see a text description.
Click here to see a text description.
The IAP2 Federation has developed the Spectrum to help groups define the public's role in any public participation process. The IAP2 Spectrum is quickly becoming an international standard. The table below moves from less impact on the decision in the first column to most impact in the last column.
| -- | Inform | Consult | Involve | Collaborate | Empower |
|---|---|---|---|---|---|
| Public Participation Goal | To provide the public with balanced and objective information to assist them in understanding the problem, alternatives, opportunities and/or solutions. | To obtain public feedback on analysis, alternatives and/or decisions. |
To work directly with the public throughout the process to ensure that public concerns and aspirations are consistently understood and considered. |
To partner with the public in each aspect of the decision including the development of alternatives and the identification of the preferred solution. | To place final decision making in the hands of the public. |
| Promise to the Public | We will keep you informed. | We will keep you informed, listen to and acknowledge concerns and aspirations, and provide feedback on how public input influenced the decision. | We will work with you to ensure that your concerns and aspirations are directly reflected in the alternatives developed and provide feedback on how public input influenced the decision. | We will look to you for advice and innovation in formulating solutions and incorporate your advice and recommendations into the decisions to the maximum extent possible. | We will implement what you decide. |
Credit: IAP2 International Federation 2014 Accessed November, 20, 2018 at https://cdn.ymaws.com/www.iap2.org/resource/resmgr/foundations_course/IAP2_P2_Spectrum_FINAL.pdf [44])
Public Participation and Geospatial Technologies
Watch this!
The Geospatial Revolution
How can GIS and related geospatial technologies facilitate higher levels of public participation? Let’s approach this question by first watching a six-and-one-half minute excerpt from Episode Two of the Geospatial Revolution series produced by Penn State Public Broadcasting. Early in the video, you’ll hear Jack Dangermond, president of Esri, the GIS software company, state that “geographic information and maps are helping city governments become more democratic and participatory.” Think about that while you watch. Think about which aspect of Portland’s vision of an “interactive city” has the best potential to promote environmental equity.
Click for a transcript of "Geospacial Revolution" video.
JACK DANGERMOND, President ESRI: More than half the world's population is now urban. Geographic information and maps are helping city governments become more democratic and participatory.
SAM ADAMS, Mayor Portland OR: Portland has invested in geospatial technologies because it saves us money. It improves our services, our relationship with the people that we're here to serve.
PHILLIP HOLMSTRAND, Portland Corporate GIS Manager: We created Portland Maps to give easy access to citizens for crime data, transportation, property information, where all the pipes are, the utilities, all sorts of information. And we like the fact that the general public can get access to all of the types of data that we see here at the city.
BIBIANA MCHUGH, IT Manager, GIS and Location Based Services, Trimet: Our system is called TransitTracker. We were one of the first in the country to implement computers and GPS on board all of our buses. We've got the centralized database, and all this information and real-time location of the buses is available for everyone through the Internet and our customer service department.
SPEAKER 1: What time were you thinking of?
BIBIANA MCHUGH: Because of that, we're able to build mapping applications that allow better-informed decisions. We can see that the number 15 is due to arrive in nine minutes. We can also turn on 6-inch aerial photography. We also have links to Street View so that people can know what to expect. Let's pull up more detailed information about that stop, for instance, crosswalks, curb cuts, lighting. If someone has a disability, knowing there's a crosswalk or a curb cut there is very important.
Some of the applications provide real-time information out in the street. This application is called PDX Bus. And right now it's using GPS and our services to tell you that the eastbound MAX, it's arriving right now.
SPEAKER 2: Because of CivicApps for Greater Portland--
PHILLIP HOLMSTRAND: Our mayor challenged us to create a way for mobile users to catalog issues around Portland. PDX Reporter is an app that anyone can install on their mobile phone. We have some graffiti. You can take a photo of it and send it in with the GPS coordinates.
SAM ADAMS: Suddenly I had tens of thousands of eyes and ears because of PDX Reporter. And it gives us good feedback in real time that's geographically coded, and therefore useful for us to follow up on.
PHILLIP HOLMSTRAND: As soon as I submit the report, I'm actually able to get back a detailed status of where this incident is at in the city's system.
GARY ODENTHAL, Technical Services Manager: The Bureau of Planning & Sustainability does long-range planning to inform future development or redevelopment. What do we want the city to look like in 25 to 50 years? There's an awful lot of analysis.
You have to address economic development. You have to address housing. And you have to address environmental issues, et cetera. We couldn't do any of this without GIS. For the first time, we have the 3D building model for the whole city. And that's possible because the whole region now has LIDAR data.
KASS GREEN, President, KGA Geospatial: With LIDAR systems, the satellite or aircraft beams down to the Earth. The beam bounces back up. They gather information based on the return of objects on the ground. So you end up with a very good terrain model.
PHILLIP HOLMSTRAND: At laser-point accuracy, literally, we can take our information and actually start to visualize things three dimensionally.
GARY ODENTHAL: Instead of worrying about what if a proposed building threw a shadow all over the park, we did a shadow analysis using the GIS to calculate that it doesn't really impact the park. People went out and measured it, and we were within two feet, I believe.
The city says you can't build anything that's going to block the view of the mountain from up on the hills. With the GIS, we're able to do site-line evaluation to prove that proposed buildings would not block the view of the mountain. And that made people happy.
The city has set a goal that 90% of all Portlanders will live within walking distance of most of the things they need by 2025, and it's really resonated with the public. So we did a statistical analysis of the areas that are not 20-minute neighborhoods. They don't have any sidewalks, or the terrain is too steep, or there's no transit here, or there's no grocery store. So there's all sorts of things that we can answer now because we can overlay all of this data one on top of the other.
SAM ADAMS: I think our investments improve the way that we perform our work as a city government. It just makes good business sense.
CommunityViz
In this class, you’re using a software product called ArcGIS to work through a route suitability analysis for an electric transmission line. Some professional planners use a software extension to ArcGIS called CommunityViz to help facilitate public participation in land-use planning and other public policy decisions. Take a look at a couple of brief demos of CommunityViz. While you’re watching, think about how this product extends the capabilities of the ArcGIS software you’re learning to use. Watch closely; you’ll be quizzed about these demos at the end of the lesson.
Case Studies of Public Participation GIS
Reading Assignment
Now that you’re familiar with CommunityViz, please read a couple of brief (two pages each) case studies describing how it’s been used. In each of these cases, think about levels of participation, and the ways geospatial technology is used to facilitate public engagement. Read carefully please!
- Case Study 1: Placeways, LLC (2010) "Sustainable Energy Strategy for 'Future Cities'." Arnhem, Netherlands—A MapTable with CommunityViz deployed for "Arnhem CO2 Neutral.’ Accessed April 16, 2011 at http://communityviz.city-explained.com/PDFs/casestudies/Arnhem.pdf [46]
- Case Study 2:: Placeways, LLC (2010) Comprehensive Highway Corridor Study, Lancaster County, South Carolina—Land Use, Transportation, and Economic Development in a High Growth Area. Accessed April 16, 2011 at http://communityviz.city-explained.com/PDFs/casestudies/Lancaster.pdf [47]
The Limits of GIS as a Means to Build Consensus
Reading assignment
Read pages 3-14 of Chapter 9, [48]“Integrating Geographic Data,” in the open textbook Nature of Geographic Information [49]. This should only take 10-15 minutes. (You can ignore the “Try This!” activities that are meant for a different class.) Chapter 9 describes how GIS was used in attempts to identify suitable and acceptable sites for low level radioactive waste (LLRW) storage facilities in Pennsylvania and New York.Here are some of the things you should know and be able to do after reading the chapter:
- Discuss the difference between raster and vector approaches to GIS-based site suitability assessments.
- Describe how a GIS “buffer” operation might be used in a site suitability analysis.
- Explain why the GIS approach failed to win the public’s confidence.
Test Your Knowledge
Activity
Note
This activity contains two parts - See the course calendar for specific due dates and time frames:
- DUE SUNDAY: Complete a quiz on the contents of this lesson.
- MONDAY THROUGH SUNDAY: Participate daily in a class discussion.
Because we will be using an online discussion forum that is asynchronous for this activity, you will need to begin work right away! Be sure to log in to the class discussion forum multiple times between Thursday and Sunday so that you can keep the discussion going.
Directions - Part 1, Quiz
Take the "Lesson 4 - Facilitating Public Participation with GIS" quiz. The quiz consists of 10 multiple choice and short essay questions. You may only take this quiz once, but you may use your notes. This quiz will only be available until the due date indicated on the calendar. Be sure to complete it on time! THIS QUIZ IS NOT GRADED.
Directions - Part 2, Discussion
- Select the "Lesson 4 - Discussion" forum from the Lesson 4 module and discuss the following. Your peers in this class come from varied backgrounds and locations. Given this, what specific incidences of environmental justice impacts your home location. Be specific about the type, location and population impacted and what has been accomplished to correct the situation. You can use the EPA's EJ [50]SCREEN [51] to assist you.
- Read the postings made by the other GEOG 469 students.
- Respond to at least one other posting by asking for clarification, asking a follow-up question, expanding on what has already been said, etc. Make sure your posting is meaningful! I do not want to see "I agree" type postings! Your responses should add value to the discussion.
- Return to the discussion forum daily to read new postings, answer questions directed specifically to you, and to respond to any other postings of interest with your own questions or thoughts!
Grading Criteria
I will not be recording your quiz grade. I will, however, be reviewing your quiz submission carefully and including your responses in the summary for the whole class.
All students are expected to participate in the questions in their group discussions in a concise, well-organized, and scholarly manner. Saying, “I agree with Jennifer” is not adequate. You need to say why you agree (or disagree) and support your comments. Comments should be based upon information obtained from appropriate reference sources including lesson materials, previous coursework, Web-based information, or personal experience. You must use proper grammar and spelling for all contributions.
Your contributions to this assignment will be graded on a 15-point scale. Look at the discussion rubric [11] for more details about my expectations.
Extra Credit
Esri tutorials for using ArcGIS Pro have been added to some of the lessons as extra credit activities. These tutorials will give you the opportunity to develop your skill set using ArcGIS Pro. The tutorials will have two benefits. The most immediate benefit is they will provide additional training that will help make the term project a little less confusing. The second benefit is they will provide you with a skill set you can use in your professional career. Many of you will encounter some aspect of GIS, either viewing maps, interacting with GIS staff, or using GIS, in your careers and being familiar with GIS will only enhance your resume.
Four extra credit tutorials are included.
- Lesson 4: Getting Started with the Geodatabase (approximately 3 hours and 30 minutes)
- Lesson 5: Managing Map Layers in ArcGIS Pro (approximately 1 hour)
- Lesson 7: Displaying Data in ArcGIS Pro (approximately 1 hour and 15 minutes)
- Lesson 7: Querying Data in ArcGIS Pro (approximately 30 minutes)
Getting Started with the Geodatabase
This tutorial will give you the essentials of working with the ArcGIS Geodatabase. The geodatabase is the native data storage format for ArcGIS. Learn about geodatabase components and functionality as well as steps to create and add data to a file geodatabase.
Learning Objective:
After completing this course, you will be able to perform the following tasks:
- Describe the components of the geodatabase.
- Create a geodatabase schema.
- Design and create a geodatabase.
Accessing and completing the tutorial
- Go to the Esri Academy [52] (www.esri.com/training/ [27]) and log in with your Esri username and password.
- Search for “Getting Started with the Geodatabase” and select it from the resulting list.
- Follow the course outline to navigate and complete the course.
- Print or save a copy of the Certificate of Completion to a place where you can easily locate it.
Deliverables
Submit your Certificate of Completion to the Extra Credit: Getting Started with the Geodatabase drop box by the due date indicated on the course calendar. Note: You have until the last day of class to complete these but I highly recommend doing them BEFORE you begin the term project in Lesson 9.
Grading Criteria
Completion of this module will result in 1 extra credit point.
Summary and Final Tasks
Wise decision makers welcome public participation because it can lead to better decisions. In this lesson, you've learned that there is a spectrum of participation, from merely informing the public to more meaningful involvement, collaboration, and empowerment. The right level of participation depends on the circumstances, but, too often, the public isn't involved enough in decisions like the ones discussed in this course. This week, you read case studies that demonstrate how, under the right conditions, GIS and related geospatial technologies can facilitate higher levels of public participation. Keep in mind, however, that technical solutions alone are not enough to overcome concerns about environmental justice.
Reminder - Complete all of the lesson tasks!
You have finished Lesson 4. Double-check the list of requirements on the first page of this lesson to make sure you have completed all of the activities listed there before beginning the next lesson.
Tell us about it!
If you have anything you'd like to comment on, or add to, the lesson materials, feel free to post your thoughts in the Questions? Discussion Forum.
Lesson 5 - Overview of Electric Energy Transmission Siting Criteria
Lesson 5 introduces the criteria for siting new electric transmission lines. In general, the siting criteria principles used for electric transmission lines can also be used, with some modifications, to site oil and gas pipelines, highway corridors, rail corridors, and generating facilities.
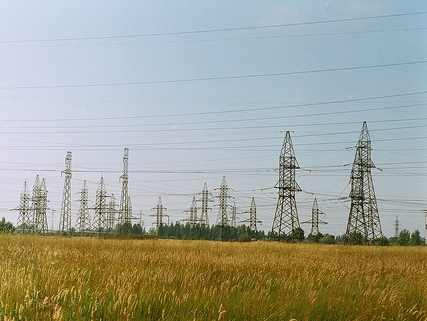
Figure 5.1: Overhead Electrical Transmission Lines
What will we learn in Lesson 5?
In this lesson, we will learn how the distribution of electricity began and how it has evolved over the years. Along with this expansion of electricity came the regulation of the electric utility industry, from production through delivery. We will learn how these regulations came to be and how they have been changed to meet changing demands and needs. In the United States, both federal and state governments have a prominent place in developing and enforcing these regulations. We will learn where the federal government has jurisdiction and where the state government has control. We will learn that the regulation of transmission lines from state to state is not standardized. The siting of transmission lines is a complex process, and we will be introduced to the criteria used in siting these lines.
By the end of this lesson, you should be able to describe:
- how the distribution of electricity in the United States was created and how it has evolved;
- how regulations evolved and what jurisdiction federal and state governments have in the siting of proposed transmission lines; and
- what criteria are used in the siting process.
What is due for Lesson 5?
This lesson will take us one week to complete. Please refer to the calendar for specific time frames and due dates. Specific directions for the assignment below can be found within this lesson.
- Essay Activity
- Extra Credit Opportunity
Questions?
If you have any questions, please post them to our Questions? discussion forum. I will check that discussion forum daily to respond. While you are there, feel free to post your own responses if you, too, are able to help out a classmate.
Introduction
Demand for electricity is expected to grow dramatically over the next 20-30 years. With that expected increase in demand comes the need for the expansion of existing electric transmission lines and corridors, and for new transmission lines. These expansions and additions require detailed planning, siting, and public participation before actual line construction can begin. Some estimates suggest that investment in new generation, transmission, and distribution could be anywhere from $1.5 to $2 trillion by 2030. Much of this cost will be associated with upgrading the existing electric transmission system, adding new transmission lines to serve our growing appetite for electricity, and bringing alternative energy, such as wind and solar, from its origin to the consumer. The siting of new transmission lines is the critical first step in the successful deployment of these transmission systems.
How does this investment transfer to the cost we pay for electricity? A review of the Department of Energy website shows projections for energy use and consumption between 2015 and 2050. Between 2015 and 2050, the total electric use in the United States will increase from 3.871.9 Bkwh (Billion kilowatt-hours) in 2015 to a projected 5.232.8 Bkwh in 2050, or an increase of 35.1% increase projected over this period. The
The average residential cost/kwh will go from 12.8 cents/kwh in 2017 to 17.3 cents/kwh in 2035.
Check this out!
Take time to explore this data from the U.S. Energy Information Administration site linked below. It has valuable information on energy generation, demand, and use. Check out the US Energy Mapping System by selecting "Geography" from the top ribbon menu, then selecting "US Energy Mapping" under "Highlights". Select "Find Address" located in the upper right corner of the map. Type in your address and select "LOCATE". The map will zoom into your address. On the left side of the map, zoom out a little to give you a bigger area to investigate. Now select "Legends and Layers" from the upper right map menu. Explore the various energy characteristics of your area by checking/unchecking menu items. Click on the icons on the map to see details about specific power plants.
Creation and Evolution of Electricity Distribution
How the distribution of electricity was created and has evolved in the United States.
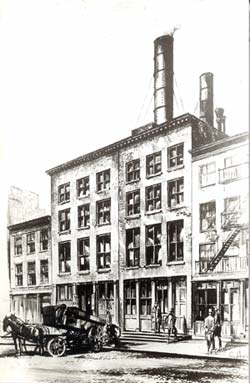
Figure 5.2: A sketch of the Pearl Street Station, sometime between 1882 and 1890
Credit: File: PearlStreetStation.jpg [56]
The earliest electric distribution systems were located in the area surrounding the Pearl Street Power Station [57] in Manhattan, and in Menlo Park, NJ. Both were built by Thomas Edison in 1882. These systems used direct current (DC) and were very inefficient, requiring electric generating stations to be close to the users, generally within a mile. These types of generation-transmission systems were called distributed generation systems.
In the 1890s, further development and refinements of distribution systems were made. The most significant of these improvements was the design of alternating-current (AC) [58], high-voltage distribution transmission systems. This was significant because these new AC lines permitted electric power to be transmitted over much longer distances than the inefficient DC system did.
In 1896, George Westinghouse built an 11,000 volt AC line to connect Niagara Falls to Buffalo, NY – a distance of 20 miles. From that point on, the generation of electricity and the voltage capacity of transmission lines grew rapidly, while the distance from the point of production to the consumer grew wider. This resulted in a move away from the localized production of electricity to much larger, regionalized producers that could generate more electricity at one location and move it longer distances on the growing electrical grid.
The transmission system was built, over the past 100 years, by vertically integrated utilities that produced electricity at large generation stations located close to fuel supplies or needed infrastructure, and then relied on transmission facilities to transport their electricity to customers. Interconnections among neighboring utility systems were constructed to exchange power to increase reliability and share excess generation during certain times of the year. From its early beginnings in the late 1800s, the electric transmission and distribution system in the United States has evolved into a massive grid, bringing electricity to nearly every corner of the country. Today, this grid is a complex network of independently owned transmission lines that now encompasses a network of over 150,000 miles of high-voltage transmission lines linking generating facilities to load centers through interconnected transmission systems spanning states, territories, regions, and the borders of Mexico and Canada1.
1. Abraham, Spencer. "National Transmission Grid Study." United States Department of Energy, Washington, D.C., May, 2002. https://www.ferc.gov/sites/default/files/2020-04/transmission-grid.pdf [59]
How Regulations Evolved
The growth of these larger electric companies resulted in state governments extending the jurisdiction of their regulatory powers to include electric utilities. New York and Wisconsin were the first states to initiate regulatory commissions in 1907; and by 1914, 43 states had commissions in place for the regulation of electric utilities. In 1932, about three-quarters of the investor-owned utility businesses were controlled by eight holding companies, many of which crossed state lines.
Transmissions Grid Timeline
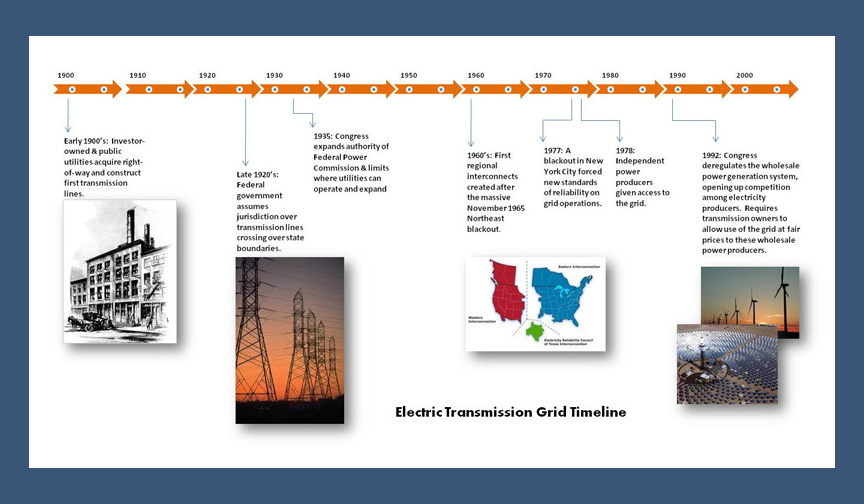 [60]
[60]
Figure 5.3: Electric Transmission Grid Timeline - Click on this image to see a larger version
Click link to expand for a text description of Figure.5.3
Click link to expand for a text description of Figure.5.3
Early 1900's: Investor owned and public utilities acquire right-of-way and construct first transmission lines.
Late 1920's: Federal government assumes jurisdiction over transmission lines crossing over state boundaries.
1935: Congress expands the authority of Federal Power Commission and limits where utilities can operate and expand.
1960's: First regional interconnects created after the massive November 1965 Northeast blackout.
1977: A blackout in New York City forced new standards of reliability on grid operations.
1978: Independent power producers given access to the grid
1992: Congress deregulates the wholesale power generation system, opening up competition among electricity producers. Requires transmission owners to allow use of the grid at fair prices to these wholesale power producers.
Credit: Ron Santini, 2011
In 1927, as a consequence of this growth and consolidation, the U.S. Supreme Court ruled that electricity was not an intrastate commodity, but rather an interstate commodity subject to federal regulation. The Public Utility Holding Company Act (PUHCA) of 1935, was signed into law by President Roosevelt as a result of a Supreme Court ruling. PUHCA limits the geographical scope of utility holding companies and the corporate structure of the holding companies. The act vertically integrated utilities (allowing ownership of both generating facilities and transmission lines) in monopoly service areas. States retained jurisdiction over siting of generating facilities, transmission systems, and distribution rates.
With the backdrop of higher oil prices and a real concern about energy imports from politically unstable countries, Congress enacted the 1978 Public Utility Regulatory Policies Act (PURPA). PURPA was a game-changing piece of legislation because it required utilities to buy electricity from companies that were not designated as utilities, and created a new industry for independent power producers. This legislation also gave these independent power producers access to the transmission system they needed to deliver their power to the grid.
Again, because of the concern over the country’s dependence on foreign oil, Congress passed the Energy Policy Act of 1992 (EPACT). This Act allowed access to the grid by non-utility companies on rates and terms that were comparable to those that the utility would charge itself for access to the grid. Why was this important? Because it fueled the growth of the wholesale power market by allowing electric utilities and other power generators to use the transmission grid to send power to one another at fair market rates.
Want to learn more?
- History of Major Energy Policy Landmarks [61] (From Geog 432: Energy Policy)
- Public Utility Holding Company Act [62]
- Public Utility Regulatory Policies Act [63]
- Energy Policy Act of 1992 [64]
- Transmission Siting Issues: Regulatory Perspective [65]
Siting Criteria Considerations

Siting new transmission lines in the United States has become a controversial issue, mainly because few property owners welcome the idea of having a transmission line built near their property or crossing it. As a result of this NIMBY ("Not in My Back Yard") concern, much of the old subjectivity of line corridor location has been removed from the process and replaced with objective, transparent corridor analysis. This objective analysis could not have come at a more appropriate time. With an aging transmission line infrastructure, an increased need to expand capacity, and the development of new conventional and alternative sources of energy, increasing pressure is being placed on utilities and regulatory agencies over siting concerns.
The primary regulatory responsibility for the siting of transmission lines resides with the individual state public utility commissions. In addition, various state and federal resource agencies review and comment on impacts to water, wetlands, wildlife and rare, threatened, and endangered species, land use, cultural and historical resources, and visibility concerns. A closer look at the link will show that not all transmission lines are covered by regulatory agencies. For example, in Pennsylvania, the Public Utility Commission only regulates transmission lines greater than 100kV. Transmission lines smaller than this are not regulated. Transmission lines proposed by the federal government, or transmission lines proposed by public and private utilities that cross state lines, cross federal and tribal lands, or impact national parks, require a detailed NEPA (National Environmental Policy Act [67]) analysis and review by the United States Environmental Protection Agency (USEPA). As part of a utility's public outreach program, affected property owners review and comment on the proposed project during the siting process.
The process for choosing a site for the construction of electric transmission lines involves an extensive study of environmental (water, wetlands, topography, soils, geology), land use, biological, cultural, and visual resource impacts. As you learned earlier in this course, public participation is an important component of the siting process. In the sections to follow, we will be introduced to these criteria. We will discuss each of these criteria in detail and address criteria characteristics, potential impacts to these criteria, and examples of mitigation measures that can be implemented to reduce impacts on these criteria.
Here is a short (3:16) YouTube video, introducing you to the siting process used by ATC, American Transmission Company:
Click for a transcript of "ATC" video.
NARRATOR: OK, we know that almost everyone needs electricity, and that we need transmission lines to help deliver that electricity. But who decides where and when they are installed? After all, very few people really want to look at them. While that is true, many people are involved in determining where new transmission lines will go.
At American Transmission Company, we have a very inclusive process for routing and siting transmission lines that involves evaluating location options and impacts, and soliciting input from regulators, government agencies, property owners, and community members.
At the beginning of the process, transmission system planners determine the need for a project and its benefits. Then they select the endpoints for the line. Next, a broad study area is evaluated.
Within that broad study area, we first look for existing corridors where there is already an existing power line or gas pipeline. We also will look at the possibility of siting a new power line within transportation corridors, such as highways or railroads.
Existing recreational trails are also evaluated. If necessary, the last option is to establish new or cross country corridors. We then gather data on environmental sensitivities, roads, railroads, pipelines, utility corridors, and environmental areas.
We also host public open houses to invite feedback from community members. People most familiar with the potentially impacted areas provide a lot of useful insight. All of this information helps us eventually narrow down dozens of potential corridors to fewer preliminary routes, and finally, to two or more final proposed routes. This process typically takes one to two years.
Final route options offer the best solutions based on environmental and land use considerations, suitability for construction, public input, cost, and electric system needs. These proposed routes are formally presented in an application to state regulators. State regulators then evaluate if the project is needed, hold public and technical hearings, and if approved, decide where to locate the line.
State regulators may or may not select an exact route recommended by ATC. They may make some modifications based on public input or other considerations. In the end, the final route represents a balanced blend of social, environmental, and logistical considerations from agencies, the public, communities, and property owners.
Environmental Criteria Used in Siting
Soils
Soil type plays a significant part in the location of transmission lines. Soil stability is an important factor when locating transmission towers. Clearing of rights-of-way, especially on steep slopes, can expose soils and increase the chance of erosion. Slope failure, such as creeps, slides, and falls, can occur as a result of access road construction on unstable soils on steep hillsides. Soil compaction can result from the movement of heavy equipment along the right-of-way during construction, limiting the ability of the soil to be productive for forage or crops. Increased runoff can result in sediment loads that impact receiving streams. Where soils may be questionable for tower construction, additional engineering analysis must be done to find engineering solutions for tower placement and construction.
Figure 5.5: Soils Map Examples
Credit: USDA.gov
Topography
Topography is an important siting factor because it impacts environmental protection, construction activities, and ultimately, the transmission line cost. Construction of transmission lines on steeply sloped land creates added potential for soil erosion and sediment runoff, which then impacts receiving streams. Detailed engineered erosion and sediment control plans are developed to minimize environmental impacts. Construction on steep slopes presents many challenges: it affects the types of equipment used during construction, mobilization of this equipment, and how and where tower foundations are built. The erection and stringing of electric lines is more difficult on steep terrain than on flat terrain. Consequently, final project costs increase with an increase in slope.
Figure 5.6: Topo Map Examples
Credit: utah.gov (left) and .usgs.gov (right)
Geology
The type and extent of geologic features encountered along the proposed transmission corridor will impact decisions on siting. Geologic fault zones, seismic zones, rock type and extent (an example would be limestone and associated solution channels) pose both environmental concerns and construction concerns. Disturbance of acid rock can create a source of water pollution that could impact receiving streams. Towers constructed in geologic fault zones or seismic zones require detailed engineering analysis and enhanced construction methods.
Figure 5.7: Geologic Information Examples
Credit: Virdell Drilling, Inc. [68] (left) and University of Wisconsin-Madison Department of Geoscience [69] (right)
Water
Water resources can be impacted by construction activities associated with new transmission lines, or with the upgrading of existing transmission lines. Removal or disturbance of vegetation, resulting from the clearing of right-of-way corridors, may affect the natural hydrology of a watershed by altering surface runoff and stream flows. This may lead to decline in water quality by increasing sediment and chemical pollutant loads and warm water inputs. Access roads have the potential to impact water resources by altering natural stream hydrology. Removal of stream shade cover resulting in warmer water could impact aquatic species, especially in cold-water streams. Herbicides used to maintain right-of-way can enter streams through runoff from impacted soils. The siting process should quantify the number of stream crossings and minimize the number of streams and rivers to be crossed by the transmission corridor.
Figure 5.8: Water Use Examples
Credit: river.vroma.org (left), www.lknsocial.com [70] (middle), and Circle of Blue Water News (right)
Wetlands
Generally, wetlands are lands where saturation with water is the dominant factor determining the nature of soil development and the types of plant and animal communities living in the soil and on its surface. Wetland functions include water quality improvements, water storage, water filtration, and biological productivity. According to the U.S. Environmental Protection Agency: [71]
- An acre of wetland can store 1 to 1.5 million gallons of floodwater.
- Up to one-half of North American bird species nest or feed in wetlands.
- Wetlands occupy about 5% of the land surface in the mainland U.S., and they are home to 31% of the plant species.
- 75% of commercially harvested fish are wetland-dependent.
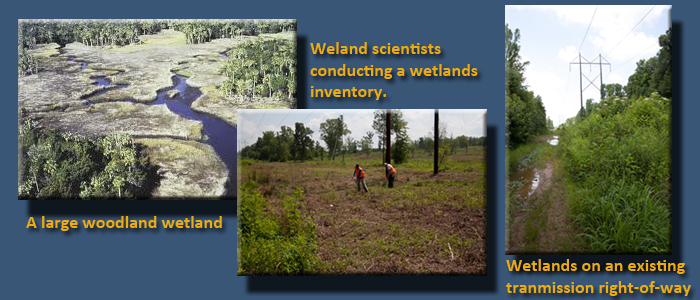
Figure 5.9: Wetlands Examples
Wetlands vary widely because of regional and local differences in soils, topography, climate, hydrology, water chemistry, vegetation, and other factors, including human disturbance. For regulatory purposes under the Clean Water Act [73], the term "wetlands" means "those areas that are inundated or saturated by surface or groundwater at a frequency and duration sufficient to support, and that under normal circumstances do support, a prevalence of vegetation typically adapted for life in saturated soil conditions. Wetlands generally include swamps, marshes, bogs and similar areas."
The siting process for wetlands is usually a two-step process. During the initial stage of siting, the National Wetlands Inventory [74] is a resource used to identify wetlands in the proposed transmission line corridors. Once these wetlands have been mapped, they must be verified through field identification of plants and soils using methodology outlined in the 1987 Wetland Delineation Manual. The intent of the siting process is to minimize the impact on surveyed wetlands.
Some of you may remember the Great Flood of 1993 on the Mississippi River. It created billions of dollars in economic loss, not to mention the devastation to homes and communities along its path. You also remember Hurricane Katrina and the horrific impact it had on New Orleans. In 2011, we saw the same scenario played out again with the flooding of the Mississippi River. Each of these disasters can be contributed in some part to the loss of valuable wetlands. The Upper Mississippi River Basin has lost a significant amount of wetlands that historically provided storage and buffering from significant rain events. As for Katrina, the wetlands delta buffering New Orleans from ocean surges has also diminished in size over the years, reducing the protection from hurricanes the city once had. I'm sure many of you are aware of impacts on smaller scales in watersheds close to where you live. So, the message is: wetlands are important not only to protect our economy, but also because they play a part in minimizing impacts on individuals, families, communities, and ecology.
Reading assignment
- Go to the EPA Wetlands Fact Sheet Series [75].
- Under the "Introduction to Wetland" heading, click on and read the following:
- Wetlands Overview
- Types of Wetlands
- Functions and Values of Wetlands
- Economic Benefits of Wetlands
- Threats to Wetlands
- Wetlands: Protecting Life and Property from Flooding
- Under the "Regulatory Under the Clean Water Acet, Section 404", Click on and read the following:
- Wetland Regulatory Authority
- How Wetlands are Defined and Identified
- Wetlands Enforcement
- After reading the materials listed above, you should be able to answer the following questions:
- What is the regulatory act that authorizes wetland protection in the United States?
- What government agency is responsible for the enforcement of wetland regulations in the United States?
- What role does the U.S. Environmental Protection Agency play in wetlands protection?
- What is the official definition of wetlands?
- When is a Section 404 permit required?
- What are the four general categories of wetlands found in the United States?
- What are the three major functions of wetlands?
- How do wetlands control runoff and flooding?
- The 1993 and 2011 flooding of the Mississippi River caused significant economic damage in the billions of dollars. A significant contributor to this damage has been the destruction of wetlands in the Upper Mississippi River Basin. How many acres of wetlands have been lost in this upper basin since the 1890s?
- It is estimated the United States had over 220 million acres of wetlands in the 1600s. Today that number is around 100 million acres due to wetlands being converted for other uses. What is the annual rate of wetland loss in the United States?
Want to learn more?
A detailed, technical explanation can be found in the 1987 U.S. Army Corps of Engineers Wetland Delineation Manual [76].
Watch this!
The following 4:10 minute video tells a story of sacred Indian wetlands in Kansas and the proposed construction of a highway corridor adjacent to it. It shows how a lack of due diligence in the siting process created public relations problems. Similar situations can occur when siting any energy generation facility or transmission line. You may encounter a message that says "The video contains content from EMI. It is restricted from playback on certain sites." If so, watch on YouTube. [77]
Click for a transcript of "Indian Wetlands" video.
Haskell University Used to be Haskell Institute
An institution where children were taken from their families and beaten or thrown in the Haskell jail for speaking their own language. It is believed in an effort to keep official death rates down, students were buried in the wetlands just south of the Institute. It is also believed that students close to death, refusing to die within Haskell’s walls wandered out to these same wetlands as their place of passing. In an odd twist of irony, these wetlands today are used by the students and faculty to practice traditional Native American religions once banned by the institution. The wetlands are not only a refuge for students and faculty but also a wildlife refuge and sanctuary. Now the State of Kansas wants to put a highway right through its heart.
In 1992 The US Army Corps of Engineers sends out public notices soliciting comments about plans to mitigate the 31st Street wetlands in the path of the traffic way. Douglas County fails to include Haskell on the mailing list. Four individuals and a few agencies respond by the January 18th deadline. The Corps approves the permit without further public hearings.
In 1994 the Lawrence Chamber of Commerce has a groundbreaking ceremony for the western nine miles of the traffic way.
In 1998 in response to a lawsuit by American Indians and environmentalists, a federal judge halts work on the project until an impact statement is completed.
In 2000, the final supplemental environmental impact is released to the public. The 5-inch thick document includes the words…No Build
In April 2011 kdot Chief Council Mike Rees makes public his effort for a 32nd Street route for the traffic was that would move the project off Haskell property.
After many years of study, the Corps announced in January 2004 that it had determined that a 32nd Street route was the “least environmentally damaging practicable alternative.
But now, the Potawatomi Nation has proposed a new route that would run south of the Wakarusa River. The Potawatomi route would be considerably less expensive than the Corps route. We have a responsibility to respect cultural and religious viability. A responsibility to know the environmental and cultural wealth we are losing at the cost of “progress”. Save the Haskell & Baker Wetlands.
Land Use Criteria
Land use is a critical siting criterion because of the different types of land uses. Of significance are woodlands, agricultural lands, developed lands, and lands used for parks and recreation. Woodlands, especially those used for forest production, can lose productive acreage created by the right-of-way. Some agricultural lands could be impacted, mainly by the footprint of the tower structure. Transmission lines can also affect field operations, aerial spraying, and field irrigation, as well as create opportunities for weed encroachment, and increase safety hazards associated with pole and guy wire placement. Property owner issues are often raised by individuals or communities along proposed transmission line routes. A common issue is one that involves property owner rights versus the public good [78].
Developed lands include lands used for residential, commercial, and industrial development. These lands should be avoided to the extent feasible during the siting process. The planning and siting of transmission lines through developed areas involves more detailed planning and public outreach to choose a final route. This added level of detail potentially results in delays or denials in approvals, and can significantly increase the cost of construction.
Local, state, and national recreational areas and parks should be avoided. The impact to these areas may result in the displacement or elimination of recreational uses. New recreational areas cannot be created within the boundaries of transmission lines, and the existing uses of the recreational areas could be changed. The aesthetic aspects of scenic and natural areas could also be impacted. In addition, unintended uses of right-of-ways for recreation activities, such as unauthorized ATV use, can occur.
Biological Resource Criteria
Wildlife and Rare, Threatened, and Endangered Species (RTES)
Endangered species are species whose continued existence is in jeopardy. Threatened species are those species that are likely to become endangered. The construction and operation of transmission lines can affect plants and animals by altering habitat, displacing habitat, and causing injury or mortality due to collisions with transmission line insulators, conductors, and wires. For example, a transmission line proposed through the Lesser Prairie Chicken [79] habitat would automatically trigger the Endangered Species Act [80] and have a negative impact and create a delay in the siting process.
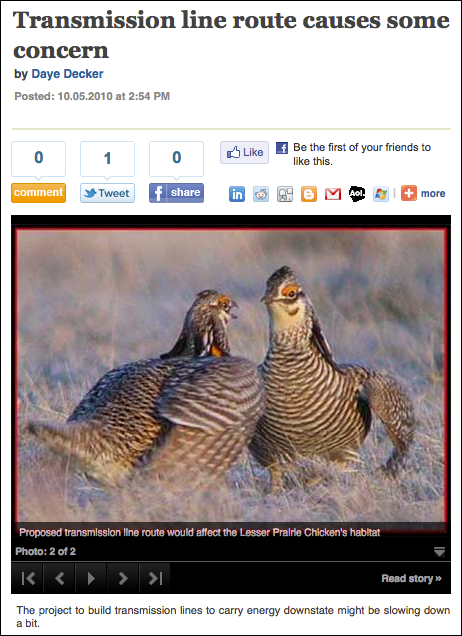
Cultural Resource Criteria
Cultural resources include archaeological and historical sites. These sites are important because they provide insights into past cultures and religions. Some of these sites are threatened and are listed on the National Registry of Historic Places [82]. The National Historic Preservation Act of 1966 [83], amended in 2000, was enacted to preserve historic properties throughout the United States.
Archaeological Resources
The impact on cultural resources from electric transmission lines are most likely to occur during the construction phase. In addition, access to remote areas of archaeological significance may result, especially if access roads are left in place after construction is complete.
Historical Resources
Historic sites can be impacted visually by the completed lines, resulting in fewer visitors to the site. Potentially, pollution can also affect the site.
Here is an example of how an endangered historic site can impact electric generation. In 2008, the Great Falls Portage [84], Great Falls, Montana, was listed as one of the 11 Most Endangered Historic Places in the United States [85]. The Great Falls Portage, one of the best preserved and most accessible landscapes along the Lewis and Clark Trail, is a windblown, undeveloped rural area surrounded by mountains and a panorama of blue Montana skies. This National Historic Landmark marks the location where, in 1805, the Lewis and Clark expedition faced its most challenging obstacle —the 18-mile, 31-day portage around the Great Falls of the Missouri River.
In May of 2008, the Southern Montana Electric Generation and Transmission Cooperative, Inc. (SME) sought financial support from the USDA Rural Utilities Service to build the Highwood Generating station, a $720 million coal-fired power plant that would produce 250 megawatts of power and serve up to 120,000 rural electricity customers from Great Portage to Billings. The plant was proposed inside the boundaries of the Great Falls Portage National Historic Landmark, raising grave concerns about the impact that project would have on the site. Construction plans included a large 435-acre power generating facility with a 400-foot smokestack, four 262-foot wind turbines, secondary buildings, access roads, transmission lines, lights, and miles of railroad tracks. Despite receiving 1,500 letters of protest from concerned citizens, the Cascade County Commission voted in 2006, and, most recently, in January 2008, to rezone this agricultural land to allow for industrial activity.
In March of 2009, the USDA Rural Utilities Service ceased providing funding for the project and SME was modifying its plans to include a natural gas generation facility that could be an alternative to, or supplemental to, earlier plans for a coal-fired facility. Currently, the United States Army Corps of Engineers needs to issue a Section 10 water intake permit for the facility and is now the lead federal agency for the project. The National Trust along with a large group of partner organizations are participating in the National Historic Preservation Act Section 106 consultation process for the project. Concerns about the impact to the cultural landscape of the Portage site remain unresolved.
In November of 2009, the SME took a loss of $9.1M because it abandoned the plans for a coal-fired generating facility and opted for a gas-fired generating facility, and the site has been removed from the list of most endangered historic places in the United States.
Data Needs
During the siting process, a cultural impact assessment is usually conducted. This includes identification of properties on or eligible for the National Register of Historic Places located within and adjacent to the proposed electric transmission line or generating facility. At a minimum, the following actions are included in the assessment:
- Contacting the State Historic Preservation Office to determine if any archaeological or historic sites are located in the area of the proposed transmission line.
- Conducting background research on the site by compiling data on previously recorded prehistoric and historic sites and historical structures and other cultural resources.
- Defining an area within a set distance from the center line of a proposed transmission, usually 0.25 miles, as the corridor study boundary. Sites within and immediately adjacent to the corridor should be included in the impact assessment.
- Determining the potential and/or probability of the existence of prehistoric, historic, and archaeological sites, based on historic and prehistoric human activities.
- Conducting cultural resource surveys as directed by the State Historic Preservation Office.
- Determining the potential visual impact to the affected archaeological and historical sites.
Much of this information can be included as a layer used in the GIS analysis of transmission line route selection.
Because of the sensitivity of this data, each State Historic Preservation Office may have special requirements for the release and use of archaeological and historic site information.
Mitigation Measures
- Judicious route selection
- Compliance with all applicable state and federal requirements and permit restrictions
- Development of a mitigation plan to be followed during construction
- Flagging of cultural sites identified within the transmission line right-of-way
- Immediately contacting the State Historic Preservation Office should archaeological artifacts be uncovered during construction
Visual Resources
Public
Local, state and national parks, historic areas, and cultural areas may be miles from a proposed transmission line, but because they are visible, transmission lines can detract from the aesthetic value of these public lands. Possible solutions for this may include lower heights of towers, building towers that blend in with the surrounding environment or selecting a route where visibility impacts are not a concern.
An example of this is the visual controversy that surrounded the proposed local of an electric substation and transmission line through the Kituwah Valley in western North Carolina. Save Kituwah, a citizen group opposed to the line created the Save Kituwah website and Preserve Kituwah Valley video [86]. As a result of this protest, in August of 2010, the utility company found two alternative sites for the substation [87].
Residential
In almost every questionnaire completed and every public meeting attended by the affected public, the top two issues of concern are those of location and visibility. More specifically, will the proposed towers and lines be close enough to impact the real estate value of property, and what impact will visibility have on both aesthetic and the property values?
Public Health Concerns - EMF
According to the USEPA [88], many people are concerned about potential adverse health effects of electric and magnetic electromagnetic fields (EMF). Much of the research done on electric transmission lines and potential health effects of EMF is inconclusive. Despite more than two decades of research to determine whether elevated EMF exposure, principally to magnetic fields, is related to an increased risk of childhood leukemia, there is still no definitive answer. The general scientific consensus is that, thus far, the evidence available is weak and is not sufficient to establish a definitive cause-effect relationship.
Watch the following 6 minute video about the PSE&G Susquehanna Roseland Power Lines Controversy.
Click for a transcript of My Nine News PSE&G Susquehanna-Roseland Power Line video.
REPORTER: It's picture postcard pretty in the Western part of New Jersey. Peaceful lakes, perfect homes, and beautiful views, yet this paradise is troubled.
COMMUNITY MEMBER: I'm very worried about the health of my children.
REPORTER: From the Delaware water gap to Roseland at the tip of Essex County, we heard the same thing.
COMMUNITY MEMBER: I'm worried about the children getting ill.
REPORTER: Entire communities are worrying about PSE&Gs Susquehanna Roseland project. It will dramatically increase the amount of electricity surging through power lines. Now at community meetings, people are angry.
COMMUNITY MEMBER: Their kids ain't out there playing underneath this goddamn thing as you hear it go [HUMMING NOISE].
REPORTER: Existing lines have carried electricity bound for Essex and Bergen counties through these communities since 1927. People haven't objected until now.
COMMUNITY MEMBER: We just moved here. We just bought the house a year ago and I just never imagined that this type of change could happen.
REPORTER: Change will more than double the size of the transmission towers and there will be nearly three times the amount of electricity. It will jump from 230,000 volts to 730,000 volts.
COMMUNITY MEMBER: It'll be 193 feet high. It'll bring the power lines up but it will also increase the capacity almost threefold.
REPORTER: Byram City Councilman, Scott Olson, walked the lines with us in Sussex County.
COMMUNITY MEMBER: It's very close to these homes. You've got people who are living 75, 80 feet away. They've got children, they've got a playground, it's a definite health concern for me.
REPORTER: The health concern is whether an increase in the electromagnetic field, or EMF, poses a danger.
COMMUNITY MEMBER: What is the minimum that's allowed?
REPORTER: Scott Clinger and his wife have two children. They built their house in Fredon nine years ago.
COMMUNITY MEMBER: We're all afraid. We're very afraid of how this whole thing shakes out.
REPORTER: And you're afraid because of the value of your house.
COMMUNITY MEMBER: Sure the value of my house.
REPORTER: But for families, there's a bigger issue.
COMMUNITY MEMBER: I'm more concerned with the safety of my children and the children of the county.
REPORTER: Because?
COMMUNITY MEMBER: Because of the EMFs and the unknowns.
REPORTER: Unknowns include possible cancer risk. In Morris County, Ethel Pearson, broken foot and all, has been going door to door to alert her neighbors in East Hanover.
COMMUNITY MEMBER: I didn't realize myself how serious it was.
REPORTER: She lives behind the current towers and she thinks that EMFs may have caused her two grown daughters to develop cancer.
COMMUNITY MEMBER: When you go door to door you realize how many cases of cancer there really is.
REPORTER: On one block here in East Hanover, out of seven homes, cancer struck six families. There have been brain tumors in three families. Richard Lowing had a brain tumor and cancer.
COMMUNITY MEMBER: Nobody told me it was dangerous.
REPORTER: When you moved in?
COMMUNITY MEMBER: When I moved in. They said it was perfectly safe.
REPORTER: And now that they're going to double the size?
COMMUNITY MEMBER: Well I'm really concerned about that.
REPORTER: Studies have found that childhood leukemia is linked to exposure to electromagnetic fields. But scientists say there's no scientific evidence that EMFs and power lines cause cancer. In a report, The National Institutes of Health say they haven't been able to conclusively prove a connection.
COMMUNITY MEMBER: We're still missing some scientific evidence to be conclusive to say, absolutely, this is what causes these cases of disease.
REPORTER: Doctor Dan Wartenberg at the University of Medicine and Dentistry of New Jersey worked on the national report. But he remains concerned.
COMMUNITY MEMBER: I think there's more evidence suggesting it does cause cancer than not, so I worry. And say, that the degree that one could reduce exposure or not be there is better.
REPORTER: You can't put us in harm's way. East Hanover MAYOR JOSEPH PANULLO speaks for many.
MAYOR JOSEPH PANULLO: If there's one one hundreth of a chance that this can cancer or can cause an illness to some of our residents, it has to be stopped.
REPORTER: But stopping it may be difficult because it's tied into a regional power grid issue.
MAYOR JOSEPH PANULLO: Give the people here a guarantee that it's not going to have an ill effect on their health. That's their main concern here. It's just too close, too dangerous.
REPORTER: A company called PJM Interconnection determined the need. PJM provides wholesale electricity for 13 states, including New Jersey, and it asked PSE&G to expand power capability to ensure that there is enough power for northern New Jersey.
CHRIS HANEMANN, PSE&G's lead engineer: We see circuits being overloaded as early as 2013, which can result in brownouts or blackouts.
REPORTER: CHRIS HANEMANN is PSE&G's lead engineer on the project.
COMMUNITY MEMBER: It's one thing is people don't like this project, we recognize that. But we also have to balance that with the need to ensure that we have a safe reliable electric power system.
REPORTER: That's why PSE&G has been going from town to town trying to convince the skeptics.
COMMUNITY MEMBER: We benefit from being part of a 13 state grid.
REPORTER: But communities remain opposed.
COMMUNITY MEMBER: You guys better pick another route, or you're going to have a big problem.
COMMUNITY MEMBER: You can't do anything you want. How about the health issues.
COMMUNITY MEMBER: God's watching. Look at that child and tell me there are no health issues.
REPORTER: PSE&G says new towers will cut the level of the electromagnetic field. Yet residents wonder why the lines can't be run underground.
CHRIS HANEMANN: It's not a proven technology. We have existing underground lines in northern New Jersey at lower voltages. It isn't really an option for 500 line.
REPORTER: Or along I80. Why not go along the highway.
CHRIS HANEMANN: Actually the DOT requirements do not allow for parallel of transmission lines along the right of way.
REPORTER: They also question whether more power is needed.
COMMUNITY MEMBER: There's no proof that they need to add to these wires so why put people at risk?
REPORTER: Even if communities continue to fight, because this involves interstate electricity, the federal energy regulatory commission can override all objections. So opponents of the plan think in order to change it or stop it they will have to take their battle to court. And we'll be following the story. In East Hanover, Barbara Nevins Taylor, Unit nine.
Want to learn more?
Lesson 5 Activity: The National Grid: Where Do We Go From Here?
Over the past few lessons, we have discussed many aspects of the grid including planning, permitting and costs. Let’s pull this all together by watching the 57-minute video of former FERC commissioner, Suedeen Kelley’s presentation “Extending the Grid” from January 2010.
Click here for a transcript of the "Transmittion Siting Issues" Video
SUEDEEN KELLY: What I wanted to do today was take the opportunity to share with you what I've learned over the last six years at FERC about extending the grid. And what I'd really like to do is, rather than have it just be a lecture, is to have it be a conversation about, frankly, what the competing policies are about extending the grid and what the best solution to it might be if there is one.
And in Washington-- excuse me. I'm going to move this around a little bit. In Washington today, there's a lot of discussion about changing the traditional paradigm about surrounding the building of transmission. And when you think about the building of transmission, if you want to break it down, think about it in three steps.
If you're going to build transmission, what do you have to do? You have to plan it. You have to site it. And you have to pay for it and figure out who's going to pay what. They call it planning, siting, and cost allocation, or the three P's, planning, permitting, and paying for it. And that's how the discussion gets focused.
What we don't hear a lot about in Washington is about the proposed solutions, and what they would do, and why we would want them. So that's what I'd like to talk about with you. It's not part of the general discussion. So before we get to that, let's get a baseline. Traditionally, what is it that we've done with respect to transmission? How do we plan it, how do we site it, and how do we pay for it?
We plan it-- traditionally, the transmission owners, the utilities, traditionally plan it. And it's been a very focused effort by the utilities. And traditionally, the transmission was just built from the generating plant to bring it to load, usually, most of the time, not a very long distance.
In the west, it's been longer because of the big distances in the west, but around the country that's how it's worked. And then the siting. How is the siting done? In other words, who gives the transmission owner, the utility, the permission to put the line at any particular place?
Traditionally, it's the states. So if you have a line that goes from California, from LA to Palo Verde, it crosses two state lines. It crosses the state line into two states, the California Public Utility Commission approves the siting of the California part and the Arizona commission approves the siting of the Arizona part or not, as they may decide not to.
And how do you pay for transmission? What's the cost allocation? Traditionally, the rule is the beneficiary pays. Not only that, but the benefit of transmission was defined very narrowly. The benefit of transmission is to get an electron to the electricity customer.
That's the benefit. That's the traditional way. So if you put a transmission line in from Los Angeles Department of Water and Power to Palo Verde to get the nuclear generation from Palo Verde to Los Angeles, who pays for that line? The customers in LA DWP, because they get the electrons. OK. That's the traditional approach. It's changed a little bit in the last 15 years.
Planning. In the last 15 years, we've seen the rise of entities called independent system operators or regional transmission organizations. The California ISO is one of them. These entities have grown up since, I think-- well, Cal ISO is really the first one in the latter half of the 90s. These RTOs or ISOs do transmission planning in their regions.
Let's see how many we have of them in the country. We have seven, the California one-- in the rest of the West, we don't have another one. We have Texas. And that's an independent system. It's not interconnected with the rest of the grid. Texas, as you know, is very independent and exceedingly independent in their electricity.
In the eastern interconnect, we have the Midwest Independent System Operator. It's huge. It's most of the Midwest states over to Ohio. We also have the Southwest Power Pool, which is small. It's just to the north of Texas, Oklahoma, parts of Kansas, some Arkansas, Nebraska-- no, it doesn't even go into Nebraska.
And then we have what's called PJM. It's in the middle Atlantic states. It initially stood for Pennsylvania, New Jersey, and Maryland, but now it includes most of the middle Atlantic states. New York has one, and New England. So the only two parts of the country without ISOs or RTOs are the west outside of California and the Southeast.
These ISOs and RTOs plan transmission. So in the transmission planning, where there are ISOs, we've gone from having the individual utility planet to having the ISO planet. And then FERC, the agency that I came from, the Federal Energy Regulatory Commission-- FERC has jurisdiction to an extent over transmission.
And FERC, about two years ago, issued a policy that said that the utilities have to plan regionally. So those utilities outside of an ISO, all the utilities in the west outside of California and those in the Southeast that aren't part of ISOs, they have to plan regionally.
We left it broad. They've come in with their plans. So they now plan in conjunction with other utilities in a region. OK. So it's improved a little bit, transmission planning, in the last 15 years.
How about siting? No significant change in siting. Siting is still done by the states. One little exception, in 2005 Congress passed the Energy Policy Act and it gave a little bit of siting jurisdiction to the federal government. Took a little bit away from the states and gave it to the federal government, gave it to FERC.
And what that law says is that the Department of Energy shall establish national interest electricity corridors. Those corridors are supposed to be established by DOE in areas where there is congestion. Now today you might think, wait a minute, that's not the issue today.
The issue today is getting renewables to market, which is what we're going to get to. Why does this statue talk about congestion? Why doesn't it talk about getting renewables to market? Well, it's because in 2005 getting renewables to market wasn't a big deal in Washington policy circles. That's the one reason.
The real reason is because that particular provision was negotiated in 2002. And it was negotiated among Democrats and Republicans. And they pretty much got consensus on it. And so when it came time to pass the bill in 2005, because it didn't get out in 2002, it didn't get out of the Senate, they just left the provision where it was, because they had agreement.
So it's really dealing with yesterday's problem. But it's in the bill and it says in national interest corridors, if a state withholds approval for siting for more than a year, then FERC can come in and approve it. So there are only two corridors established by DOE in the country.
One of them is actually goes from LA over to Arizona, that's one, and the other is in the middle Atlantic states, Ohio, Pennsylvania, parts of Virginia, up into New York. So there's a limited inroad on state exclusive authority over siting that happened in 2005.
What about cost allocation? The rule is still beneficiary pays. But over the last 15 years there's been an expansion of the notion of what is a benefit from transmission. As I said, the traditional notion is it's the electron is the benefit and that's it. Well, in these areas that have ISOs, they've come to think about reliability, regional liability, as being a benefit.
If you build a transmission line, a big transmission line, a 345 kV transmission line in California from LA to the northern border, it's going to add a lot of reliability. And that reliability is benefiting everybody in California. That's the theory.
So the idea is for those reliability projects, maybe the cost should be-- or the idea is that the cost should be shared by others, not just the people in LA paying for the electrons, but the people in California should pay at least some share of those costs because it benefits them in terms of reliability.
How that sharing occurs is all over the map. In New England, the New Englanders, having worked together more or less since the late 1600s, are actually the best at sharing. And they share 100% of their-- some of you would disagree, huh? But they share 100% of all of the transmission that's sized at 115 kV and above. They share among each other.
In PJM, they share 100% of their big lines 500 kV and up. In the midwest, they share 20% of their 345 kV and above. In the Southwest Power Pool, they share 33%. I think it was originally proposed to be 33 and a third, but 33% of transmission lines 60 kV and above.
And actually California is pretty good. California shares 100% if it's greater than 200 kV. And Texas actually-- Texas is almost as good as New England. I don't recall them as quite as good sharers, because Texas is just one state.
And what we find is that it's easier in these one state ISOs, like the California ISO or the Texas ISO, for sharing to occur. There aren't multiple political jurisdictions and customers tend to look at themselves as similarly situated if they're in the same state. So Texas shares 100% of all their transmission.
All of these jurisdictions allow for merchant transmission, which is an-- I'm going to come back to it at the end, so I'd like to introduce the concept. Let me backup. Transmission is guaranteed a cost recovery. Transmission is treated like a monopoly.
They don't compete with each other. You have one transmission line. There's not usually room for two. Maybe in parts of California there's enough traffic to justify more than one. So the cost of transmission is mandated to go into your rates.
Merchant transmission is a little different. And merchant transmission typically have been transmission lines where one particular generator sees an opportunity to sell power from his own independent generator somewhere else where there's a real need for it.
And the generator will pay for the transmission line himself, because he figures that if he can reach that market, there's going to be enough profit in that market to enable him to sell his electricity at a profit including covering the cost of his generation. So you see a few merchant transmission lines.
For example, one is being built or was just built to take generation from Pennsylvania to New York over an RTO seam. And New York's a big market. And the generation being sited was particularly efficient and they saw the market in New York. So all of these jurisdictions allow for merchant transmission.
OK. Is this sharing a good thing? We're going to get into that, because there's a lot of emphasis on more sharing of costs of transmission. Is it a good thing? Yes and no. But it does have some unintended consequences. They're being discussed right now in New England.
For example, if you think of serving our energy needs as a mix of electrons, demand response, efficiency. Those are all different ways and different types of investments that we can make to serve our energy needs. If you socialize the cost of transmission across an area, you can unequal the comparative playing field.
For example, in Vermont right now, they're debating what should they do to meet their energy needs? Should they invest in efficiency? Should they invest in demand response, and/or should they build a new gas fired generator?
Well, when they think of the cost of gas fired generation, and the cost to get it to load, they don't have to think about the transmission costs. So when they do the comparison between efficiency and generation, the generation cost is artificially lowered, meaning that the efficiency-- if they're going to do a cost benefit analysis, the efficiency costs have to be even better for them to justify investing, because they have to spend their own money on efficiency whereas the rest of New England will help them with their transmission lines. OK.
So what's the problem with this? Why change this system? Why is Washington talking about changing the system? Two reasons. There are two current topics that lead people to believe that it should be changed. One is there is an interest in many parts of the country of upgrading transmission to a 765 kV overlay.
The idea is maybe analogous to the interstate highway system. Here's the argument. America needs a 765 kV overlay. It needs a superhighway that can get it across these RTO seams that will enable the efficient commerce in electricity. In other words, it will enable Midwest Winds to get to Boston.
It will enable cheap coal, if you like cheap coal. If you like cheap power, it will enable cheap coal to get to New York. It will improve reliability and make the United States a world class grid. That's one argument. There are a lot of adherents to that.
So what's wrong with the present system if you want to put a 765 kV overlay in the United States? The planning areas are too small. We want at least interconnect wide planning if not national planning, like for the interstate system.
The siting, having each state get involved, too many. Too many states, too many parochial interests. They aren't going to coalesce around a national goal.
The state of West Virginia is going to veto the putting of the transmission line from Ohio to New York because they don't see any benefit in it for them, which is probably true. There probably is not much benefit in it from them, at least the way it's traditionally been sited.
And cost allocation. How much is a 765 kV overlay going to cost? A heck of a lot. Who is going to pay for it? Who is going to get most of these electrons? The big cities, Chicago, New York LA, Arizona, Philadelphia. OK, let's have them pay for it. They don't want to pay for it.
OK. So maybe every customer in the United States should pay for it. If you add it on to their bill, it's only going to be a little bit. Nobody will ever notice. We'll get a 765 kV overlay. We should have better cost allocation rules. That's the argument.
OK. What's the other issue? Getting renewables to market. What's the assumption in getting renewables to market? The assumption in getting renewables to market is if we're going to capture renewables and send the electricity to load, it's going to have to be over long distances, and same problem as with the 765 kV overlay.
The transmission planning process is too small of an area. It should be, at a minimum, regional if not grid wise. The siting process. The states are going to be problems. They aren't going to get together on a national renewable to-market plan. And the cost allocation. Those transmission lines are going to be expensive.
Although California would like to see 33% renewables, if you try and tell the citizens of San Francisco that they have to pay for the entire line from Southern Canada to San Francisco for the good of cleaning up the environment, they are going to say, well, why doesn't the rest of the country help us out?
The environment is getting-- the carbon is being lessened and it's benefiting everybody. Why should we pay the whole thing? OK. Those are the arguments.
Let's look at where we are with renewables. You can see-- because that's the argument I really want to focus on. The 765 kV argument is in there, but the one that's capturing the attention of the policymakers and the legislators on Capitol Hill is the renewables argument. Where are we here here?
Here is US wind installation. You can see we've had significant growth in wind installation over the last, particularly, five years. Wind installation by state. Let's see where my little figures are. Texas is the leader. California is doing a good job. Iowa is a leader. Lots of wind in Iowa. New York has some.
As you can see, actually, most states have at least some wind today, except the Southeast. Photovoltaics, same kind of meteoric growth in photovoltaics grid connected.
But it's important to keep in mind that, even though we've seen significant renewable growth, we're still looking at renewables as a very small percentage of the electricity portfolio. Renewables are today 3% of our portfolio. Of that wind is almost half.
Wood, surprisingly, it's like who burns wood? Do they burn wood in California? No. And they burn wood in New England. And I'm from New Mexico. We don't have any trees, so the idea of burning wood is foreign to me. Biomass is pretty good and geothermal. But as you can see, it's still a very, very small percentage.
Where are the renewables? Here's the geothermal out here in the west, in major parts of the west in Nevada up into Idaho, Oregon. And a lot of those places are not where the people are, so if you're going to harvest those geothermal renewables, you're probably going to need transmission lines.
Solar. The best solar, not surprisingly, is in the Southwest. Of course there are a lot of people in the Southwest in Southern California, in Arizona, in Texas. But if you're going to take some of the solar to other parts of the country, you're going to need transmission.
Wind. The best wind is along the coast. Actually the most of the people are along the coast, but there's a heck of a lot of wind in the Rocky Mountain area. And those states would like to develop their wind.
Many of those states, North Dakota, South Dakota, Montana, Wyoming, Colorado, are woefully undeveloped economically and they would like to develop their renewables. But they don't have the people to use them, so there's a strong desire to take that wind and ship it to market over long transmission lines.
Michigan, probably the poster child for a poor economy right now, looks at the Great Lakes and the stupendous wind potential and is talking about doing wind in the Great Lakes and having that be part of their new economic engine along perhaps with electric cars and shipping that where? Well, probably out of Michigan. Maybe into Chicago, but they're looking to ship it to New York, Boston.
Historically-- I guess historically is a couple of years-- New England was opposed. The New England political structure was opposed to developing wind off the coast, particularly-- you probably read about Walter Cronkite-- no wind farms off of the Cape. No wind farms off of Nantucket. However, more recently given the recession, there is a big interest, a growing interest, in developing offshore wind off the east coast, particularly the North East coast. OK. Let's leave that.
OK. So what's happening? There are a number of bills in Congress that would respond to this concern about extending the grid. And I'm going to talk about three of them in particular. Senator Reid, who's the majority leader in the Senate, hails from Nevada, has a bill. Senator Bingaman, who's chair of the Senate Energy Committee, has a bill and that's been passed out of the Senate Energy Committee, so it's now on the calendar of the Senate.
And in Waxman-Markey, which is the bill in the House that deals with climate change, which was passed last year by the House, also has provisions that deal with transmission. So what would they do? What would they do with siting? Senator Reid's bill would--
I'm sorry. What would they do with planning? We have to do planning first. Senator Reid's bill and Senator Bingaman's bill would set up regional planning entities, but they're undefined. It doesn't say what they would be, but they would be set up by FERC.
So you can imagine that planning is very powerful. Whoever plans the grid gets to decide. They're the ones that get to decide what's going to be built. So who's going to plan it?
So there's a lot of jockeying for who would these-- would these regional entities be something newly created or would we take something that already exists and turn it into a regional entity? Would we take the California ISO and marry it with all the rest of the transmission owners in the west and come up with an entity, or would we create some new entity in the west that doesn't exist now, or would California plan its own and the rest of the west plan? OK.
In Waxman-Markey, they would also provide that FERC-- they don't even say regional entities. Waxman-Markey says FERC would establish planning entities. From time to time. I think maybe I should have stayed at FERC. It would give me a lot of power.
What about siting? So it looks like if we pass these bills, we're going to have a regional entity. Senator Bingaman's bill would provide for interconnection wide regional entity. So ideally, there would be one in the east, one in the west, and one in Texas.
What about siting? Senator Reid's bill would leave siting the way it is, but it would expand its authority to do backstopped siting in national interest corridors and it would allow FERC to site lines in the national interest corridors even over the objection of the states.
Senator Bingaman's bill would allow FERC-- the way it's written is that FERC could veto states' siting decisions. So it would allow the states to continue to go through the motions of siting transmission, but if they said no, then FERC would get to site it.
The Waxman-Markey bill does away with all the pretense and it says FERC sites it and the states are not involved. What about cost allocation? Senator Reid's bill says FERC gets to decide cost allocation and cost shall be allocated broadly. Period.
Senator Bingaman's bill said basically the same thing. But there was an amendment in committee sponsored by Senator Corker from Tennessee, as in the area where there are no renewables, and Senator Cantwell from the Northwest, as in we already have our renewables, as in we don't want to spend money for other people's transmission to get renewables.
They put an amendment in, and it went through committee, and it's in the bill, that says you cannot spread costs across states except by showing specific economic and grid reliability benefits, not just environmental benefits. So the notion that you would look at getting renewables to market as an environmental good, as an externality, as a benefit that benefits everybody in the United States, under this legislation, unless you can get a good legal interpretation, that's certainly not the intent of the Corker amendment.
In Waxman-Markey, it's silent on cost allocation. It doesn't address the issue. One of the interesting things in Waxman-Markey is that Waxman-Markey sets up planning principles for our new transmission build out unlike the other two that don't really have any principles. And FERC gets to do what FERC thinks it should do.
Under Waxman-Markey, it said that transmission should be for the deployment of renewables and other zero carbon and low carbon energy sources. That's the purpose of building transmission. That's what it says in Waxman-Markey. It also says it should also enhance reliability, reduce congestion, ensure cybersecurity, promote motherhood and apple pie, and be cost effective.
The other interesting little twist that happened to Waxman-Markey on the way to the vote was the transmission reform was limited to the western interconnect. Why, you might wonder. Does anybody know? Why did they, after working all this out and coming up with arguably a good plan, why in the end did they take the east out of it? Pardon?
The Southeast didn't like it because they don't think they have any renewables. And they don't want to pay for anybody else's lines. But it was the New England governors.
And what happened was, right in the beginning of the fall last year, the Midwest ISO here came up with a plan. And their plan was to build transmission lines from here, but guess what? It didn't stop in the Midwest.
Their plan was to come right over here, to go into New York, and to go up to Boston. And so the New England governors got together and said, wait a minute. The Midwest is going to preempt our wind development.
Well, we don't want no Midwest wind. We have our own wind. And our own wind doesn't need so much transmission, because it just has to get offshore to Boston. So you know what? We don't want any transmission reform, because if we have transmission reform today, tomorrow we have wind from North Dakota.
So politically what's going on? In Washington, the states are jockeying. And the real basis of their objection-- their most of their objection is couched in terms of states' rights. But the real objection is that they're worried that other states will preempt their renewable development.
Either it would prohibit them, like the governors in New England are worried that the Midwest will get a jump on them and corner the market with renewables from the Midwest and take away their market for developing their own renewables, or they are worried-- or they object because they don't have renewables to develop like in the Southeast and therefore they don't want to be any part of this plan. Thank you very much. Or they've already developed their renewables, like in the Northwest.
Bonneville is up in the Northwest and Bonneville is doing a very good job. Well, the Northwest looks at hydro as renewable. And they also have a lot of wind. And Bonneville in the Northwest is a federal power marketing agency with a pretty good budget and a good history of building transmission and getting wind on the wires.
And so the Northwest looks at it. We're solving our own renewable problem. And we can do it in our own budget. So why should we pay for California's? So they've already developed their renewables or their renewables are close by and they really don't think they're going to need long transmission lines to develop their renewables for themselves, so they don't want to pay for yours. So they're objecting to the siting provisions. They're direct objecting to the cost allocation provisions.
Let's talk about the cost allocation provisions. What do the cost allocation-- if you allocate costs broadly, because it's a good thing to do for the environment and everybody will end up paying just a little bit and it will solve all of our problems, what does that do?
It just changes things. I'm not saying that it's good or bad. But I think one thing that we've lost in the debate is if we broadly allocate the costs, it changes things. What does it change? It changes today's current cost advantage of developing close by renewables.
If it doesn't matter to the people of Los Angeles whether they put solar in the Mojave Desert-- now that probably would make a lot of sense from a transmission perspective, or some sense because the transmission is short. But maybe Senator Feinstein doesn't want to put solar in the Mojave Desert. And maybe you would prefer to bring in wind from British Columbia.
That's a lot more expensive to bring in wind from British Columbia. But if you're not paying for the transmission, what do you care? So it changes the decision making paradigm from what it is today.
The current incentive today is to develop the least cost renewable because the all in cost is going to be paid for by the user. If the all in cost is not paid for by the user, it changes the incentive to an extent. There's not such a drive to develop the least cost renewable. Is that a good thing or a bad thing? It's not necessarily good or bad, but it changes it.
What else does broad cost allocation do? If the cost of transmission isn't taken into account, then the decision of whether to do offshore wind, California, wind from Montana, wind from Wyoming, wind from Colorado, wind from New Mexico, wind from Canada, they're all equal, because the transmission costs are irrelevant. So OK. Well, what are you going to develop if they're all equal? How do you choose? Which one? Pardon.
AUDIENCE: Resource.
SUEDEEN KELLY: Resource. Best resource. Best resource. And is that a good decision? Is it good to have all your wind come from one wind location? So the wind dies down, no wind, whereas if you have it from multiple locations, and if it dies down in one place, it doesn't die down in another place, easier for the system to balance.
What if they're equally good? I don't know the answer, but who's going to decide? The transmission planner. He's going to decide. Who's the transmission planner going to get to be? Oh, FERC. I get to decide if I go back, if I were to go back. So is FERC going to decide? Is that who you want to decide?
Can you imagine the politics involved in this, because there is a lot of money. If you're going to build 6,000 megawatts of wind, can you imagine the competition that's going to go on here? There's a lot of money involved in developing 6,000 megawatts of wind.
So let's go back to who's going to plan transmission. Who's going to plan transmission? Is the California ISO going to plan transmission? Are the utilities going to get together as a group and plan transmission?
Are we going to have one planning entity in the West that FERC establishes or maybe we should have a West wide regional stakeholder process? That'll be great. That'll only take 25 years.
So if you do-- if you change-- once you change these solutions or these-- once you put forward a solution that solves some problems, you just have to think about the fact that it's going to present other ones. For me, although on the one hand broad cost allocation makes sense, on the other hand, it says to me there's going to be a lot of competition for development. And who's going to decide?
And are there going to be in-- if the utilities in the West get together and decide what transmission is going to be built, what are they going to decide and how are they going to decide? And is there going to be a conflict of interest, because they also build generation?
Well, what if they have options on land in Montana? Should they be allowed to do that? Maybe we don't care. Maybe we don't care where we get the land from. And if Southern California Edison or PG&E can make more money by developing their own land, fine.
AUDIENCE: Quick question. You talk about cost allocation and sharing, but on the technical level, how are the electrons going to be managed themselves or would they be managed by some FERC overlying authority?
SUEDEEN KELLY: Well, currently, if we don't change the law and we don't change the policy, then we'll just do it the way we do it today. And currently, the electrons are managed by the regional transmission entities. And so in California, for most of California, they're managed by the Cal ISO.
In the rest of the West where there isn't an ISO, each control area, which is about the size of a utility, maybe a couple of utilities sometimes will get together and create a control area, manages its own. So in the West you'll continue to have multiple stepwise management of transmission unless you build a DC line.
And that's the discussion to build the DC line. Anybody else have any questions or want to offer any opinions or? Yeah.
AUDIENCE: So if you build transmission infrastructure for renewables, how do you prevent some states from building coal plants competing with them?
SUEDEEN KELLY: You don't unless-- there are discussions in the West, in particular, in the states that are siting lines about having a state prohibition on hooking up a coal plant. And then there are some places that say, well, we don't like nuclear either. And we don't want you to hook up a nuclear plant. And we know it doesn't emit carbon, but we don't like them.
AUDIENCE: Crunch fundamentally, talking about then policy kind of change in terms of dispatch order, you're not going to do marketable [INAUDIBLE]. You're not going to do economic dispatch. You're going to have to change the policies governing resource dispatch. And you also are going to get into the [INAUDIBLE], the physics of the system. And, fundamentally, fine. You build these huge renewable sites and site transmission. Well, lo and behold, I suspect the planner can tell you you're going to need some sort of a fossil or nuclear or something that can support them to manage the system.
SUEDEEN KELLY: Unless you-- I think you're right. Unless you plan it really well, and-- who's the professor that I just met with? Atmosphere and energy?
AUDIENCE: Professor Jacobson.
SUEDEEN KELLY: Yes. Professor Jacobson would say, if you plan it really well, and if you plan it on a big enough scale like in the West, you could actually design-- in theory I guess, you could design a portfolio of renewable resources so that instead of developing 6,000 megawatts in Montana, you've built a line and you developed a lot of wind all the way down and solar. And you could plan it so that there would always be enough solar to back up, or there would always be enough renewables to back up the intermittency of the other renewables.
AUDIENCE: Over what time horizon did this professor suggest that you put this in place?
SUEDEEN KELLY: The other thing that's happening in Texas, for example, is they're backing up their intermittent in renewables with demand response programs. And right now, you can do an economic dispatch of generation with wind, because wind's a price taker at the moment. And so you can actually dispatch your renewable wind in the-- you would think that maybe you need an environmental dispatch.
And I think that, ultimately, you're right if you want to do an environmental dispatch. But right now actually wind being a price taker, it's working, at least in Texas where they're doing a pretty good job of it, I think, of dispatching their wind under an economic system. Yeah, good point.
AUDIENCE: How do you think about energy storage reducing the costs or needs of transmission?
SUEDEEN KELLY: Energy storage is fascinating and it's really at the cusp of all new policy issues, because energy storage has traditionally, if we talk about traditionally, at least at FERC, been treated as transmission. And there's some advantages to treating energy storage as transmission, because it goes into how we recover costs for transmission.
And transmission is part of the monopoly. And all of the costs are guaranteed recovery. But of course storage is also a generation. It also produces electricity. So there is some argument to be made that you should treat it as a generator. And there are those entities that want it to be treated as a generator.
Actually in PJM we have a market rule that allows storage to be treated as a generator to provide ancillary services. And frequently the price for ancillary services in the middle Atlantic is so high on a real time basis that, even though storage is expensive, it's making the market and it's getting a profit.
So there are some storage companies that would like stores to be treated as a generator, because they actually see that they could actually make more money. And then there are some entities that want it to be treated as both, so then they could capture both revenue streams. and then there's a-- not a bad gig if you can get it.
And then there is another school of thought that says, you know what, storage should be its own category. But of course if storage is its own category, that only begins to provide an answer to the question, OK, so how do you recover its costs? But it is a fascinating issue that's just starting to come up and starting to be resolved in those areas of the country that have bid based auction markets, at least to an extent. Yeah.
AUDIENCE: If you could design a supply portfolio like that, and sort of optimize for producers' transmission costs by uploading them to a supply portfolio, would that violate FERC order 888, or I forget which one it is which requires a sort of unbundling of generation and transmission?
SUEDEEN KELLY: No. No. Because it would really-- I see where your question is-- because really, when you talk about optimizing the supply, you're really only talking about the generation.
AUDIENCE: Right.
SUEDEEN KELLY: FERC [INAUDIBLE].
AUDIENCE: If a utility had transmission assets as well as diversion assets, wouldn't that be sort of [INAUDIBLE] to that in the transmission wind generation? [INAUDIBLE]
SUEDEEN KELLY: We wouldn't let them do it. Now maybe it could happen, but we wouldn't let them. I mean there would be a rule against it.
AUDIENCE: Right. So it can't happen.
SUEDEEN KELLY: It can't happen. I mean anybody can break the rule but, no, it can't happen. Yeah.
AUDIENCE: What would be your ideal federal transmission goals?
SUEDEEN KELLY: Well, I think it's-- OK. Here's some of the things that I draw from what I've seen happen nationally. If we could come up with a national policy, it would be helpful.
Right now we don't have a national policy. And we're talking about enacting transmission reform outside of a national policy. And so what are we planning for?
We don't have a national agreement on it. And that's why the states can have this productive debate, and discussion, and criticism. If we had a carbon-- if we price carbon, if we had a cap in trade, or some bill that actually priced carbon, and said our national policy is zero carbon or reduce carbon, it would go a long way to figuring out what we're planning for.
And at least we would be able to say, like it or not, this is our national policy. We're going to pay for it broadly. Or if we had a national renewable portfolio standard, so that would be helpful.
The first thing, I think, is you have to figure out what you're planning for. Now if we can't have a national policy, politically I don't know that we can plan nationally, because without a national policy these regional differences about what we're planning for are exceedingly significant. And I don't see us getting consensus.
You could give it to FERC, but I think it would be folly for FERC to attempt to come up with a national goal. What makes California happy is not going to make Georgia happy. And if the only authority is because FERC said so, I think it will be litigated till the cows come home and we won't move forward.
So if we can't have a national policy for purposes of planning, then I think we have to plan regionally. So that's on the planning aspect. On the siting aspect, what I think should be done, what I think would be the most productive, is for the regions to get together, once you have this region, to get together and say, what do you want to do? What's your plan? What does the West want?
Right now renewables is more than an electron issue. And it's more than an environmental issue. And it's more than a way of life and a green agenda issue. It's also a huge economic development issue. These states, particularly the ones on the western side of the Rockies, are competing as vigorously as they can with each other to develop their renewables.
This is like the new-- this is the new resource. This is the new oil or gas. And these are states, many of them with economic development challenges-- North Dakota, South Dakota, Montana, Idaho, Wyoming, northern Colorado, New Mexico-- they want economic development.
They all want to send their renewables to California. They would love it. They hope that California doesn't decide to develop any of theirs. And they hope that California is willing to pay for long transmission lines to the Rockies. And they all want to send it to California.
So I'm assuming California doesn't care where it comes from, particularly if you don't want to develop your own. So ideally, politically, if you could get those governors of those states to sit down and say, OK, work it out.
They do want to develop, so you're going to have-- there's going to be a response. They want to develop. But they all want a piece of the pie. But right now is the perfect time, because that's what we have, a big pie.
We haven't sent renewables to market yet. And we have this opportunity to plan for the next 30 years about which ones we will send. Well, if you could get all the states in the west to sit down and say, OK, we want to take a little bit of-- how about you take a little bit of our solar?
Well, OK, but you have to take some of our wind. Well, we want some of our geothermal. If you could get them all together and work it out, then frankly they'd also work out the siting of the transmission lines. And everybody would get something. And they'd work it out. So could you do that?
I think that the-- well, actually I should say that the Western Governors Association started this initiative two years ago called the Western Renewable Energy Zone Initiative. And it actually is an attempt to do this. But it doesn't have a lot of umph behind it, because it requires them to make a lot of-- it's time, isn't it?
It requires them to make a lot of choices. So I think that the way you get them to actually make the tough decisions and come to an agreement is you give FERC backstop siting authority and planning authority, and you say to the states in the region-- not the PUCs but the governors-- you say you have two years or whatever to come up with a plan of which renewables you're going to develop, where you're going to put your transmission lines, and how you're going to allocate the costs.
And you guys can do whatever you want, doesn't matter. We don't care. But if you can't agree, FERC will do it. I think they need something to come to the table. So sadly, I should stop.
AUDIENCE: Suedeen Kelly, I think one more question and then I think we need to wrap up.
SUEDEEN KELLY: OK.
AUDIENCE: So one last question. OK.
SUEDEEN KELLY: You pick.
No, you pick.
SUEDEEN KELLY: No, I get to pick. OK, how about back there in the gray shirt.
AUDIENCE: Me? Yeah. Go ahead. Considering the cost allocations, if and when do environmental litigation costs become enacted, who will pay for that? For instance, if you think of it in terms of native species affect on habitat mitigation, who will pay for that and what industry will mandate those mitigation costs, for sitings?
SUEDEEN KELLY: That's a big untested assumption that environmental mitigation costs will be put into it.
AUDIENCE: So how does-- another question would be how do environmental mitigation issues get put into place, like if a state does not site a high density or high--
SUEDEEN KELLY: The only way-- there is no legal way to get it put in there.
AUDIENCE: Because of environmental issues. Who puts their foot down?
SUEDEEN KELLY: There is no legal way to do it--
AUDIENCE: Really?
SUEDEEN KELLY: --unless the individual state decides to, but it could be negotiated. There's no prohibition against it, but if you have a transmission owner that doesn't want to pay the costs, they don't have to. I mean they have to pay the costs of eminent domain, but most likely the costs of eminent domain will not include the environmental mitigation costs. But if you could work it out, it would be fine.
AUDIENCE: OK, well thank you.
Thank you.
This was fascinating.
Printable Transcript (Word Document) [90]
Directions
Now that you have watched the video, please write a paper that addresses the following four items
- Compare and contrast her presentation in 2010 about planning, permitting and cost allocation aspects of the grid with the current status of these aspects as you understand them.
- Why do you think a national planning, siting & cost allocation process has not gained much traction?
- After viewing the video what would your recommendation be to address a national policy for planning, siting and cost allocation?
- Given the regulatory environment as we know it today and the competing interests of regions (east, central and west) do you believe we can achieve a national policy of grid expansion?
Your paper should be between 700 and 1000 words long and be written in an organized and professional manner.
Submitting Your Work
Please submit your work to the Lesson 5 – The National Grid: Where do we go from here? dropbox no later than Sunday at midnight of Lesson 5 (see our course calendar for specific due date). Next week you will be asked to submit this paper to the lesson 6 discussion forum so your peers can benefit from your unique thoughts and ideas.
Grading Criteria
| Criteria | Possible Points | Total Points | |||
|---|---|---|---|---|---|
| Content | 7-8 points Every prompt in the assignment was more than adequately addressed and student stayed on topic. Student demonstrated command of the lesson content. Arguments were supported by facts from reliable sources. |
5-6 points |
4-2 points |
0-1 points |
8 |
| Mechanics | 1 point Written in appropriate academic tone with proper introductions and conclusion and appropriate paragraph structure. |
0 points |
1 | ||
| Presentation | 1 point Submission is thoroughly edited for spelling, grammatical and other technical errors. |
0 points |
1 | ||
| Total Points | 10 |
Extra Credit
The following extra credit opportunity is another Esri training module. It will take you approximately one hour to complete.
Managing Map Layers in ArcGIS Pro (1 hour)
This tutorial will give you the essentials of working with the map layers in ArcGIS Pro. It is important to ensure that map users have a good experience when viewing and dynamically exploring the features being showcased. This course introduces basic layer property settings so you can provide a simplified, focused user experience.
Learning Objectives:
After completing this course, you will be able to perform the following tasks:
- use layer properties to control the visibility of features in ArcGIS Pro;
- modify scale settings on a layer;
- explain visibility settings;
- define group layers;
- explain the benefit of grouping layers;
- modify the scale range on a group layer;
- define the definition query;
- create a definition query to display a subset of features.
Accessing and completing the tutorial
- Go to the Esri Academy [27] (www.esri.com/training/ [27]) and log in with your Esri username and password to go to the Esri Training page.
- Search for “Managing Map Layers in ArcGIS Pro” and select it from the resulting list.
- Follow the course outline to navigate and complete the course.
- Print or save a copy of the Certificate of Completion to a place where you can easily locate it.
Deliverables
Submit your Certificate of Completion to the Extra Credit: Managing Map Layers drop box by the due date indicated on the course calendar. Note: You have until the last day of class to complete this training module but I highly recommend doing them BEFORE you begin the term project in Lesson 9.
Grading Criteria
Completion of this module will result in 1 extra credit point.
Summary and Final Tasks
In this lesson, we presented an overview of the history of the electric transmission grid since its inception in the early 1900s. We presented how and why the various state and federal governments influenced the development and use of the grid, and we briefly discussed the criteria used to site new transmission lines. We also viewed some real-life video footage of actual transmission line siting controversies. Those videos gave us a quick look at the issues confronting transmission line siting teams and the "Not in My Back Yard" passion of local residents.
The takeaways from this lesson are:
- The electric grid was not planned, it evolved.
- The electric grid is regulated by some states but not by others.
- The federal government only regulates interstate transmission.
- For transmission lines crossing federal lands, an environmental assessment for those portions of the project that might impact federal lands must be conducted.
- Siting can be a long, involved process that includes many government regulations and agencies.
- Winning the approval of the public may be the biggest siting hurdle to overcome.
Reminder - Complete all of the lesson tasks!
You have finished Lesson 5. Double-check the list of requirements on the first page of this lesson to make sure you have completed all of the activities listed there before beginning the next lesson.
Tell us about it!
If you have anything you'd like to comment on, or add to, the lesson materials, feel free to post your thoughts on the Questions? Discussion Forum. For example, what did you have the most trouble with in this lesson?
Lesson 6 Esri's "Displaying Raster Data Using ArcGIS Pro " Training Course
An Overview of Lesson 6
This lesson will take us one week to complete. Please refer to the calendar for specific time frames and due dates. It has a single focus – the completion of Esri's training course: "Displaying Raster Data Using ArcGIS Pro". This course should take you approximately 3 hours to complete, so plan your time accordingly.
What will we learn in Lesson 6?
After completing this course (Esri's training course: "Displaying Raster Data Using ArcGIS Pro" ), you will be able to perform the following tasks:
- apply common methods to change the appearance of imagery;
- apply appropriate appearance functions to raster data;
- access and complete the tutorial;
- go to the Esri Academy (www.esri.com/training/ [27]) and log in with your Esri username and password to go to the Esri Training page;
- use the search function to search for the course “Displaying Raster Data Using ArcGIS Pro”;
- select the “Displaying Raster Data Using ArcGIS Pro” course from the list to begin;
- follow the course outline on the left sidebar to navigate and complete the course;
- print or save a copy of the Certificate of Completion to a place where you can easily locate it.
Activity Part 1: Complete the Tutorial
This tutorial will give you the basic raster essentials needed to complete the term project. You will learn techniques to display and enhance rasters and imagery in ArcGIS Pro, appropriately symbolize rasters based on their attributes and intended use, modify raster properties to support better visualization and interpretation, and apply out-of-the-box appearance functions to enhance the viewing experience.
Activity Part 2: Quiz
After you have completed the course, take the "Displaying Raster Data Using ArcGIS Pro” Quiz.
What is due for Lesson 6?
Deliverables
Submit your Certificate of Completion to the "Lesson 6: Raster Data" drop box by the due date indicated on the course calendar.
Grading Criteria
This activity will be graded on a simple pass/fail basis but it is worth a full 10% of your course grade. You will "pass" by submitting your Certificates of Completion!
Questions?
That's it for Lesson 6! If you have any questions, please post them to our Questions? discussion forum. I will check that discussion forum daily to respond. While you are there, feel free to post your own responses if you, too, are able to help out a classmate.
Lesson 7 - Understanding GIS Error, Accuracy, and Precision, and Metadata
An Overview of Lesson 7
The error, accuracy, and precision of the GIS data we use in projects are often overlooked when we download data from various government, open source, and commercial sources. Metadata is data about data. We'll explore these topics in more detail in this lesson.
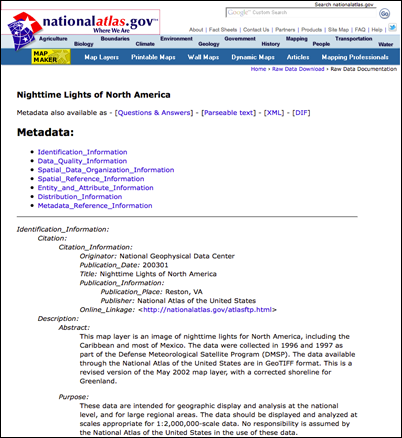
Figure 7.1: Screen capture showing metadata from the National Atlas website
Credit: National Atlas
What will we learn in Lesson 7?
By the end of this lesson, you should be able to:
- explain the requirements for meeting horizontal accuracy;
- apply the accuracy standards for different horizontal scales;
- identify sources of imprecision and error; and
- find and evaluate metadata.
What is due for Lesson 7?
This lesson will take us one week to complete. Please refer to the Calendar for specific time frames and due dates. Specific directions for the assignments below can be found in this lesson.
- Lesson 7 Quiz
- Metadata Activity
- Complete the Esri training course "Editing Basics in ArcGIS Pro"
- Download the following files titled "SAMPLE_ROUTING_PROJECT.zip", "Geography 469 Term Project_Rev_11132018_RAS.docx", "EPRI_GTC_OETL_SITING_METHODOLOGY.pdf", and "Glasgow_White_Paper.pdf" to your Desktop
- Two extra credit opportunities
- Take the anonymous, ungraded mid-course survey
Questions?
If you have any questions, please post them to our Questions? discussion forum. I will check that discussion forum daily to respond. While you are there, feel free to post your own responses if you, too, are able to help out a classmate.
GIS Errors, Accuracy, and Precision
Errors can be injected at many points in a GIS analysis, and one of the largest sources of error is the data collected. Each time a new dataset is used in a GIS analysis, new error possibilities are also introduced. One of the feature benefits of GIS is the ability to use information from many sources, so the need to have an understanding of the quality of the data is extremely important.
Accuracy in GIS is the degree to which information on a map matches real-world values. It is an issue that pertains both to the quality of the data collected and the number of errors contained in a dataset or a map. One everyday example of this sort of error would be if an online advertisement showed a sweater of a certain color and pattern, yet when you received it, the color was slightly off.
Precision refers to the level of measurement and exactness of description in a GIS database. Map precision is similar to decimal precision. Precise location data may measure position to a fraction of a unit (meters, feet, inches, etc.). Precision attribute information may specify the characteristics of features in great detail. As an example of precision, say you try on two pairs of shoes of the same size but different colors. One pair fits as you would expect, but the other pair is too short. Do you suspect a quality issue with the shoes or do you buy the shoes that fit? Would you do the same when selecting GIS data for a project?
The more accurate and precise the data, the higher cost to obtain and store it because it can be very difficult to obtain and will require larger data files. For example, a 1-meter-resolution aerial photograph will cost more to collect (increased equipment resolution) and cost more to store (greater pixel volume) than a 30-meter-resolution aerial photograph.
Highly precise data does not necessarily correlate to highly accurate data nor does highly accurate data imply high precision data. They are two separate and distinct measurements. Relative accuracy and precision, and the inherent error of both precision and accuracy of GIS data determine data quality.
Watch this!
The 11-second video below, created by Glenn Johnson from Penn State's Dutton e-Education Institute, demonstrates the difference between precision and accuracy.
Click for a text description.
There are 4 archery targets with 4 arrows landing in different places. Where the arrows land demonstrates the archers level of accuracy and precision.
Accuracy and Precision: All arrows land in the bull's eye.
Accuracy and Imprecision: All arrows land on the target in all different places but none on the bull's eye.
Inaccuracy and Precision: All the arrows land in the same area but it is not in the bull's eye.
Inaccuracy and Imprecision: Two arrows hit the target outside of the bull's eye. Two arrows miss the target altogether.
Glenn Johnson
More About GIS Error, Accuracy, and Precision
Let's go into more detail about error, accuracy, and precision. The following information is taken, with permission, from The Geographer's Craft:
1. The Importance of Error, Accuracy, and Precision
Until quite recently, people involved in developing and using GIS paid little attention to the problems caused by error, inaccuracy, and imprecision in spatial datasets. Certainly, there was an awareness that all data suffers from inaccuracy and imprecision, but the effects on GIS problems and solutions was not considered in great detail. Major introductions to the field such as C. Dana Tomlin's Geographic Information Systems and Cartographic Modeling (1990), Jeffrey Star and John Estes's Geographic Information Systems: An Introduction (1990), and Keith Clarke's Analytical and Computer Cartography (1990) barely mention the issue.
This situation has changed substantially in recent years. It is now generally recognized that error, inaccuracy, and imprecision can "make or break" many types of GIS projects. That is, errors left unchecked can make the results of a GIS analysis almost worthless.
The irony is that the problem of error is it devolves from one of the greatest strengths of GIS. GIS gain much of their power from being able to collate and cross-reference many types of data by location. They are particularly useful because they can integrate many discrete datasets within a single system. Unfortunately, every time a new dataset is imported, the GIS also inherits its errors. These may combine and mix with the errors already in the database in unpredictable ways.
One of the first thorough discussions of the problems and sources of error appeared in P.A. Burrough's Principles of Geographical Information Systems for Land Resources Assessment (1986). Now, the issue is addressed in many introductory texts on GIS.
The key point is that even though error can disrupt GIS analyses, there are ways to keep error to a minimum through careful planning and methods for estimating its effects on GIS solutions. Awareness of the problem of errors has also had the useful benefit of making GIS practitioners more sensitive to potential limitations of GIS to reach impossibly accurate and precise solutions.
2. Some Basic Definitions
It is important to distinguish from the start a difference between accuracy and precision:
2.1 Accuracy is the degree to which information on a map or in a digital database matches true or accepted values. Accuracy is an issue pertaining to the quality of data and the number of errors contained in a dataset or map. In discussing a GIS database, it is possible to consider horizontal and vertical accuracy with respect to geographic position, as well as attribute, conceptual, and logical accuracy.
- The level of accuracy required for particular applications varies greatly.
- Highly accurate data can be very difficult and costly to produce and compile.
2.2 Precision refers to the level of measurement and exactness of description in a GIS database. Precise locational data may measure position to a fraction of a unit. Precise attribute information may specify the characteristics of features in great detail. It is important to realize, however, that precise data – no matter how carefully measured – may be inaccurate. Surveyors may make mistakes or data may be entered into the database incorrectly.
- The level of precision required for particular applications varies greatly. Engineering projects such as road and utility construction require very precise information measured to the millimeter or tenth of an inch. Demographic analyses of marketing or electoral trends can often make do with less, say to the closest zip code or precinct boundary.
- Highly precise data can be very difficult and costly to collect. Carefully surveyed locations needed by utility companies to record the locations of pumps, wires, pipes and transformers cost $5-20 per point to collect.
High precision does not indicate high accuracy nor does high accuracy imply high precision. But high accuracy and high precision are both expensive.
Be aware also that GIS practitioners are not always consistent in their use of these terms. Sometimes the terms are used almost interchangeably and this should be guarded against.
Two additional terms are used as well:
- Data quality refers to the relative accuracy and precision of a particular GIS database. These facts are often documented in data quality reports.
- Error encompasses both the imprecision of data and its inaccuracies.
3. Types of Error
Positional error is often of great concern in GIS, but error can actually affect many different characteristics of the information stored in a database.
3.1. Positional accuracy and precision
This applies to both horizontal and vertical positions.
Accuracy and precision are a function of the scale at which a map (paper or digital) was created. The mapping standards employed by the United States Geological Survey specify that:
"requirements for meeting horizontal accuracy as 90 percent of all measurable points must be within 1/30th of an inch for maps at a scale of 1:20,000 or larger, and 1/50th of an inch for maps at scales smaller than 1:20,000."
Accuracy Standards for Various Scale Maps [91]
1:2,400 ± 6.67 feet
1:4,800 ± 13.33 feet
1:10,000 ± 27.78 feet
1:12,000 ± 33.33 feet
1:24,000 ± 40.00 feet
1:63,360 ± 105.60 feet
1:100,000 ± 166.67 feet
1:1,200 ± 3.33 feet
This means that when we see a point on a map we have its "probable" location within a certain area. The same applies to lines.
Beware of the dangers of false accuracy and false precision, that is reading locational information from map to levels of accuracy and precision beyond which they were created. This is a very great danger in computer systems that allow users to pan and zoom at will to an infinite number of scales. Accuracy and precision are tied to the original map scale and do not change even if the user zooms in and out. Zooming in and out can, however, mislead the user into believing – falsely – that the accuracy and precision have improved.
3.2. Attribute accuracy and precision
The non-spatial data linked to location may also be inaccurate or imprecise. Inaccuracies may result from mistakes of many sorts. Non-spatial data can also vary greatly in precision. Precise attribute information describes phenomena in great detail. For example, a precise description of a person living at a particular address might include gender, age, income, occupation, level of education, and many other characteristics. An imprecise description might include just income, or just gender.
3.3. Conceptual accuracy and precision
GIS depend upon the abstraction and classification of real-world phenomena. The users determines what amount of information is used and how it is classified into appropriate categories. Sometimes users may use inappropriate categories or misclassify information. For example, classifying cities by voting behavior would probably be an ineffective way to study fertility patterns. Failing to classify power lines by voltage would limit the effectiveness of a GIS designed to manage an electric utilities infrastructure. Even if the correct categories are employed, data may be misclassified. A study of drainage systems may involve classifying streams and rivers by "order," that is where a particular drainage channel fits within the overall tributary network. Individual channels may be misclassified if tributaries are miscounted. Yet, some studies might not require such a precise categorization of stream order at all. All they may need is the location and names of all stream and rivers, regardless of order.
3.4 Logical accuracy and precision
Information stored in a database can be employed illogically. For example, permission might be given to build a residential subdivision on a floodplain unless the user compares the proposed plan with floodplain maps. Then again, building may be possible on some portions of a floodplain but the user will not know unless variations in flood potential have also been recorded and are used in the comparison. The point is that information stored in a GIS database must be used and compared carefully if it is to yield useful results. GIS systems are typically unable to warn the user if inappropriate comparisons are being made or if data are being used incorrectly. Some rules for use can be incorporated in GIS designed as "expert systems," but developers still need to make sure that the rules employed match the characteristics of the real-world phenomena they are modeling.
Finally, It would be a mistake to believe that highly accurate and highly precision information is needed for every GIS application. The need for accuracy and precision will vary radically depending on the type of information coded and the level of measurement needed for a particular application. The user must determine what will work. Excessive accuracy and precision is not only costly but can cause considerable error in details.
4. Sources of Inaccuracy and Imprecision
There are many sources of error that may affect the quality of a GIS dataset. Some are quite obvious, but others can be difficult to discern. Few of these will be automatically identified by the GIS itself. It is the user's responsibility to prevent them. Particular care should be devoted to checking for errors because GIS are quite capable of lulling the user into a false sense of accuracy and precision unwarranted by the data available. For example, smooth changes in boundaries, contour lines, and the stepped changes of chloropleth maps are "elegant misrepresentations" of reality. In fact, these features are often "vague, gradual, or fuzzy" (Burrough 1986). There is an inherent imprecision in cartography that begins with the projection process and its necessary distortion of some of the data (Koeln and others 1994), an imprecision that may continue throughout the GIS process. Recognition of error and importantly what level of error is tolerable and affordable must be acknowledged and accounted for by GIS users.
Burrough (1986) divides sources of error into three main categories:
- Obvious sources of error.
- Errors resulting from natural variations or from original measurements.
- Errors arising through processing.
Generally errors of the first two types are easier to detect than those of the third because errors arising through processing can be quite subtle and may be difficult to identify. Burrough further divided these main groups into several subcategories.
4.1 Obvious Sources of Error
4.1.1. Age of data
Data sources may simply be to old to be useful or relevant to current GIS projects. Past collection standards may be unknown, non-existent, or not currently acceptable. For instance, John Wesley Powell's nineteenth century survey data of the Grand Canyon lacks the precision of data that can be developed and used today. Additionally, much of the information base may have subsequently changed through erosion, deposition, and other geomorphic processes. Despite the power of GIS, reliance on old data may unknowingly skew, bias, or negate results.
4.1.2. Areal Cover
Data on a give area may be completely lacking, or only partial levels of information may be available for use in a GIS project. For example, vegetation or soils maps may be incomplete at borders and transition zones and fail to accurately portray reality. Another example is the lack of remote sensing data in certain parts of the world due to almost continuous cloud cover. Uniform, accurate coverage may not be available, and the user must decide what level of generalization is necessary, or whether further collection of data is required.
4.1.3. Map Scale
The ability to show detail in a map is determined by its scale. A map with a scale of 1:1000 can illustrate much finer points of data than a smaller scale map of 1:250000. Scale restricts type, quantity, and quality of data (Star and Estes 1990). One must match the appropriate scale to the level of detail required in the project. Enlarging a small scale map does not increase its level of accuracy or detail.
4.1.4. Density of Observations
The number of observations within an area is a guide to data reliability and should be known by the map user. An insufficient number of observations may not provide the level of resolution required to adequately perform spatial analysis and determine the patterns GIS projects seek to resolve or define. A case in point, if the contour line interval on a map is 40 feet, resolution below this level is not accurately possible. Lines on a map are a generalization based on the interval of recorded data, thus the closer the sampling interval, the more accurate the portrayed data.
4.1.5. Relevance
Quite often the desired data regarding a site or area may not exist, and "surrogate" data may have to be used instead. A valid relationship must exist between the surrogate and the phenomenon it is used to study but, even then, error may creep in because the phenomenon is not being measured directly. A local example of the use of surrogate data are habitat studies of the golden-cheeked warblers in the Hill Country. It is very costly (and disturbing to the birds) to inventory these habitats through direct field observation. But the warblers prefer to live in stands of old growth cedar Juniperus ashei. These stands can be identified from aerial photographs. The density of Juniperus ashei can be used as surrogate measure of the density of warbler habitat. But, of course, some areas of cedar may uninhabited or inhibited to a very high density. These areas will be missed when aerial photographs are used to tabulate habitats.
Another example of surrogate data are electronic signals from remote sensing that are use to estimate vegetation cover, soil types, erosion susceptibility, and many other characteristics. The data is being obtained by an indirect method. Sensors on the satellite do not "see" trees, but only certain digital signatures typical of trees and vegetation. Sometimes these signatures are recorded by satellites even when trees and vegetation are not present (false positives) or not recorded when trees and vegetation are present (false negatives). Due to cost of gathering on site information, surrogate data is often substituted, and the user must understand variations may occur, and although assumptions may be valid, they may not necessarily be accurate.
4.1.6. Format
Methods of formatting digital information for transmission, storage, and processing may introduce error in the data. Conversion of scale, projection, changing from raster to vector format, and resolution size of pixels are examples of possible areas for format error. Expediency and cost often require data reformation to the "lowest common denominator" for transmission and use by multiple GIS. Multiple conversions from one format to another may create a ratchet effect similar to making copies of copies on a photo copy machine. Additionally, international standards for cartographic data transmission, storage and retrieval are not fully implemented.
4.1.7. Accessibility
Accessibility to data is not equal. What is open and readily available in one country may be restricted, classified, or unobtainable in another. Prior to the break-up of the former Soviet Union, a common highway map that is taken for granted in this country was considered classified information and unobtainable to most people. Military restrictions, inter-agency rivalry, privacy laws, and economic factors may restrict data availability or the level of accuracy in the data.
4.1.8. Cost
Extensive and reliable data is often quite expensive to obtain or convert. Initiating new collection of data may be too expensive for the benefits gained in a particular GIS project and project managers must balance their desire for accuracy the cost of the information. True accuracy is expensive and may be unaffordable.
4.2. Errors Resulting from Natural Variation or from Original Measurements
Although these error sources may not be as obvious, careful checking will reveal their influence on the project data.
4.2.1. Positional accuracy
Positional accuracy is a measurement of the variance of map features and the true position of the attribute (Antenucci and others 1991, p. 102). It is dependent on the type of data being used or observed. Mapmakers can accurately place well-defined objects and features such as roads, buildings, boundary lines, and discrete topographical units on maps and in digital systems, whereas less discrete boundaries such as vegetation or soil type may reflect the estimates of the cartographer. Climate, biomes, relief, soil type, drainage, and other features lack sharp boundaries in nature and are subject to interpretation. Faulty or biased field work, map digitizing errors [92] and conversion, and scanning errors can all result in inaccurate maps for GIS projects.
4.2.2. Accuracy of content
Maps must be correct and free from bias. Qualitative accuracy refers to the correct labeling and presence of specific features. For example, a pine forest may be incorrectly labeled as a spruce forest, thereby introducing error that may not be known or noticeable to the map or data user. Certain features may be omitted from the map or spatial database through oversight, or by design.
Other errors in quantitative accuracy may occur from faulty instrument calibration used to measure specific features such as altitude, soil or water pH, or atmospheric gases. Mistakes made in the field or laboratory may be undetectable in the GIS project unless the user has conflicting or corroborating information available.
4.2.3. Sources of variation in data
Variations in data may be due to measurement error introduced by faulty observation, biased observers, or by miscalibrated or inappropriate equipment. For example, one can not expect sub-meter accuracy with a hand-held, non-differential GPS receiver. Likewise, an incorrectly calibrated dissolved oxygen meter would produce incorrect values of oxygen concentration in a stream.
There may also be a natural variation in data being collected, a variation that may not be detected during collection. As an example, salinity in Texas bays and estuaries varies during the year and is dependent upon freshwater influx and evaporation. If one was not aware of this natural variation, incorrect assumptions and decisions could be made, and significant error introduced into the GIS project. In any case, if the errors do not lead to unexpected results, their detection may be extremely difficult.
4.3. Errors Arising Through Processing
Processing errors are the most difficult to detect by GIS users and must be specifically looked for and require knowledge of the information and the systems used to process it. These are subtle errors that occur in several ways, and are therefore potentially more insidious, particularly because they can occur in multiple sets of data being manipulated in a GIS project.
4.3.1. Numerical Errors
Different computers may not have the same capability to perform complex mathematical operations and may produce significantly different results for the same problem. Burrough (1990) cites an example in number squaring that produced 1200% difference. Computer processing errors occur in rounding off operations and are subject to the inherent limits of number manipulation by the processor. Another source of error may from faulty processors, such as the recent mathematical problem identified in Intel's Pentium (tm) chip. In certain calculations, the chip would yield the wrong answer.
A major challenge is the accurate conversion of existing to maps to digital form (Muehrcke 1986). Because computers must manipulate data in a digital format, numerical errors in processing can lead to inaccurate results. In any case, numerical processing errors are extremely difficult to detect, and perhaps assume a sophistication not present in most GIS workers or project managers.
4.3.2. Errors in Topological Analysis
Logic errors may cause incorrect manipulation of data and topological analyses (Star and Estes 1990). One must recognize that data is not uniform and is subject to variation. Overlaying multiple layers of maps can result in problems such as Slivers [92], Overshoots [92], and Dangles. [92] Variation in accuracy between different map layers may be obscured during processing leading to the creation of "virtual data which may be difficult to detect from real data" (Sample 1994).
4.3.3. Classification and Generalization Problems
For the human mind to comprehend vast amounts of data, it must be classified, and in some cases generalized, to be understandable. According to Burrough (1986, pp. 137), about seven divisions of data is ideal and may be retained in human short-term memory. Defining class intervals is another problem area. For instance, defining a cause of death in males between 18-25 years old would probably be significantly different in a class interval of 18-40 years old. Data is most accurately displayed and manipulated in small multiples. Defining a reasonable multiple and asking the question "compared to what" is critical (Tufte 1990, pp. 67-79). Classification and generalization of attributes used in GIS are subject to interpolation error and may introduce irregularities in the data that is hard to detect.
4.3.4. Digitizing and Geocoding Errors
Processing errors occur during other phases of data manipulation such as digitizing and geocoding, overlay and boundary intersections, and errors from rasterizing a vector map. Physiological errors of the operator by involuntary muscle contractions may result in spikes, switchbacks, polygonal knots, and loops [92]. Errors associated with damaged source maps, operator error while digitizing, and bias can be checked by comparing original maps with digitized versions. Other errors are more elusive.
5. The Problems of Propagation and Cascading
This discussion focused to this point on errors that may be present in single sets of data. GIS usually depend on comparisons of many sets of data. This schematic diagram shows how a variety of discrete datasets may have to be combined and compared to solve a resource analysis problem. It is unlikely that the information contained in each layer is of equal accuracy and precision. Errors may also have been made compiling the information. If this is the case, the solution to the GIS problem may itself be inaccurate, imprecise, or erroneous.
The point is that inaccuracy, imprecision, and error may be compounded in GIS that employs many data sources. There are two ways in which this compounded my occur.
5.1. Propagation
Propagation [93] [94]occurs when one error leads to another. For example, if a map registration point has been mis-digitized in one coverage and is then used to register the second coverage, the second coverage will propagate the first mistake. In this way, a single error may lead to others and spread until it corrupts data throughout the entire GIS project. To avoid this problem, use the largest scale map to register your points.
Often propagation occurs in an additive fashion, as when maps of different accuracy are collated.
5.2. Cascading
Cascading [93] means that erroneous, imprecise, and inaccurate information will skew a GIS solution when information is combined selectively into new layers and coverages. In a sense, cascading occurs when errors are allowed to propagate unchecked from layer to layer repeatedly.
The effects of cascading can be very difficult to predict. They may be additive or multiplicative and can vary depending on how information is combined, that is from situation to situation. Because cascading can have such unpredictable effects, it is important to test for its influence on a given GIS solution. This is done by calibrating a GIS database using techniques such as sensitivity analysis. Sensitivity analysis allows the users to gauge how and how much errors will affect solutions. Calibration and sensitivity analysis are discussed in Managing Error [93].
It is also important to realize that propagation and cascading may affect horizontal, vertical, attribute, conceptual, and logical accuracy and precision.
6. Beware of False Precision and False Accuracy!
GIS users are not always aware of the difficult problems caused by error, inaccuracy, and imprecision. They often fall prey to False Precision and False Accuracy, that is they report their findings to a level of precision or accuracy that is impossible to achieve with their source materials. If locations on a GIS coverage are only measured within a hundred feet of their true position, it makes no sense to report predicted locations in a solution to a tenth of a foot. That is, just because computers can store numeric figures down many decimal places does not mean that all those decimal places are "significant." It is important for GIS solutions to be reported honestly, and only to the level of accuracy and precision they can support.
This means in practice that GIS solutions are often best reported as ranges or ranking, or presented within statistical confidence intervals. These issues are addressed in the module, Managing Error [93].
7. The Dangers of Undocumented Data
Given these issues, it is easy to understand the dangers of using undocumented data in a GIS project. Unless the user has a clear idea of the accuracy and precision of a dataset, mixing this data into a GIS can be very risky. Data that you have prepared carefully may be disrupted by mistakes someone else made. This brings up three important issues.
7.1. Ask or look for metadata or data quality reports when you borrow or purchase data
Many major governmental and commercial data producers work to well-established standards of accuracy [95] and precision that are available publicly in printed or digital form. These documents will tell you exactly how maps and datasets were compiled and such reports should be studied carefully. Data quality reports are usually provided with datasets obtained from local and state government agencies or from private suppliers.
7.2. Prepare a Data Quality Report for datasets you create
Your data will not be valuable to others unless you too prepare a data quality report. Even if you do not plan to share your data with others, you should prepare a report – just in case you use the dataset again in the future. If you do not document the dataset when you create it, you may end up wasting time later having to check it a second time. Use the data quality reports found above as models for documenting your dataset.
7.3. In the absence of a Data Quality Report, ask questions about undocumented data before you use it
- What is the age of the data?
- Where did it come from?
- In what medium was it originally produced?
- What is the areal coverage of the data?
- To what map scale was the data digitized?
- What projection, coordinate system, and datum were used in maps?
- What was the density of observations used for its compilation?
- How accurate are positional and attribute features?
- Does the data seem logical and consistent?
- Do cartographic representations look "clean?"
- Is the data relevant to the project at hand?
- In what format is the data kept?
- How was the data checked?
- Why was the data compiled?
- What is the reliability of the provider?
These materials were developed by Kenneth E. Foote and Donald J. Huebner, Department of Geography, University of Texas at Austin, 1995. These materials may be used for study, research, and education in not-for-profit applications. If you link to or cite these materials, please credit the authors, Kenneth E. Foote and Donald J. Huebner, The Geographer's Craft Project, Department of Geography, The University of Colorado at Boulder. These materials may not be copied to or issued from another Web server without the authors' express permission. Copyright © 2000 All commercial rights are reserved. If you have comments or suggestions, please contact the author or Kenneth E. Foote at ken.foote@uconn.edu [97].
Metadata
What is Metadata?
Metadata is data about data. It is a summary document providing content, quality, type, creation, and spatial information about a dataset. Let’s take an example. You visit a car dealership to purchase a car. On the window of each car is a sticker giving you very specific information about the vehicle including manufacturer, make, model, size of engine, transmission type, miles per gallon, accessories, etc. This is metadata about the characteristics of a specific vehicle. It is the information you use to make an informed decision when comparing and purchasing a vehicle. Without this information, you know nothing about the vehicle and your decision to purchase becomes confusing at best. This is also true for GIS data. If you don’t know what it represents, what it covers, who made it or what quality it is, then only the originator of the data would be able to find and use it. If you do find it and use it, it may be totally inappropriate for your project and give you erroneous results.
Metadata can make clear to users the quality of a dataset or service and what it contains. Based on the metadata, you can then decide whether a dataset or service is useful or not, or whether you need to collect additional data. If the data has a metadata file, the knowledge about the data and services does not disappear if the originator of the data is no longer associated with the data.
It is not necessary for metadata to always give access to the dataset or service; however, it must always indicate where the dataset or service can be obtained.
Official standards organizations define metadata standards. By adhering to common metadata standards, organizations can readily share data. Two organizations set metadata standards. They are the International Organization for Standardization (ISO), and, in the United States, the Federal Geographic Information Committee (FGDC). The FGDC first published the Content Standard for Digital Geospatial Metadata in 1998, and it is the standard used by governmental agencies in the United States.
Where is Metadata found?
OK, so now you know something about metadata, where do you find it? Let’s look at an example.
Try this!
- Navigate to U.S. Department of Agriculture Geospatial Data Gateway [98] where you can obtain soils data for a specific state and county.
- At the landing page, click on the large green DATA button at the top right of the page.
- This brings you to a screen where you should see five tabs in the left sidebar.
- Click on 1-Where Tab. In the center panel, enter your state and county (move county to right pane using>>), then click 'Submit Selected Counties'.
- This takes you to 2-What: Scroll down the center pane until you come to 'Soils', Check the box next to US General Soils Map (STATSGO2), then click 'Continue'.
- You are now on 3-How: Click on 'Continue'.
- You are now on 4-Who: Complete the form and click on 'Continue'.
- You are now on 5-Review: Review the information and click on ' PLACE ORDER' in left sidebar.
- Your data will now be emailed to the address you included on the order form.
- Open the email, look for Ordered Items and click on the link having a .zip file.
- Navigate to where this file has been downloaded to and extract it.
- I believe you will have a file named 'Soils'. There may be a second file to extract. If so, extract this to the 'Soils' file.
- Open the soils file again, and click on a file that has the state abbreviation followed by the date in parentheses (Example: wss_gsmsoil_NC_[2006-07-06])
- Open the soil_metadata_us.txt file.
- What you will see next is the metadata for the specific county soils data you selected. You will now see the metadata including: Identification Information, Data Quality Information, Spatial Data Organization Information, Spatial Reference Information, Entity and Attribute Information, Distribution Information, and Metadata Reference Information. Explore each of these links and familiarize yourself with the information in the various categories. You will get an opportunity to practice using metadata in the class activity that follows.
Metadata Assignment
Activity
In this activity, you will explore metadata further by reviewing actual metadata sets and answering a set of questions about them.
Note
For this assignment, you will need to record your work in a word processing document. Your work must be submitted in Word (.doc) or PDF (.pdf) format so I can open it. In addition, documents must be double-spaced and typed in 12-point Times Roman font.
Directions
- Access the following metadata sets:
- Hydrology (watersheds, subwatersheds, river & streams) [99]
- Digital Ortho Quads [100]
- Watershed Drinking Water Data - Mecklenburg County, NC [101] (Click the DATA Tab > in search box type: Storm Water Watersheds > Click: Metadata).
- For each dataset, answer the following questions in a word processing document. If you cannot find the answer within the metadata, state that as your response:
- What agency or organization created the data?
- When was the data created?
- What is the GIS format (raster or vector)?
- What is the resolution of the data?
- If raster, report cell size
- If vector, report scale
- What is the spatial reference of the data?
- Coordinate system (Geographic, UTM, State Plane, etc.)?
- Projection (Unprojected, Transverse Mercator, Albers Equal Area, etc.)?
- Datum (WGS84, NAD83, NAD27, etc.)?
- How was the original data created (scanned maps, satellite, survey, etc.)?
- What time period does the data cover?
- What data attributes are used?
- What is the unit of the attribute?
- Was all of the data needed to answer the questions readily available?
- How would you rate the data quality of the dataset on a scale of 1 to 5, with 1 = poor data quality and 5 = excellent data quality?
- At the end of your word processing document, respond to the following question:
- What did you learn about metadata from doing this activity?
- Save your work as either a Microsoft Word or PDF file in the following format:
Lesson2_Metadata_AccessAccountID_LastName.doc (or .pdf).
Submitting your work
Submit your work to the Lesson 7 - Metadata drop box by the due date indicated on our course calendar.
Grading Criteria
This activity is graded out of 5 points
| CRITERIA | 8 | 6 | 4 | 2 | 0 |
|---|---|---|---|---|---|
| Dataset Questions | Fully answered all 11 questions for all 4 datasets | Fully answered all 11 questions for 3 of the 4 datasets | Fully answered all 11 questions for 2 of the 4 datasets | Fully answered all 11 questions for 1 of the 4 datasets | Did not fully answer the 11 questions for any of the datasets |
| Answer to Item #3? | n/a | n/a | n/a | Provided written response to Item #3 questions | No written response to Item #3 is provided |
Activity: Editing Basics in ArcGIS Pro
For this activity, you will be completing the Esri tutorial: Editing Basics in ArcGIS Pro. This tutorial will teach you editing basics and work flows. You want to be confident that your data is up to date and accurate. ArcGIS Pro provides editing tools that allow you to update existing features or create new features. Using editing functionality in ArcGIS Pro, you can change the geometry of features or the informational attributes.
Learning Objectives
After completing this course (Esri tutorial: Editing Basics in ArcGIS Pro), you will be able to perform the following tasks:
- create new features and attributes;
- use tools to modify existing features and attributes;
- access and complete the tutorial;
- go to the Esri Academy (www.esri.com/training/ [27]) and log in with your Esri username and password to go to the Esri Training page;
- use the search function to search for the course “Editing Basics in ArcGIS Pro”;
- select the “Editing Basics in ArcGIS Pro” course from the list to begin;
- follow the course outline on the left sidebar to navigate and complete the course;
- print or save a copy of the Certificate of Completion to a place where you can easily locate it.
Activity Part 2: Quiz
After you have completed the training course, complete the "Introduction to ArcGIS Reflection Quiz".
Deliverables
Submit your Certificate of Completion to the Lesson 7: Editing Basics in ArcGIS Pro drop box by the due date indicated on the course calendar.
Grading Criteria
This activity will be graded on a simple pass/fail basis but it is worth a full 10% of your course grade. You will "pass" by submitting your Certificate of Completion!
Download Activity
In this activity, we are going to download a dataset that you will use in Lesson 9. You need to complete this task now so that you are ready to jump in and get started on the Lesson 9 Term Project on the first day of Lesson 9. You will be asked to provide a screenshot of your successfully downloaded file as proof.
Directions
Caution
- This activity requires you to pay close attention to detail and follow the instructions completely. Failure to do so can result in extreme frustration.
- The following steps require you to have a C:\temp folder and to unzip files. If you are unsure how to do either of those, watch the Downloading the Term Project Files [102] video in the Term Project Module before getting started.
1. Installing the sample routing project files on your own computer
- Verify your computer has a "C:\temp folder", If not create one.
- Copy the file titled "SAMPLE_ROUTING_PROJECT.zip" to your Desktop or to your Downloads folder on your PC/Laptop. The file is located in the "Term Project Materials" folder.
- To download the file to your own computer, right-click the location link and select "Save Target As" or "Save Link As" from the pop-up menu.
- Once the zipped file is downloaded to your computer, double-click on the downloaded zip file to decompress it to your C:\temp folder. You should end up with a folder called C:\temp\SAMPLE_ROUTING_PROJECT.
Note
THE "SAMPLE_ROUTING_PROJECT" FOLDER SHOULD BE UNZIPPED TO THE C:\temp folder. The siting model may not execute if saved to some other location.
- Verify that the "SAMPLE_ROUTING_PROJECT" folder created in your C:\temp folder (C:\temp\SAMPLE_ROUTING_PROJECT\) contains the following folders/files:
- Analysis folder
- Data folder
- Base_Map.mxd (Esri Map Document)
- SampleProject_Toolbox_v3.tbx
- Simplified_Epri_model.xls
- Simplified_Route_Evaluation_spreadsheet.xls
- Take a screenshot that shows evidence you have successfully completed the download. It should look similar to the one below:
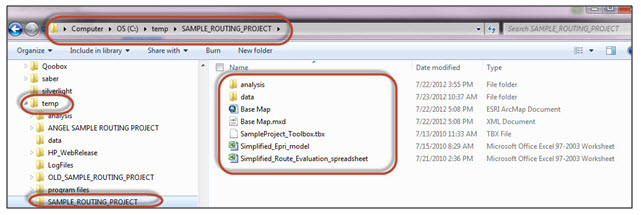
- Save your screenshot using the following naming convention:
L7_download_AccessAccountID_LastName
For example, student Elvis Aaron Presley's file would be named "L7_download_eap1_presley"—this naming convention is important, as it will help me make sure I match each submission up with the right student!
2. Installing transmission line siting exercise for use on a Penn State computer lab computer
If you plan to use a Penn State Computer Lab, follow this link to Additional Instructions for Penn State Computer Labs [103]
Having Problems?
If you are having problems, please consult the FAQ [104]for answers to some of the most frequently asked questions. If that doesn't help, post your questions to the Lesson 7 Discussion Forum.
Submitting Your Work
Upload your screenshot to the "Lesson 7 - Download Screenshot" drop box by the due date indicated on our calendar.
Grading Criteria
The grading for this is slightly different from other assignments. Successful and timely completion of this activity will be reflected in your Lesson 9 grade. The grading will be as follows:
- Completed on time (by end of Lesson 7, see Calendar for details): You will receive two (2) extra points for your Lesson 9 activity. This is the equivalent of half a letter grade for the Lesson 9 activity.
- Completed one (1) to three (3) days late: You will lose 2 points which is the equivalent of half a letter grade for the Lesson 9 activity.
- Completed four (4) or more days late: You will lose 4 points which is the equivalent of a whole letter grade for the Lesson 9 activity.
Extra Credit
This week you have two extra credit opportunities, both of which are Esri training courses.
1. Displaying Data in ArcGIS Pro (1 hour 15 minutes)
Symbol size, color, shape, and pattern affect the user's perception and the map's overall meaning. This course introduces ArcGIS Pro tools for symbology. Learn how to select symbology that represents your data and supports the message you want your map to convey.
Learning Objectives
After completing this course, you will be able to perform the following tasks:
- Apply a single symbol to a layer in ArcGIS Pro.
- Apply symbols to a layer in ArcGIS Pro using categorical and quantitative attributes.
Accessing and completing the tutorials
- Go to the Esri Academy [27] (www.esri.com/training/ [27]) and log in with your Esri username and password to go to the Esri Training page.
- Search for “Displaying Data in ArcGIS Pro” and select it from the resulting list.
- Follow the course outline to navigate and complete the course.
- Print or save a copy of the Certificate of Completion to a place where you can easily locate it.
Deliverable
Submit your Certificate of Completion to the Extra Credit: Displaying Data in ArcGIS Pro drop box. Note: You have until the last day of class to complete these but I highly recommend doing them BEFORE you begin the term project in Lesson 9.
Grading Criteria
Completion of this module will result in 1 extra credit point.
2. Querying Data in ArcGIS Pro (30 minutes)
A single dataset may store thousands of records and querying the dataset is a fast way to find features. Learn the building blocks of a query expression and how to select features that meet one or more attribute criteria.
Learning Objectives
After completing this course, you will be able to perform the following tasks:
- construct queries in ArcGIS Pro to select features based on specific attributes;
- describe common data types that are used to define feature attribute fields;
- identify the components of an attribute query;
- construct a query using an attribute field that has text values;
- construct a query using an attribute field that has numeric values.
Accessing and completing the tutorial
- Go to the Esri Academy [27] (www.esri.com/training/ [27]) and log in with your Esri username and password.
- Search for “Querying Data in ArcGIS Pro” and select it from the resulting list.
- Follow the course outline to navigate and complete the course.
- Print or save a copy of the Certificate of Completion to a place where you can easily locate it.
Deliverables
Submit your Certificate of Completion to the Extra Credit: Querying Data in ArcGIS Pro drop box by the due date indicated on the course calendar. Note: You have until the last day of class to complete these but I highly recommend doing them BEFORE you begin the term project in Lesson 9.
Grading Criteria
Completion of this module will result in 1 extra credit point.
Summary and Final Tasks
As you learned in this lesson, errors can be injected at many points in a GIS analysis, and one of the largest sources for this error is in the data collected. Each time a new dataset is used in a GIS analysis, new error possibilities are introduced.
Sources of data come from numerous locations, and you learned that understanding where the data came from, how it was collected, and how it was validated is essential if the GIS analysis based on this data will be used to make decisions that impact public safety and welfare and the environment.
You learned that metadata is the critical information source for determining if the data is relevant for your project. You learned how to read metadata and extract important information from the metadata related to timeliness, relevance, scale, accuracy, and data source, and where to obtain this data.
As you implement GIS projects, you now have the basis to evaluate your data sources before you use them and to make use of the most appropriate data for your projects. This should be one of the first GIS tasks you employ when conducting a new analysis.
Reminder - Complete all of the lesson tasks!
You have finished Lesson 7. Double-check the list of requirements on the first page of this lesson to make sure you have completed all of the activities listed there before beginning the next lesson.
Tell us about it!
If you have anything you'd like to comment on, or add to, the lesson materials, feel free to post your thoughts in the Questions? Discussion Forum.
Lesson 7 & 9 FAQ
LESSON 7
- Where are the files located for the Lesson 7 Activity?
- In the Term Project Materials folder
- How do I download the Lesson 7 Activity Files?
- Click on the SAMPLE_ROUTING_PROJECT.zip file and follow the download instructions that appear on the screen.
- Where do I download the files to?
- Download to your C:\temp folder.
- My computer does not have a C:\temp folder, what should I do?
- Create a C:\temp folder:
- Click on the START icon (Lower left corner of your screen).
- Click on File Explorer icon (Looks like a folder).
- Click on Local Disk (C:), click on HOME (Top Menu) select NEW FOLDER, then type in “temp” (without quotes) for the folder name.
- The folder should look like this C:\temp
- You can also watch the first 7:30 minutes of the Downloading Term Project Files [102] video for details about how to create a C:temp folder
- Create a C:\temp folder:
- How and where do I extract the zipped file?
- Right-click the downloaded zipped file and choose EXTRACT ALL..., the unzipping program associated with your computer. Extract the files to the C:\temp folder.
- NOTE: IF YOUR COMPUTER DOES NOT HAVE A FILE EXTRACTION (UNZIPPING ) PROGRAM, EITHER DOWNLOAD 7-ZIP [105] OR WINZIP [106](FREE VERSION).
- You can also watch the last 4 minutes (starting at 7:40) of the Downloading Term Project Files [102] video for directions on extracting (Unzipping) the appropriate files.
- What should my C:\temp folder look like once I have extracted the files?
-
- What folders/files should be present in my C:\temp\SAMPLE_ROUTING_PROJECT\ folder?
- Folders: analysis & data
- Files: Base Map, Base Map.mxd, SampleProject_Toolbox_v3.tbx, Simplified_Epri_model and Simplified_Route_Evaluation_spreadsheet
- My folder/ file structure looks like this: C:\temp\SAMPLE_ROUTING_PROJECT\SAMPLE_ROUTING_PROJECT\ is this OK?
- The folder/file structure must look like this: C:\temp\SAMPLE_ROUTING_PROJECT\
- If it looks incorrect, delete the folders and again extract the zipped folder, but this time to C:\temp
- Will the Sample Routing Project files execute in ArcGIS PRO if they are located in some other location?
- These files must be located in the C:\temp folder for you to execute the Lesson 9 Activity.
- What if I do not complete the download before the end of Lesson 7?
- You will have deducted points from your Lesson 9 Activity.
LESSON 9
- Where are the files located for the Lesson 9 Activity?
- In the Term Project Materials folder
- How do I download the Lesson 9 Activity Files?
- Click on a file and follow the download instructions that appear on the screen.
- Where do I download the files to?
- Siting Transmission Lines Using the EPRI-GTC Siting Methodology file
- Download to your Desktop.
- Transmission Line Siting Exercise Instructions file
- Download to your Desktop.
- SAMPLE_ROUTING_PROJECT.zip file
- This should have already been downloaded to your C:\temp folder and unzipped in Lesson 7.
- Siting Transmission Lines Using the EPRI-GTC Siting Methodology file
- Will the Sample Routing Project files execute in ArcGIS PRO if they are located in some other location?
- These files must be located in the C:\temp folder for you to execute the Lesson 9 Activity.
- How do I start the Lesson 9 Activity?
- Follow the instructions starting on Page 2 of the 'Transmission Line Siting Exercise Instructions ArcGIS Pro' document you downloaded to your Desktop.
- What if I don’t follow the instructions exactly?
- There is a good chance your project will not execute properly.
- How long will it take me to complete the Lesson 9 Activity?
- ArcGIS PRO modeling: 3-5 hours
- Write-up: 2-4 hours
- What if I have problems running the ArcMap Exercise?
- Post your problem in the Lesson 9 General Questions and Comments Discussion Forum.
- Send your instructor an email.
Lesson 8 - Finding GIS Data for Siting Projects
An Overview of Lesson 8
Where do we find data for our GIS applications? This lesson will focus on the data sources needed to conduct GIS analysis for siting of electric transmission lines. Data is available from many sources including federal, state, and local government data, open source data, free data made available by private companies, and fee-based data sources. Though data is available from these sources, it may not be easy to find or the data quality may not be appropriate for use in a particular siting project. We will explore data sources in the public domain, what types of data are available and how to obtain this data for use in GIS applications. You will apply what you learned about metadata in Lesson 7 to determine the data type, the coordinate system used, the scale, the accuracy and the source of the data.
What will we learn in Lesson 8?
The goal of this lesson is to give you practical experience finding and downloading data specific to evaluating the environmental components of the transmission line siting process. By the time you complete this lesson, you should be able to:
-
identify the types of data that are available;
-
identify sources of this information;
-
choose appropriate data for a given location;
-
assess the quality of data by reviewing metadata.
What is due for Lesson 8?
This lesson will take us one week to complete. Please refer to the Calendar for specific time frames and due dates. Specific directions for the assignment below can be found in this lesson.
- a spreadsheet showing your sources of data
Questions?
If you have any questions, please post them to our Questions? discussion forum. I will check that discussion forum daily to respond. While you are there, feel free to post your own responses if you, too, are able to help out a classmate.
Types of Available GIS Information and Where to Find It
Siting projects use the full spectrum of GIS data, including vector date, raster data, attribute data, and imagery. As you learned in Lesson 3, vector data is represented by points, lines, or polygons, while raster data can consist of gridded data, such as topographical maps and digital elevation models, attribute data, which describes characteristics of the spatial features, and, finally, aerial and satellite imagery.
Where to find GIS information
There are many sources for obtaining data for siting projects. Many sources of data are available for download, and I would encourage you to explore on your own to find additional sources. A good summary of the topic of GIS data sources can be found at Maps & Geospatial: Geographic Information Systems (GIS) [107] .
The USGS Center for Excellence for Geospatial Information Sciences [108] is a good place to start finding data on the national level. This is a gateway to the National Map [109], a collaborative effort among the USGS and other federal, state, and local partners to improve and deliver topographic information for the Nation. Raw GIS data can also be accessed and downloaded from the USGS National Atlas Raw Data Download site [110]. Another good starting point for nationwide data is data.gov: geospatial. This is the federal government's "one-stop shop" for finding and using geographic data. The data categories important to siting projects that you can browse and download include:
- Environment
- Political Boundaries
- Agriculture
- Atmosphere
- Biology
- Demographic
- Elevation
- Geology
- Imagery and Basemaps
- Inland waters
- Transportation
- Utilities
Try This!
The following link shows you how to use the data.gov portal:- Frequently Asked Question about Data.gov portal: Data.gov FAQ [111]
Soils Data
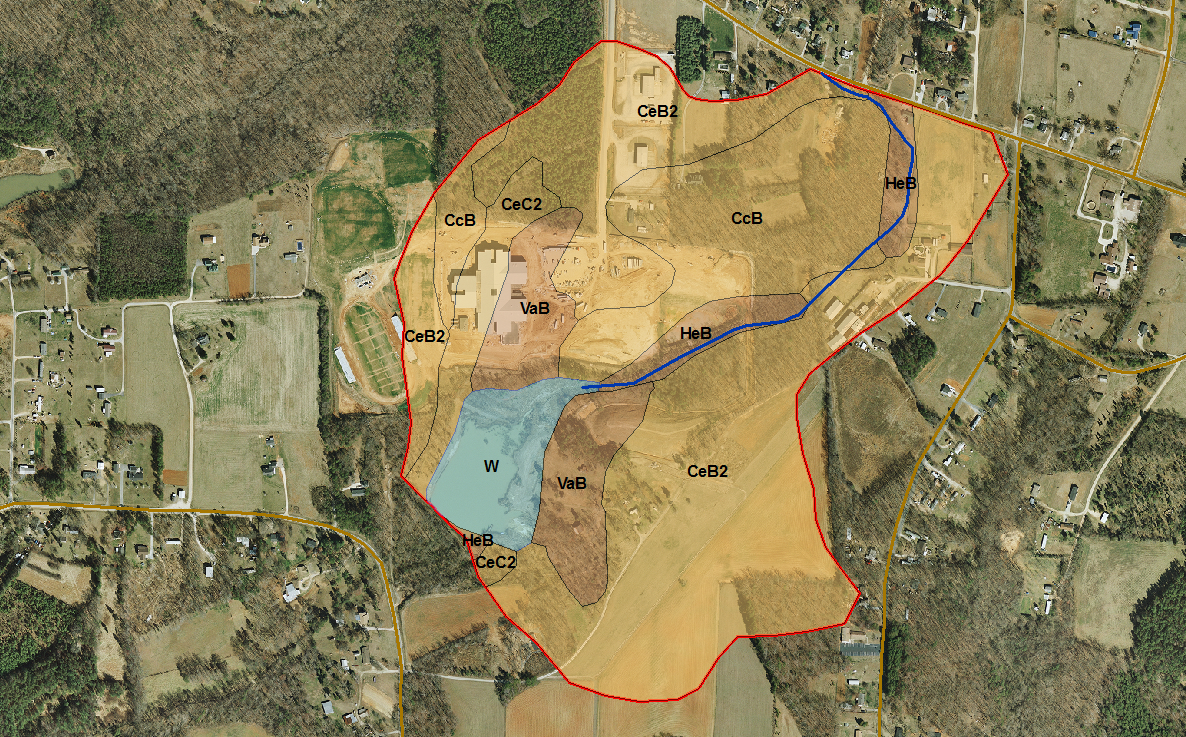
Figure 8.1: Here is an example of how soils data is displayed and used. In this application, soils data was combined with landuse data to determine runoff coefficients for use in estimating runoff to streams during rainfall events.
Credit: Ron Santini
Why we need it
Soils information plays an important role in both the engineering and the environmental aspects of siting. From an engineering perspective, soils data provides information about soil stability, depth to groundwater, depth to bedrock, and other characteristics that impact the construction of transmission towers. From an environmental perspective, soils information provides information about runoff and erosion potential, wetlands, and groundwater.
Where to find it
- The Natural Resources Conservation Service at the United States Department of Agriculture maintains soils surveys for most every county in the United States. In addition, the local county agriculture extension office also has this information available in both digital and hard copy form.
- State and local soils data can be searched and downloaded from the U.S. Department of Agriculture Geospatial Data Gateway [98]. Click on the big green GET DATA button at the top center of the page. You will be directed to the soil data mart to select a state you are interested in.
Tell us about it!
Do you have a suggestion or two for additional data sources? Do you know of any international sources? Use the Discussion Forum to share your suggestions with the class!
Topographic Data
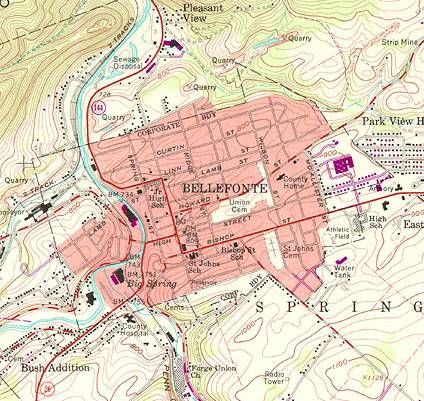
Figure 8.2: Topographic map of Bellefonte, PA
Credit: Penn State University
Topographic maps provide much more information than just showing the physical characteristics of the land. In this section of a USGS Topo Quad, not only are the land contours visible, but this map also shows the major roads leading into and out of Bellefonte, PA, the Bellefonte street system, the major structures present, individual residences, railroad tracks, power lines, and much more. Topo maps play a major part in siting electric transmission lines.
Why we need it
Topographic data shows the lay of the land, and topography is a critical criterion in the selection of a proposed route or alternate routes. By reviewing topographical data, siting planners and engineers can identify slope and stability issues, wetlands, stream crossings, etc., to select the most cost-effective route while minimizing impacts to the environment. This data also allows engineers to develop plans to mitigate the environmental impact during the construction phase. For example, in the United States, each stream crossing for temporary roads requires obtaining a state permit. In addition, erosion and sedimentation control plans are required for construction activities that will impact streams.
Where to find it
- Topographical maps are available for the most of the United States. Individual maps can be downloaded from the USGS The National Map US Topo site [112]. On the left side menu, click on "Download Maps (Map Store)" to navigate to the interactive map where you can locate and download topographical maps.
- Digital Elevation Model (DEM) data can also be downloaded from the National Map [113]. Landcover data can also be downloaded from that site.
Tell us about it!
Do you have any suggestions for additional data sources? Do you know of any international sources? Use the Discussion Forum share your suggestions with the class!
Geologic Data
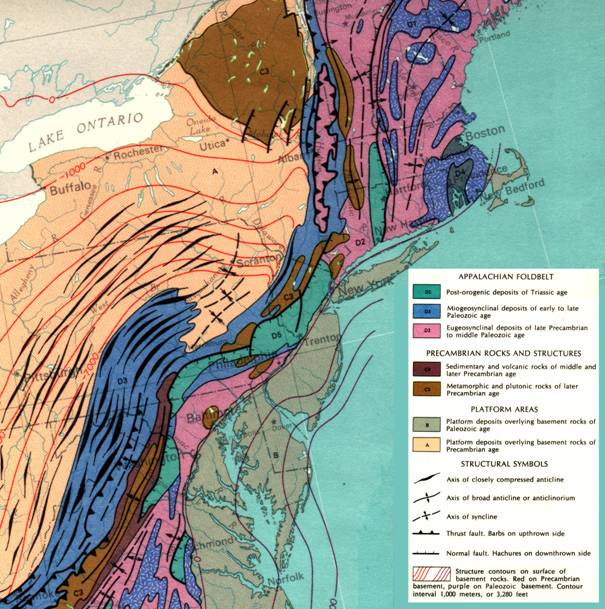
Figure 8.3: Example of a Geologic Map
Credit: National Atlas, US Geological Survey
Why we need it
Geologic data provides siting engineers with the information they need to determine earthquake and foundation design requirements for towers. Geologists and environmental scientists use the geologic data to determine what type of rock underlays the route and whether this rock has characteristics that could cause environmental concerns if exposed or disturbed.
Two examples come to mind. The first is an overhead electric transmission line constructed by a major electric utility through Panther Valley in western North Carolina. During the construction of the transmission line, acidic rock was exposed. When exposed to air and water, this rock created acidic runoff impacting otherwise pristine streams. Action by the utility company to mitigate this rock exposure prevented widespread surface water degradation. A second, and more costly, example is the construction of Interstate I-99 through Central Pennsylvania. During I-99 construction in 2003, Pennsylvania Department of Transportation (PennDOT) crews first dug into the sulfur-bearing rock material (pyrite) in the Skytop section, near State College, and then continued to dig, using some of the million cubic yards of pyrite-laced sandstone as fill under the new highway and leaving the rest in spoil piles along the road. Seven years later, in 2010, after I-99 excavation exposed a massive amount of sulfur-bearing rocks, officials said the cost to undo the environmental damage totaled $100 million! Here is just one link to the I-99 problem: NY Times article [114]
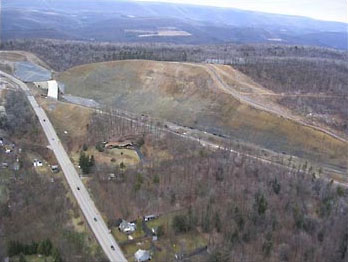
Where to find it
- The National Geologic Map Database [116]is a USGS maintained catalog of geologic and geoscience maps and data.
- Additional sources of digital geologic data can be obtained from many individual State Geological Survey websites. Here is an example from the Maryland Geological Survey [117].
Tell us about it!
Do you have any suggestions for additional data sources, either national or international? Do you have examples similar to the I-99 scenario above? Use the Discussion Forum to share your suggestions with the class!
Aerial and Satellite Imagery
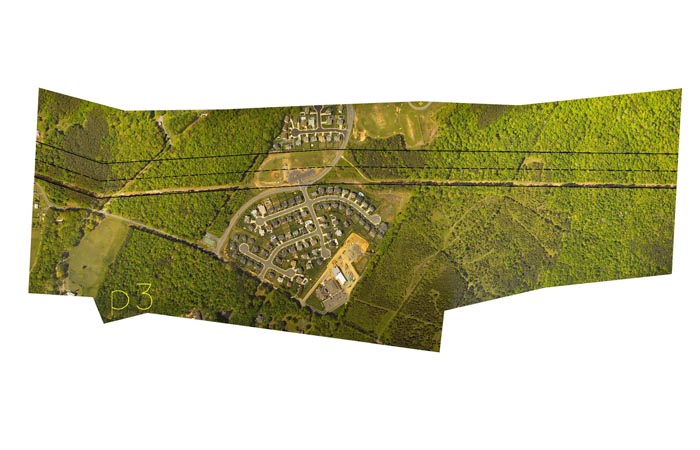
Figure 8.5: Aquia Harbour - Garrisonville 230kV Double-Circuit Line
Credit: Dominion Resources [118]
This aerial photo shows how Dominion Resources [119] use aerial photography to overlay proposed transmission lines. It provides the transmission line siting team with a visual picture of where to position transmission lines to minimize the impact on people and the environment. There are times when the optimum route does have an impact, such as the corridor route depicted in the above aerial.

Figure 8.6: Aerial view of the University Park campus of Penn State
Credit: Andy Colwell
Why we need it
Aerial and satellite imagery give us a picture in time of what the landscape of the project areas looks like. This imagery provides much more detail than a topographical map. By overlaying planned routes on aerial images, siting planners can readily visualize obstacles that can hinder permitting and construction. For example, population density, structure density, wetlands, water bodies, forest land, agriculture operations, and existing transmission lines are easily identified through an analysis of the aerial imagery. In addition, by comparing current and historical imagery, siting planners can identify projected commercial and residential growth areas and plan alternate routes to circumvent them.
Where to find it
- The United States Department of Agriculture maintains the National Agriculture Imagery Program [120] (NAIP). NAIP acquires aerial imagery during the agricultural growing seasons in the continental United States. A primary goal of the NAIP program is to make digital orthophotography available to governmental agencies and the public within a year of acquisition.
- Another source for aerial imagery is the USGS National Aerial Imagery Program [121].
- Most state and county governments make imagery available for use in GIS applications. For example, 2005 Illinois Digital Orthophoto Quarter Quadrangle data can be downloaded from the Illinois State Library [122]. See "Individual State GIS Data" later in this lesson for a comprehensive list of available state GIS data.
Tell us about it!
Do you have a suggestion or two for additional data sources? Do you know of any international sources? Use the Discussion Forum to share your suggestions with the class!
Watershed, River, and Wetlands Data
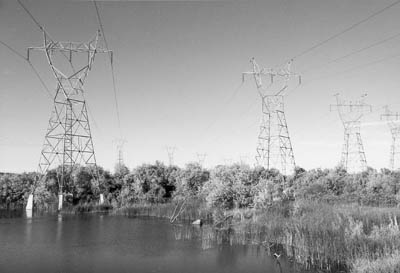
Figure 8.7: Power and environment can exist side-by-side. These BPA transmission towers are located in a wetland and wildlife refuge below McNary Dam in eastern Oregon. The refuge is part of the Columbia River dam project, built by the U.S. Army Corps of Engineers. BPA's power towers were designed to be compatible with the wetlands and refuge set aside in the area.
Credit: Bonneville Power Administration
Why we need it
The impact on water quality from siting corridors is a major concern during construction, and identifying streams and wetlands to be crossed or encroached on during construction is a an important factor in siting decisions. The location of wild and scenic rivers, special stream designations, such as cold water fisheries or trout streams, or impaired streams may require additional permitting during the planning phase of siting and increased monitoring during and after the construction phase. The location of waters used as sources for public drinking water may require additional erosion and sedimentation control permitting and monitoring. The construction of power lines through wetlands or constructing road crossings through wetlands requires a wetlands identification and assessment, and a permit issued by the US Army Corps of Engineers. The permit will outline the mitigation steps to minimize the impact to the wetland.
Where to find it
- The National Hydrography Dataset [123](NHD) is the surface water component of The National Map. The NHD is a digital vector dataset used by geographic information systems (GIS). It contains features such as lakes, ponds, streams, rivers, canals, dams, and stream gauges. These data are designed to be used in general mapping and in the analysis of surface-water systems.
- The United States Environmental Protection Agency (USEPA) US waters. Watershed Assessment, Tracking & Environmental ResultS (WATERS) [124] is an integrated information system for the nation's surface waters. The EPA Office of Water manages numerous programs [125] in support of the Agency's water quality efforts. Many of these programs collect and store water quality related data in databases.
- USEPA's Surf Your Watershed [126] provides data about individual watersheds and links to the USEPA's Envirofacts Warehouse [127] where additional data for water, waste, air, land, toxins, compliance, radiation, and other data can be accessed and downloaded.
- The United States Geological Survey collects water resources data from approximately 1.5 million sites throughout the United States, the District of Columbia, Puerto Rico, the Virgin Islands, Guam, American Samoa, and the Northern Mariana Islands. Real-time information about surface water, groundwater, and water quality can be accessed and retrieved through the National Water Information System [128].
- National Oceanic and Atmospheric Administration's Hydrometeorological Design Studies Center [129] contains precipitation data, links to watershed and stream-flow data, and maps and aerial photographs.
- The CUAHSI Hydrologic Information System [130] is an Internet-based system for sharing hydrologia data. It is comprised of databases and servers connected through Web services to client application that allow for the discovery, access, and publication of hydrologic data.
- Wetlands data can be accessed through the U.S. Fish & Wildlife Service's National Wetlands Inventory. [74] This service has developed a series of topical maps to show wetlands and deep-water habitats. This geospatial information is used by federal, state, and local agencies, academic institutions, and private industry, for management, research, policy development, education, and planning activities.
Tell us about it!
Do you have a suggestion or two for additional data sources? Do you know of any international sources? Use the Discussion Forum to share your suggestions with the class!
Rare, Threatened, and Endangered Species Data
Figure 8.8: Map of State Endangered Plant Laws
Why we need it
The Endangered Species Act of 1973 required the identification and protection of endangered species' critical habitats. As a result, assessments and mitigation plans must be created and approved prior to the construction of transmission lines.
Where to find it
- The United States Fish & Wildlife Service [132] maintains a database of rare, threatened, and endangered species for use in GIS applications. The International Union of Conservation and Nature [133] (IUCN) also maintains information on rare and endangered species.
Tell us about it!
Do you have a suggestion or two for additional data sources? Do you know of any international sources? Use the Discussion Forum to share your suggestions with the class!
Land Use and Land Cover Data
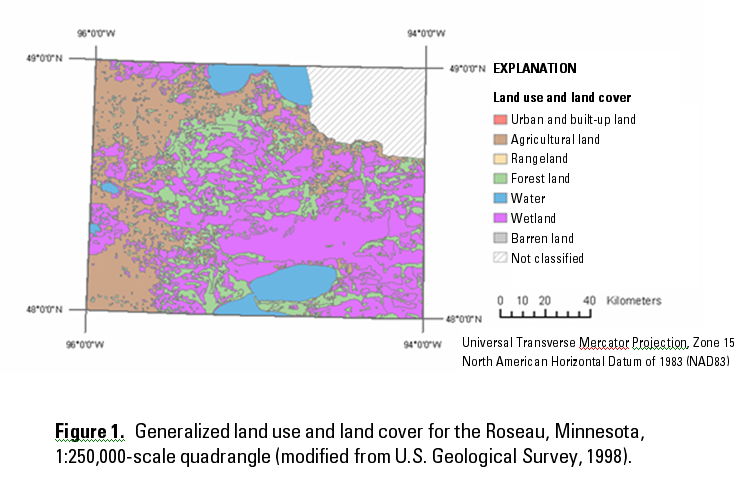
Figure 8.9: Generalized land use and land cover for the Roseau, Minnesota, 1:250,000-scale quadrangle (modified from U.S. Geological Survey, 1998).
Credit: U.S. Geological Survey - Data Series 240 [134]
The map above depicts some of the 21 categories of land use and land cover (LULC) used by the United States Geological Survey. These LULC categories may be used at the state, regional, or local levels. This land use and land cover data was derived from 1970s and 1980s aerial photography.
Why we need it
Land Use and Land Cover (LULC) designations provide general descriptions of the natural and cultural activities taking place within a project area. LULC designations provide the siting planners with information on what type of land use may be in the proposed transmission right-of-way. This information assists the planners in route selection. By comparing current land-use patterns with historic land use patterns, and combining this information with aerial photography, the planners can identify preferred and alternate routes for the transmission lines. Prior to GIS, planners had to manually evaluate this data and the results were subjective. These individual layers of data can be combined easily in GIS and spatially analyzed to arrive at a better understanding of how LULC will impact a proposed transmission line without the uncertainty of manual analysis.
Where to find it
- The most accurate LULC data is digitized from current aerial imagery available from most state or local government GIS clearinghouses (see the section "Individual State, County and Municipal GIS Data"). It is also available from the National Map [113], but this data has not been updated since the 1980s because of funding issues.
- An article titled "6 Best Sources for Local Land Use/Land Cover GIS Data" [135] from the Plannovation Blog can help you with your search for LULC data.
Tell us about it!
Do you have a suggestion or two for additional data sources? Do you know of any international sources? Use the Discussion Forum to share your suggestions with the class!
Cultural Resources Data
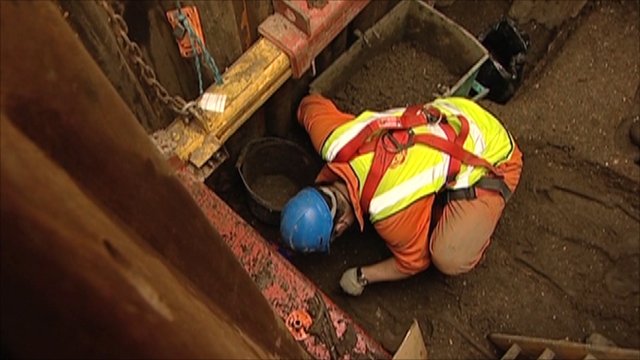
The picture above shows the Crossrail Tunnel [137] archaeology dig in London, England, where archaeologists, surveying the ground at Liverpool Street station in preparation for Crossrail tunneling, have unearthed hundreds of skeletons on the site of a historic mental health hospital. Opened in 1247, St. Bethlehem hospital was the first institution dedicated to mental health patients and is believed to have led to the coining of the word "bedlam." The site now lies beneath what will be Liverpool Street's new Crossrail ticket hall. There are 20 archaeological digs along the Crossrail route and they have to be completed as part of the planning regulations.
Why we need it
Designated historic sites, burial grounds, and archeological sites are windows into our past. As such, the Federal government passed the Historic Sites Act of 1935 to document and preserve sites of national significance. Many states enacted similar legislation. As a result, this information is incorporated into the siting process to avoid impacting these designated sites.
Where to find it
- In many instances, this data is not available for public download because of the sensitivity of the information. In general, the transmission line planner would make a request to a State Historical and Preservation Agency and/or the National Park Service for a listing of such sites in the proposed project area. In many states, this request requires that the user restrict access to the information.
Tell us about it!
Do you have a suggestion or two for additional data sources? Do you know of any international sources? Use the Discussion Forum to share your suggestions with the class!
Visual Resources (Local, state, and national parks, etc.)
Visual resources include such things as national parks, monuments and battlegrounds, Native American burial grounds, historical sites and buildings, cemeteries and even local neighborhoods, just to name a few.
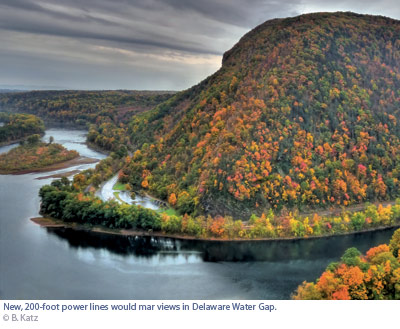
An example of the visual impacts on National Park lands from proposed transmission lines follows, and taken from National Parks Conservation Association [138]:
But views throughout much of the park unit could change substantially if a power company gets its way. Two energy companies—Public Service Electric & Gas (PSE&G) and PPL Electric Utilities—are proposing a serious upgrade to a smaller power line that predates the park, and winds its way through its southern half, crossing the river near the current visitor center. Eighty-foot towers that only occasionally rise above the canopy of maple, ash, and dogwood could soon be replaced by 200-foot towers that would dwarf them. A narrow right-of-way would expand to 300 feet to accommodate the two 500-kilovolt lines, which might require special lighting or bright orange balls for visibility. Asphalt roads would be constructed to provide constant access to what would become a main artery for coal- and nuclear power delivered to New York."
For obvious reasons, the power company’s preferred alternative is to simply traverse the corridor already established in the park—to cover the shortest distance between two points (see map), and to remove the need to purchase privately owned land or claim eminent domain."
Why we need it
The location of a transmission line can impair the line of sight to the visual resources mentioned, or in the instances of local neighborhoods can be a source of unsightly encroachment on neighborhood aesthetics. Transmission lines crossing over or near Federal lands requires a NEPA (National Environmental Policy Act) environmental impact analysis or assessment that includes a visual impact assessment on the Federal lands.
Where to find it
- See the GIS section of the National Park Service website [139].
Tell us about it!
Do you have a suggestion or two for additional data sources? Do you know of any international sources? Use the Discussion Forum to share your suggestions with the class!
Population and Residential Data (census data, etc.)

Figure 8.12: Protesters outside a Bonneville Power Administration office.
Credit: Zachary Kaufman [140]
Here we see protesters outside a Bonneville Power Administration office in Van Mall, Oregon. BPA proposed a new high-voltage transmission line between new substations in Clarke Rock and Troutdale, Oregon. Residents contend BPA should find less populated areas. Current demographic data is essential in minimizing the impact transmission lines have on neighborhoods, and, at times, the best data may still not be good enough.
Why we need it
Demographic data is essential for planning new transmission lines. It is used to make population projections to identify significant growth areas within a utility's service area. Planners then identify locations for the expansion of transmission lines and electric substations. In addition, both current and future projections of population density in a proposed transmission line project area provide the planner with another source of information on where to propose primary and alternate transmission line routes. In many instances, populated areas are the most significant challenge to siting a transmission line. Residents do not want unsightly overhead transmission lines running through or close to their neighborhoods for fear of property devaluation or concerns about the health implications of electromagnetic fields.
Where to find it
- The U.S. Census Bureau's data website [141] is a source for demographic data for the United States, as well as for individual states.
- In addition, individual county and city GIS websites provide access to land ownership and land parcels. The availability of this data for download varies from county/municipality to county/municipality.
Tell us about it!
Do you have a suggestion or two for additional data sources? Do you know of any international sources? Use the Discussion Forum to share your suggestions with the class!
Individual State, County, and Municipal GIS Data

The two links above take you to Pennsylvania [142]and North Carolina [143] GIS data portals. Once in a state GIS data portal, you have access to many types of GIS information, from simple vector data, such as roadways, to complex raster data in the form of detailed aerial photography. In addition to individual state GIS data portals, make sure you check other state and local sources such as the Department of Transportation, Department of Environmental Protection, and local government GIS data portals.
Why we need it
Sometimes local GIS information is not available from Federal GIS databases, so we need to look elsewhere to find data. Sources for this information can be found on most state, county, and municipal GIS websites. Depending on the level of government accessed, the type and amount of GIS information available will vary, with state GIS websites having the most available data and municipalities having the least, depending on size. Many times, local GIS data may be more up-to-date and more specific to the area you want to study. The combination of federal, state, county, and municipal GIS data sources gives the best opportunity to find the data you need for a specific project.
Where to find it
- The University of Arkansas [144], as an example, has compiled a clearinghouse for individual state GIS data. This clearinghouse provides access to individual state data that includes many of the topics we outlined above.
- Individual county and municipal GIS data can be accessed through county and local government GIS Internet sites. In addition to the types of information outlined previously, land parcel information and current aerial photography may be available for download from county and municipal geospatial web links. Some of these sites may ask you to register for downloading data. I have registered for many of these sites at no cost.
- Another example of a state geospatial data clearinghouse can be found at the University of Oregon. The UO Libraries [145] maintains a State-by-State listing of geospatial data resources.
- An example of county data can be found here for Union County, NC [146].
- Here is an example of available California County GIS data [147].
Tell us about it!
Do you have a suggestion or two for additional data sources? Use the Discussion Forum to share your suggestions with the class!
Lesson 8 Activity: Identifying and Locating State and Region Data
This activity will give you the skills to find Internet-based data and information, specifically data that can be downloaded and used for siting projects. The activity will focus on identifying and locating data for your state or region and compiling the data into a spreadsheet.
Note
For this assignment, you will need to record your work in the given Excel Spreadsheet. Your work must be submitted in Microsoft Excel (.xls or .xlsx) or PDF (.pdf) format so I can open it.
Directions
- Download the State and Regional Data spreadsheet [148]. You will see that there are columns provided for each of the following points of information: I have included example entries on the first tab as a guide of what your spreadsheet should include. EXAMPLE ENTRIES INCLUDE:
- Data Category (5 total: Environmental, Wildlife, Landuse/Landcover, Cultural, and Local GIS Sources)
- Data Sub-category
- Data Name
- Data Format (Vector, Raster, Imagery)
- Coordinate System
- Horizontal Datum
- Description of the data
- Data Source
- Data Location URL
- Metadata Source
- Based on what you have learned about data quality, assess the data quality of this data source?
- What criteria did you use to assess the quality of the data?
- Comments
- Find, at a minimum, one data source for each of the 5 categories listed in Item #1 above and enter the related information into the spreadsheet (use the "Student Work" tab of the previously downloaded document to show your work). Note that the data categories and data sub-categories are already provided on the spreadsheet. You need to add items 3 through 13 above. THESE ITEMS CORRESPOND TO THE COLUMN HEADINGS IN THE SPREADSHEET. (item #11—"Comments"—only needs to be provided when applicable).
- When completing your spreadsheet, include, at a minimum, the data sources we outlined previously in this lesson, and any others you have found. Add rows to the spreadsheet if necessary.
- When listing the website locations, be specific. For example, if you are located in Charlotte, North Carolina, list the URL that would take you to the data for Charlotte, not just North Carolina.
- In addition, try to find as much available local data as you can. Go to the website for your county or city and see what data is available through their GIS department and list these links in your spreadsheet. (FOR EXAMPLE: LAND USE DATA, ZONING DATA, LAND PARCEL DATA, TAX PARCEL DATA, WATER QUALITY DATA, ETC.)
- Save your copy of the spreadsheet in Microsoft Excel or PDF format, using the following naming convention:
Lesson8_Spreadsheet_AccessAccountID_LastName.xls (or .xlsx or .pdf)
Having Problems?
If you are having problems, post your questions to "General Questions and Comments: Lesson 8".
Submitting Your Work
Please submit your work to the Lesson 8 - GIS Data Sources drop box no later than Sunday at midnight of Lesson 8 (see our course calendar for specific due date).
Grading Criteria
This activity is graded out of 10 points
| CRITERIA | 5 | 4 | 3 | 2 | 1 | 0 |
|---|---|---|---|---|---|---|
| Sources | At least 1 source found for each of the 5 categories | At least 1 source found for 4 of the 5 categories | At least 1 source found for 3 of the 5 categories | At least 1 source found for 2 of the 5 categories | At least 1 source found for 1 of the 5 categories | No Internet sources listed |
| Required Elements | All 13 required elements provided | 10-12 of the required elements are provided | 6-9 of the required elements are provided | 2-5 of the required elements are provided | 1 of the required elements is provided | None of the required elements are provided |
Summary and Final Tasks
The siting of overhead electric transmission lines, underground pipeline, new power plants, and even new highways require many types of information for the analysis in selecting a final corridor or site. Historically, this data had to be gathered manually if it was available. With the advent of computers, GIS software, and the Internet, this data is abundant and readily available. This lesson identified data needs, why it is needed, and where to find it. The exercise of finding data for your particular needs laid the foundation for how to acquire data and catalog those data sources for your future reference and use.
Reminder - Complete all of the lesson tasks!
You have finished Lesson 8. Double-check the list of requirements on the first page of this lesson to make sure you have completed all of the activities listed there before beginning the next lesson.
Tell us about it!
If you have anything you'd like to comment on, or add to, the lesson materials, feel free to post your thoughts in the Questions? Discussion Forum.
Lesson 9 - Beginning the Term Project
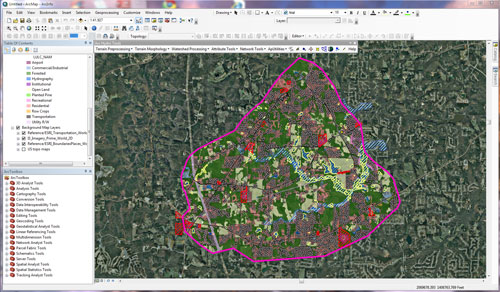
Figure 9.1: Project Study Area
Credit: Screen capture of Photo Science data
An Overview of Lesson 9
This lesson will introduce you to the term project and the siting criteria we will use for the project. The project will use what you have learned in the two Esri courses and apply that knowledge to siting a transmission line, using GIS.
Utilities have historically sited transmission lines through a process of selecting transmission line corridors, narrowing the corridors to an optimum corridor, and then selecting the most appropriate route through the corridor for the new transmission line. This process has evolved from a subjective, table-top exercise in the early days of siting, to a more transparent, objective analysis using GIS. The utility industry recognized the need to make the process more efficient and objective because of growing siting difficulties created by increased costs to site and build transmissions lines, increased regulatory oversight, and mounting opposition from the people and communities these new lines would pass by or through.
What will we learn in Lesson 9?
In this lesson, you will utilize the knowledge you have gained so far to begin a final project. The end result of the project will be a presentation explaining your best-selected route for a proposed transmission line.
By the end of this lesson, and using Sample GIS data, students will be able to do the following:
- apply EPRI-GTC Overhead Electric Transmission Line Siting Methodology to a real-life scenario;
- describe how the EPRI-GTC process categorizes evaluation criteria into three general categories: Natural, Built, and Engineering Environments;
- generate a base map from ArcGIS Pro;
- conduct a siting analysis, using ArcGIS Pro, to determine the most appropriate location for a transmission line;
- evaluate route statistics and determine the siting route;
- explain the complexity of selecting the most appropriate siting route.
What is due for Lesson 9?
This lesson will take us one week to complete. Please refer to the Calendar for specific time frames and due dates. Specific directions for the assignment below can be found in this lesson.
- Lesson 9 Quiz
- Term Project Background Document
- Run a model using sample GIS data (this should take you between 3 and 4 hours to complete and should be done in one sitting). Please plan your time accordingly.
- Create a background document to be included in the final project. (this will require 1-3 hours of writing).
Questions?
If you have any questions, please post them to our Questions? discussion forum. I will check that discussion forum daily to respond. While you are there, feel free to post your own responses if you, too, are able to help out a classmate.
Introduction
The final term project will involve using GIS to select the most appropriate transmission line corridor given three competing corridors (Lesson 9). Public opposition to the siting of transmission lines is a critical factor that must be addressed. In Lesson 10, you will have the opportunity to develop plans to address this opposition. The final aspect of siting a new transmission line is how the utility presents the final route selection to the public. Normally, this is conducted through a series of public meetings held in the area where the proposed transmission line will be constructed. In Lesson 11, you will have the opportunity to develop a presentation that will be used for these public meetings. Lesson 12 will have you acting as a "Corporate Transmission Line Siting Committee Executive" reviewing and commenting on the public presentation of one of your classmates. Finally, during Lesson 13, you will incorporate any suggestions from Lesson 12 and submit your final project for grading.
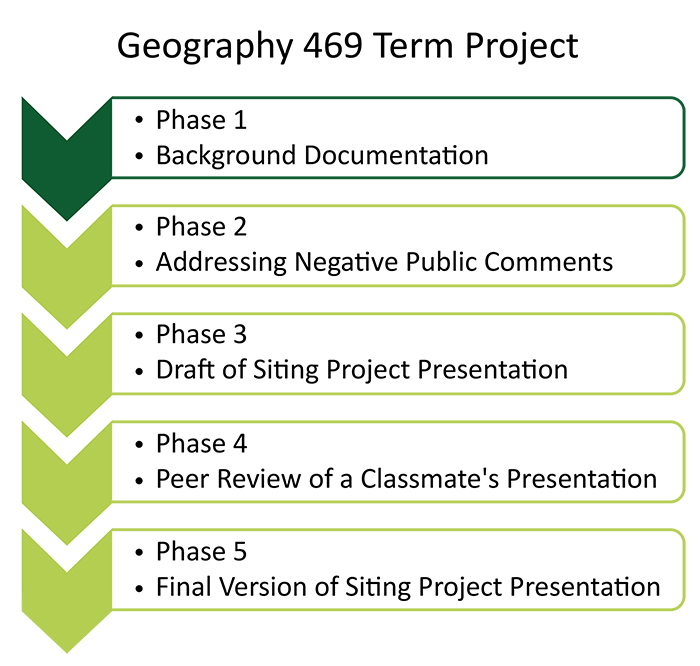
Figure 9.2: Project Phases
Click link to expand for a text description of Figure 9.2
Lesson 9
Phase 1
Background Documentation
Lesson 10
Phase 2
Addressing Negative Public Comments
Lesson 11
Phase 3
Draft of Siting Project Presentation
Lesson 12
Phase 4
Peer Review of a Classmate's Presentation
Lesson 13
Phase 5
Final version of Siting Project Presentation
Term Project Expectations
The term project will encompass Lessons 9-13. Each lesson will address a specific aspect of the siting process and will use the information you learned through the first 8 lessons of the course.
I will be treating this project as close to a real-world scenario as possible, with all the pitfalls, decisions and outcomes that are typically encountered in these types of projects. Because of this, I expect you to meet all deadlines, no exceptions…..as many of you know, that is the way it works in the real world with projects of this magnitude…..tight timelines, heavy workloads, etc.…..time is money and any internal or external delay escalates the final cost and prolongs implementation of the project.
You will be the project manager for this project and you will be reporting to me. I expect you to complete each segment of the project on time and in a professional manner. All materials created should be created by you and presented in a form that shows your understanding of the issues and reflects your professionalism. Presentations should be prepared and delivered with the intent that you are selling your final routing decision before the Champlain Power Transmission and Distribution Siting Committee. Your final presentation will help determine the amount of money Champlain Power will allocate to this multi-million dollar project, so your presentation skills will be on display. In Lesson 12, you will reverse roles and be a member of the T&D Siting Committee, where you will select a presentation of a fellow student and provide constructive, positive feedback on his or her presentation highlighting the positive aspects of the presentation and recommending improvements where help may be needed. Lesson 13 will have you refine and resubmit your final presentation, based on the feedback you receive from Lesson 12.
The term project will consist of the following parts:
- Siting scenario and background information document: Lesson 9
- Addressing negative public comments: Lesson 10
- Creating a final presentation and submitting it for peer review: Lesson 11
- Reviewing a peers presentation: Lesson 12
- Refining and submitting your final presentation: Lesson 13
Term Project Siting Scenario
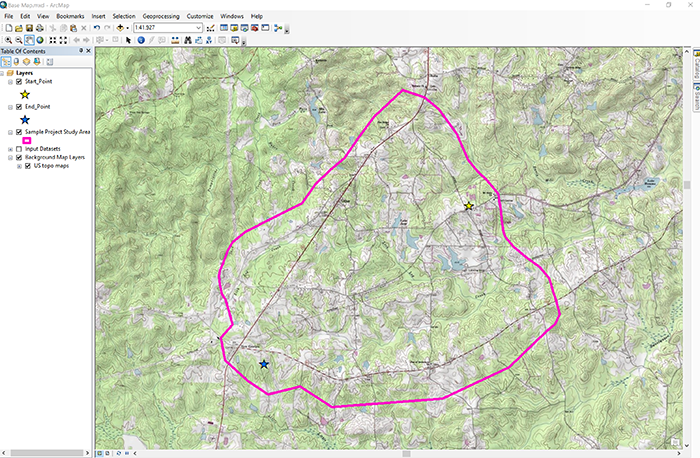
Figure 9.2: Project Study Area
Ron Santini
Champlain Power, Inc. has submitted a request to the Georgia State Public Service Commission (GSPSC) to construct, operate, and maintain an overhead 345 kV High Voltage Direct Current transmission line named the "Nebo-Baskins Road Interconnect."The line would begin near Nebo just northeast of Dallas Nebo Road (Start Point) and run southwest to an existing substation southwest of Baskin Road (End Point) (Figure 9.2). The proposed transmission line will be approximately 3.5 miles in length, depending on the final siting decision for the line route. The public outreach and GSPSC reviews should be finalized by April 1, 2019. Construct on the new transmission line is expected to start in January, 2020.
This interconnect is needed to meet the projected demand for new residential, commercial, and light industrial service in the area. The United States Census, the Georgia Economic Development Agency, and local government data all point to increasing current and future needs for infrastructure additions to meet this growing demand. Internal projections made by Champlain Power also suggest the need to increase electric capacity to the area to meet future projected needs. Currently, the area serviced by Champlain Power serves approximately 150,000 residential customers; 7,500 commercial customers; and 1,200 light-industrial customers. Future demand projections (2020-2050) suggest the electric services will increase to 300,000 residential; 18,000 commercial; and 1,500 light-industrial customers. This demand cannot be met by the existing electric service, and a major expansion is required to meet this anticipated increase.
Champlain Power has selected three potential corridors for the planned overhead line interconnect. From these three corridors, a preferred corridor will be selected. Additional siting analysis will then be conducted to select the most appropriate route based on optimum natural environment, built environment and engineering environment criteria. This final route will be submitted to the GSPSC for review and approval. Initial construction will commence within 60 days of final GSPSC approval.
For the term project, you have been assigned as the project manager for siting the Nebo-Baskins Road Interconnect Transmission Line.You will be responsible for leading a team that will have full responsibility for selecting a preferred corridor, conducting the additional siting analysis, and selecting the most appropriate route for review and approval by the GSPSC. In addition, you will responsible for managing all community information outreach programs to keep the general public informed of the siting process and progress. The following two videos will give you a brief introduction to the project:
Click for a transcript of "Introduction" video.
PRESENTER: This is a Google Earth view of the term project study area. The study area is inside the pink boundary. Now, one of your tasks for the term project is to locate three alternate routes through study area between the start point and the end point. But to complicate the route selection, you will need to consider the impacts on the built and natural environment.
These impacts include buildings, which I'll turn those on for you. You can see the buildings and their building footprints. Avoidances, let me click on that for you. You have the avoidances and avoidances include such things as schools, daycare centers, churches, cemeteries, and things of that nature.
Now, the next thing that you have to take a look at will be large building footprints. Obviously, we don't want a transmission line going over a large building. Then, we'll take a look at the conservation areas, and the conservation areas include a number of things. They include lakes, wetlands, and in this instance, they also include some floodplain areas. So then, your mission is to locate three alternate routes and then select the best route that minimizes impacts to the natural and built environment.
Good luck. The second video will give you a unique look at a fly-through of an example alternative route to give you a feel for the obstacles and questions you could encounter with your route selection.
Click for a transcript of "Timeline" video.
PRESENTER: What I want to do is show you the lay of the land using a flythrough created in Google Earth. I have defined a typical alternate transmission line route through the study area, similar to the alternate routes you will create in your term project. Along the way, we will stop at numerous locations to view the surrounding areas and ask some questions.
As we start the flythrough, what you see is a thin white line and two red lines. The white line is the alternate route, and the red lines are the boundaries, or the right of way for the route. OK, so let's start to tour.
This tour starts at the end of the alternate route and works back to the start point. As we start our flythrough, we fly over alternate forest and agriculture land uses.
Stop 1. Our first stop is near a single-family residence on the right. What potential impacts, if any, to the resident can be associated with the location of the route?
As we proceed, we again encounter alternate forest and agricultural land uses. What would be some of the impacts associated with these types of land uses?
Stop 2. Our second stop shows a route passing over a small farm pond. When locating alternate routes, you want to minimize impacts to the natural environment as much as possible.
Sometimes, that may not be possible. But in this instance, the route could be moved to eliminate this impact. Continuing on our tour, we again pass long stretches of forest and agriculture land use. In addition, we encounter changes in topography. How do you think these topographical changes could impact the location of the proposed route?
Stop 3. It appears the alternate route goes directly through a planned subdivision. In this instance, the route would need adjustments to miss the subdivision. A more appropriate location may be to the right of the planned subdivision. Continuing, we again pass over long stretches of forest and agriculture land, minimizing our impacts to the built environment.
Stop 4. We encounter our first major hurdle, a conservation area including a large lake. In this instance, we may have no viable alternative, and this is our best location. What impacts do you recognize here? As we continue our flythrough, we again encounter a large area of forest land and agriculture land use before we arrive at our starting point.
Stop 5. The question is, can we define a better route? As we come to the end of the flythrough, you have seen some of the obstacles needing resolution, and typical questions that require answers before you can select a final route.
Background Document Instructions: Term Project
Most utility companies now use GIS to site new transmission lines, either using in-house developed siting methodology or relying on outside consultants to develop the GIS siting framework. The Electric Power Research Institute (EPRI), a private R&D company closely tied to the utility industry, recognized the need to standardize the process of siting to bring even more objectivity, transparency, and creditability to the siting process. In 2002, EPRI joined forces with the Georgia Transmission Corporation (GTC) to study transmission line siting and develop a process to make siting decisions more quantifiable, consistent, and defensible.
We will use an abbreviated EPRI-GTC Overhead Electric Transmission Line Siting Methodology for the term project. The graphic below shows a generalized flow line of how this methodology works. Click on the graphic below for a brief explanation.
Figure 9.3: Corridor Analysis Funnel
Click for the transcript.
The corridor analysis funnel is a high-level depiction of the siting process. The inputs to the funnel include community considerations, natural environment considerations, and engineering considerations.
Now the community considerations include things like human cultural resources, the natural environment includes things like plants, animals and water resources and the engineering considerations include physical constraints on the systems and features that would maximize location and minimize cost and schedule delays.
The information derived from each of these considerations is put into a geographic information system to determine values and weight for each of the considerations. Now as we move down through the funnel, the area of interest becomes more focused and defined and the data become more detailed and accurate.
Exiting the funnel is a culmination of the siting methodology where a preferred route or center line is proposed for the transmission line.
Now, as you go through the GIS analysis part of the project, you will analyze these considerations simultaneously to objectively determine the most suitable line location. To do this manually would require many man-hours of work, would be less accurate in the final outcome, and could lead to increased litigation, project delays and cost escalation because of a lack of objectivity and transparency.
Credit: PhotoScience
As the project manager, your first task will be to develop a background document outlining your understanding of the siting process and the assigned task. Specifically, you will need to answer the questions below from the Siting Transmission Lines Using the EPRI-GTC Siting Methodology document found in the Term Project Materials module. You will also conduct the siting analysis to determine the most appropriate location for the transmission line. Before the selected route can be made public, the actual location must be approved by our Transmission Line Siting Oversight Committee. In preparation for your meeting with the Committee, you will need to develop a background document including the items identified under ACTIVITIES>2. Activity>Part 2 below. REMEMBER: YOU ARE THE PROJECT MANAGER... TREAT THIS LIKE A REAL WORLD PROJECT... MEET DEADLINES, DELIVER A QUALITY PRODUCT, ETC... YOU WILL BE GRADED ACCORDINGLY.
Activity #1: Quiz
- Before taking the quiz, read the white paper titled "Siting Transmission Lines Using the EPRI-GTC Siting Methodology" located in the "Term Project Materials" module.
- Take the Lesson 9 Quiz.
Activity #2
Note: This assignment has two parts.
Activity #2, Part 1
Caution! This exercise requires you to pay close attention to detail and follow the instructions completely. Failure to do so can result in completion delays, model run failures, and an unresponsive ArcMap.
PLEASE READ THE INSTRUCTIONS VERY CAREFULLY FROM START TO FINISH BEFORE STARTING THE LESSON 9 ArcGIS PROJECT.
I want you to be successful and have fun with the project…not become frustrated! So, I cannot emphasize enough the importance of following the instructions in Lesson 9 step-by-step! Failure to do so has resulted in students having problems. I would suggest you go so far as printing them off and checking off each step as they are completed. I would also highly suggest you run it from start to finish in one sitting.
I would suggest you run the model on your local computer. Please refer to the Frequently Asked Questions [104] for Lesson 9. If you do not find answers there, please do not hesitate to reach out to me.
NOTE: The following steps require you to have a C:\temp folder and to unzip files. If you are unsure how to do either of those, watch the Downloading the Term Project Files video in the Term Project Module before getting started.
- Download the PDF file titled "Transmission Line Siting Exercise Instructions ArcGIS Pro" document located in the "Term Project Materials" module to your C:\temp folder.
- Verify that you successfully unzipped the "SAMPLE_ROUTING_PROJECT.zip" in Lesson 7.
- Verify that the "SAMPLE_ROUTING_PROJECT" folder created in your C:\temp folder (C:\temp\SAMPLE_ROUTING_PROJECT\) contains the following folders/files:
- Analysis folder
- Data folder
- Base_Map.mxd(Esri Map Document)
- SampleProject_Toolbox.tbx
- Simplified_Epri_model.xls
- Simplified_Route_Evaluation_spreadsheet.xls
- Follow the instructions in the "Transmission Line Siting Exercise Instructions ArcGIS Pro" document that you downloaded (step 1) to complete the exercise and find the optimal route. The instructions are very detailed, and a missed step can result in the siting model not executing. PAY ATTENTION TO DETAILS!
Activity 2, Part 2
Using a Word document or Google Docs, create a background document that includes the following elements:
- a title page including project title, your name, course number, and date
- a brief description of the project
- the base map showing the study area in question
- a map showing your selected route
- the Data Normalized Table from the Excel spreadsheet
- the Combined Rank Chart from the Excel Spreadsheet
- your analysis/comments on why you chose your selected route including
- an explanation of a normalized data table
- an explanation of a combined rank chart
- your conclusions/opinions about the best route identified in the Combined Rank Chart
Having Problems?
If you are having problems, please consult the FAQ [104]for answers to some of the most frequently asked questions. If you don't see the answers you need there, post your questions to the Lesson 9 General Questions and Comments Discussion Forum.
Submitting Your Work
Upload your paper to the "Lesson 9 Term Project: Project Background" drop box by the due date indicated on our course calendar.
Grading Criteria
I will grade your work using the Term Project Background Document Rubric [149]
Background Document Rubric
| Category | Weight | 40 - 31 points | 30 - 21 Points | 20 - 11 Points | 10 - 1 Points | 0 Points |
|---|---|---|---|---|---|---|
| Title Page | 3% | Included project title, student’s name, course number and date |
Included only 3 of the 4 required elements | Included only 2 of the 4 required elements | Included only 1 of the 4 required elements | No title page or none of the required elements were included |
| Brief description of the project | 10% | Brief, two-page, objective, technically written; description of the project; including the following topics: 1. Background Information 2. Location of project 3. Need for project 4. Projected outcome |
Brief two-page, objective, technically written description including topics 1-4 | Brief one-page, objective, technically written description but not including background and needs discussion. | A non-objective, nontechnical one-page description incorporating topics 1-4. | No project description presented |
| Base map showing the study area in question | 37% | Complete base map showing the following elements: 1. Starting and ending points 2. North Arrow 3. Scale Bar 4. Legend 5. Buildings 6. Floodplains 7. Wetlands 8. Landuse 9. Project Boundary 10. Completed route map showing the selected route and the two alternative routes. |
1. Elements 1-4 plus 4 of the remaining elements. 2. Completed route map showing the selected route and one alternative route. |
1. Elements 1-4 plus 3 of the remaining elements. 2. Completed route map showing the selected route and no alternative routes. |
1. Elements 1-4 not displayed, but 2 of the remaining elements displayed. 2. Completed map showing all three routes, but no selected route. |
1. No base map presented, or no elements displayed on the base map. 2. Map showing no selected route or alternative routes. |
| Route Evaluation Spreadsheet | 10% | Route statistics have been entered into each route category (9 numeric values total). | Route statistics have been entered for 2 of 3 route categories. | Route statistics have been entered for 1 of 3 route categories. | - | No route statistics have been entered into the spreadsheet. |
| Conclusions and opinions about the best route identified in the Combined Rank Chart | 40% | Conclusion & opinions based on information gathered from 1) Background data, 2) Base map, 3) Selected route map and 4) Combined Rank Chart. | Conclusions & opinions based on information gathered from 3 of 4 criteria listed in 4 Point Column. | Conclusions & opinions based on information gathered from 2 of 4 criteria listed in 4 Point Column. | Conclusions & opinions based on information gathered from 1 of 4 criteria listed in 4 Point Column. | No conclusions or opinion presented. |
The grade for each category is calculated by multiplying the weight for the category times the number of points awarded for that category to arrive at the weighted score for each category. The final grade is the sum of all category-weighted scores. See the following example.
| Category | Weight | Points Earned | Weighted Score |
|---|---|---|---|
| Title Page | 3% | 40 | 1.2 |
| Project Description | 10% | 20 | 2.0 |
| Base Map | 37% | 30 | 11.1 |
| Route Evaluation Spreadsheet |
10% | 30 | 3.0 |
| Conclusions | 40% | 30 | 12.0 |
| Total Score | - | - | 27.3 out of 40 = 68% |
Summary and Final Tasks
In this lesson, you learned how to use the EPRI-GTC siting document and answered the critical questions for understanding how the siting process works. You also completed the siting of the a new transmission line using GIS and presented the information in the form of a background paper for management review and approval prior to the public meetings.
Reminder - Complete all of the lesson tasks!
You have finished Lesson 9. Double-check the list of requirements on the first page of this lesson to make sure you have completed all of the activities listed there before beginning the next lesson.
Tell us about it!
If you have anything you'd like to comment on, or add to, the lesson materials, feel free to post your thoughts in the Questions? Discussion Forum.
Lesson 10 - Addressing Negative Public Comments
An Overview of Lesson 10

Public participation in siting of new transmission lines has a long and storied history. In the early days of siting, public participation was neglected, or had little input from the public (regardless of the opposition) because adding new electric capacity was seen as acting for society's greater good. Many properties were taken by eminent domain, or by deals with property owners that benefited the utility.
As time went on and the public became aware of the negative consequences of locating landfills near populated areas, the phenomena of "Not in My Back Yard" (NIMBY) became very popular and changed the way siting of public facilities was conducted. NIMBY ushered in the era of public participation where the public was given a place at the table from the initial stages of siting through final approval. Today, public participation plays a significant role in the planning of new public facilities, and in particular, the siting of new overhead electric transmission lines.
This lesson will introduce you to the negative side of the siting process and how the public, using the Internet, protest letters, and even social media, can impact how utilities must address this opposition.
What will we learn in Lesson 10?
Your goal in this lesson is to understand what can cause negative public perceptions when there is a proposal to construct a new electric transmission line through a populated area. You will learn how to address this negative opposition by drafting a plan to deal with it early in the planning process.
By the end of this lesson, you should be able to:
- identify negative opposition to a project;
- develop a plan to engage the public early on in the siting process;
- develop responses to opposition letters; and
- incorporate public participation changes into the final siting plan.
What is due for Lesson 10?
This lesson will take us one week to complete. Please refer to the Calendar for specific time frames and due dates. Specific directions for the assignments below can be found within this lesson.
- Review the three opposition letters sent and prepare responses to them.
- Prepare an internal Public Participation Document that will be used to address opposition and mitigate the potential for new opposition, as well as how the public will be engaged in the siting review process.
Questions?
If you have any questions, please post them to our Questions? discussion forum. I will check that discussion forum daily to respond. While you are there, feel free to post your own responses if you, too, are able to help out a classmate.
The Memo: Term Project
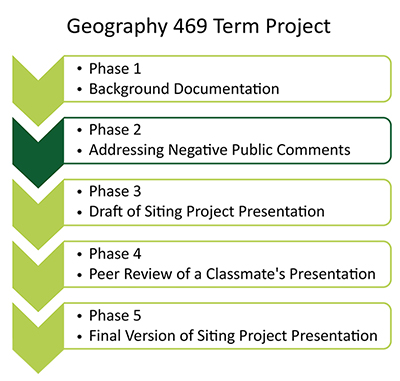
Project Phases
Activity
Directions
For this activity, you will return to your role as the project manager for siting the Nebo-Baskins Road Interconnect transmission line and complete Phase 2 of your term project, "Addressing Negative Public Comments". You have just received a memo from the Vice President of Transmission and Distribution (T&D) for your company that describes some negative public comments he has received. He wants your help in addressing these. As you complete this activity, be sure to consider the principles of public participation that you learned in Lesson 4.
Transource Energy takes 24 Franklin County property owners to court
As you prepare the public participation plan for your term project, take a look at this 3:13-minute video of how a utility provider addressed the public participation aspect of the siting project. You can read more about it on USA Today's Public Opinion Website [153].
Click here for a transcript
Coming Soon
Note
For this assignment, you will need to record your work in a Word document using Microsoft Word or Google Docs [154]. Your work must be submitted in Word (.doc) format so I can open it.
MEMO TO: Project Manager
FROM: R. Santini, VP T&D
SUBJECT: Public Participation Concerns
This week, I have received three protest letters (see attached) condemning the siting and proposed construction of the transmission line through the Nebo Valley. These three letters address aesthetics, public health concerns, the taking of private lands, destruction of environmental resources, etc. I anticipated some opposition to the line, and after reviewing company policy on public participation, I realized our plan for engaging the public is inadequate. As the project manager, I am asking that you address not only the letters, but also devise a plan to engage the public in the siting process.
By the end of this week, I need you to:
- PROTEST LETTERS: As the project manager, develop a written response to each of the protest letters. Each response should be a professionally written response....what a company would send in response to these protest letters. Be as creative as possible. The three letters should be prepared in draft form so I can review and comment on them. Links to the three letters are below.
- Friends of Nebo Valley [155]
- Nebo Homeowners Association [156]
- Nebo Protest [157]
- INTERNAL PUBLIC ENGAGEMENT DOCUMENT: Develop an internal document, as part of the overall siting document, on how to engage the public in the siting process. This document should be prepared for review by the oversight committee. Use the information you acquired from Lesson 4, and the three documents referenced below to develop your plan to be presented to the oversight committee. You need to include, at a minimum, how the public will be contacted, how they will be involved, how the public participation activities will be advertised, how public feedback will be processed, where and how the public can review and provide additional comments, and review Frequently Asked Questions. You are the project manager and your professional reputation is on the line here, so put forth your best effort!
- PUBLIC PARTICIPATION PLAN: Develop a plan and a professional-looking brochure to be shared with the public. It should include information about how the public can participate in local meetings about the plan. Include Internet research in your plan to determine how other utilities address this issue. You are looking for anything from using one- or two-page flyers, to complete public participation plans. Here are some references to get you started:
- SRP Public Involvement [158]
- Kentucky Guide to Public Participation [159]
- Western Area Power Administration (WAPA) Public Involvement Overview (PDF) [160]
This plan should be a final information plan for internal review and a professional-looking brochure available for the public. It should contain, at a minimum, where the project is proposed, why it is needed, a map showing the proposed routes, places, dates and times for public meetings, and where the public can find updated information, such as company websites, etc.
Remember….First impressions will weigh heavily on public opinion. If you put little thought and effort into your plan, don’t expect it to be received well by the committee or the public and don’t expect it to be successful…….project delays can result in millions of additional dollars being allocated to addressing questions and concerns due to poorly developed plans.
If you have any questions, please contact me immediately.
Submitting Your Work
Please submit your work to the Lesson 10 - Addressing Negative Public Comments drop box no later than Sunday at midnight of Lesson 10 (see our course calendar for specific due date). Use the following naming conventions:
Lesson10_ProtestLetters_AccessAccountID_LastName.doc (or .pdf)
Lesson10_PublicEngagement_AccessAccountID_LastName.doc (or .pdf)
Lesson10_ParticipationPlan_AccessAccountID_LastName.doc (or .pdf)
Grading Criteria
I will grade your work using the Public Participation Plan Rubric [161].
Lesson 10 Rubric
Part A: Data Analysis and Presentation
| Category | Weight | 31 – 40 Points | 21 – 30 Points | 11 – 20 Points | 1 – 10 Points | 0 Points |
|---|---|---|---|---|---|---|
| Written Response to Protest Letters | 30% | Provide a clear, objective, positive and professional response to each concern posed in each of the three protest letters. You will prepare three separate letters. | Provide a clear, objective, positive response to each concern posed in two of three letters. | Provide a clear, objective, positive response to each concern posed in one of three letters. | -- | Did not respond to any of the letters, or responded in a negative manner to any of the three protest letters. |
| Develop an internal public engagement document, as part of the siting document | 30% | At a minimum, the document includes the following elements: 1) the project scope and description, 2) siting process explanation, 3) timeline for the proposed siting process, 4) maps showing alternative route locations and proposed selected route, 5) segment of the public to be notified, 6) the number and frequency of public meetings, 7) how the public can provide input to the siting plan, 8) typical questions to be addressed at the public meetings, 9) meeting dates & locations posted on company websites, social media websites, newspapers, TV and radio and mailed to affected parties. This document is for internal use by the executive oversight committee. | 8 of the 9 elements identified in the internal document, including the project description, siting process, alternative and proposed route location maps. | 7 of the 9 elements identified in the internal document, including the project description, siting process, alternative and proposed route location maps. | 6 of the 9 elements identified in the internal document, including the project description, siting process, alternative and proposed route location maps. | Less than 6 of the 9 elements presented. |
| Public Participation Plan | 40% | A professional looking, detailed brochure, including meeting dates & venue, meeting agenda, speakers, workshops, interactive websites for comment submittals, including Facebook and other social media outlets, company point of contact for public inquiry and comment. This document is to be distributed to the target audience in both electronic and paper form. | Meeting dates, venue, speakers and workshops detailed. Company siting project website and point of contact established. | Meeting dates, venue, speakers and workshops detailed. Company siting project website established. | Meeting dates, venue, speakers and workshops detailed. | No brochure plan prepared. |
The grade for each category is calculated by multiplying the weight for the category times the number of points awarded for the category to arrive at the weighted score for the category. The final grade is the sum of all category-weighted scores.
| Category | Weight | Points Earned | Weighted Score |
|---|---|---|---|
| Written Response to Protest Letters | 30% | 40 | 12.0 |
| Develop Internal Document | 30% | 30 | 9.0 |
| Public Participation Plan | 40% | 20 | 8.0 |
| Total Score | 100% | 29 out of 40 = 72.5% |
Summary and Final Tasks
In this lesson, you learned how to identify public opposition issues and how to respond to individual and group concerns. You developed a plan to be included in the siting process, that engages the public early on. You also developed a plan for how to engage the public at local meetings. To reach these goals, you researched the Internet for public participation plans and viewed links and documents presented in this lesson. The final outcome is a skill set that you can incorporate into your broader set of siting skills.
In Lesson 11, we will continue working on the case study by developing a slide presentation you can present to your peers, to your management, or to the public.
Reminder - Complete all of the lesson tasks!
You have finished Lesson 10. Double-check the list of requirements on the first page of this lesson to make sure you have completed all of the activities listed there before beginning the next lesson.
Tell us about it!
If you have anything you'd like to comment on, or add to, the lesson materials, feel free to post your thoughts in the Discussion Forum. For example, what did you have the most trouble within this lesson?
Lesson 11 - Presenting Your Siting Project
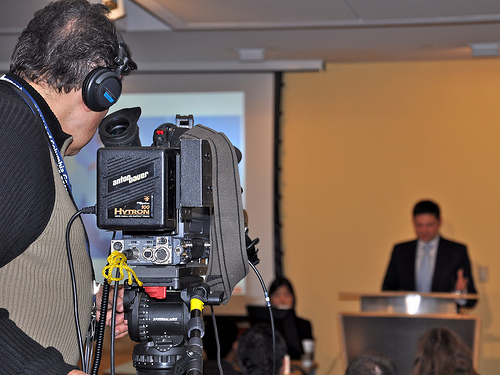
An Overview of Lesson 11
Many times during your working career, you will be asked to make presentations before your peers, to the management, and to the public. The ability to communicate effectively, both verbally and visually, is something sought after by industry today. Those employees who can present information in a clear, concise, and professional manner generally succeed in the business world. This lesson will give you the opportunity to develop these skills by creating a presentation of your siting process and your public participation plan from lessons 9 and 10.
What will we learn in Lesson 11?
Your goal in this lesson is to take what you have developed in Lessons 9 and 10 and put that information into a presentation package that is suitable for presentation to management and to the public.
By the end of this lesson, you should be able to:
-
create a presentation that incorporates your transmission site plan, public participation plan, final route selection and an explanation of why you chose your particular route.
What is due for Lesson 11?
This lesson will take us one week to complete. Please refer to the Calendar for specific time frames and due dates. Specific directions for the assignment below can be found in this lesson.
- Prepare a brief (10-12 minutes), narrated PowerPoint presentation that explains your site selection process and your public participation plan.
Questions?
If you have any questions, please post them to our Questions? discussion forum. I will check that discussion forum daily to respond. While you are there, feel free to post your own responses if you, too, are able to help out a classmate.
Presentation Basics
Some of you are familiar with creating PowerPoint presentations, while for others this may be your first time. All of us, including myself, can benefit from learning what makes a good presentation.
During the course of your professional careers, many of you will be asked to make presentations to work groups, committees, executives, and even the public. How you convey your message, in both spoken words and visual displays, will impact how your audience perceives you as a confident, knowledgeable, polished professional. These characteristics are on display each time you make a presentation. It is your own personal marketing tool, so it is in your best interest to make each and every presentation as professional as possible.
Before you begin, let’s have a little fun with PowerPoint by watching the YouTube video presented by comedian Don McMillan, called "Life After Death by PowerPoint":
Click for a transcript of "Don McMillan" video.
DON MCMILLAN: There are some things I hate about PowerPoint, and I figure it's kind of my duty to point them out. So, here we go. Here's common PowerPoint mistakes. Number one, people tend to put every word they are going to say on their PowerPoint slides.
[LAUGHTER AND CHEERING]
Although this eliminates the need to memorize your talk, ultimately this makes your slides crowded, wordy, and boring. You will lose your audience's attention before you even reach the bottom of your-- uh-- first slide.
[LAUGHTER]
Please don't do that anymore, please. Number two, most common. Many people do not run spel cheek--
[LAUGHTER]
Big mistak!!! Nothing makes you lok stupder then speling erors.
[LAUGHTER]
If it's got a red line under it, recheck the spelling. And then finally, I hate this—avoid excessive bullet-pointing, only bullet key points. Too many bullet points, and your key messages will not stand out. In fact, the term bullet point comes from people firing guns at annoying presenters.
[LAUGHTER AND CHEERING]
Hence, the bullet point. Bad color schemes, not good.
[LAUGHTER]
Clashing background and font colors can lead to distraction, confusion, headache, nausea, vomiting, and loss of bladder control.
[LAUGHTER]
I can't stay on that one too long.
[LAUGHTER]
Here's something I've noticed. The higher number of PowerPoint slides you have in your talk, the less useful your talk actually is. Unfortunately, my presentation is right there.
[LAUGHTER]
I've also noticed this--people love to pack data into their presentation. They just shove more and more data, thinking it's better, but it's not. The more data you have, the harder it is to read your slide, and the effectiveness plummets. Now, you can improve the effectiveness by adding some shading and some 3D effects, and--
[LAUGHTER]
--then some second order and third order effects. And then, I know, let's add some labels. That will help a lot.
[LAUGHTER]
And that's pretty much every marketing slide I've ever seen, right there.
[LAUGHTER AND CHEERING]
Yeah. Then something like VP of Marketing standing there and going, it's real clear in Q4. What the hell are you talking about?
[LAUGHTER]
Now, I'm into animation. People become animators in PowerPoint. You can have things flying all over the place, and that can be good. If you're a visual learner, that will improve the effectiveness of your performance. But if you're easily distracted, more animations and people have no idea what you're talking about. There just-- wow, that is cool, wow. And there's regions here, by the way.
There's the simple, but effective, region. There's the active, but confusing, the effective, but boring, the active, but ineffective, the dull, but static region, the busy, but useless, the ADD only region, the useful, but amusing, and the stupid, but confusing, the dull triangle, the hyper triangle, the sleepy square, the dizzying pentagon, and everything else I just call pointless motion.
[LAUGHTER]
That slide right there took me an hour and a half to make, right there.
[LAUGHTER]
PowerPoint can just suck the life out of you.
It's amazing.
[LAUGHTER]
I've also come up with this. It's a kind of a little science I've invented called font analysis. Basically, the font you choose says something about who you are as a person. There's a huge list of fonts, and you choose one. And that says something about you, so, be careful the font you choose.
For example, if you choose Courier New, which happens to be my favorite, you're probably organized and structured. If you choose Matisse, it means you're artistic. And if you choose Times New Roman, it means you're lazy, apathetic, and unimaginative, and you always use the default.
[LAUGHTER AND CHEERING]
Reading Assignment
Log into Lyndia.com [165] and take the "Improve Your Presentation Skills: Creating and Giving Business Presentations [166]" course. It is one and a half hours long. Feel free to look at some of the other Lyndia.com courses while you're there.
Read one or more of the articles listed below.
Anderson, Chris. 2013. “How to give a killer presentation.” [167] Harvard Business Review. Accessed November 21, 2016
(Links to an external site.) [168]Microsoft. 2016. “Tips for Creating and Delivering an Effective Presentation [169].” Accessed November 21, 2016
(Links to an external site.) [170]Tobak, Steve. 2009. “How to Give a Great PowerPoint Presentation. [171]” CBS Money Watch. Accessed November 21, 2016
Creating Your Presentation
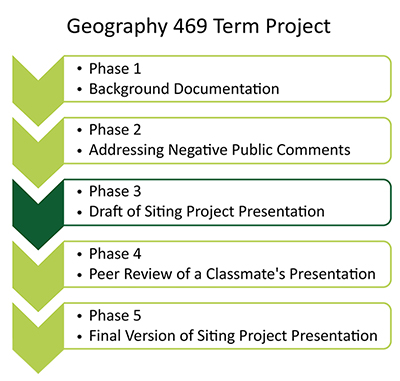
Project Phases
Activity
Prior to the public meeting roll out of your selected route for the proposed transmission line, the site selection committee would like you to make a brief (10-12 minutes) presentation to them.
Note
For this assignment, you must first create a slide presentation. You are welcome to use whichever software you are most comfortable with, such as PowerPoint, Google Docs [172] (the "Presentation" component), Prezi, or Keynote. You will then use Kaltura [173], a Penn State video conferencing platform, to record your presentation.
Directions
- Create your presentation. Your presentation should include a separate slide for each of the following components:
- A brief project description
- A base map showing the study area to include:
- Aerial Imagery
- Start and End Points
- Avoidance, Conservation, and Floodplain Information
- Building Centroids
- Land Use & Land Cover
- A map showing your alternate route selections
- Include the Built, Natural, and Simple Average Corridors
- Alternate routes you selected through each of these corridors
- The Simplified Route Evaluation Spreadsheet including:
- Route Data
- Data Normalized
- Built Emphasis
- Natural Environment Emphasis
- Simple Average Emphasis
- Combined Rank Chart
- Graphs
- A map showing your final route selection
- An explanation of why this route was selected, based on your analysis
- An explanation of your approach to addressing public participation
- A summary of your presentation
- Narrate your presentation
-
You may choose your own screen recording software, or record your screencast from within Canvas. Here is a link to instructions (Links to an external site.) on how to use Kaltura Capture to record within Canvas [174]. Note: Kaltura Capture is accessed in Canvas by clicking on My Media in the Canvas menu and "Add new". If you do not use Kaltura Capture, you will need to upload your own video file to My Media [175] using these instructions (Links to an external site.).
-
Record your screen while you give your five to seven-minute slideshow (make sure the slides are visible and the audio is clear - using a headset microphone is normally the best way to ensure decent audio quality).
-
Need more help? Contact the World Campus Helpdesk [176] for assistance.
-
NOTE: Review the rubric [177]CAREFULLY! You will be graded on the above items as well as the organization, appearance and professional delivery of your presentation.
Submitting Your Work
Directions for creating, submitting, and sharing your presentation can be found with the dropbox.
Grading Criteria
This initial version of your presentation will be not be graded by me. Instead, it will be reviewed by one of your classmates. You will then use the feedback you receive from your peer to improve upon the final presentation you will submit to me during week 13. Use the Final Project Presentation Rubric [177] as a guide when creating your project. Even though this is ungraded, it is required. (Failure to turn this in on time will result in the inability to participate in the peer-review process next week and a zero on the Lesson 12 peer review assignment which is graded).
REMINDER: This must be turned in by the due date (see the calendar for specific due dates). No late assignments will be accepted. It is scored out of 40 total points.
Term Project Rubric (L11 & 13) Rubric
Part A: Data Analysis and Presentation
| Category | Weight | 31 – 40 Points | 21 – 30 Points | 11 – 20 Points | 1 – 10 Points | 0 Points |
|---|---|---|---|---|---|---|
| Project Description | 10% | Full graphic showing proposed area for the new line. Identified the company, the planned line size, the general location for the new line and the reasons why the line is needed. Presented logically and in an understandable manner. No more than two slides. |
Partial graphics showing 3 of 4 graphic elements, graphics, but meets all the other requirements listed for 40 Points. Logically presented. No more than two slides. |
Partial graphics showing 2 of 4 graphic elements and identifies at least two of the descriptive criteria listed for 40 Points. More than two slides. |
No graphics and only one criterion listed. Poorly organized. |
No graphics and no criteria listed. Poor understanding of the project. |
| Base Map | 15% | Includes all 6 required elements: start and end points, avoidance information, conservation information, building centroids, land use, land cover, and North Arrow, Scale bar & Legend. | Includes 5 of the 6 required elements. | Includes 4 of the 6 required elements. | Includes 3 of the 6 required elements. | Includes 2 or less of the 6 required elements. |
| Alternate Route Map Completeness | 15% | 3 alternate routes and 3 corridors are displayed. | 3 alternate routes and 2 corridors are displayed. | 3 alternate routes and 1 corridor are displayed. | 2 alternate routes and 1 corridor are displayed. | Less than 2 of the alternate routes and corridors displayed. |
| Spreadsheet Completeness | 5% | Includes all 7 required elements: route data, normalized data, built emphasis, natural environment emphasis, simple average emphasis, combined rank and chart graphs. | Includes 6 of the 7 required elements. | Includes 5 of the 7 required elements. | Includes 4 of the 7 required elements. | Includes 3 or fewer of the 7 required elements. |
| Final Route Selection | 5% | Minimizes impacts to natural, built and engineered environments. | Minimizes impacts to 2 of the 3 environments. | Minimizes impacts to 1 of the 3 environments. | -- | No minimized impacts. |
| Route Selection Process Explanation | 10% | Followed the Photo Science tutorial completely without assistance. Explained the major outcomes from each step showing a complete understanding of the GIS siting process. Presented graphics from each completed step in the analysis. | Followed the Photo Science tutorial without assistance. Explained the major outcomes from each step showing a complete understanding of the GIS siting process. | Followed the Photo Science tutorial with minimal assistance. Explained the major outcomes from each step, but not having a complete understanding of the GIS siting process. | Followed the Photo Science tutorial with major assistance. Explained the major outcomes from each step, but having only a minimal understanding of the GIS siting process. | Did not follow the Photo Science tutorial. No understanding of the GIS siting process. |
| Addressing Public Participation | 5% | States the purpose of public participation clearly and creatively and is extremely well thought out. | States the purpose of public participation clearly and is generally well thought out. | States the purpose of public participation, and is somewhat thought out. | -- | Does not clearly state the purpose of public participation, and organization is poor or non-existent. |
Part B: Presentation
(Consists of three parts, Organization, Appearance, and Verbal Delivery. The total weight for all three parts is 40%
| Category | Weight | 31 – 40 Points | 21 – 30 Points | 11 – 20 Points | 1 – 10 Points | 0 Points |
|---|---|---|---|---|---|---|
| Organization | 13% | Extremely well organized. Introduces the purpose of the presentation clearly and creatively. Effectively includes smooth, clever transitions which are succinct but not choppy in order to connect key points. Presents information in logical, interesting sequence which audience can follow. Ends with an accurate conclusion showing thoughtful, strong evaluation of the evidence presented. Concludes by thanking the audience and opening the floor to a discussion in a stellar and professional manner. |
Generally well organized. Introduces the purpose of the presentation clearly. Includes transitions to connect key points but better transitions from idea to idea could have been used. Presents most information in logical sequence; A few minor points may be confusing. Ends with a summary of main points showing some evaluation of the evidence presented. Concludes by thanking the audience and opening the floor to a discussion in an unprofessional manner. |
Somewhat organized. Introduces the purpose of the presentation. Includes some transitions to connect key points but there is difficulty in following the presentation. Jumps around topics. Several points are confusing. Ends with a summary or conclusion; little evidence of evaluating content based on evidence. Does not thank the audience or open the floor for discussion. |
-- | Poor or non-existent organization. Does not clearly introduce the purpose of the presentation. Uses ineffective transitions that rarely connect points; cannot understand presentation because there is no sequence for information. Presents choppy and disjointed information; no apparent logical order of presentation. Ends without a summary or conclusion. Does not thank the audience or open the floor for discussion. |
| Category | Weight | 31 – 40 Points | 21 – 30 Points | 11 – 20 Points | 1 – 10 Points | 0 Points |
|---|---|---|---|---|---|---|
| Appearance | 13% | Graphics are designed to reinforce presentation thesis and maximize audience understanding; use of media is varied and appropriate with media not being added simply for the sake of use. Visual aids are colorful and large enough to be easily read. Font size and selection is appropriate for reading and viewing. Media are prepared in a professional manner. Details are minimized so that main points stand out. Use of graphical media is varied and appropriate. Graphical media does not clutter or overwhelm presentation. |
While graphics relate and aid presentation thesis, these media are not as varied and not as well connected to presentation thesis. Font size is appropriate for reading. Appropriate information is prepared. Some material is not supported by visual aids. Presentation has no more than two misspellings and/or grammatical errors. |
Occasional use of graphics that rarely support presentation thesis; visual aids are not colorful or clear. Choppy, time wasting the use of multimedia; lacks smooth transition from one medium to another. Font is too small to be easily seen. Communication aids are poorly prepared or used inappropriately. Too much information is included. Unimportant material is highlighted. Presentation has three misspellings and/or grammatical errors. |
Student uses superfluous graphics, or graphics that are so poorly prepared that they detract from the presentation. Font is too small to be easily seen. Student's presentation has four spelling errors and/or grammatical errors. |
No graphics are used. Font is unreadable. Student’s presentation has 5 or more spelling and/or grammatical errors. |
| Category | Weight | 31 – 40 Points | 21 – 30 Points | 11 – 20 Points | 1 – 10 Points | 0 Points |
|---|---|---|---|---|---|---|
| Verbal Delivery | 14% | Poised, clear articulation; proper volume; steady rate; enthusiasm; confidence; speaker is clearly comfortable in front of a group. Uses correct, precise pronunciation of terms. Selects rich and varied words for context and uses correct grammar. Sentences are complete and grammatical, and they flow together easily. Words are chosen for their precise meaning. |
Clear articulation but not as polished; slightly uncomfortable at times. The presenter’s voice is clear and shows command of the subject matter, but presenter sounds uncomfortable. Pronounces most words correctly. Selects words appropriate for the context and uses correct grammar. For the most part, sentences are complete, grammatical and they flow together easily. With a few exceptions, words are chosen for their precise meaning. |
Audience occasionally has trouble hearing the presentation. Presenter sounds uncomfortable and lacks confidence. Incorrectly pronounces terms. Selects words inappropriate for context; uses incorrect grammar. The audience can follow the presentation, but some grammatical errors and use of slang are evident. Some sentences are incomplete/ halting, and/or vocabulary is somewhat limited or inappropriate. |
Presenter is obviously anxious and/or is monotone with little or no expression. Student mumbles, pronounces terms incorrectly. Selects words inappropriate for context; uses incorrect grammar. The audience cannot focus on the ideas presented because of difficulties with grammar and appropriate vocabulary. |
Presenter cannot be heard. |
The grade for each category is calculated by multiplying the weight for the category times the number of points awarded for the category to arrive at the weighted score for the category. The final grade is the sum of all category-weighted scores.
| Category | Weight | Points Earned | Weighted Score |
|---|---|---|---|
| Project Description | 10% | 40 | 4.0 |
| Base Map | 15% | 40 | 6.0 |
| Alternate Route Map Completeness | 15% | 25 | 3.75 |
| Spreadsheet Completeness | 5% | 30 | 1.5 |
| Final Route Selection | 5% | 36 | 1.8 |
| Route Selection Process | 5% | 20 | 1.0 |
| Address Public Participation | 5% | 25 | 1.25 |
| Presentation (Parts A, B, And C) | 40% | 35 | 15.75 |
| Total Score | 100% | -- | 35.05 out of 40 = 87.6% |
Summary and Final Tasks
In this lesson, you learned that effective communication is a vital part of success in the business world. To help you achieve this success, you developed a PowerPoint presentation with narration. This project allowed you to develop skills in making a concise and professional presentation that can be given to any level of management and the public.
So, what's next? Lesson 12 will be the culmination of this project. In Lesson 12, you will be a member of the site-selection committee with the responsibility to review and comment on a presentation submitted by one of your fellow students!
Reminder - Complete all of the lesson tasks!
You have finished Lesson 11. Double-check the list of requirements on the first page of this lesson to make sure you have completed all of the activities listed there before beginning the next lesson.
Tell us about it!
If you have anything you'd like to comment on, or add to, the lesson materials, feel free to post your thoughts in the Discussion Forum.
Lesson 12 - Siting Plan Review
An Overview of Lesson 12
Prior to a project's final approval, it must be approved internally by upper management. Project managers will present their project to the committee, explaining why the project is needed, how the transmission line corridors were selected, and how the final choice for the planned route was selected. In addition, the financial, environmental, and public impact costs will be explained. Once this information is analyzed by the selection committee, the committee will make a recommendation on whether the project should move forward. If the project is selected to move forward, it will then be recommended to the company executives for planning approval and financing. Once final approval is granted, the project manager will schedule a series of meetings for review by citizens, governmental officials, and private business to review and comment. The comments and recommendations will be incorporated into the overall plan, and the plan will be submitted to the public utility commission for review and approval.
What will we learn in Lesson 12?
Your goal in this lesson is to move from the perspective of the project manager to that of a member of the site selection committee. As a committee member, you will evaluate another student's presentation of the project description, final routing process, public participation plan, presentation organization, appearance, and verbal delivery. You will provide the student a summary of your evaluation with any recommendations you want to make.
By the end of this lesson, you should be able to:
- taking the role of a stakeholder, critically evaluate a peer's siting proposal and provide appropriate, professional feedback.
What is due for Lesson 12?
This lesson will take us one week to complete. Please refer to the Calendar for specific time frames and due dates. Specific directions for the assignment below can be found within this lesson.
- Submit a formal critique of another student's presentation using the scoring rubric provided.
Questions?
If you have any questions, please post them to our Questions? discussion forum. I will check that discussion forum daily to respond. While you are there, feel free to post your own responses if you, too, are able to help out a classmate.
Critiquing a Presentation
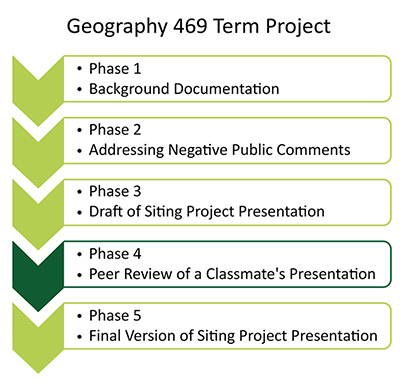
Project Phases
Activity
Write a peer review of another student's submittal of Lesson 11 – Initial Version of the Final Presentation. After you submit your assignment and the assignment due date has passed, your peer review will become available. Look for the student whose paper you are assigned to review under your Submission.
Directions
- Click on the Lesson 11 - Final Presentation assignment in the Lesson 11 module.
- On the right, you will see a name under text that reads "Assigned Peer Reviews".
- Click on the person's name.
- On the resulting page, click on the link to open the assignment you will be critiquing.
- Critique the presentation using the Capstone Project Presentation Rubric [177] as a guide. Your critique should address these elements:
- Route Project Description
- Final Routing Process
- Public Participation Plan
- Presentation Organization & Appearance
- Presentation Verbal Delivery
- Summary and Recommendations
Things to consider in this section: Would you approve the project or not? Why? Where you left with unanswered questions? Did anything spark your interest? Did anything not sit well with you? etc. - The critique should be submitted electronically, using as a Word document or a PDF using the following naming convention: Lesson12_Critique_AccessAccountID_LastName.doc (or .pdf)
Submitting Your Work
You will be required to complete the rubric and write a written report with you feedback. You will attach the written report to the peer review when you are done. Please read the "How to Complete the Peer Review [179]" document before beginning. The peer review must be complete no later than Sunday at midnight of Lesson 12 (see the course calendar for specific due date).
Grading Criteria
You will be graded using the Presentation Critique Rubric [180].
Lesson 12 Presentation Critique Rubric
| Element | 3 | 2 | 1 | 0 |
|---|---|---|---|---|
| Route Project Description | Provide clear, objective feedback on the project description, addressing both strengths & weaknesses in a constructive manner. | Provide clear, objective feedback but does not address strengths & weaknesses. | Just saying the description “either meets expectations” or “is inadequate” or similar feedback. | Did not provide feedback, or provided critical, subjective, unprofessional feedback. |
| Final Routing Process | Provide clear, objective feedback on the final routing process, addressing both strengths & weaknesses in a constructive manner. | Provide clear, objective feedback but does not address strengths & weaknesses. | Just saying the final routing process “either meets expectations” or “is inadequate” or similar feedback. | Did not provide feedback, or provided critical, subjective, unprofessional feedback. |
| Public Participation Plan | Provide clear, objective feedback on the public participation plan, addressing both strengths & weaknesses in a constructive manner. | Provide clear, objective feedback but does not address strengths & weaknesses. | Just saying the public participation plan “either meets expectations” or “is inadequate” or similar feedback. | Did not provide feedback, or provided critical, subjective, unprofessional feedback. |
| Presentation, Organization, & Appearance | Provide clear, objective feedback on the presentation organization and appearance, addressing both strengths & weaknesses in a constructive manner. | Provide clear, objective feedback but does not address strengths & weaknesses. | Just saying the presentation, organization & appearance “either meets expectations” or “is inadequate” or similar feedback. | Did not provide feedback, or provided critical, subjective, unprofessional feedback. |
| Presentation Verbal Delivery | Provide clear, objective feedback on the presentation verbal delivery, addressing both strengths & weaknesses in a constructive manner. | Provide clear, objective feedback but does not address strengths & weaknesses. | Just saying the verbal delivery “either meets expectations” or “is inadequate” or similar feedback. | Did not provide feedback, or provided critical, subjective, unprofessional feedback. |
| Summary & Recommendations
|
Provide clear, objective summary & recommendations, including strengths & weaknesses in a constructive manner. | Provide clear, objective feedback but does not address strengths & weaknesses. | Just saying the summary “either meets expectations” or “is inadequate” or similar feedback. | Did not provide feedback, or provided critical, subjective, unprofessional feedback. |
Summary and Final Tasks
In this lesson, you learned that effective communication is a vital part of success in the business world. You became a member of the site selection committee with the responsibility to review and comment on a presentation submitted by one of your fellow students!
Reminder - Complete all of the lesson tasks!
You have finished Lesson 12. Double-check the list of requirements on the first page of this lesson to make sure you have completed all of the activities listed there before beginning the next lesson.
Tell us about it!
If you have anything you'd like to comment on, or add to, the lesson materials, feel free to post your thoughts in the Discussion Forum.
Lesson 13 - Final Presentation
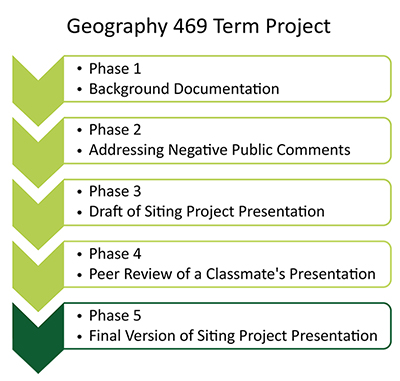
Project Phases
An Overview of Lesson 13
This is your opportunity to revise and improve upon your initial siting project presentation. Please review your peers' feedback and any feedback that I may have offered. Implement any suggestions that you found useful and submit your updated 'final' version of the Siting Project Presentation to the appropriate assignment in Module 13. Your final presentation will be graded using the Siting Presentation Rubric [182].
What is due for Lesson 13?
You will have one week to complete this task. Please refer to the Calendar for specific time frames and due dates.
Questions?
If you have any questions, please post them to our Questions? discussion forum. I will check that discussion forum daily to respond. While you are there, feel free to post your own responses if you, too, are able to help out a classmate.