Lesson 2 - Major Siting Challenges in the Energy Enterprise, Part 1
An Overview of Lesson 2
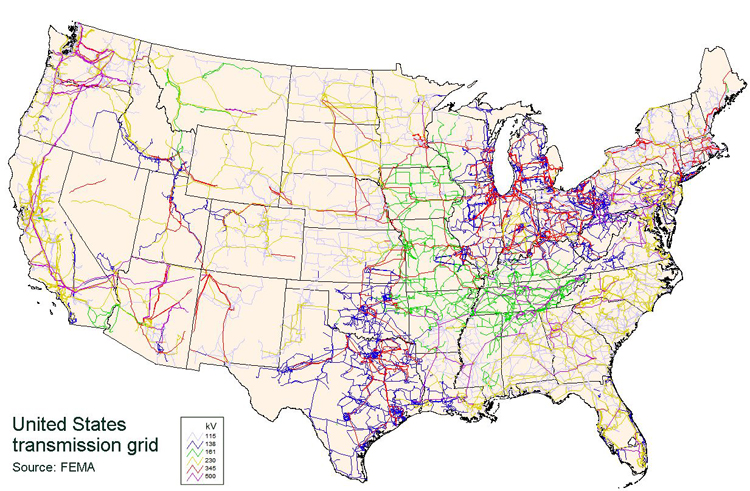
The siting of energy distribution and transmission is a complex maze of political, regulatory, legal, and environmental challenges. It is estimated that by 2035 the demand for new electric transmission lines will increase by 35 percent. In addition, it is estimated the number of oil and natural gas transmission lines will increase by 14 percent by 2030. National Public Radio reported on both energy demand and transmission grid needs in a series of 2009 articles on reinventing the U.S. power grid with an interactive presentation [1] visualizing the U.S. electric grid.
In this lesson, we learn how the electrical transmission system works in the United States. Specifically, we will learn how it originated, how federal government regulations have influenced the development of the transmission grid, how siting criteria from state to state varies, and some of the major problems we have experienced with the grid over the years.
What will we learn in Lesson 2?
By the end of this lesson, you should be able to:
- explain the history of the electrical transmission system;
- explain how and when the system originated;
- explain how the oil, natural gas, and gasoline pipeline transmission system operates;
- discuss the major issues undermining the reliability of the electrical transmission system.analyze and be able to discuss the major roadblocks to expanding the U.S. electrical grid and natural gas pipelines;
- analyze and be able to discuss the major roadblocks to expanding the U.S. electrical grid and natural gas pipelines;
- learn the basic operations of the Esri ArcGIS Pro system by meeting all of the requirements of the "Getting Started with ArcGIS Pro" Esri training;
- reflect on what you learned through the ArcGIS training courses.
What is due for Lesson 2?
This lesson will take us one week to complete. Please refer to the course Calendar for specific time frames and due dates. Specific directions for the assignments below can be found within this lesson.
- Take the Lesson 2 Quiz.
- Participate in the class discussion: What do you see as the major roadblocks to expanding the U.S. electrical grid and natural pipelines?
- Begin the "Getting Started with ArcGIS Pro" Esri training (due by the end of Lesson 4).
- Take the Introduction to ArcGIS Reflection Quiz once you have completed all of the courses (due by the end of Lesson 4).
Questions?
If you have any questions, please post them to our Questions? discussion forum. I will check that discussion forum daily to respond. While you are there, feel free to post your own responses if you, too, are able to help out a classmate.
Electric Transmission and Distribution Network
The electric grid in the United States is a complex maze of more than 150,000 miles of high-voltage transmission lines fed by more than 5,400 generating facilities.
There are four major utility types responsible for the generation and transmission of electricity in the United States. These types include investor-owned utilities, public utilities, electric cooperatives, and non-utility power producers. The largest amount of energy in the United States is generated by investor-owned electric utilities, which accounts for about 73 percent of the total electric power generated. Public utilities made up of federal, state, and local governments are the second-largest type of electric power generators, generating about 14 percent of the total electric power. Electric cooperatives provide an additional 12 percent of the total electric power generated, followed by the non-utility power producers, making up the remainder of the total. In contrast, non-utility power producers are the largest in number (2,100), followed by public utilities (2,000), electric cooperatives (930), and then investor-owned utilities (213).
There was no master plan in place for the grid; it evolved over time as the demand for electricity increased. To meet this ever-growing demand, utilities established links with their neighboring utilities to provide power where it was needed. Utilities realized they needed to improve reliability. They also realized that economies of scale could be leveraged by linking the transmission lines.
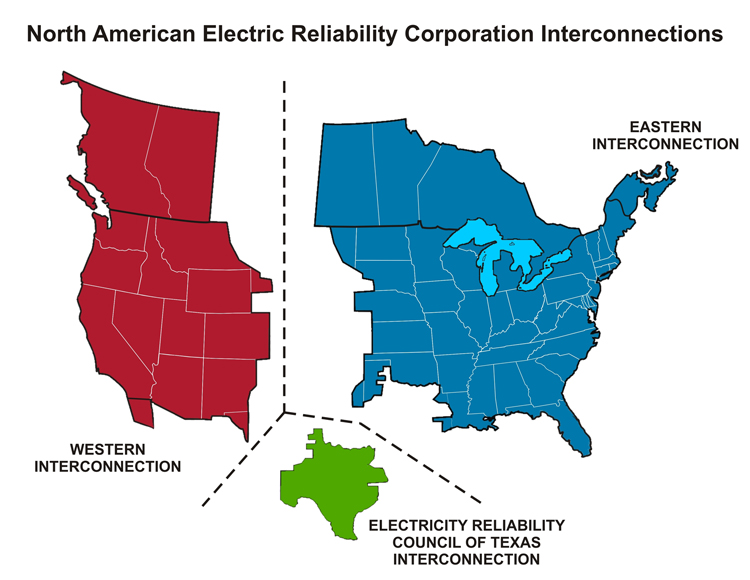
A huge Northeast blackout occurred in 1965 (see why: Northeast Blackout of 1965 [2]), and as a result, much of the grid control shifted to regional operations. This regional framework consists of the Eastern Interconnection, the Western Interconnection, and the Texas Interconnection. These interconnections maintain connections with Canada and Mexico. Overall reliability planning and coordination of the electric grid is provided by the voluntary North American Electric Reliability Council (NERC), created after the 1965 Northeast blackout. NERC functions to "develop and enforce reliability standards; assess reliability annually via 10-year and seasonal forecasts; monitor the bulk power system; and educate, train, and certify industry personnel." (NERC Website) [3]
To meet future demands for electricity, the current generation and transmission system requires heavy investment in new, conventional, and alternative generation, including efficiency improvements. In concert with this new investment in generation comes a similar need to upgrade and expand in next-generation transmission and distribution systems. The current transmission and distribution system is congested because of the growing demand for electricity, poor planning, and insufficient investment to keep pace with changes. A consequence of this lack of planning prohibits the planned outages necessary for routine maintenance, which can lead to system-wide failures in the event of unplanned outages.
Oil, Gasoline, and Natural Gas Pipelines
Based on petroleum supply estimates from the Energy Information Administration [5], oil and petroleum products consumed in the United States totaled 7.284 billion barrels in 2017, and increase of 1% from 2016. Petroleum used for electrical generation accounted for 0.5 percent of that total. The remainder of the consumption included transportation (70.3 percent), industrial (24.2 percent), and residential and commercial (5.0 percent) (Statistica.com [6]).
The Energy Information Administration [7] records show total natural gas consumption in 2017 totaled 27,110,271 million cubic feet. Of that total, 24,824,283 million cubic feet was delivered to the final consumer. Consumption used for electrical generation accounted for 9,250,066 million cubic feet or 37.2 percent of this total, residential use consumed 17.6 percent and industrial use consumed 32.0 percent. The remainder of the total (13.2 percent) was used for commercial and vehicle purposes (EIA: Natural Gas Consumption by End-Use [8]).
Similar to the electric transmission grid, the current oil and natural gas transmission infrastructure was not designed to meet the expected rate of natural gas consumption growth that the nation will see in the next decade. More than 90 percent of all planned new power generation in the United States will be fueled by natural gas. Almost all small, supplemental back-up generating units (such as those used by hospitals and schools) are powered by natural gas.
According to a report of recommendations prepared by the National Association of Regulatory Utility Commissioners (NARUC), one of the key challenges to energy availability is an adequate natural gas pipeline and distribution system to provide an ever-increasing gas demand across the country. The National Petroleum Council (NPC) estimates over 38,000 miles of new transmission lines will be needed, as well as 263,000 miles of new distribution lines. That much pipeline will require the attention of every state, and many regulatory bodies within the states. It will also require the attention of the Federal Energy Regulatory Commission (FERC), the Bureau of Land Management (BLM), the U.S. Forest Service, and many other federal entities.
The efficient and effective movement of natural gas from producing regions to consumers requires an extensive transmission system. In many instances, natural gas produced from a particular well will have to travel a great distance to reach its point of use. The transmission system for natural gas consists of a complex network of pipelines, pumping stations, and storage facilities. The transmission of natural gas is closely linked to its storage. When natural gas demand is low, it can be put into storage facilities until needed.
Natural gas pipelines include pipelines used in the gathering system, and in interstate transmission and final distribution. The gathering system consists of low-pressure, low-diameter pipelines that transport raw natural gas from the wellhead to the processing plant.
Pipelines can be characterized as interstate or intrastate. Interstate pipelines carry natural gas across state boundaries, in some cases, across the country. Intrastate pipelines, on the other hand, transport natural gas within a particular state. We will focus on the fundamentals of interstate natural gas pipelines, because the technical and operational details discussed are essentially the same for intrastate pipelines.
Natural gas pipelines are subject to regulatory oversight, which in many ways determines the manner in which pipeline companies must operate.
Want to learn more?
See the following sites to learn more about the
- storage of natural gas [9],
- processing of natural gas [10],
- regulation of natural gas [11], and
- fracking [12]
Interstate pipelines are the 'highways' of natural gas transmission. Natural gas that is transported through interstate pipelines travels at high pressure in the pipeline, at pressures anywhere from 200 to 1500 pounds per square inch (psi). This reduces the volume of the natural gas being transported (by up to 600 times), as well as providing propellant force to move the natural gas through the pipeline. For more information on interstate pipelines in general, visit the website of the Interstate Natural Gas Association of America.
The Federal Energy Regulatory Commission [13](FERC) and other Federal agencies are encouraging and sometimes requiring interstate natural gas pipeline operators to use existing rights-of-way (ROW), where possible when proposing routes for new construction. This is occurring throughout the country, even in more rural, sparsely populated areas.
What Can Happen When Something Goes Wrong?
The PJM Network Failure
Let's look at a real-life example of what can go wrong. The following excerpt, describing a PJM Network failure, was taken from a July, 2010, National Geographic Magazine article. PJM Interconnection is the regional transmission organization that coordinates the movement of wholesale electricity in all or parts of 13 eastern states and the District of Columbia.
August 14, 2003. Most of PJM's network escaped the disaster, which started near Cleveland. The day was hot; the air conditioners were humming. Shortly after 1 p.m EDT, on August 14, 2003, grid operators at First Energy, the regional utility, called power plants to plead for more volts. At 1:36 p.m. on the shore of Lake Erie, a power station whose operator had just promised to "push it to my max max" responded by crashing. Electricity surged into northern Ohio from elsewhere to take up the slack.
At 3:05 a 345-kilovolt transmission line near the town of Walton Hills picked that moment to short out on a tree that hadn't been trimmed. That failure diverted electricity onto other lines, overloading and overheating them. One by one, like firecrackers, those lines sagged, touched trees, and short-circuited.
Grid operators have a term for this: "cascading failures." The First Energy operators couldn't see the cascade coming because an alarm system had also failed. At 4:06 a final line failure sent the cascade to the East Coast. With no place to park their electricity, 265 power plants shut down. The largest blackout in North American history descended on 50 million people in eight states and Ontario.
At the Consolidated Edison control center in lower Manhattan, operators remember that afternoon well. Normally the power load there dips gradually, minute by minute, as workers in the city turn off their lights and computers and head home. Instead, at 4? p.m. lights went out in the control room itself. The operators thought: 9/11. Then the phone rang, and it was the New York Stock Exchange. "What's going on?" someone asked. The operators knew at once that the outage was citywide.
There was no stock trading then, no banking, and no manufacturing; restaurants closed, workers were idled, and everyone just sat on the stoops of their apartment buildings. It took a day and a half to get power back, one feeder and substation at a time. The blackout cost six billion dollars. It also alarmed Pentagon and Homeland Security officials. They fear the grid is indeed vulnerable to terrorist attack, not just to untrimmed trees.
Full text available at National Geographic. [14]
Since 1990, electric demand has increased by about 25 percent, while expansion of existing transmission infrastructure has decreased by about 30 percent over this same time period. While annual investment in new transmission facilities has generally declined or been stagnant during the last 30 years, substantial investment in generation, transmission, and distribution are expected over the next two decades. Both industry and government estimate that electric utility investment needs could be as much as $1.5 to $2 trillion by 2030. Some progress in grid reinforcement has been made since 2005, but public and government opposition, difficult permitting processes, and environmental requirements are often restricting the much-needed modernization.
In a congestion study [15] prepared by the U.S. Department of Energy, congested transmission paths now affect many parts of the grid across the country. One recent estimate concludes that power outages and power quality disturbances cost the economy between $25 billion and $180 billion annually. These costs could soar if outages or disturbances become more frequent or longer in duration. There are also operational problems in maintaining voltage levels. Again, an excerpt from the National Geographic Magazine article shows just how little tolerance there is in maintaining a reliable voltage in the system:
PJM engineers try to keep the current alternating at a frequency of precisely 60 hertz. As demand increases, the frequency drops, and if it drops below 59.95 hertz, PJM sends a message to power plants asking for more output. If the frequency increases above 60.05 hertz, they ask the plants to reduce output. It sounds simple, but keeping your balance on a tightrope might sound simple too until you try it. In the case of the grid, small events not under the control of the operators can quickly knock down the whole system.Full text available at National Geographic. [14]
Many new transmission lines have been proposed to either alleviate congested paths or to provide redundancy so that existing portions of the transmission system can be temporarily taken out of service for proper maintenance and modernization. In many cases, funding is not the primary reason why these critical lines are not being built. Overly stringent permitting requirements, lawsuits, and other regulatory issues often inhibit transmission line construction.
Just as high voltage transmission needs have increased, so has the need to increases distribution. Distribution includes the system of substations, wires, poles, metering, and billing involved in delivering electricity to the consumer. The need to expand the distribution infrastructure and install new distribution equipment to meet population and demand growth will require continued investment. It is estimated that electric companies will spend $14 billion per year on average over the next 10 years on distribution investment. Over the next decade, distribution investment is likely to exceed capital spending on generation capacity as well.
Lesson Activity: Getting Started with ArcGIS Pro
Knowing how to use GIS software is an important skill to have in your professional portfolio, because GIS is used by business, industry, and government to solve complex geospatial problems such as location based services, vehicle routing, complex business analytics, and tracking the latest disaster. As the use of geospatial information becomes more widespread, those who have a good understanding of GIS will be a valuable asset to any organization.
Activity Part 1
For this activity, you will complete the "Getting Started with ArcGIS Pro" Esri online GIS training course.
This tutorial will give you the essentials needed to complete the term project that will begin in Lesson 9. These essential concepts will jumpstart your productivity with ArcGIS Pro. This course introduces the ribbon-style interface, project-based organization, key capabilities, and ArcGIS Pro terminology.
Learning Objectives:
- After completing this course, you will be able to perform the following tasks:
- Identify the components of the ArcGIS Pro interface.
- Create a project in ArcGIS Pro.
- Use editing tools in ArcGIS Pro to modify or create vector data.
- Use geoprocessing tools in ArcGIS Pro to analyze data.
- Use the Raster Functions pane in ArcGIS Pro to visually analyze raster data.
- Use ArcGIS Pro to share a project.
Accessing and completing the tutorial
- Go to the Esri Academy [16] (www.esri.com/training/ [16]) and log in with your Esri username and password to go to the Esri Training page.
- Use the search function to search for the course “Getting Started with ArcGIS Pro”.
- Select "Support & Training" in the top menu.
- Select the “Getting Started with ArcGIS Pro” course from the list to begin.
- Read the overview and then select the "Launch Course" button.
- Follow the course outline on the left sidebar to navigate and complete the course.
- Print or save a copy of the Certificate of Completion to a place where you can easily locate it.
Activity Part 2
After you have completed the training course take the " Getting Started with ArcGIS Pro" quiz.
Deliverables
By the end of Lesson 4, submit your Certificate of Completion to the Getting Started with ArcGIS Pro Dropbox drop box by the due date indicated on the course calendar.
Grading Criteria
The course completion activity will be graded on a simple pass/fail basis, but it is worth a full 10% of your course grade. You will "pass" by submitting your Certificates of Completion!
Note
The Getting Started with ArcGIS Pro tutorial will take you at least 5 hours and 30 minutes to complete, so schedule your time accordingly. You have three weeks to complete them, so feel free to spread it out. I do not, however, recommend that you wait until the end of Lesson 4 to begin.
Lesson Discussion Assignment
Discussion Activity
For this week, I want to engage you in a whole-class discussion of the following question:
What do you see as the major roadblocks to expanding the U.S. electrical grid and natural gas pipelines?
This discussion will take place in a special discussion forum created for this purpose.
Note
In order for this activity to "work," you will need to participate in this discussion on a daily basis in order to catch up on postings and to contribute your own thoughts.
Directions
- In the discussion forum, post your response to the following question:
- What do you see as the major roadblocks to expanding the U.S. electrical grid and natural gas pipelines?
- Read the postings made by the other GEOG 469 students.
- Respond to at least one other posting by asking for clarification, asking a follow-up question, expanding on what has already been said, etc.
Make sure your posting is meaningful! I do not want to see "I agree" type postings! Your responses should add value to the discussion. - Return to the discussion forum daily to read new postings, answer questions directed specifically to you, and to respond to any other postings of interest with your own questions or thoughts!
Grading Criteria
All students are expected to participate in the questions in their group discussions in a concise, well-organized, and scholarly manner. Saying, “I agree with Jennifer” is not adequate. You need to say why you agree (or disagree) and support your comments. Comments should be based on information obtained from appropriate reference sources, including lesson materials, previous coursework, Web-based information, or personal experience. You must use proper grammar and spelling for all contributions.
Your contributions to this assignment will be graded on a 15-point scale. Look at the discussion rubric [17] for more details about my expectations.
Summary and Final Tasks
In this lesson, you learned about the origin of the grid, how and why it was constructed, and how and why it was regulated. We all take the grid to be a smooth-running invisible operation; but when it fails, we see how it impacts us. Through a real-life example, we saw how a failure in one part of the country can impact individuals and businesses in other parts of the country and how, in fact, the grid is interrelated. Finally, we were exposed to the other major energy transmission system, the interstate pipeline system, and how the siting criteria for this system is very similar to the electric grid.
Reminder - Complete all of the lesson tasks!
You have finished Lesson 2. Double-check the list of requirements on the first page of this lesson to make sure you have completed all of the activities listed there before beginning the next lesson.
Tell us about it!
If you have anything you'd like to comment on, or add to, the lesson materials, feel free to post your thoughts in the Questions? Discussion Forum. For example, what did you have the most trouble with in this lesson?