Geographic Phenomena: Spatial Dimensions
Geographic phenomena are often classified according to the spatial dimension best used to describe their nature. These include points, lines, areas, and volumes (3D). As you likely remember, we used the spatial dimension of map elements (e.g., line vs. point) in the last lab to decide how to symbolize and apply feature labels to our maps.
Points exist in a singular location and thus have theoretically zero dimensions. Points are usually specified using a coordinate pair (x, y) of latitude and longitude, though they occasionally include a z (height).
Lines are one-dimensional spatial features, typically defined by a series of (x, y) coordinates. A z (height) dimension can also be assigned to lines, but this is uncommon. Lines are used to map phenomena that are best conceived of as linear features, including both some features that have greater dimensionality in reality (e.g., rivers) and those that do not visibly exist in the real world at all (e.g., property lines).
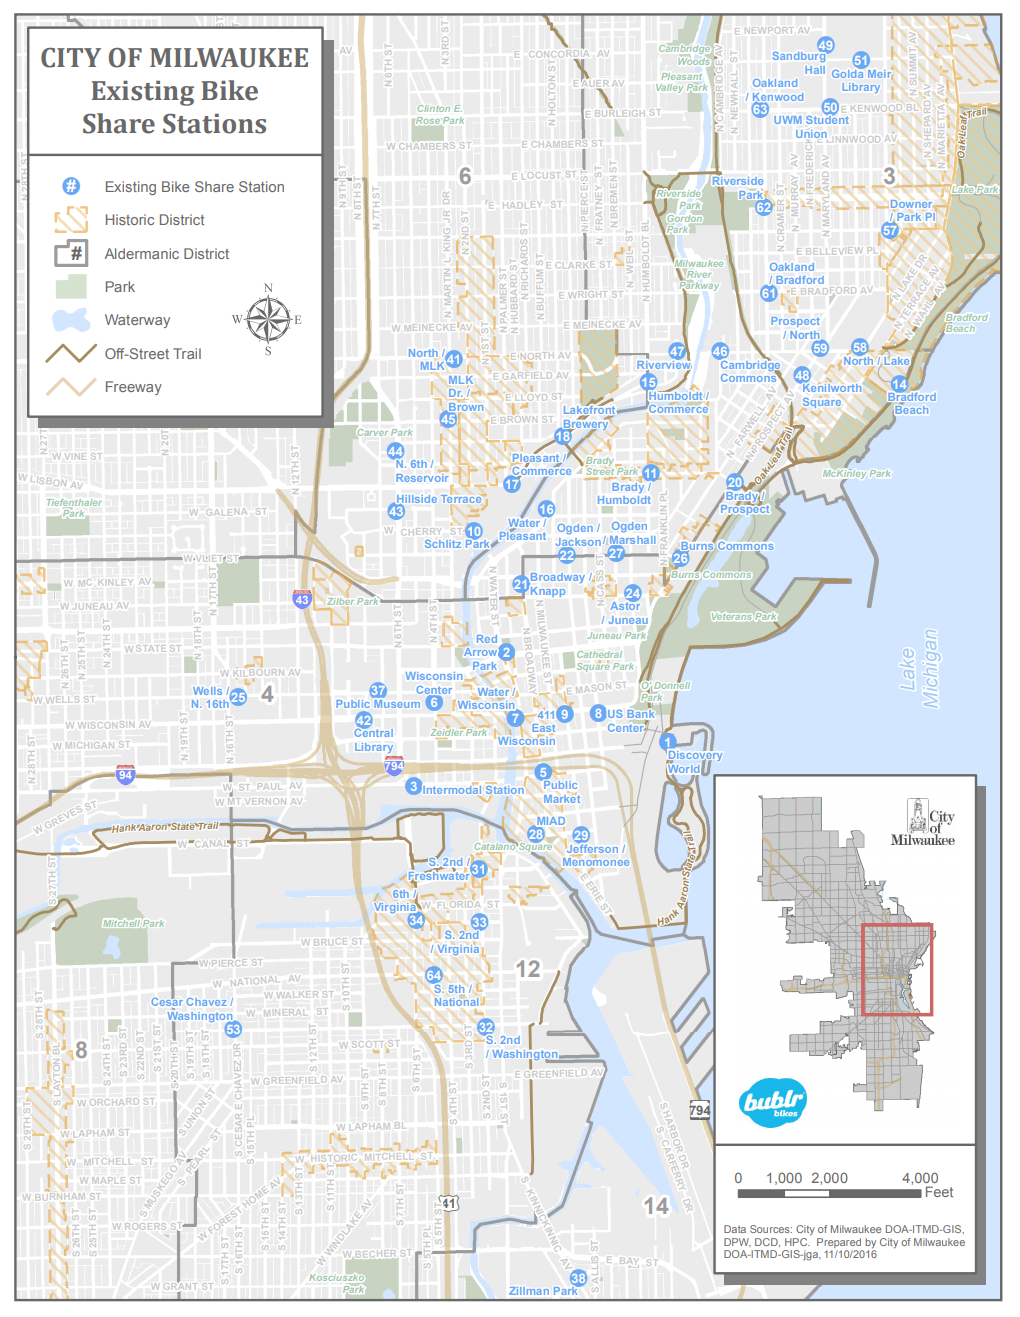
Area features are two dimensional and are represented by a series of (x, y) points that enclose a space. Areal phenomena include natural features like lakes and parks, as well as human-defined locations—from continents to census blocks.

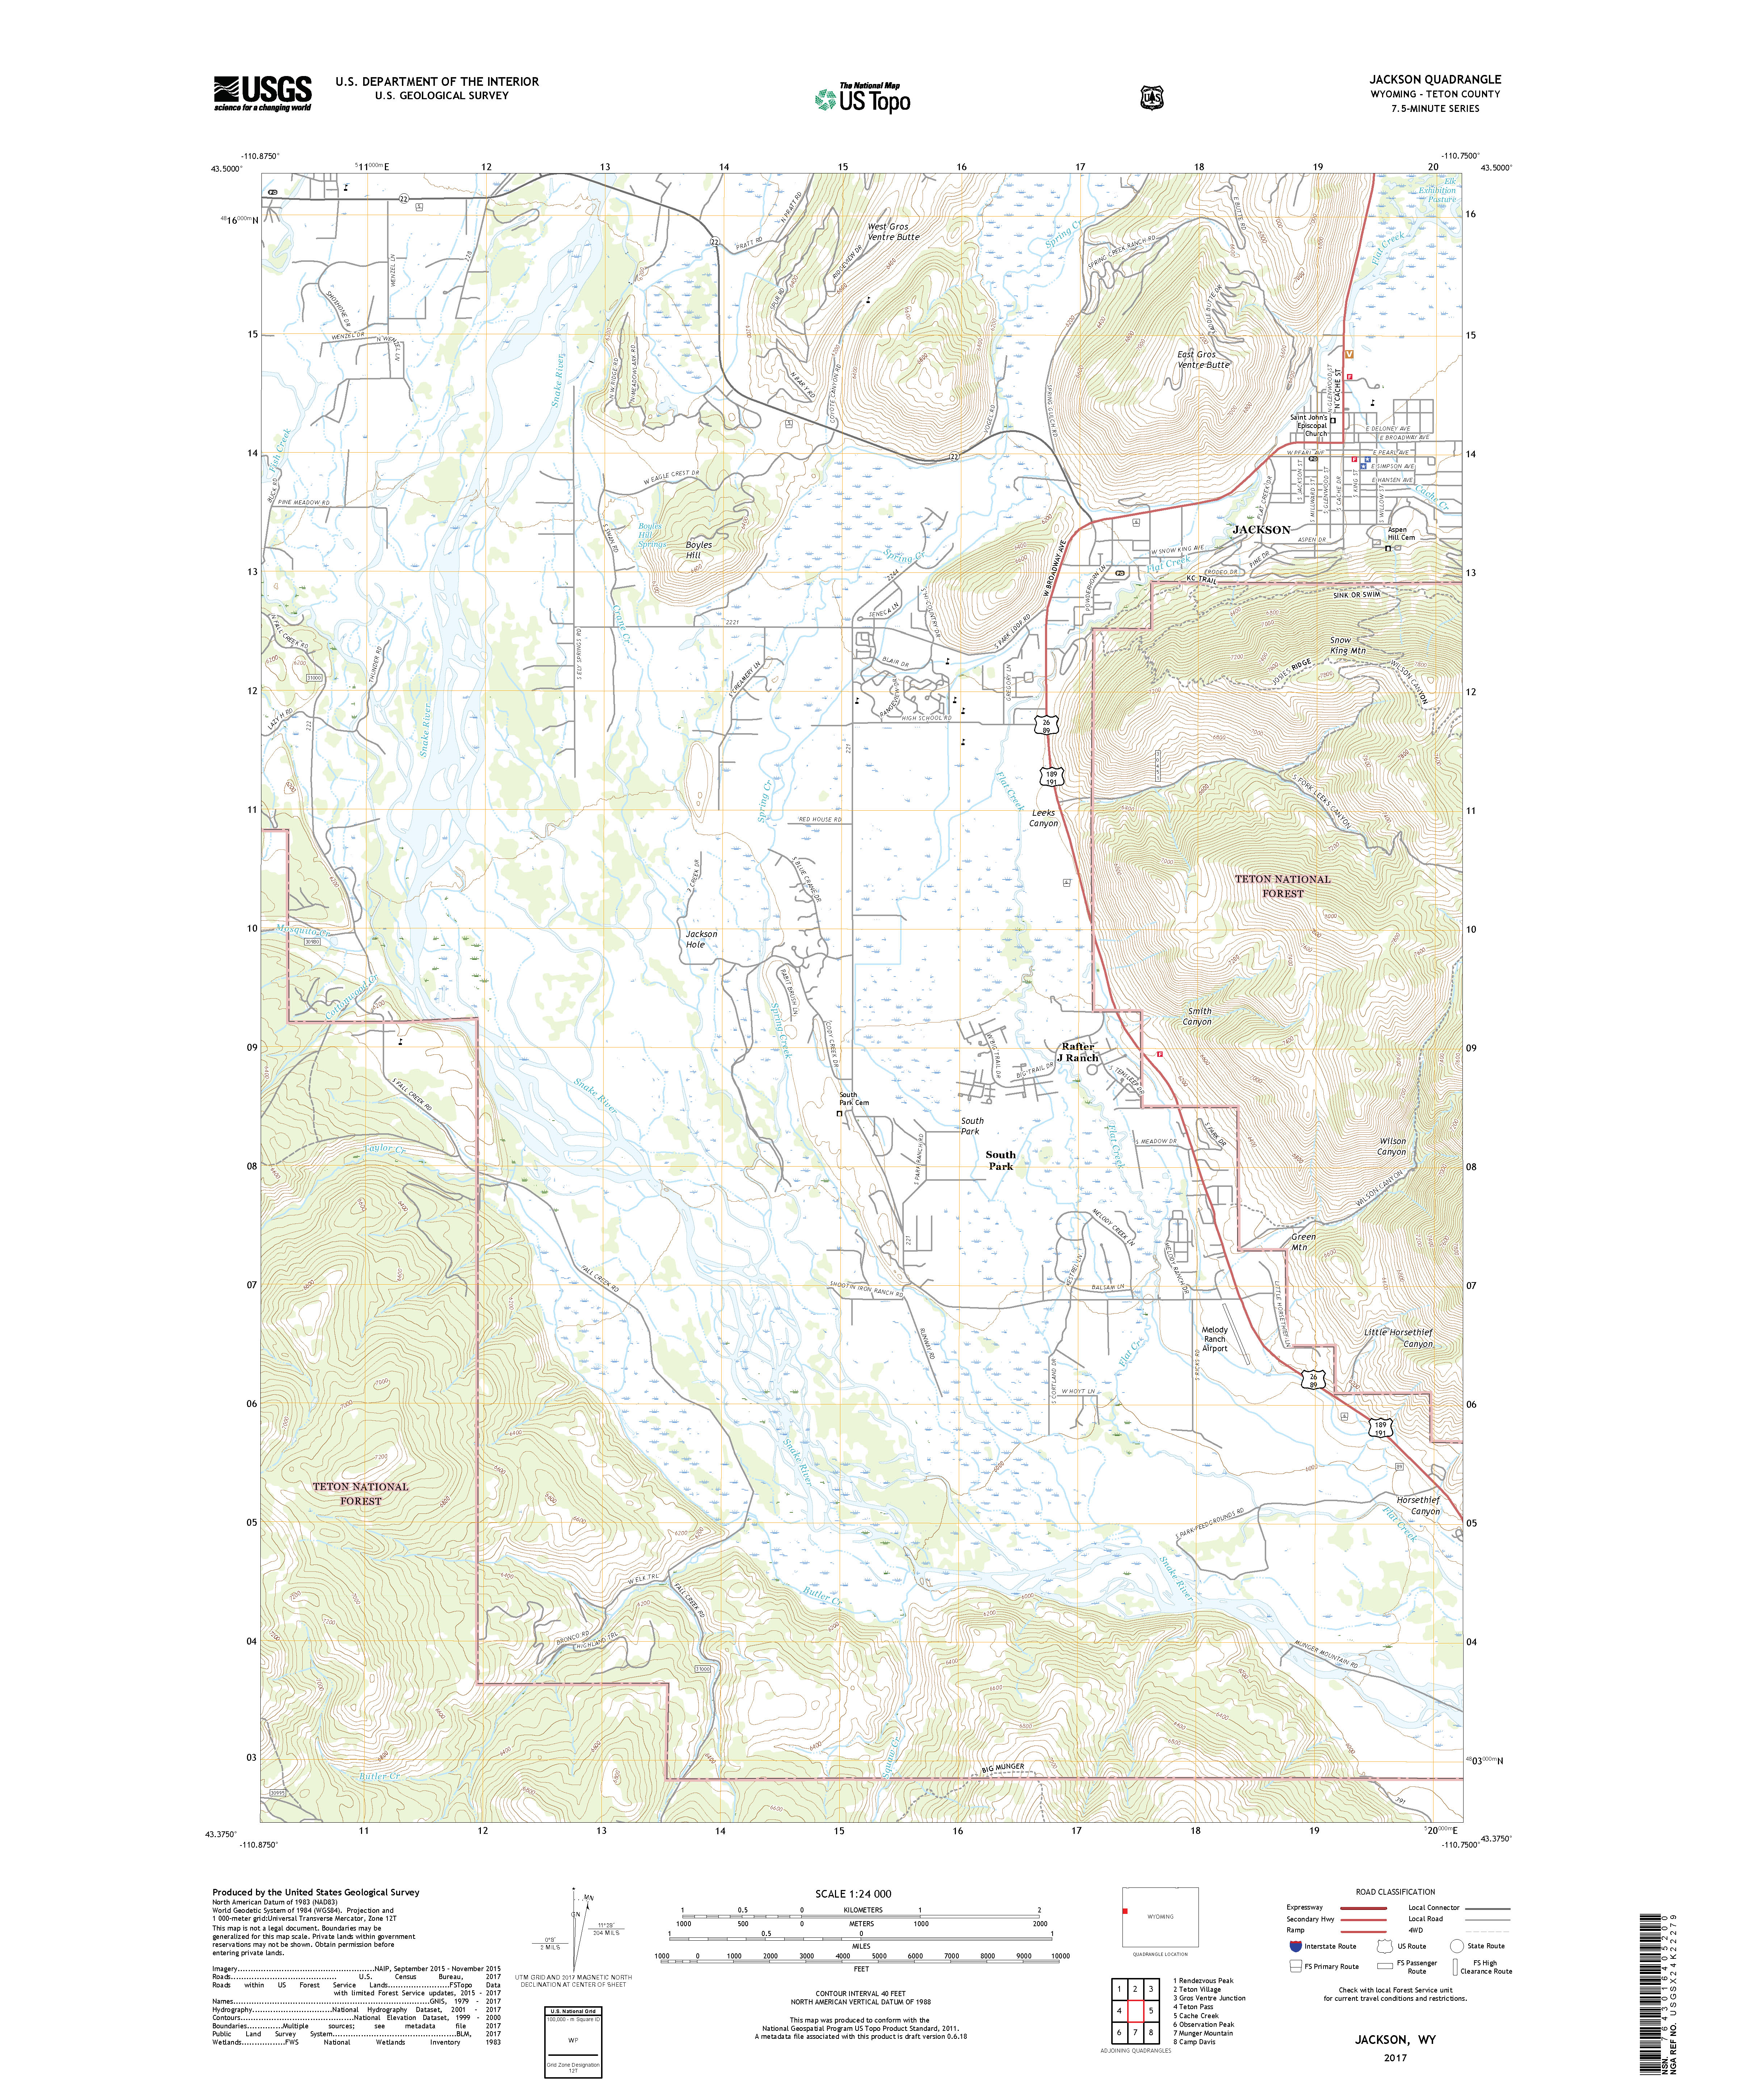
2-½ and 3-D features are sometimes grouped together, but the distinction between them is important. 2-½D features define a continuous surface—they have an x, y, and a z at every location. A good example is elevation, which varies continuously across the landscape. Therefore, a topographic map is a common depiction of 2-½D phenomena.
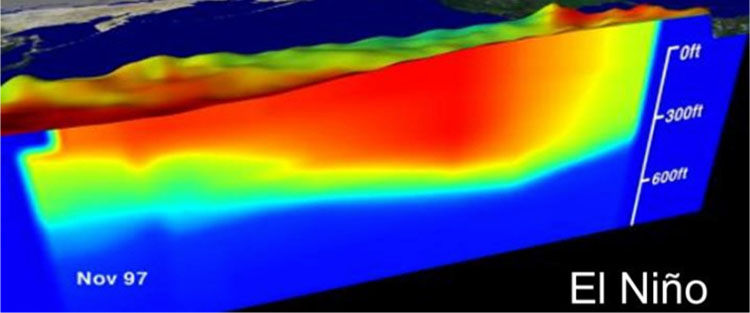
True 3D maps have an x, y, and z, plus an additional data value, at every location. Imagine, as an example, a map of elevation like the one above; but at every point along the terrain surface, there are additional measurements being taken at various depths. Thus, rather than depicting a continuous surface, true 3D maps depict a continuous volume.
Keep in mind that the scale of your map has significant influence on what spatial dimension will best represent the phenomenon you intend to map. Cities, for example, are usually drawn as areas on large-scale maps, but appear as points on smaller-scale maps. Rivers are usually drawn as lines on small-scale maps but are better represented as areas on large-scale maps. We will discuss this more during discussions of cartographic generalization later in the course.
Recommended Reading
- Peuquet, D J. 1984. “A Conceptual Framework and Comparison of Spatial Data Models.” Cartographica 21 (4): 66–113. doi:10.3138/D794-N214-221R-23R5.
- Couclelis, Helen. 1992. “People Manipulate Objects (but Cultivate Fields): Beyond the Raster-Vector Debate in GIS.” GIScience Conference Pa. doi:10.1007/3-540-55966-3.