Data Standardization
As discussed in Lesson 3, the choropleth mapping technique should be used on standardized data such as rates and percentages—rather than on totals or counts—which are better represented by point symbol maps.
Your data will sometimes be delivered in the proper standardized format. For example, you might have for each enumeration unit in your data a rate, density, or index value. All of these are appropriate for choropleth mapping. Oftentimes, however, you will need to calculate these values yourself. Data from the US Census, for example, is often delivered as count data by enumeration unit but includes a population field which can be used for standardization.
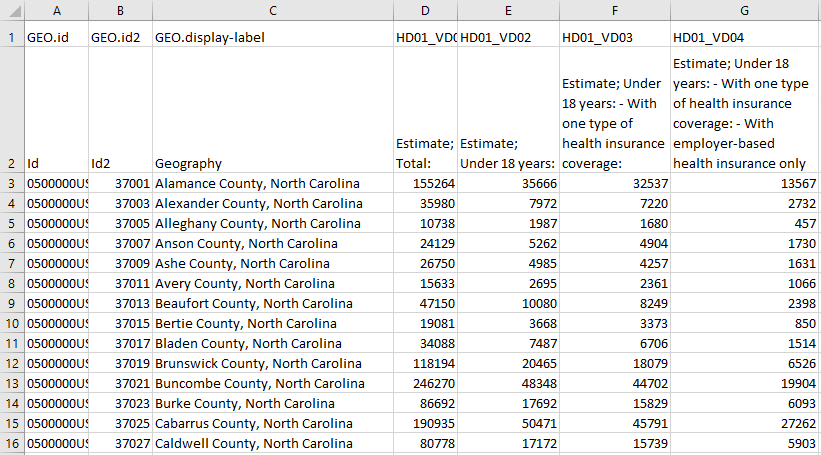
Using the example data in Figure 4.5.1 above, imagine we wanted to map the number of people in each county who are under 18 years old AND have one type of health insurance coverage (Column F). And imagine we created a county-level choropleth map using those Column F values. What would this map tell us? It might tell us a little something about geographic health insurance trends in North Carolina, but mostly it would just show us in which counties more people live.
Remember the importance of map purpose: rather than just making a population map, we want to understand the geography of health insurance coverage for young people. For this, we need to map standardized values. To do so, we can divide the number of under 18-year-olds with one type of health insurance (Column F) by the appropriate universe: the count of items (here, people) that could possibly fall into this category. Since our data value of interest only applies to a specific age group, our universe, in this case, is not all people (Column D), but all people under 18 (Column E).
Some texts and software programs, including ArcGIS, call this process normalization rather than standardization. As suggested by (Slocum et al. 2009) we use the term standardization, as normalization has a more specific meaning in statistics with which we do not want this process to be confused.