Overview
Welcome to Lesson 7! During the course so far, we have discussed many ways in which cartographers symbolize data on maps. We used visual variables to create category and order for basemap and label design, compared proportional symbol, dot, and choropleth maps, and visualized flowlines and terrain. In most cases, our maps have focused on one data variable (e.g., % of people with health insurance), or layered different kinds of data (e.g., race routes layered over terrain). This week, we introduce multivariate mapping—maps that visualize more than one data attribute at once.
Following our discussion of multivariate maps, we introduce a special type of data—uncertainty. When mapping predicted flood zones, for example, we might want the reader to understand not only the predicted flood values across the map, but their associated uncertainty—how certain those values are to reflect reality across different locations. As uncertainty plays a pivotal role in decision-making, we close out our discussion of uncertainty visualization with a short summary of its influence on decision-making with maps. In Lab 7, we explore both multivariate data and uncertainty visualization techniques while creating maps for a new imagined set of decision-makers—a group of policy-makers at the United Nations—using data from the World Happiness Report.
Learning Outcomes
By the end of this lesson, you should be able to:
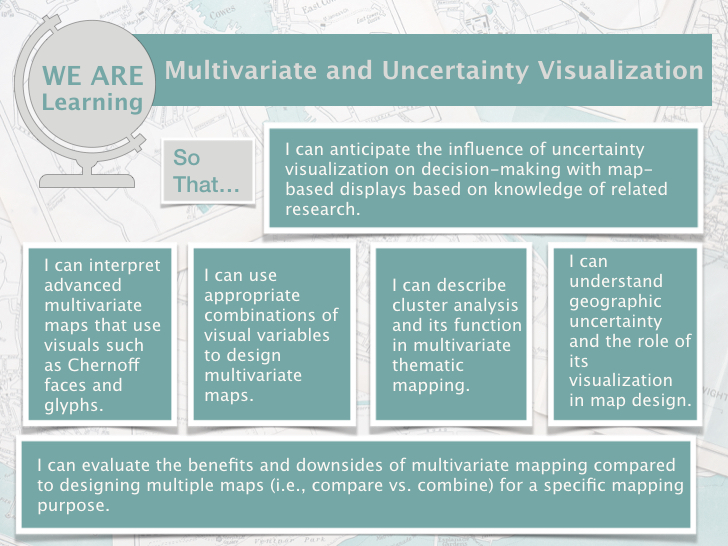
- anticipate the influence of uncertainty visualization on decision-making with map-based displays based on knowledge of related research.
- interpret advanced multivariate maps that use visuals such as Chernoff faces and glyphs.
- use appropriate combinations of visual variables to design multivariate maps.
- describe cluster analysis and its function in multivariate thematic mapping.
- understand geographic uncertainty and the role of its visualization in map design.
- evaluate the benefits and downsides of multivariate mapping compared to designing multiple maps (i.e., compare vs. combine) for a specific mapping purpose.
Lesson Roadmap
|
Action |
Assignment | Directions |
|---|---|---|
| To Read |
In addition to reading all of the required materials here on the course website, before you begin working through this lesson, please read the following required readings:
Additional (recommended) readings are clearly noted throughout the lesson and can be pursued as your time and interest allow. |
The required reading material is available in the Lesson 7 module. |
| To Do |
|
|
Questions?
If you have questions, please feel free to post them to the Lesson 7 Discussion Forum. While you are there, feel free to post your own responses if you, too, are able to help a classmate.