Projection Properties
All map projections distort the landmasses (and waterbodies) on Earth’s surface in some way. Even so, projections can be designed to preserve certain types of relationships between features on maps. These include equivalent projections (which preserve areal relationships), conformal projections (angular relationships), azimuthal projections (directional relationships), and equidistant projections (distance relationships). The projection you choose will depend on the characteristics most important to be preserved, given the purpose of your map.
Equivalent
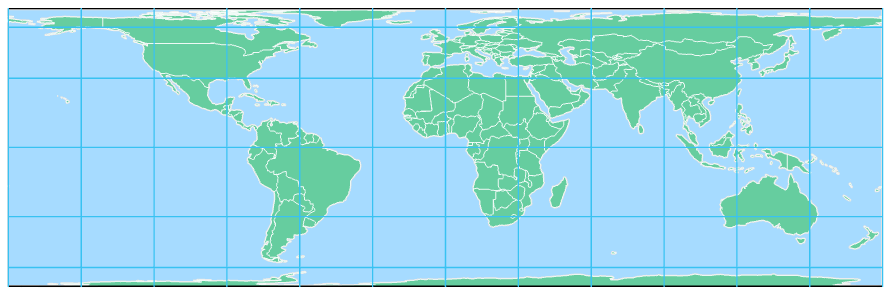
Equivalent projections preserve areal relationships. This means that comparisons between sizes of land-masses (e.g., North America vs. Australia) can be properly made on equal area maps. Unfortunately, when areal relationships are maintained, shapes of landmasses will inevitably be distorted—it is impossible to maintain both.
In Figure 5.5.1 below, shape distortion is most pronounced near the top and bottom of the map. This is because the poles of Earth (North and South) are represented as lines the same length as the equator. Recall that lines of longitude on the globe converge at the poles. When these convergence points are instead mapped as lines, landmasses are stretched East-West, which means that to maintain the same area, landmasses must be compressed in the opposite direction. In the map below, Russia (and other landmasses) are represented at the proper size (compared to other landmasses on the map) but their shapes are significantly distorted.
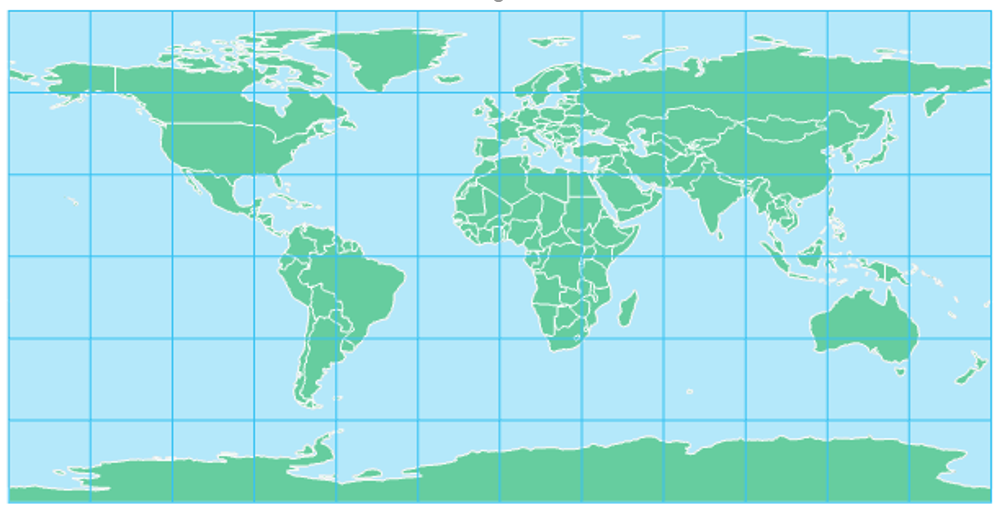
The projection property of equivalence is perhaps best understood by contrasting its properties with a popular projection that greatly distorts area—the Mercator projection (Figure 5.5.2).
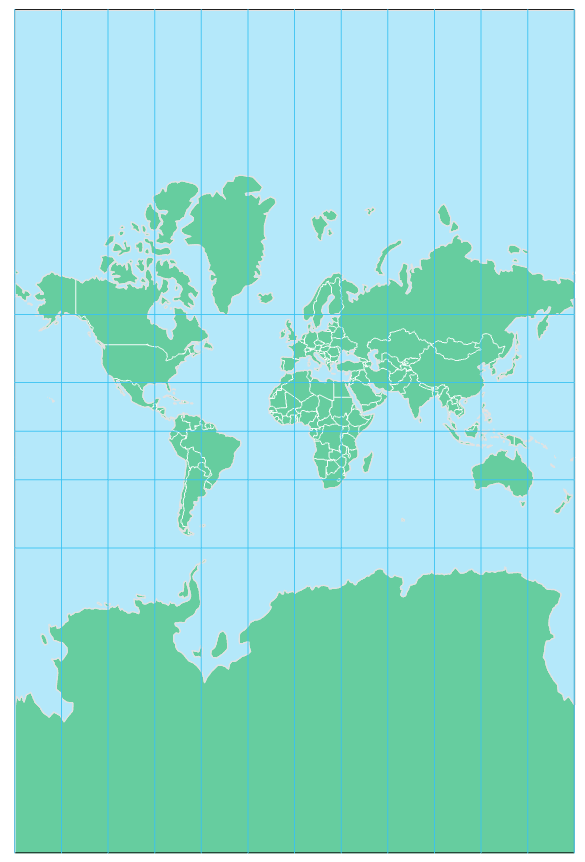
The Mercator projection results in a significant distortion of areas, particularly at locations far from the equator. In order to maintain local angles, parallels (lines of latitude) are placed further and further apart as you depart from the equator. The website thetruesize.com demonstrates this effect.
Despite this, the Mercator is useful for some purposes. It has historically been used for navigation—it is efficient for routing as any straight line drawn on the map represents a route with a constant compass bearing (e.g., due West). This “line of constant compass bearing” is commonly referred to as a rhumb line or loxodrome. The Mercator is a conformal projection.
Conformal
Conformal projections preserve local angles. Though the scale factor (map scale) changes across the map, from any point on the map, the scale factor changes at the same rate in all directions, therefore maintaining angular relationships. If a surveyor were to determine an angle between two locations on Earth’s surface, it would match the angle shown between those same two locations on a conformal projection.
As mentioned previously, the angle-preserving nature of conformal projections makes them useful for navigation. Any path across Earth that follows a constant compass bearing is called a rhumb line, or loxodrome. Any straight line drawn on a map based on a Mercator projection is a rhumb line. Rhumb lines and loxodromes facilitate navigation, as navigators prefer to follow a straight-line route on the map and set their compass direction accordingly.
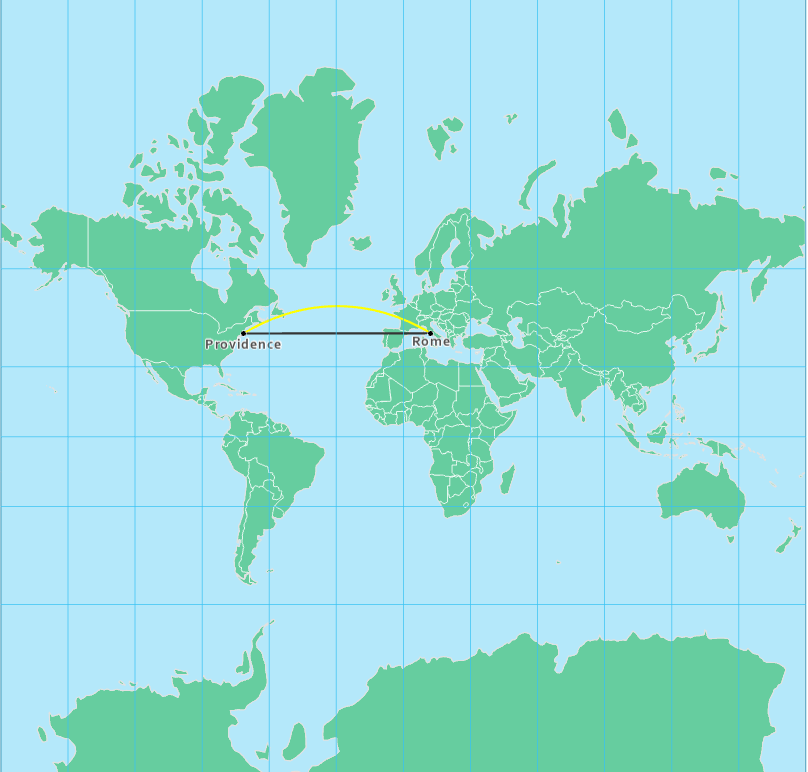
Despite their usefulness for navigation, rhumb lines do not show the shortest distance between two points. The shortest point between two points on Earth is called a great circle route. Unlike rhumb lines, such lines appear curved on a conformal projection (Figure 5.5.4). Of course, the literal shortest path from Providence to Rome is actually a straight line: but you'd have to travel beneath Earth's surface to travel it. When we talk about the shortest distance between two points on Earth, we are talking in a practical sense of traveling across or above Earth's surface.
The gnomonic map projection has the interesting property that any straight line drawn on the projection is a great circle route. The gnomonic projection is an example of an azimuthal projection.
Azimuthal
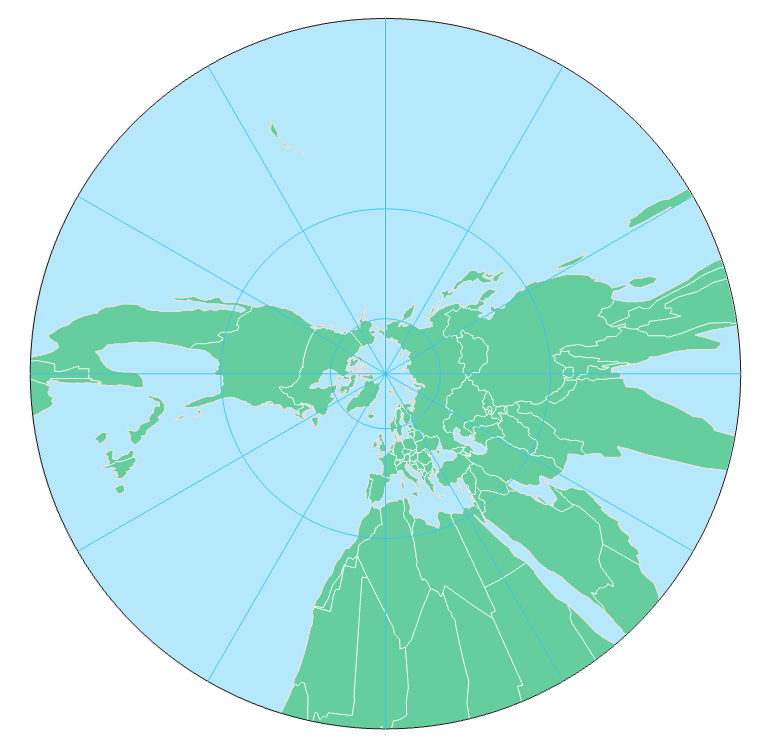
Azimuthal projections are planar projections on which correct directions from the center of the map to any other point location are maintained. The stereographic projection is another example of an azimuthal projection. Though only on the gnomonic projection is every straight line a great circle route, a straight line drawn directly from the map’s center is a great circle on any azimuthal projection.
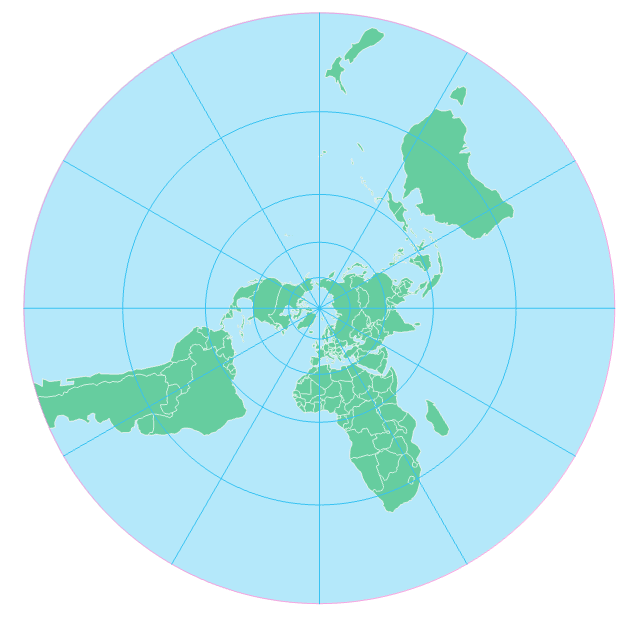
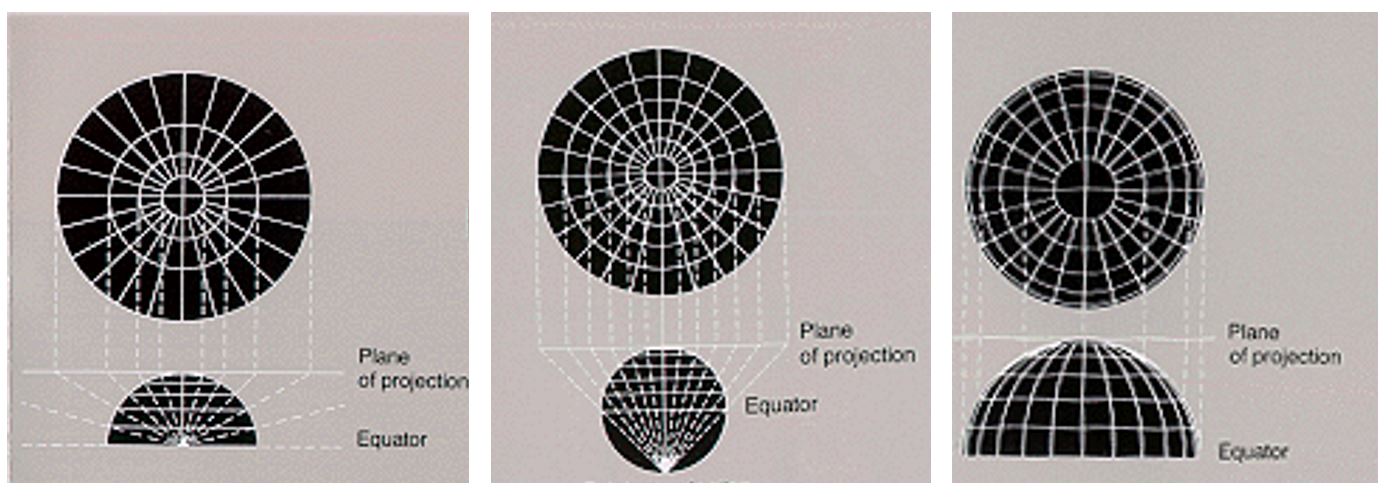
The most common types of azimuthal projections are the gnomonic, stereographic, Lambert azimuthal equal area, and orthographic projections. The primary difference between azimuthal projection types is the location of the point of projection. In Figure 5.5.7 below, a gnomonic projection occurs when the point of projection is Earth’s center. Stereographic maps have a point of projection on the side of Earth opposite the plane’s point of tangency; the point of projection for an orthographic map is at infinity.
Equidistant
Equidistant projections are often useful as they maintain distance relationships. However, they do not maintain distance at all points across the map. Instead, an equidistant projection displays the true distance from one or two points on the map (dependent on the projection) to any other point on the map or along specific lines.
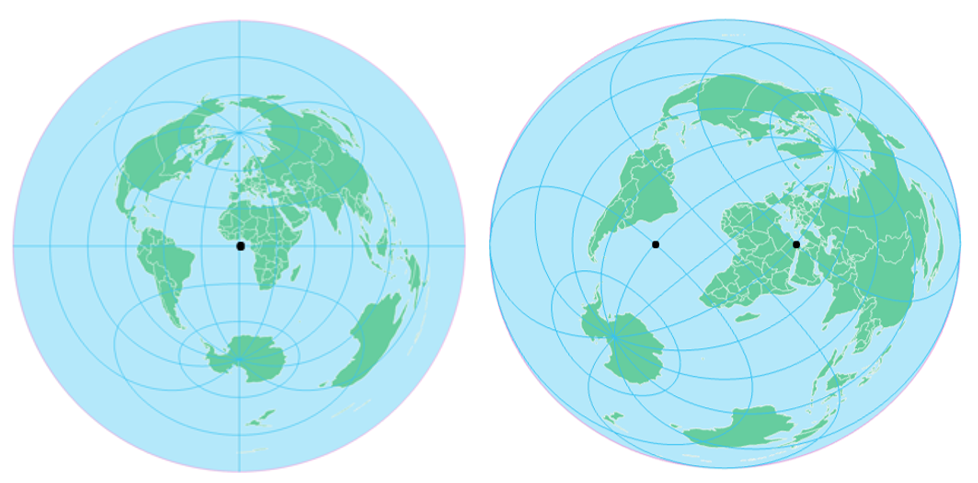
In the azimuthal equidistant projection (Figure 5.5.8, left) distance can be correctly measured from the center of the map (shown by the black dot) to any other point. In two-point Equidistant projection (Figure 5.5.8, right), correct distance can be measured from any two points to any other point on the map (and, thus, to each other). In the example above, those two points are (30⁰S, 30⁰W) and (30⁰N, 30⁰E). These values were supplied as parameters to GIS software while projecting the map—a process called projection customization. When customizing your own projection, you will select locations relevant to your map’s purpose.
Not all equidistant maps are circular in shape. The cylindrical equidistant projection, for example, is equidistant wherein correct distances can be measured along any meridian. When the cylindrical equidistant projection uses the Equator as its standard parallel, the graticule appears to be comprised of grid squares, and it is called the Plate Carrée, a popular map projection due to its simplicity and utility.
Student Reflection
Imagine you are planning a flight path and tasked with finding the shortest route from Alaska to New York. Which map would you use? Why? Would the map you use first to draw the route be different than the map you would use while traveling?
So far, we have discussed maps that preserve areal (equivalent), angular (conformal), distance (equidistant), and directional (azimuthal) relationships. As demonstrated by the previous examples, maps that preserve certain properties do so at the expense of others. It is impossible to preserve angular relationships, for example, without significantly distorting feature areas. For this reason, another class of projections exists—compromise projections.
Compromise
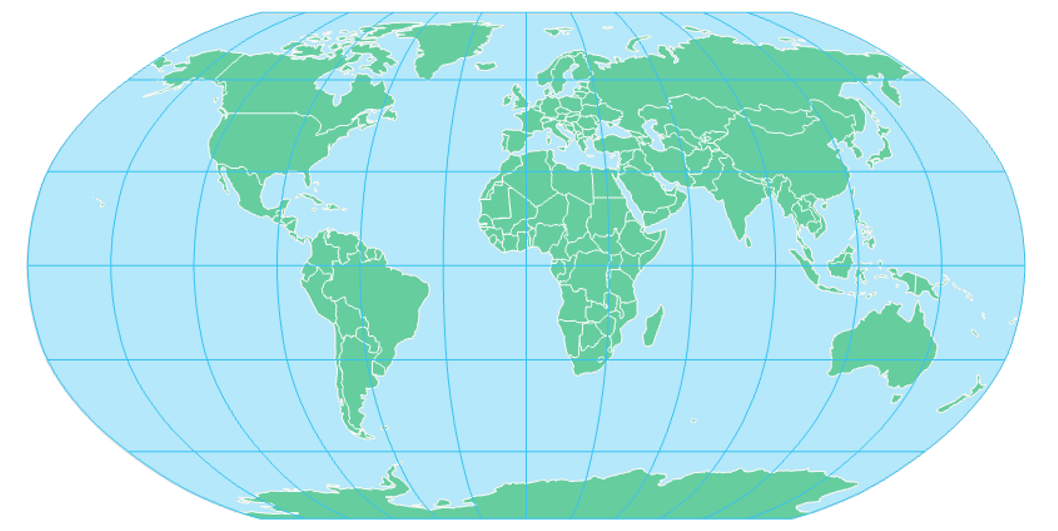
Compromise projections do not entirely preserve any property but instead provide a balance of distortion between the various properties. A popular example is the Robinson Projection, shown in Figure 5.5.10 below. Note on this projection how the landmasses appear more similar in shape and size to what is seen on a globe compared to their appearance on a projection that preserves a specific property entirely (e.g., The Mercator).
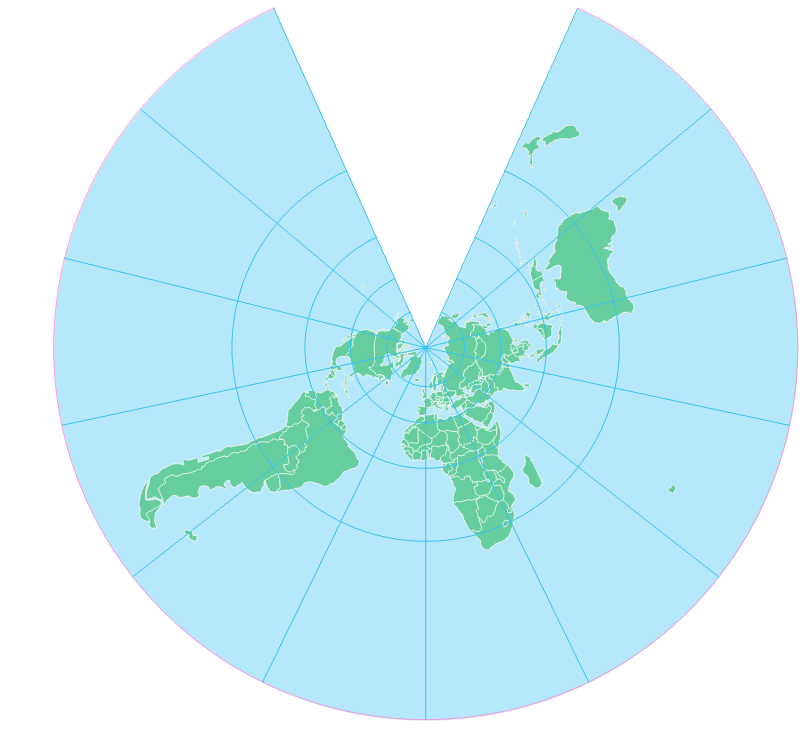
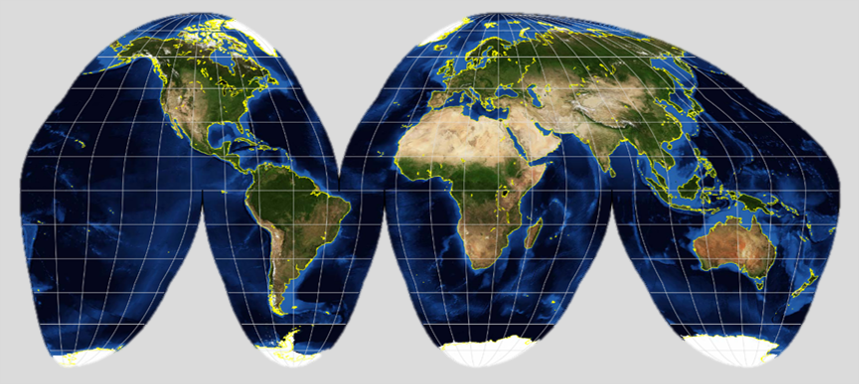
Interruption is not a projection property, but interrupted projections can also be useful in some mapping contexts. Interrupted maps, such as the Goode homolosine interrupted projection (Figure 5.5.11), are reminiscent of an “orange-peel” pressed against a flat surface, a common metaphor for map projections.
The interrupted nature of this projection severely distorts (by dividing) water bodies, and so would not be useful for maps related to oceanic data, or those intending to visualize routes across Earth’s (connected) surface. These distortions, however, allow the map to display a more accurate representation of landmasses’ sizes and shapes. Note that while the divisions on the projection shown in Figure 5.5.11 are over water, divisions over land are also possible, though not as popular.
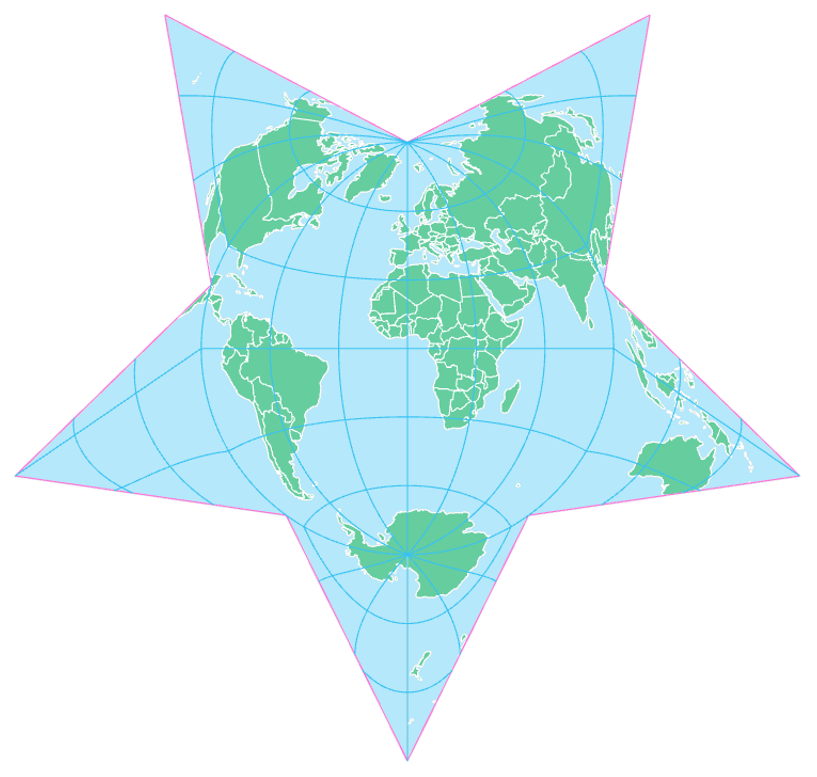
Many projections are available in ArcGIS and other software, some of which are imaginative and fun (e.g., the Berghaus star; Figure 5.5.12) and all of which can be customized to suit a map’s location and purpose. We will talk more about how to select an appropriate map projection in the next section.
Recommended Reading
- Battersby, Sarah E., and Fritz C. Kessler. 2012. “Cues for Interpreting Distortion in Map Projections.” Journal of Geography 111 (3): 93–101. doi:10.1080/00221341.2011.609895.
- Judy M. Olson (2006) Map Projections and the Visual Detective: How to Tell if a Map is Equal-Area, Conformal, or Neither, Journal of Geography, 105:1, 13-32, DOI: 10.1080/00221340608978655 Axis Maps. 2018.
- “Map Projections.” Cartography Guide. Accessed October 30, 2018.