Overview
Welcome to Lesson 9! Last week, we discussed some of the new technologies that have been influential on current trends in cartography, including interactive and animated maps, 3D visualization, and augmented reality. While interactive and dynamic maps present a myriad of opportunities for creating new and exciting designs, they also introduce many new challenges. Studies of interactive maps draw from research not only in cartography and psychology but in other cognate fields such as human computer interaction (HCI), human factors, and usability engineering. We will discuss various approaches for studying dynamic maps in this lesson.
Unlike the static maps that we have focused on for most of this course, maps we discuss here are dynamic—they change based on interactions (either active or passive) by the map reader. In such cases, we begin to consider the map reader instead as a map user. Additionally, as these maps typically appear alongside other media (e.g., supplemental charts, article text, videos), we consider these map-adjacent elements and how they influence the user experience. In Lab 9, we put this knowledge to use and design an interactive data visualization story with the visual analytics platform Tableau.
Learning Outcomes
By the end of this lesson, you should be able to:
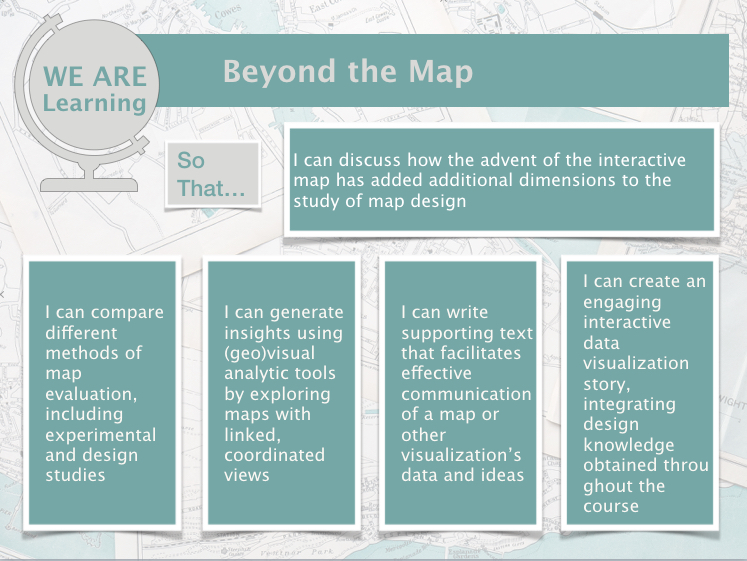
- discuss how the advent of the interactive map has added additional dimensions to the study of map design;
- compare different methods of map evaluation, including experimental and design studies;
- generate insights using (geo)visual analytic tools by exploring maps with linked, coordinated views;
- write supporting text that facilitates effective communication of a map or other visualization’s data and ideas;
- create an engaging interactive data visualization story, integrating design knowledge obtained throughout the course.
Lesson Roadmap
|
Action |
Assignment | Directions |
|---|---|---|
| To Read |
There are no external required readings for Lesson 9. Instead, you should explore in-depth the links included in this week's lesson content. In particular, please explore the three links to graphic compilations (NYT; Washington Post; Nat Geo) and the Tableau Stories about AirBnb in Portland in the Data Journalism section. Additional (recommended) readings are clearly noted throughout the lesson and can be pursued as your time and interest allow. |
|
| To Do |
|
|
Questions?
If you have questions, please feel free to post them to Lesson 9 Discussion Forum. While you are there, feel free to post your own responses if you, too, are able to help a classmate.