Lesson 8 Lab Visual Guide
Lesson 8 Lab Visual Guide Index
- Introduction to Mapbox
- Creating a New Style
- Add Additional Layers
- Add a Label Layer
- Publish and Add Creative Styling
- Styling with Conditions
- Labeling Roads and More
- Adding and Styling Terrain
- Additional Tips and Video Tutorial Links
Lesson 8 Lab Visual Guide
-
Introduction to Mapbox
Unlike our other labs, we will not be using ArcGIS Pro for this lab, so there is no starting file! Instead, we will design an interactive basemap with Mapbox Studio.
Mapbox is an interactive web map design platform; there are many examples on their site of the possibilities designing with Mapbox provides. Check out the Mapbox Gallery!
As you likely notice in the gallery link above, some of the most visually appealing Mapbox maps are not what we would consider traditional basemaps. They take significant creative license with their color and pattern design, while still incorporating proper cartographic generalization and providing legible map symbols. Our goal is to do the same in Lab 8 - you will be creating a new interactive basemap inspired by a favorite piece of art/media/design - have fun with it!
The first step in this lab is to create a Mapbox Studio account. Use your university email account, which will enable all necessary features for free. Once you're logged in, you should see the starting dashboard (Figure 8.0). Once the start-up screen is visible, you will click in the "Start by desinging a map >" area.
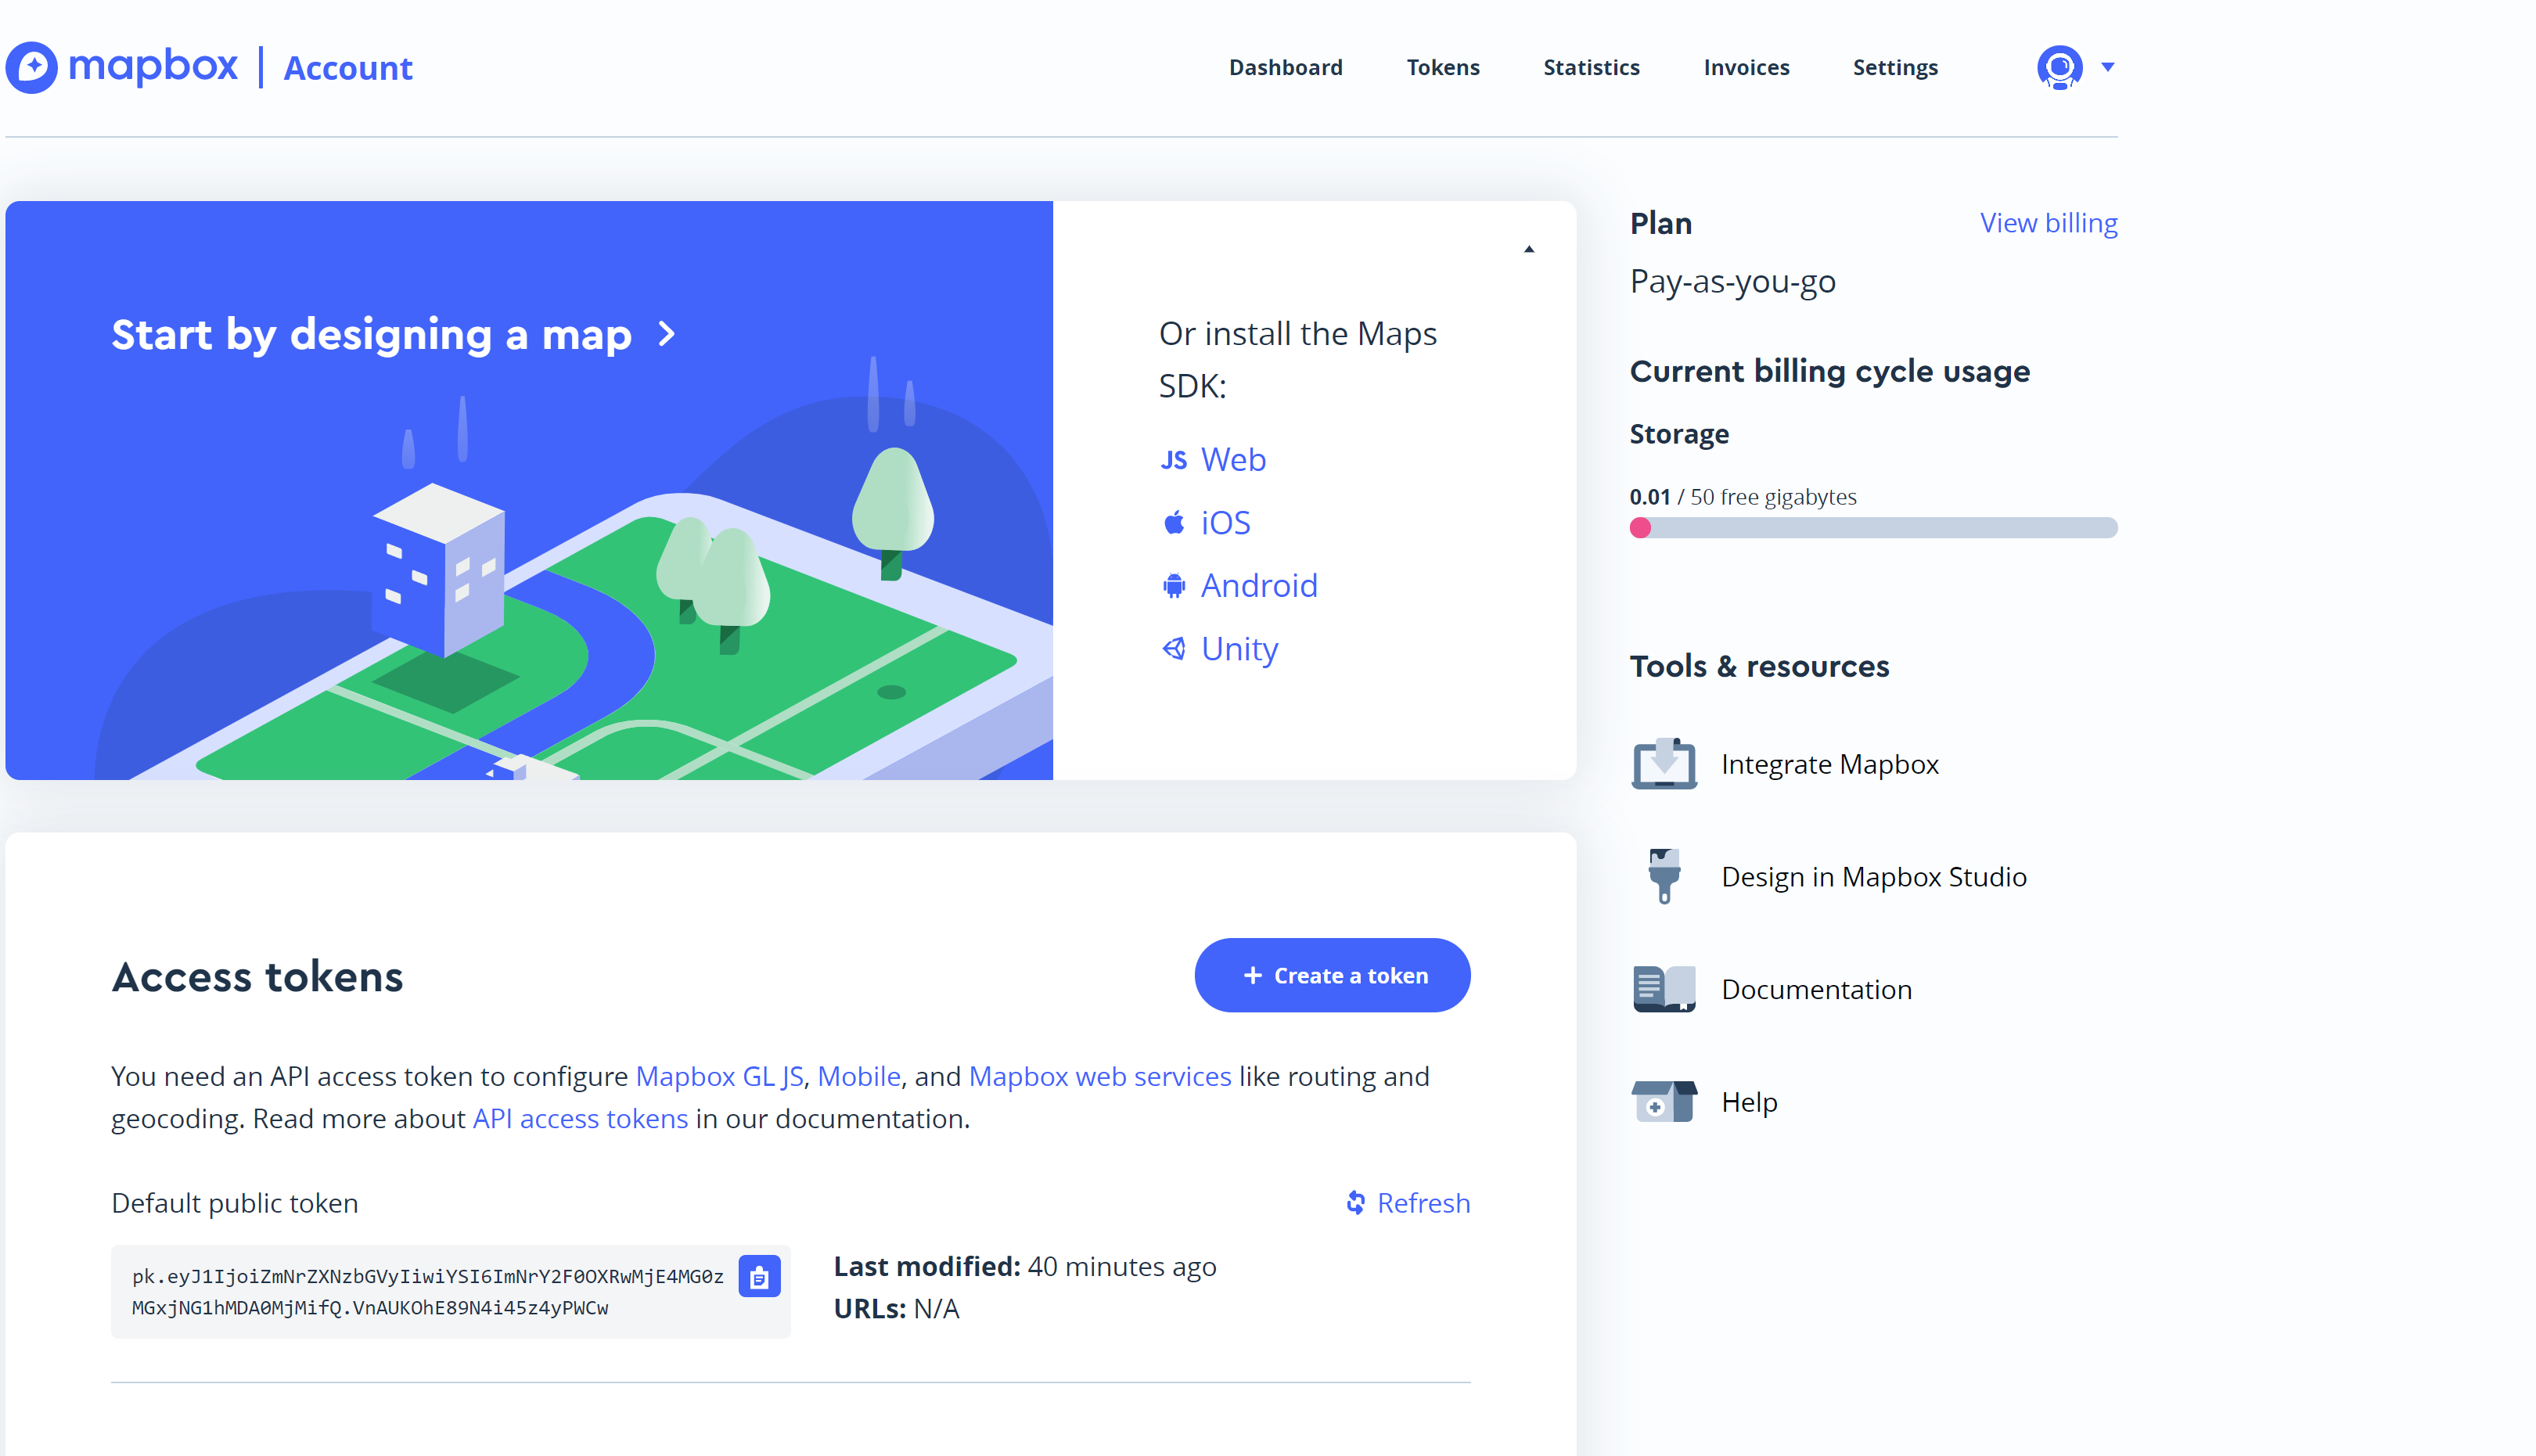 Visual Guide Figure 8.0. Starting dashboard - Mapbox Studio.
 -
Creating a New Style
In the next window to appear (Figure 8.1), select the New style button to create a blank template that you will use to build your own map.
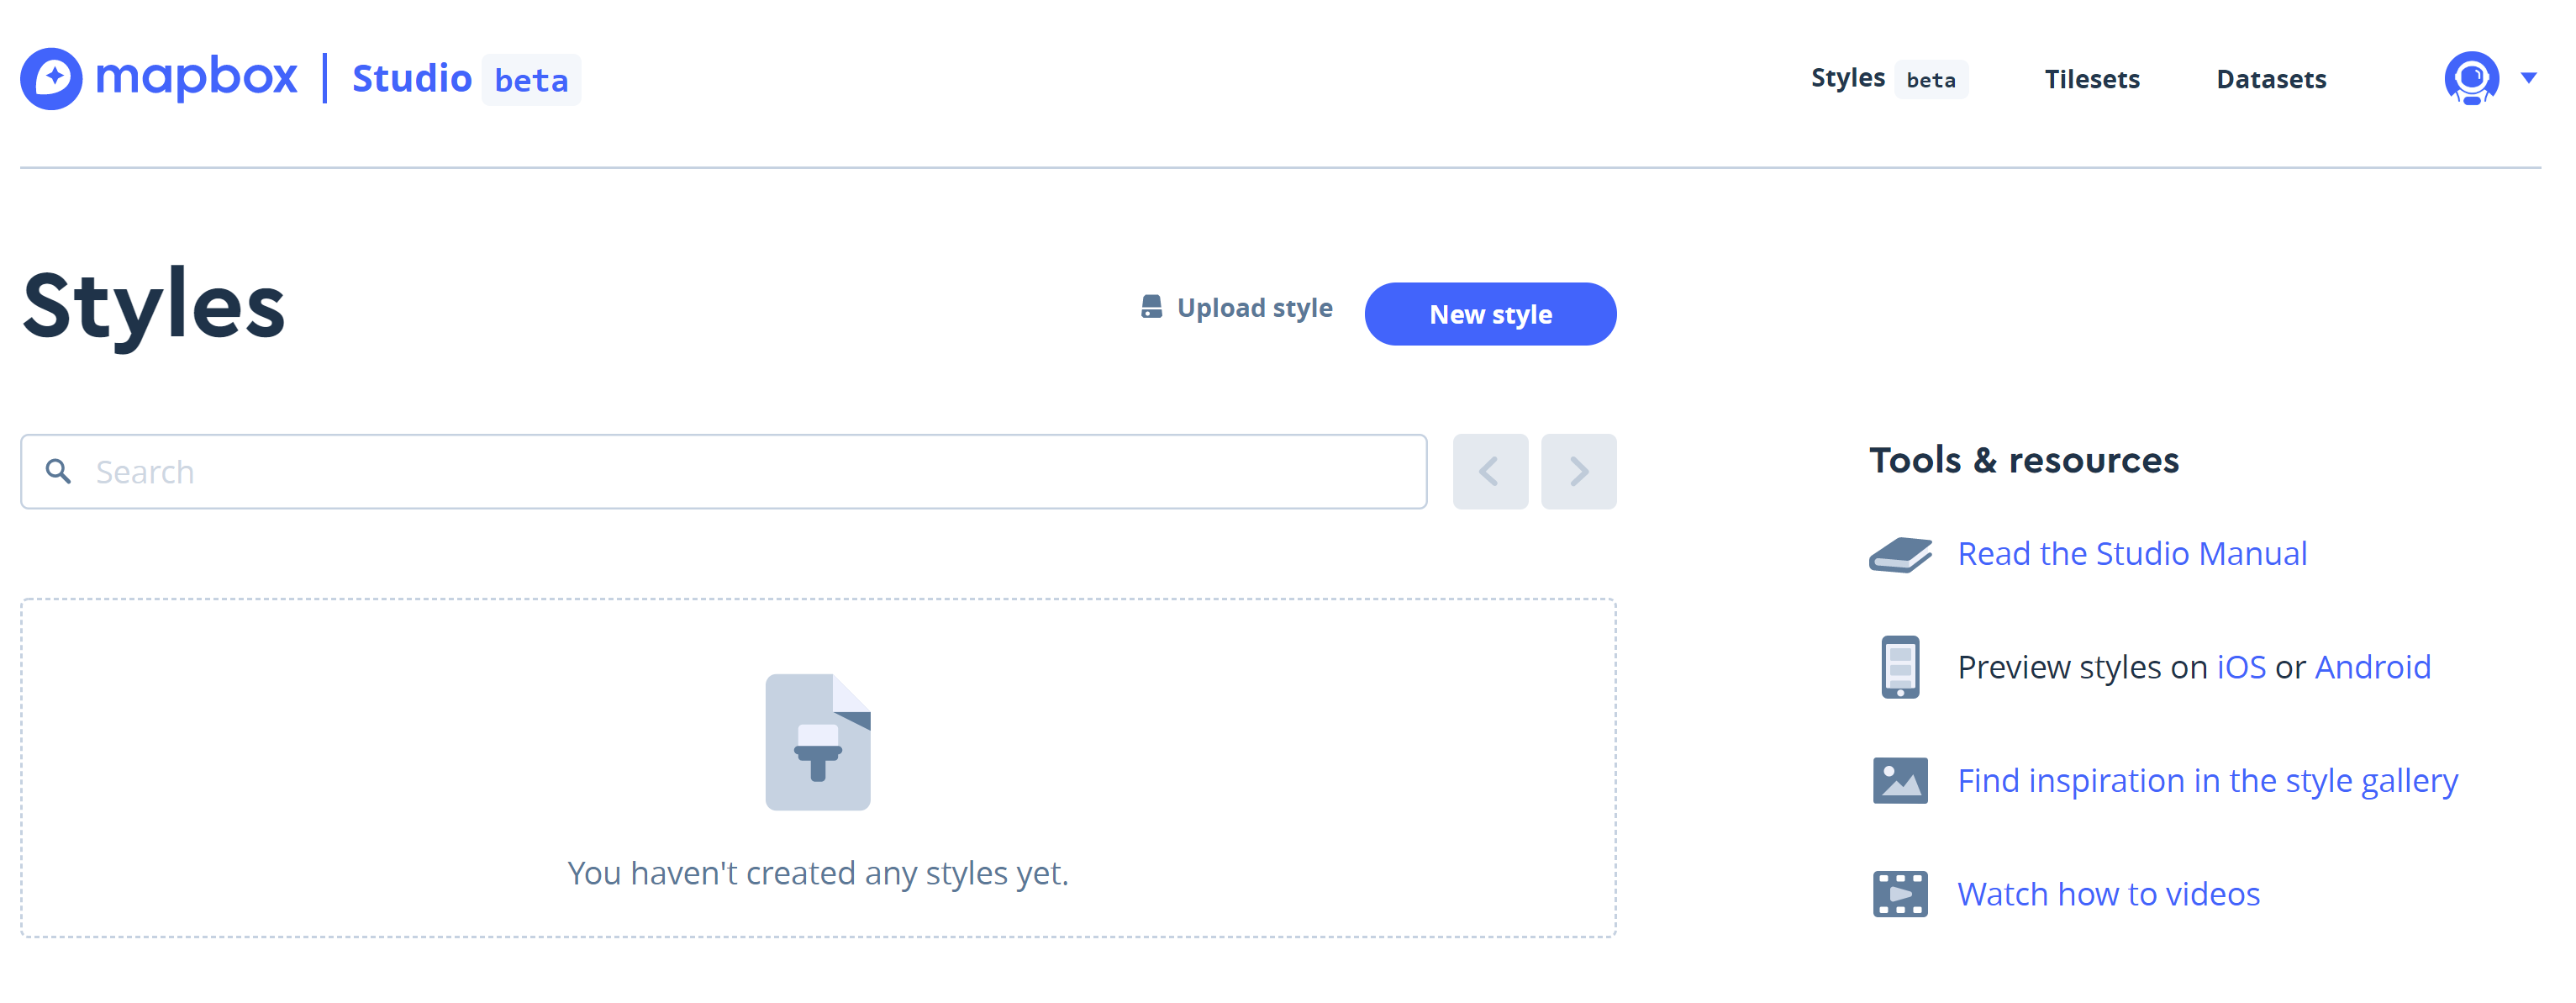 Visual Guide Figure 8.1. Starting a New Style in Mapbox.
 -
Creating a Blank Template
With Mapbox, you work with styles. These are templates that get you started with your design. Note, that styles are easily changed. Having selected New style on the previous window (Figure 8.1), you will now use an empty template from which to build your own map. A new window appears (Figure 8.2) listing several defualt style templates. Don't start with any of the pre-made templates that are listed. Instaed, scroll down the list of available styles and choose the Blank style. Then, select the Customize Blank button.
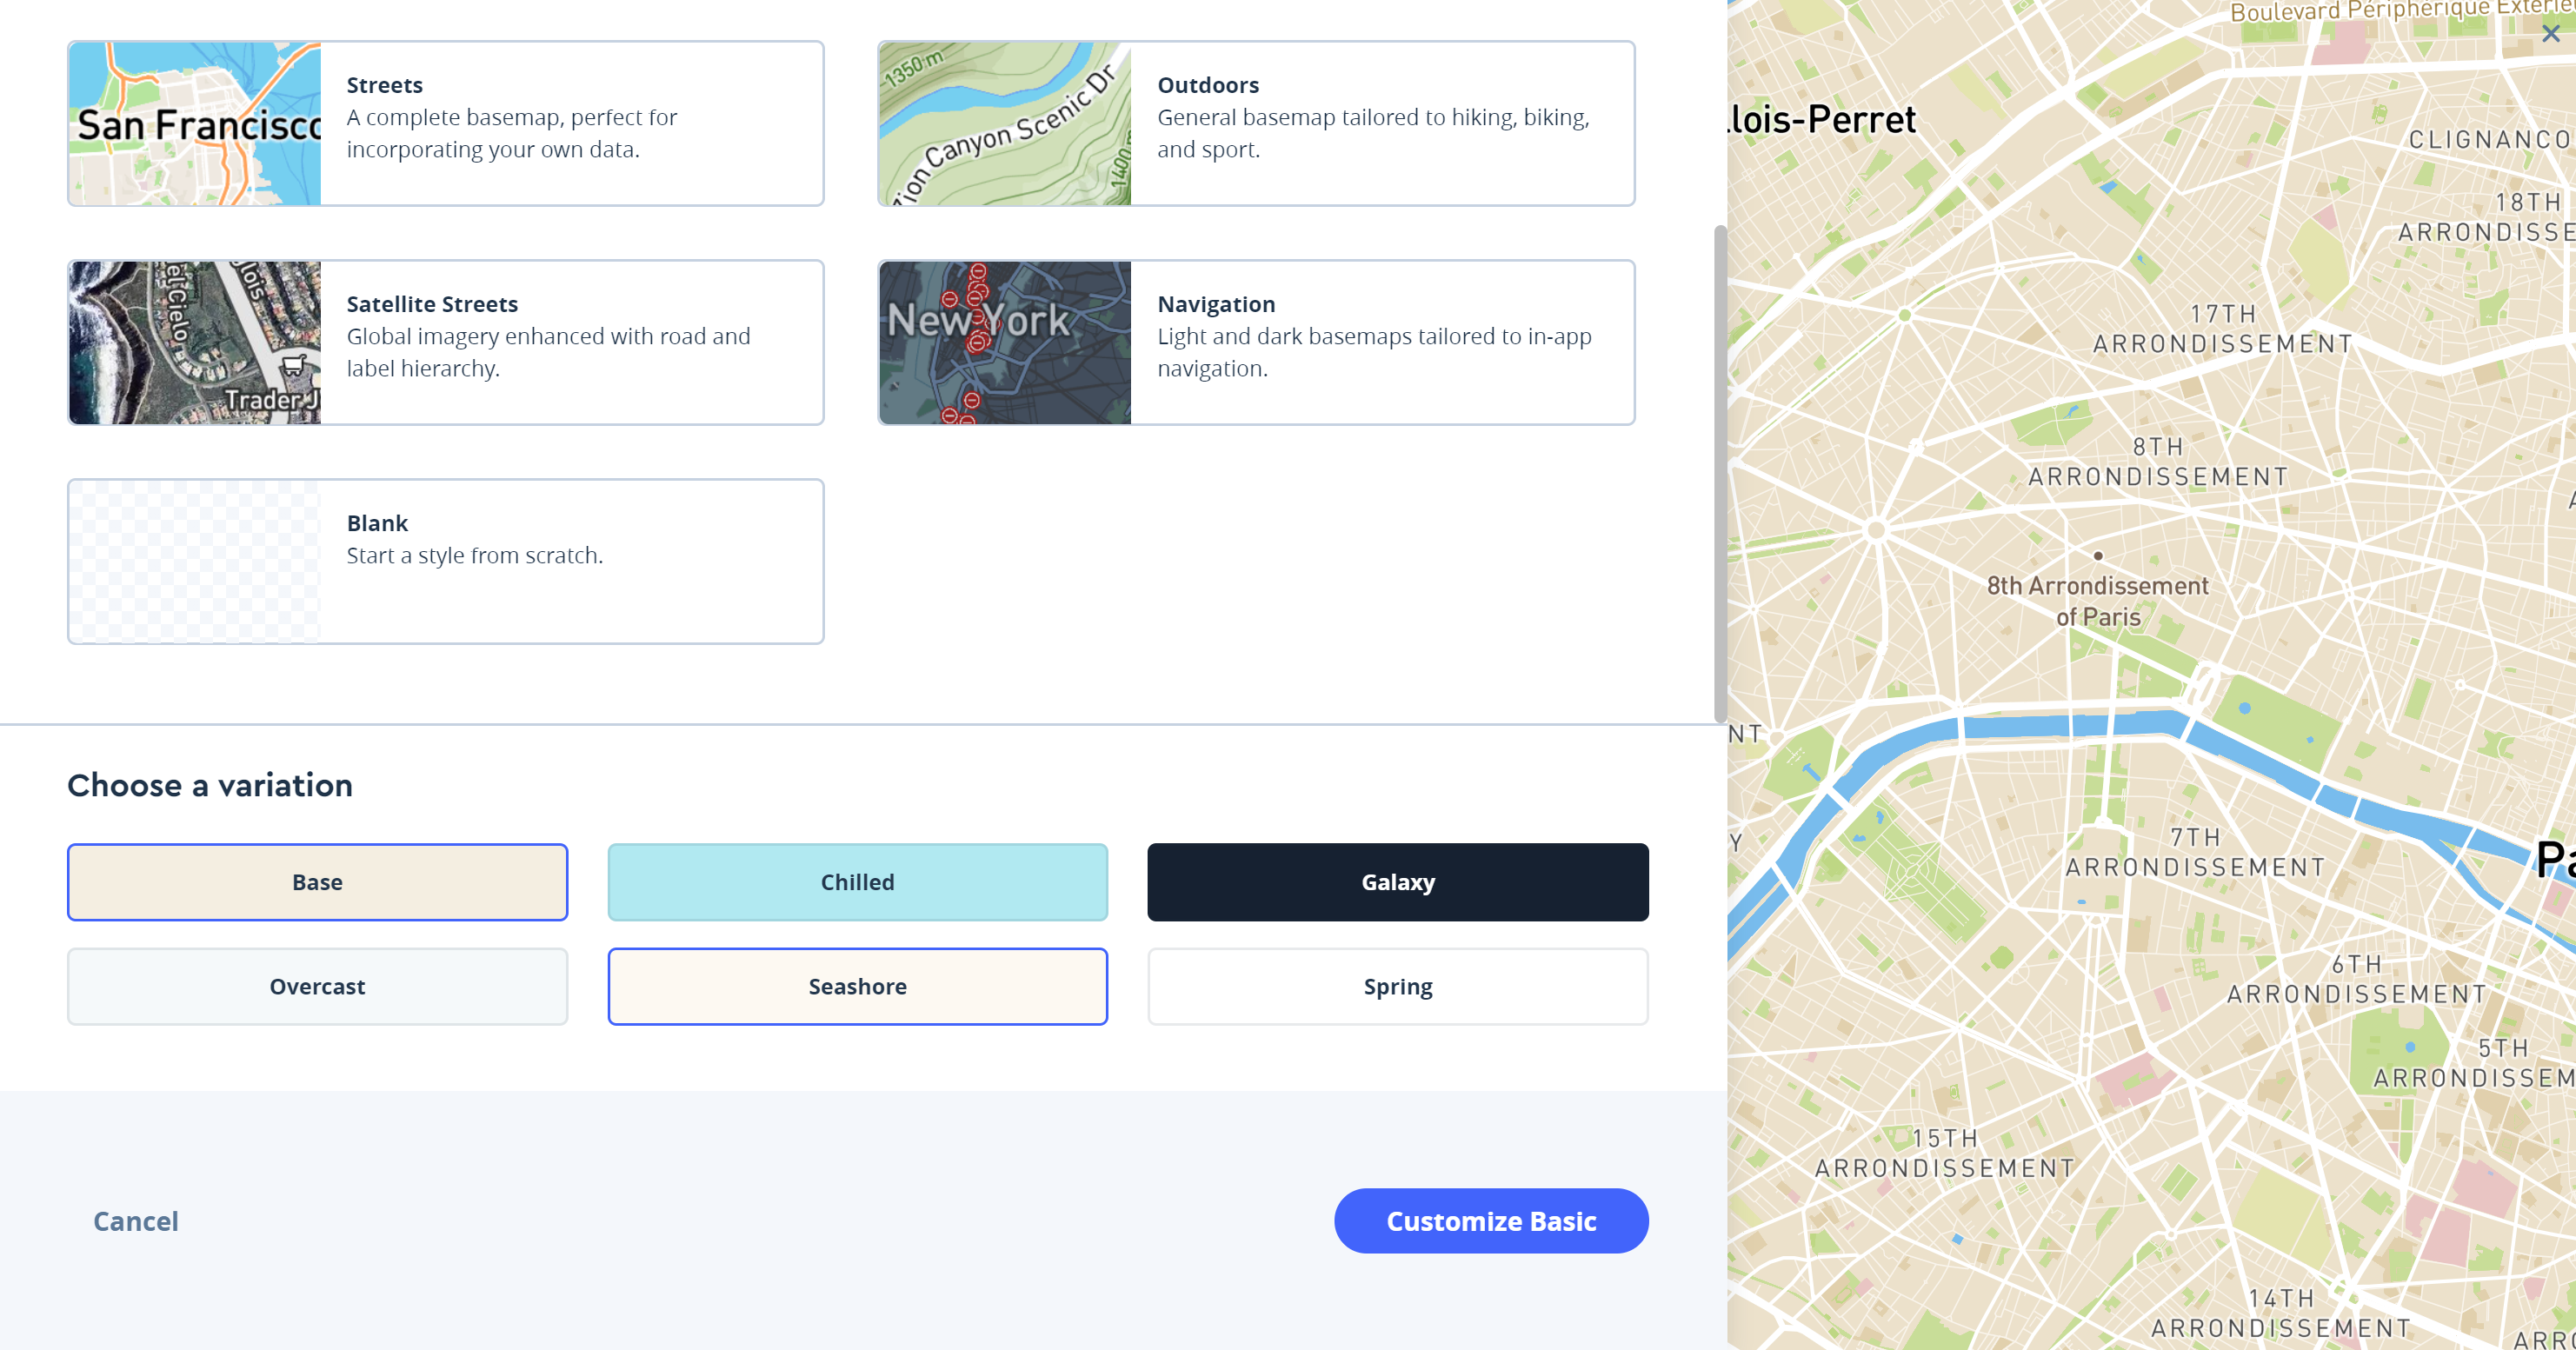 Visual Guide Figure 8.2. Starting a blank template in Mapbox.
After selecting the Cutsomize Blank map template option, the studio editor will load: you should see a empty space to fill. We will be adding and styling layers one-by-one to create our basemap starting with the background layer (Figure 8.3). Before continuing, note that the process we will use to build a map in Mapbox is different from when we designed basemaps in ArcGIS Pro, keep in mind that many of the same principles apply (e.g., arranging the order of layers to match the visual order of the layers the reader sees).
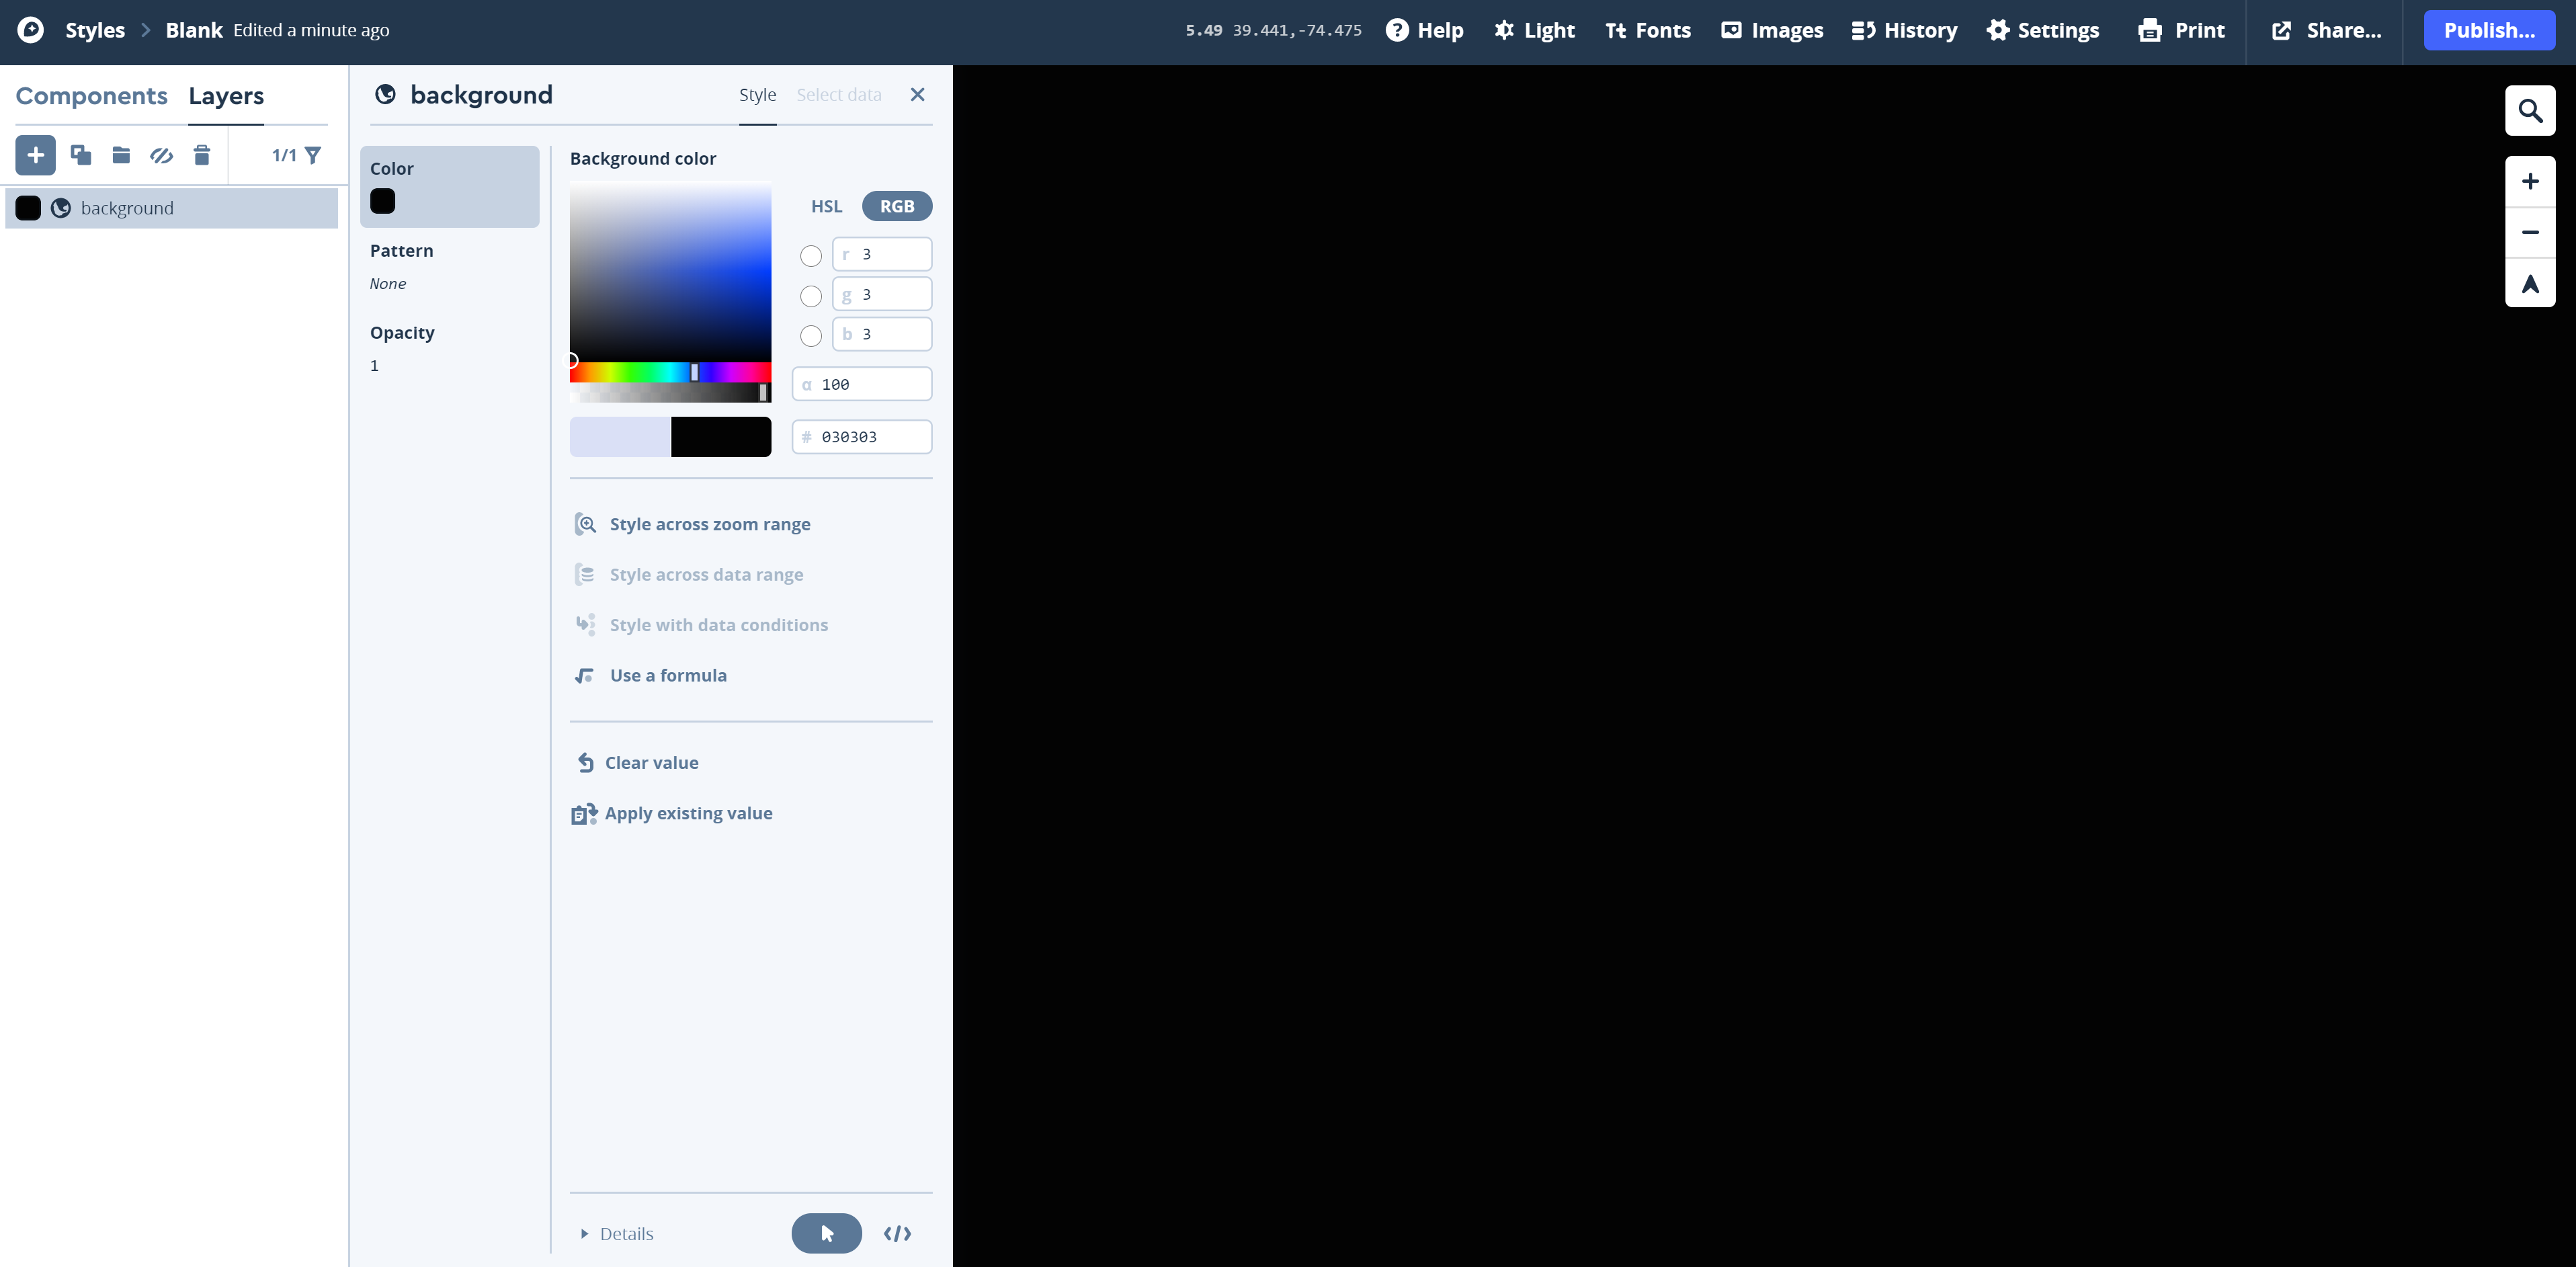 Visual Guide Figure 8.3. The Blank starting map in Mapbox Studio.
Start by designing the background for your map. You can alter your background's color, opacity, etc. To turn on the background layer for you to edit, select...
- Layers
- the "+" icon
- Convert to background layer option unser Source.
Figure 8.3 shows the default background layer style as a black background. You can and should change this default setting to something that is inline with your own design inspriation. For example, in Figure 8.4, I've selected a cyan or sea-green hue (click somewhere inside the color palette to set the color) as my background color. To change the background color, click on the square color chip next to the background layer. Note that you can also change the name of the background layer to something else by clicking on the word "background" at the top-left corner of the background window. Once you are finished with editing the background colot, exit out of the editing session by clicking on the "X" next to the Style and Select text in the upper-right corner of the background window. As the goal of this lab is to draw inspiration from a piece of art/media for your design, you will probably come back to alter the background layer more than once. I strongly encourage you to experiment with the many style options available first, and then go back later to make changes to your design at a later time.
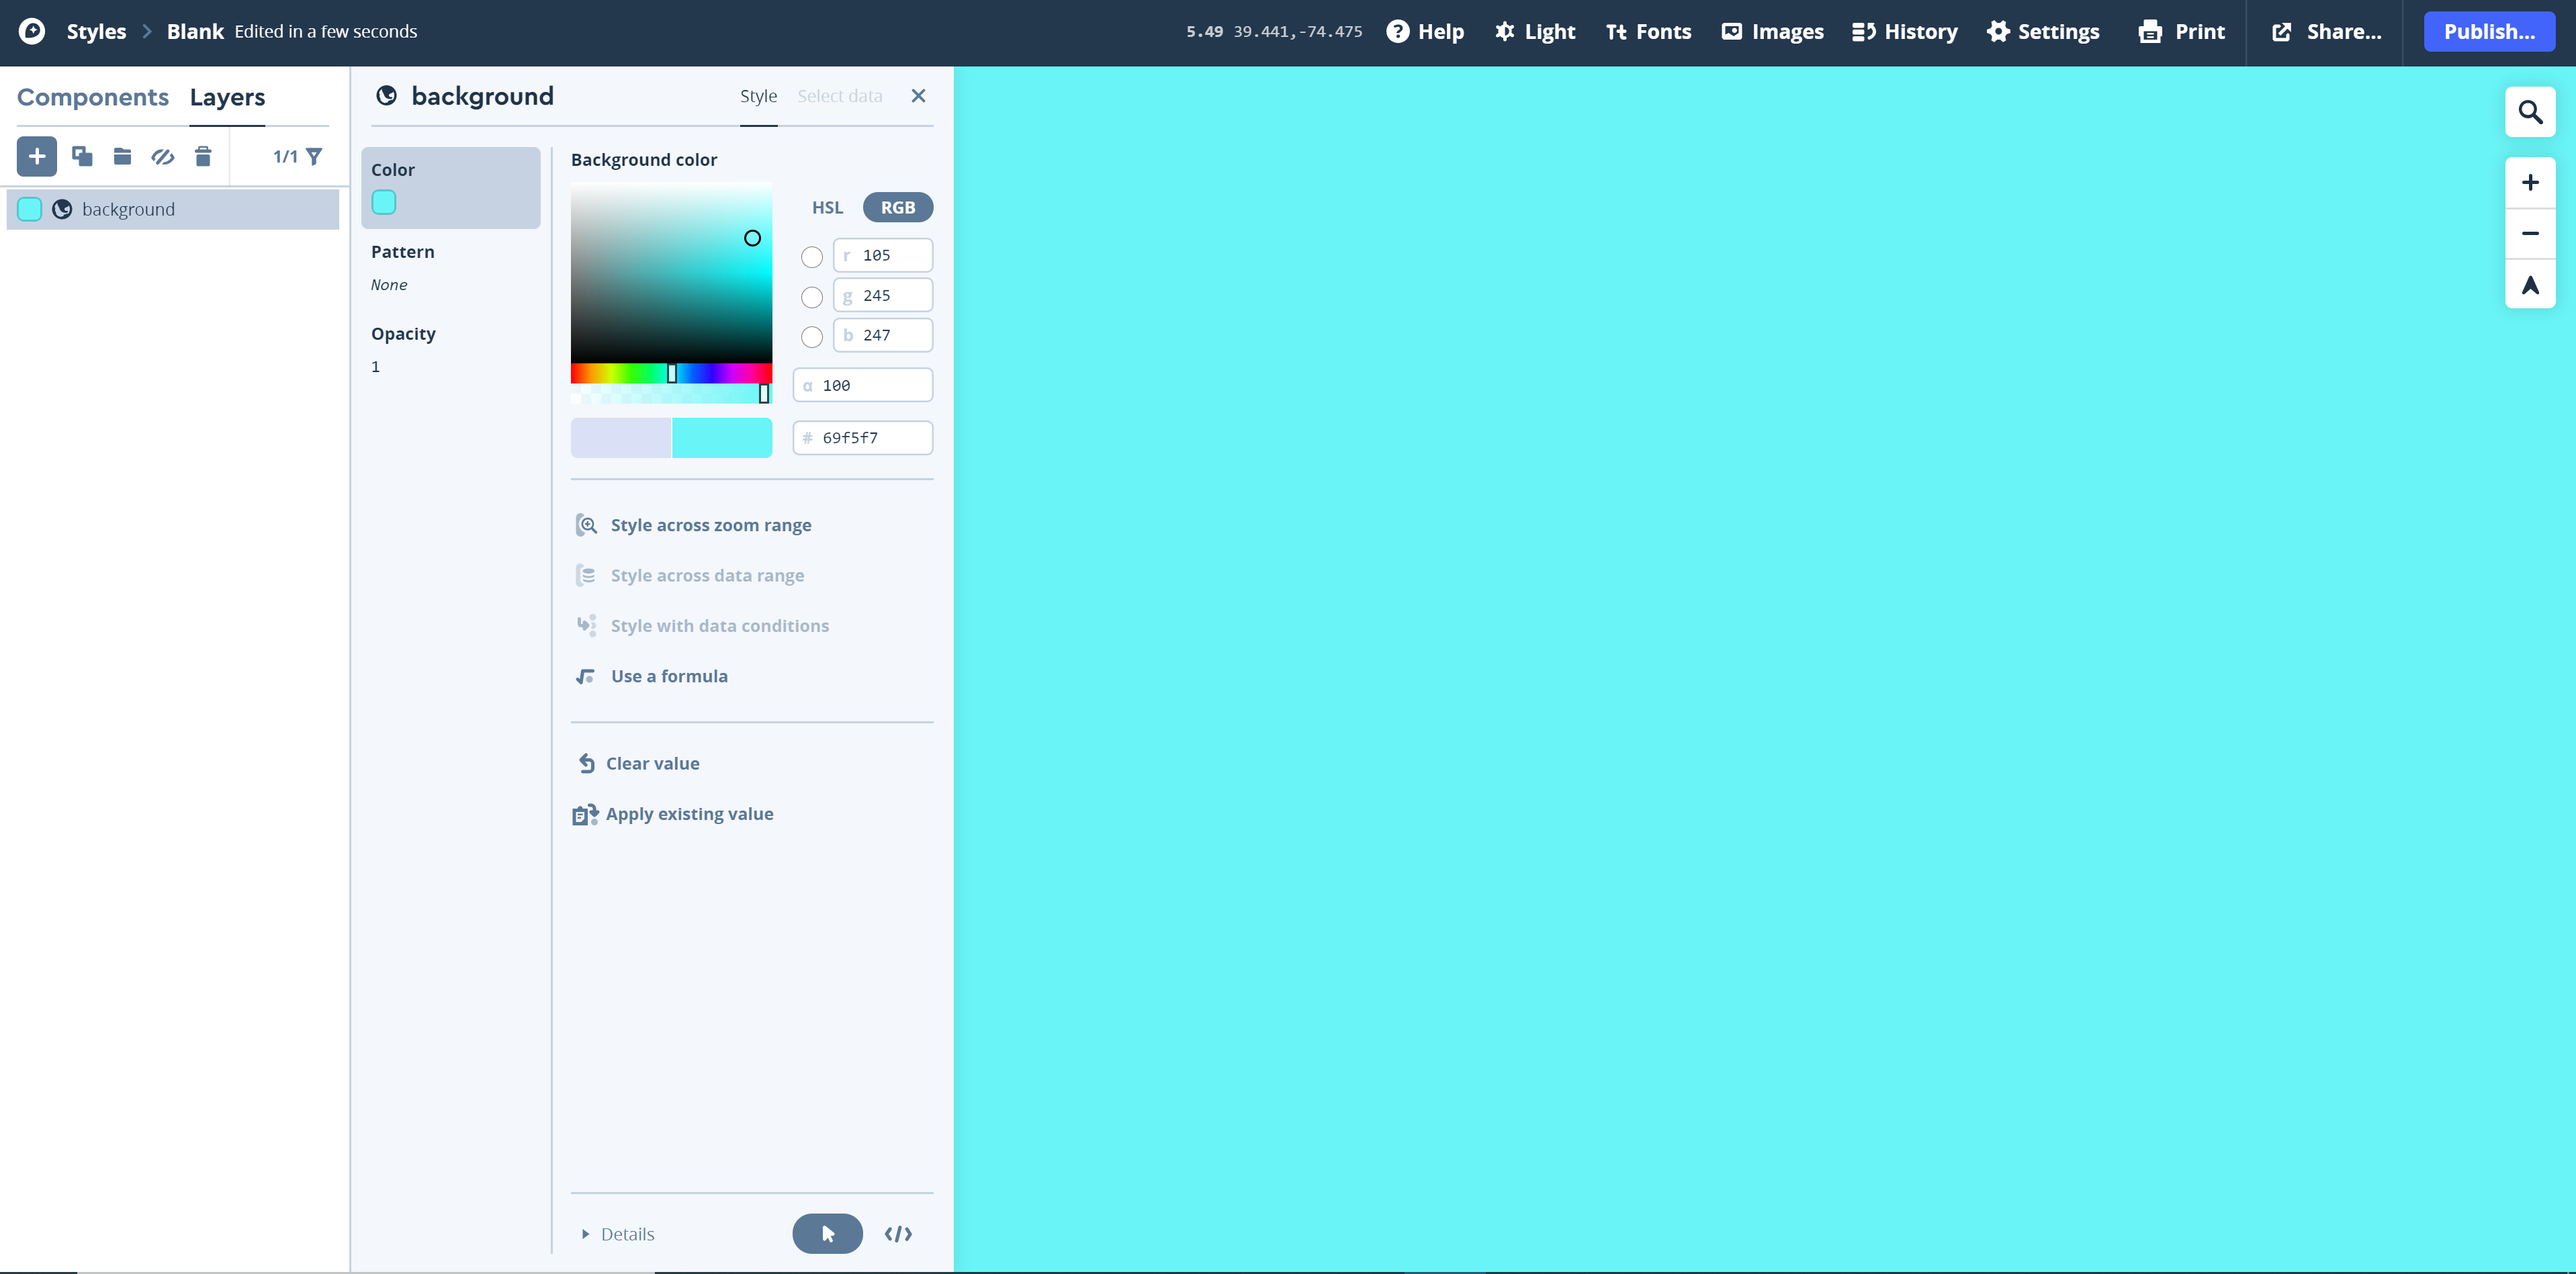
Visual Guide Figure 8.4. Editing the map background layer. -
A Styling Example
Mapbox allows you to add or change a style according to, for example, different zoom levels. In Figure 8.4b, I have set up a simple example where the background color changes according to the zoom range. Recall that a zoom range for basemaps runs from 0 (world view) to 22 (completely zoomed in view). Notice that there are three "stops" that exist. Zoom 0 is assigned a white bcakground fill. At zoom level 10, a cyan fill is assigned to the background, and at zoom 22, a magenta completes the zoom range color assignments. As the user zooms across the different ranges, the color changes in a linear fashion (as set by the Rate of change option). You can add additional zoom stops by selecting the "Add another stop" option, using the slider to set the zoom level where the change will take place, selecting a new color for the layer, and then selecting the Done button to set the action.
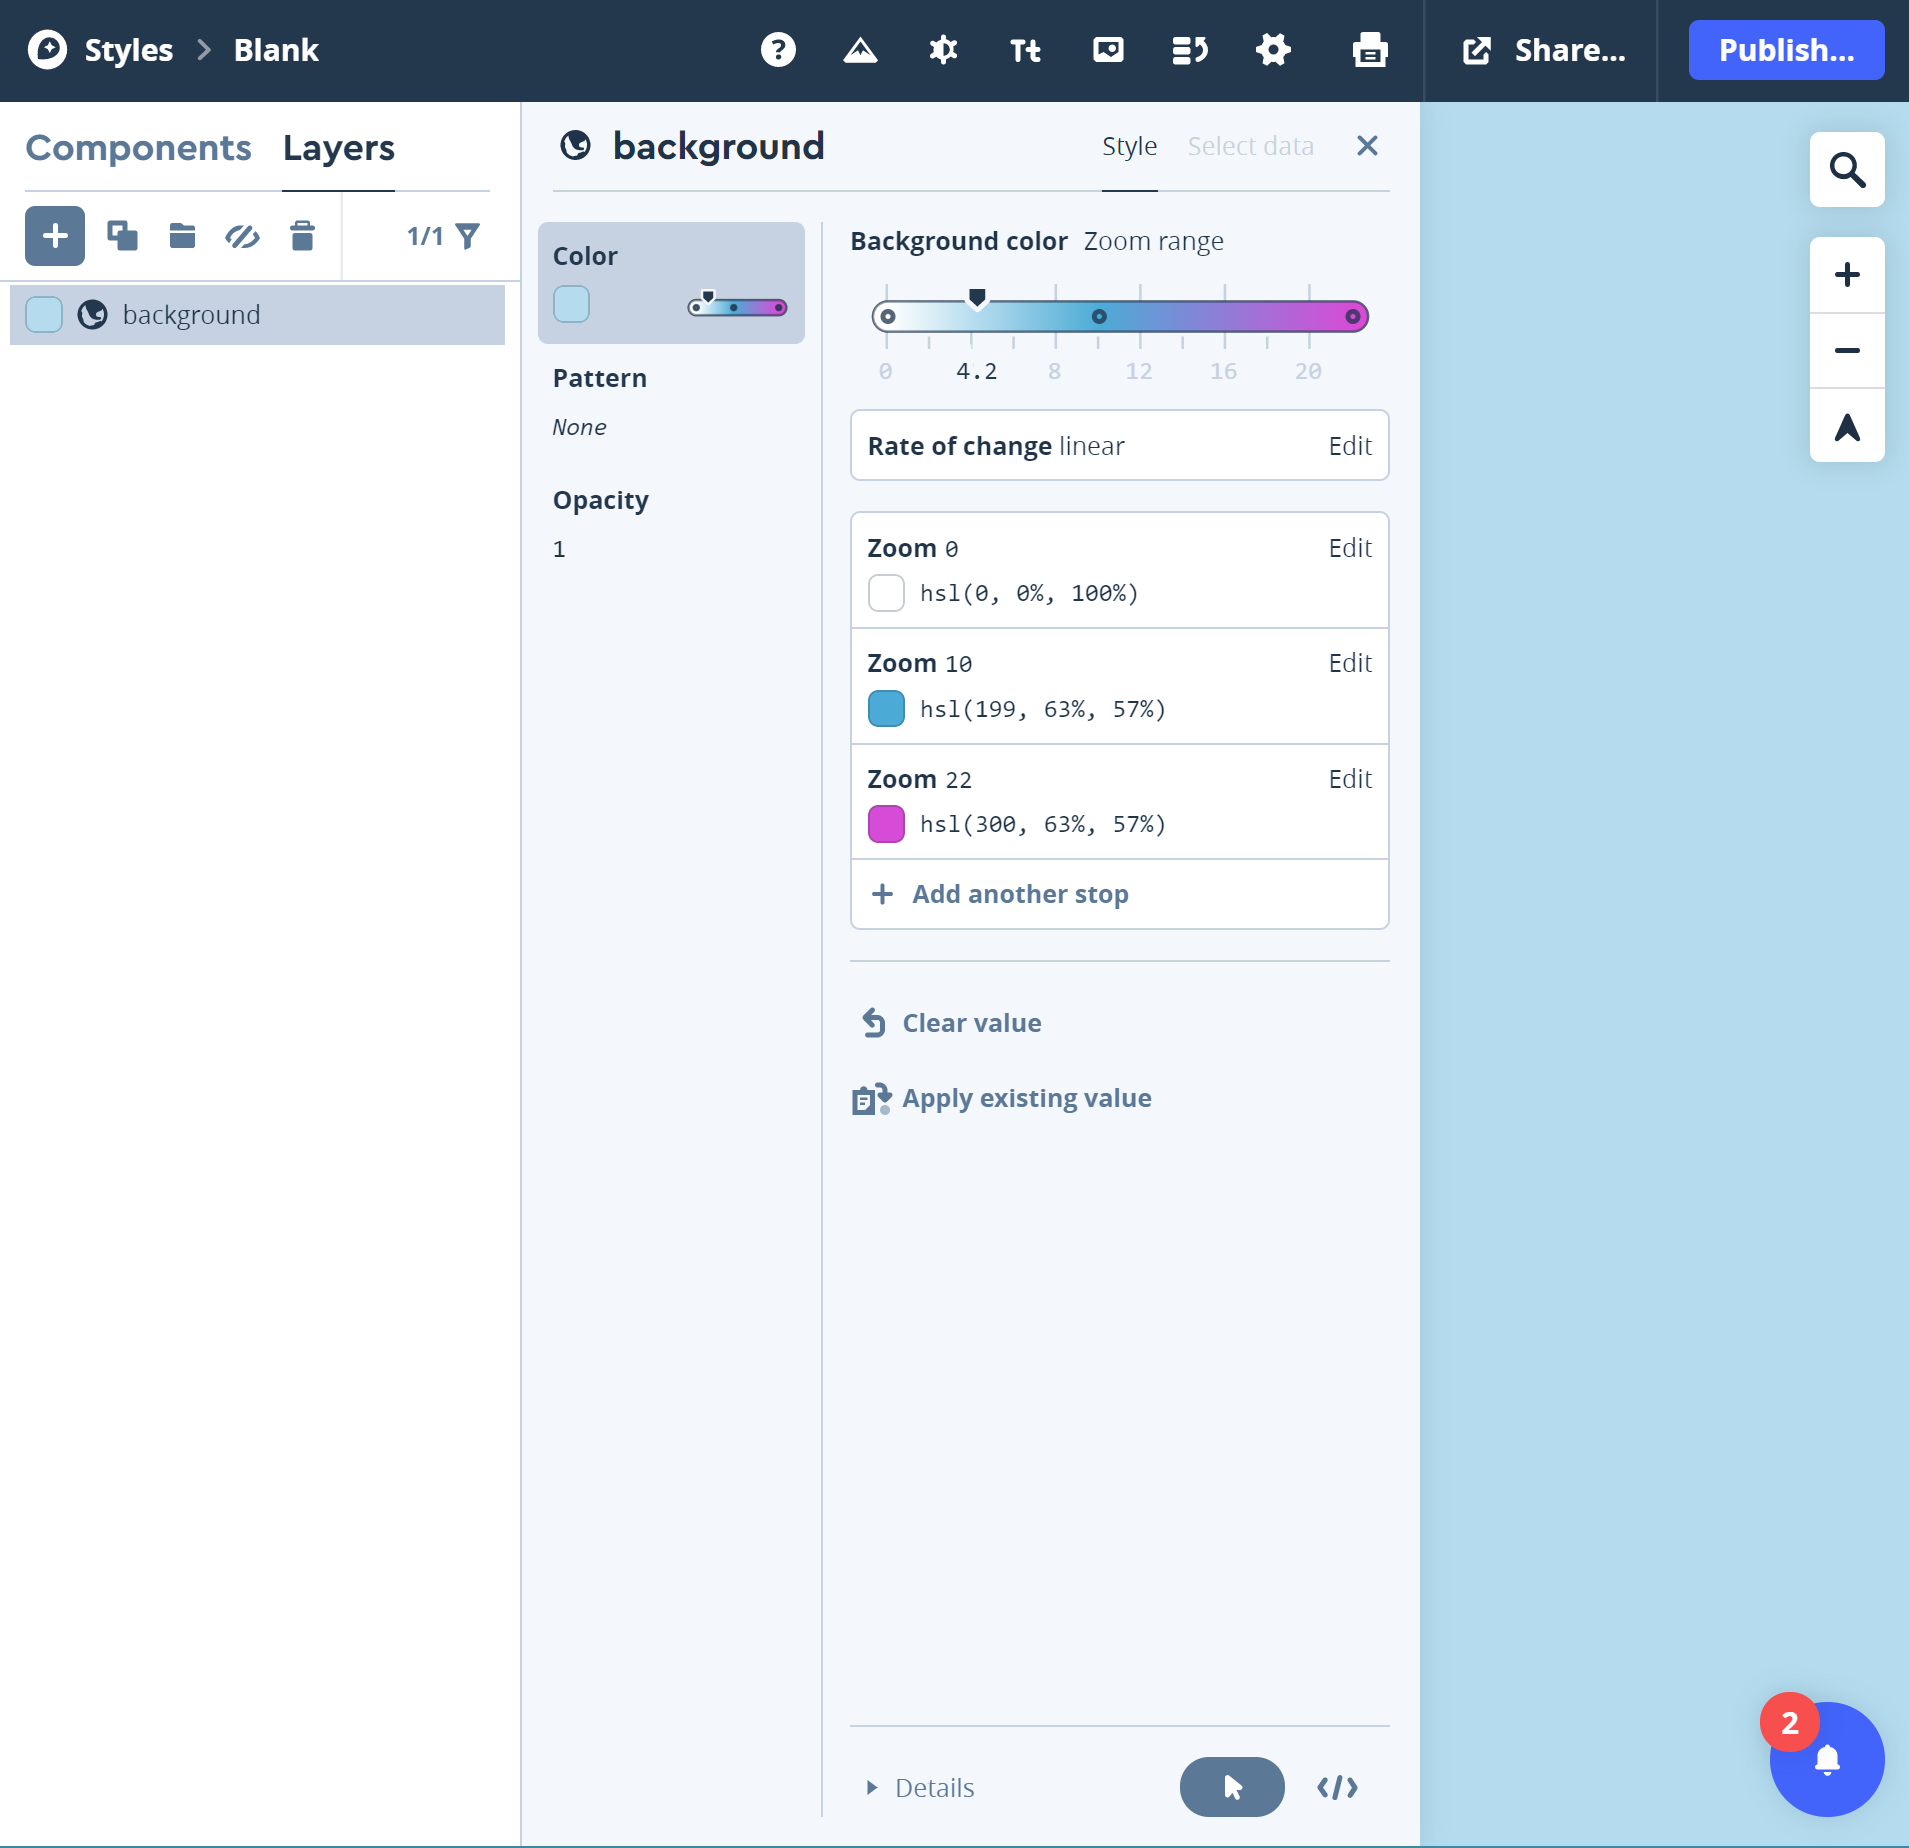
Visual Guide Figure 8.4b. Setting a color change across zoom levels in Mapbox Studio. -
Add Additional Layers
One by one, we will now add additional layers to our map. Click the "+" icon. Note that the New Layer window that appears is listed under the Select data item. Under Source, select the None selected option. In the panel that appears, use the vertical slider bar to navigate down to the Mapbox Streets V8 source as shown in Figure 8.5. The styles of the various "street" elements are shown. We'll start by adding the admin layer (you may have to scroll down a bit to see the admin layer. Select the layer to load it to your layer list. This page provides an overview of all the individual types of layers and their attributes that are available in the Streets V8 file.
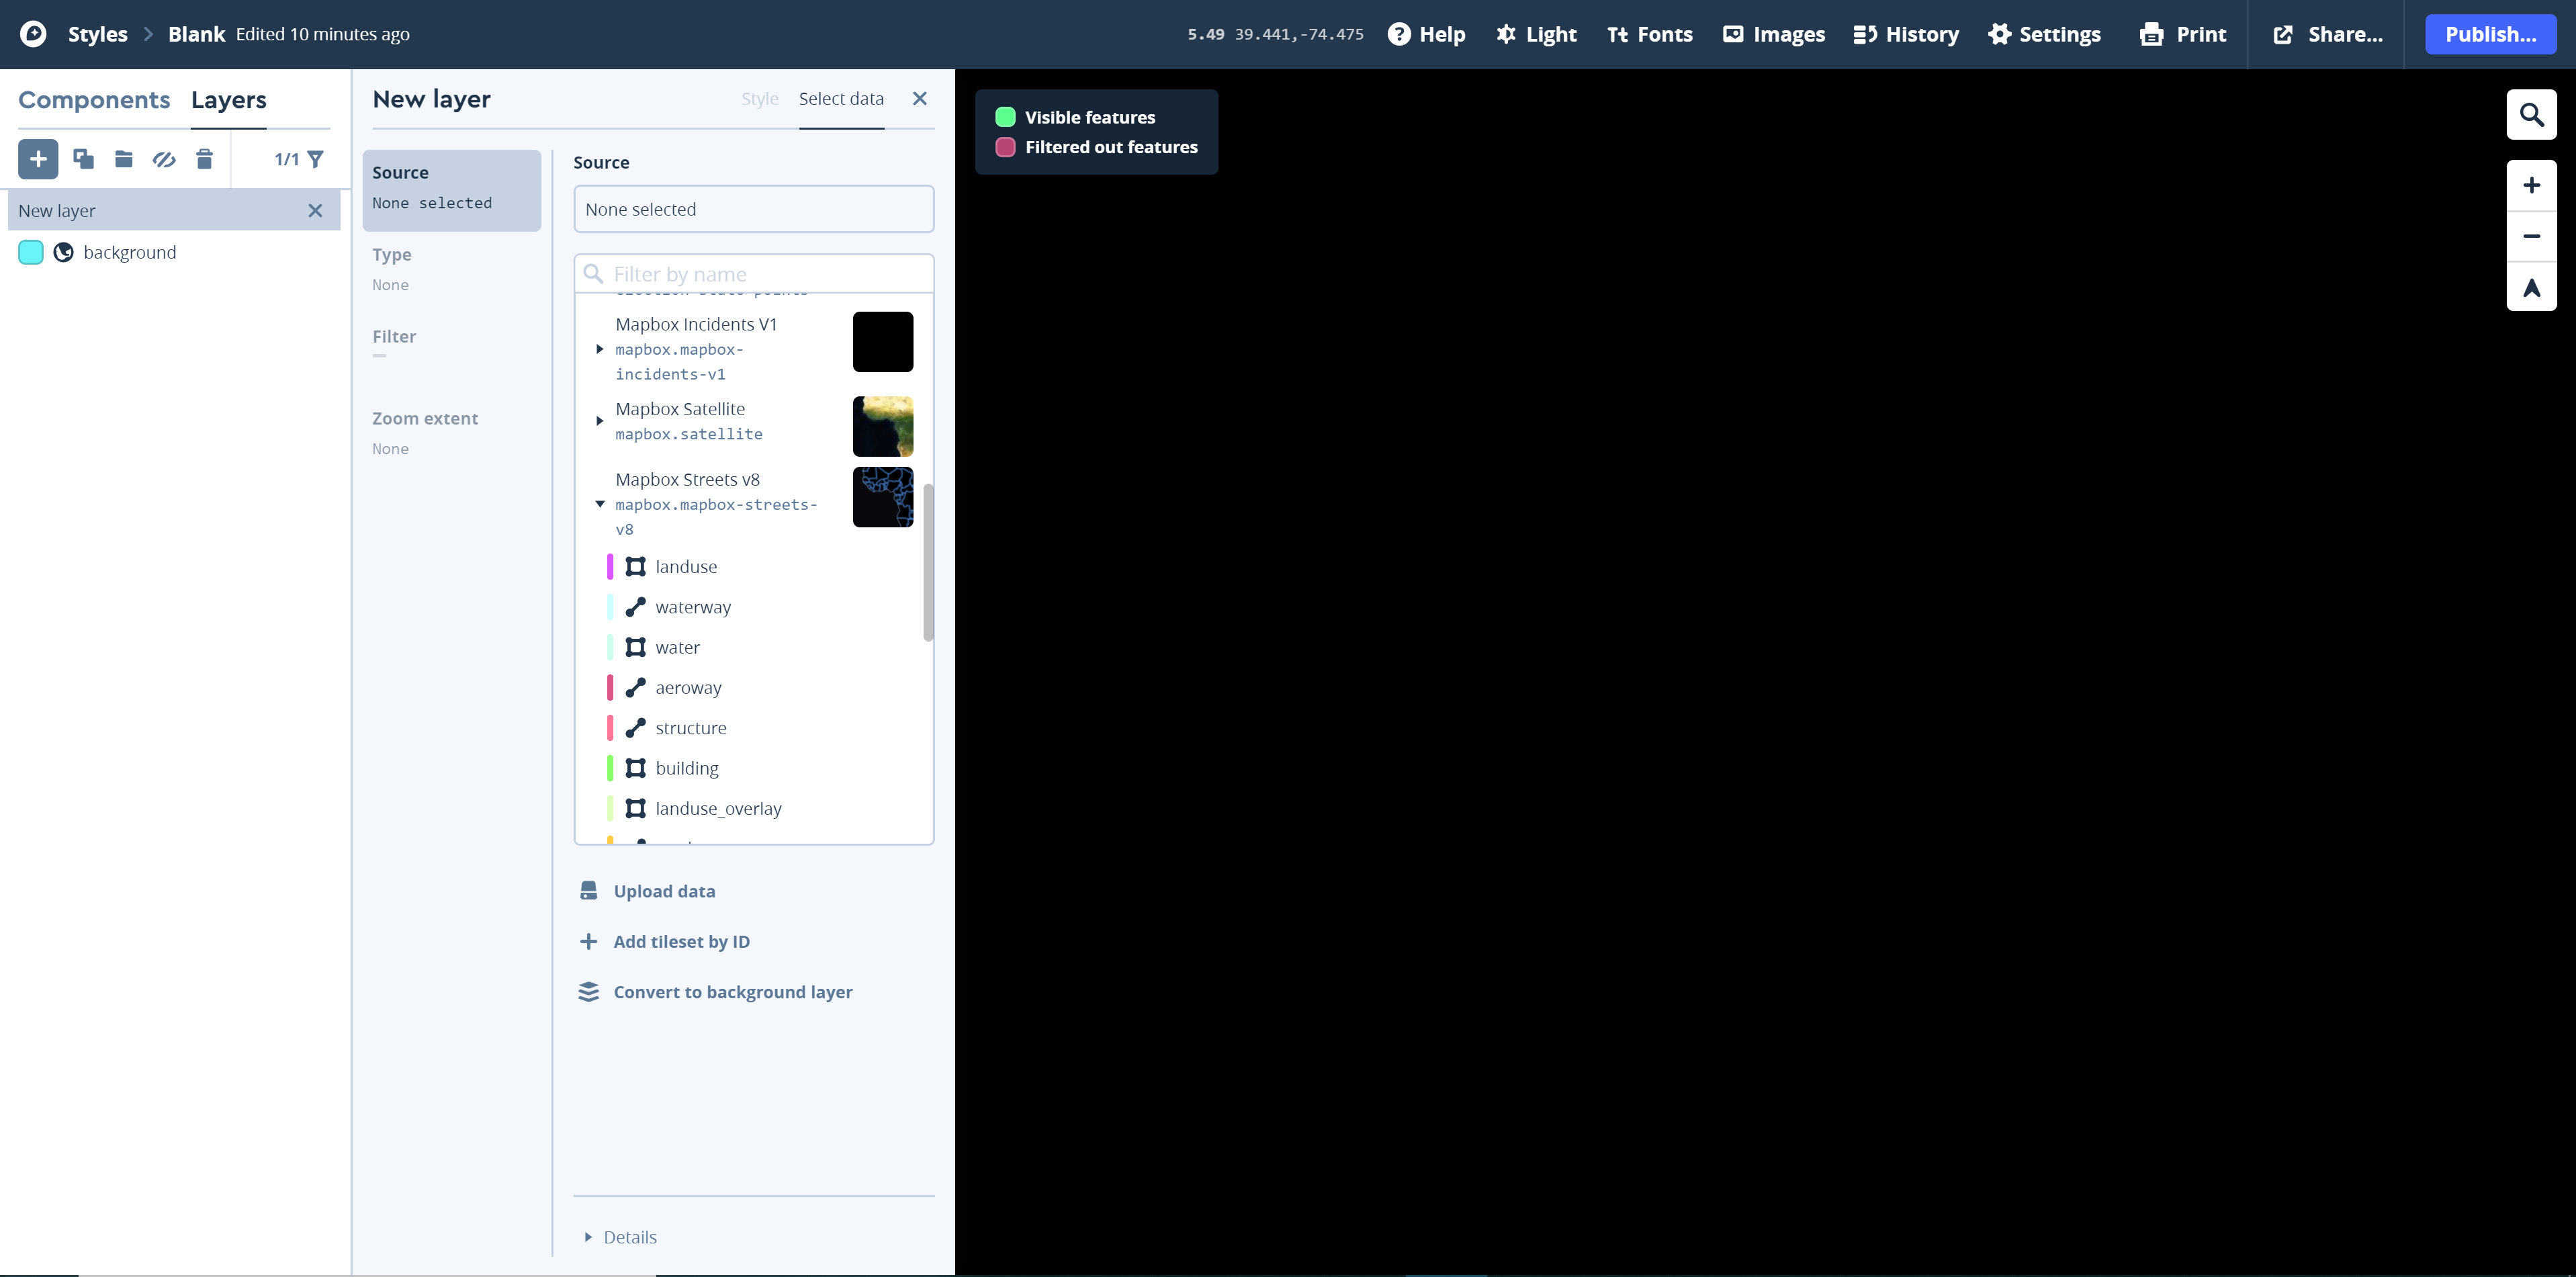 Visual Guide Figure 8.5. Adding the admin line layer from the Mapbox Streets v8 source.
Now that you have some data loaded, we can Style the new layer. Similar to how we edited the map background, we can edit the color, opacity, line width, etc., of the administrative boundary lines in this layer. Click on any of the options shown in the admin window and alter them as needed. Figure 8.6 shows the backtground color overprinted by darker blue county and state outlines. Note that as the admin layer only consists of lines, we cannot fill in the administrative boundaries - the fill for the administrative boundaries will be the color of your background layer. Of course, you can return and change the color of the background layer if you so choose. Next, we will change the color of the ocean by adding a water layer later.
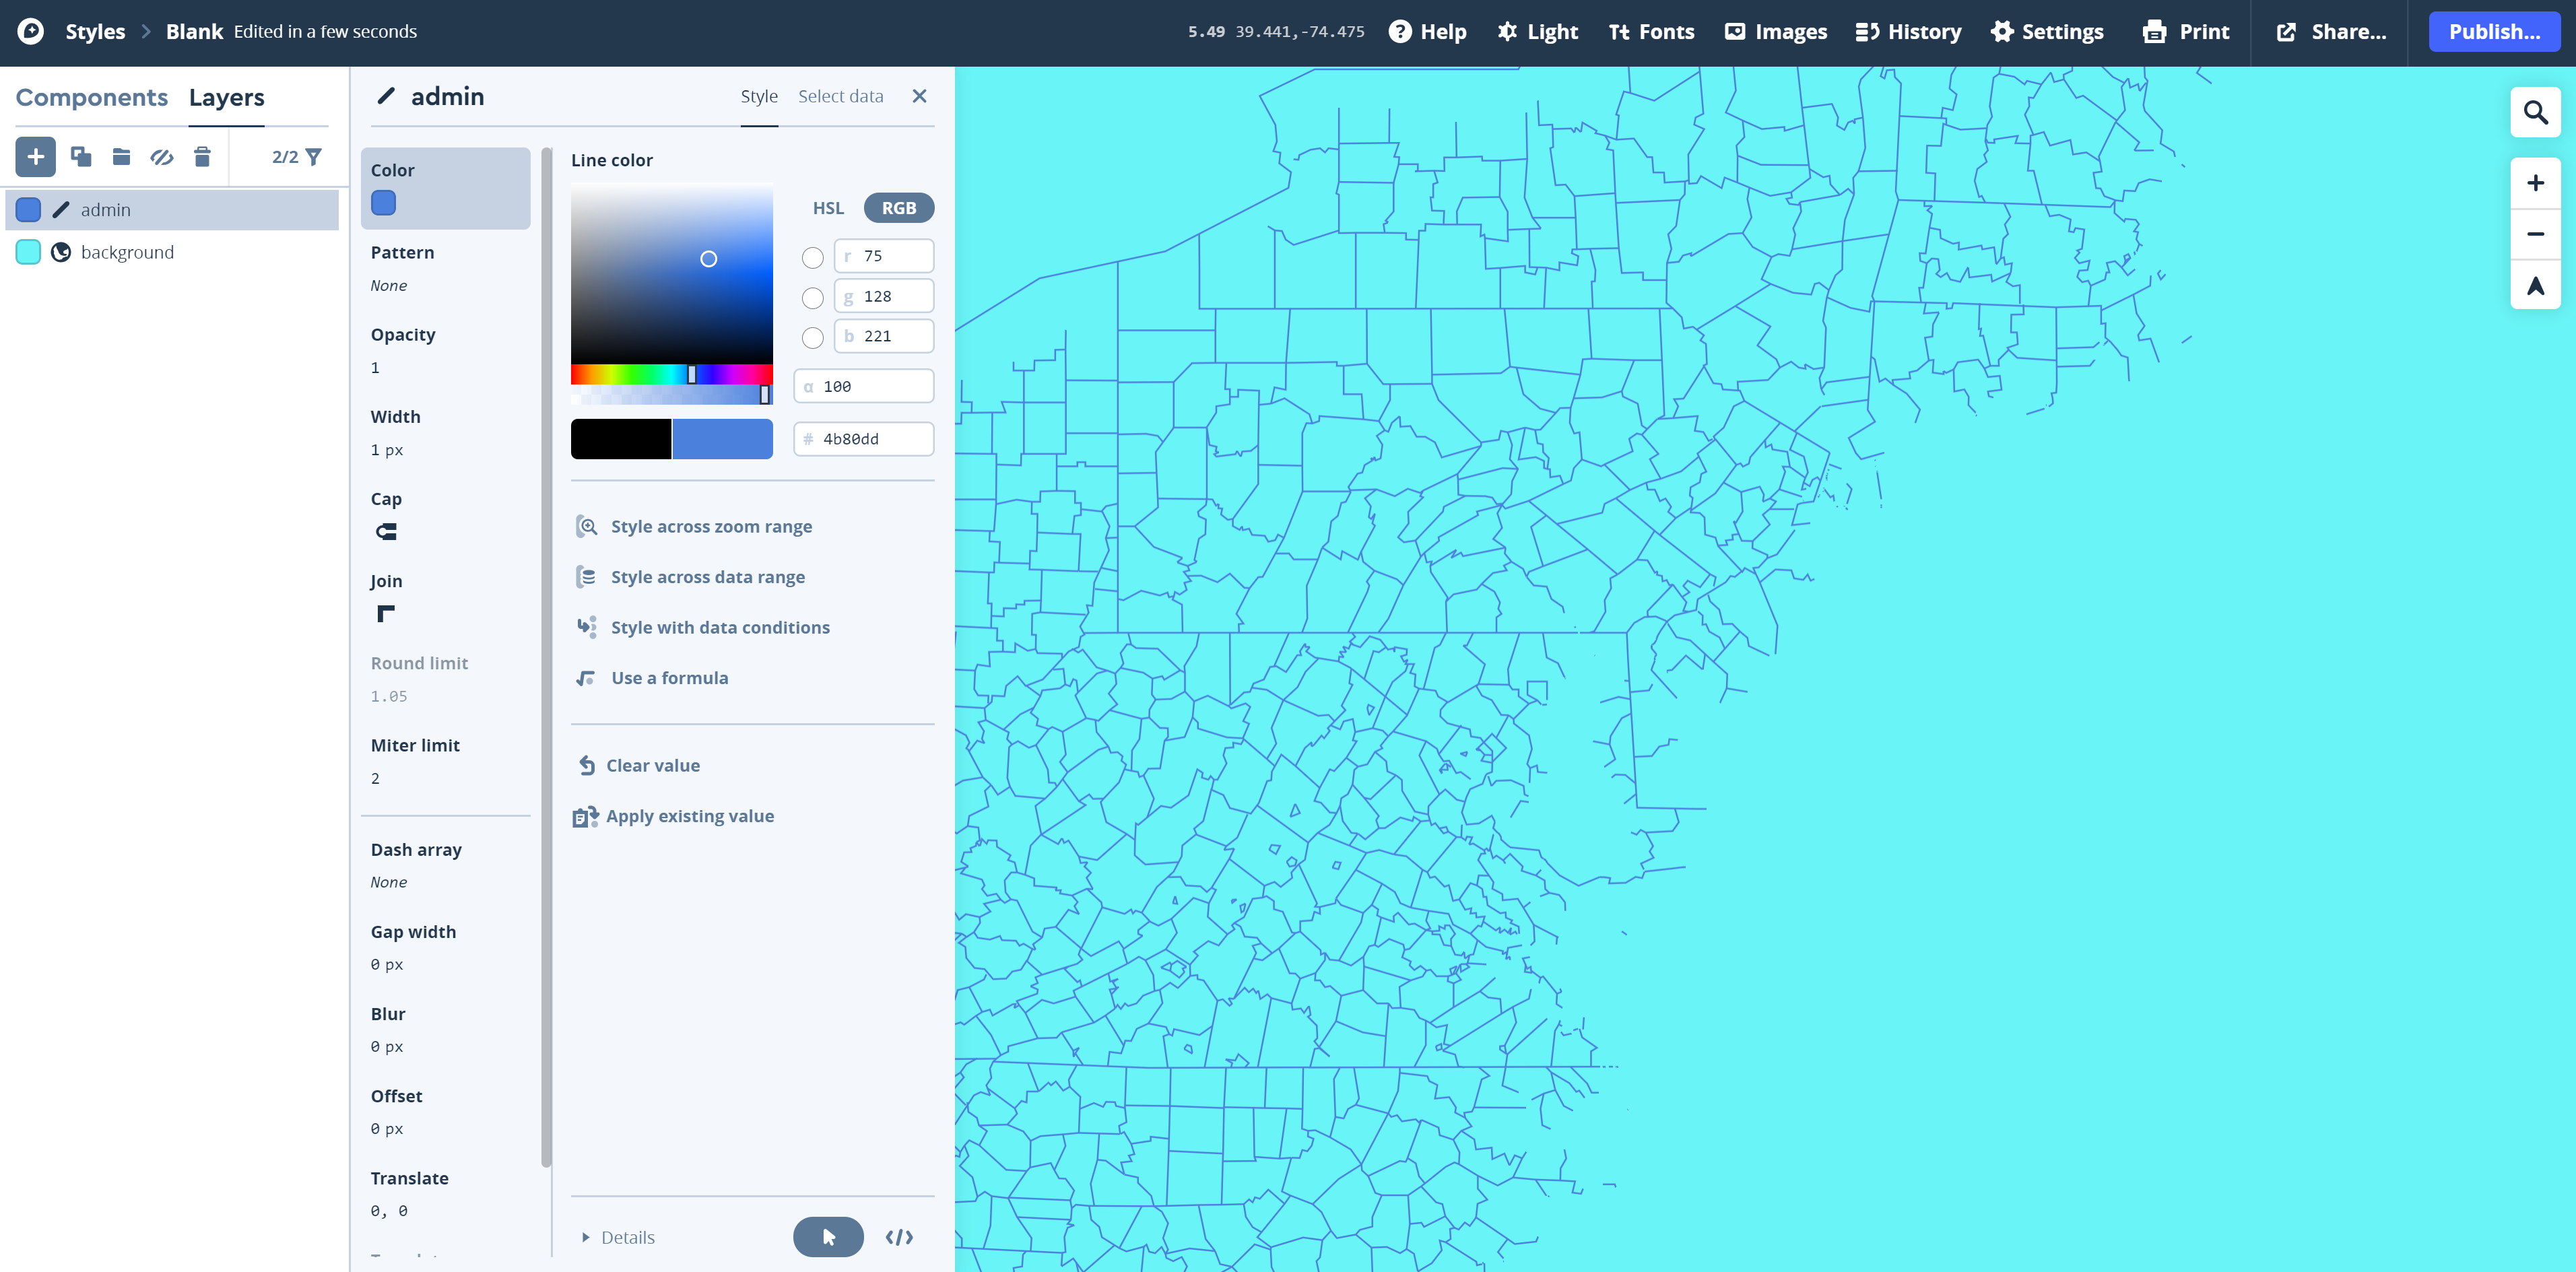 Visual Guide Figure 8.6. Editing the admin line layer in Mapbox Studio.
 -
Add a Label Layer
Add another layer: this time, select place-label from the Mapbox Streets V8 data set. Click on Type to set the type characteristics for this layer. To begin, choose Symbol (Figure 8.7). This action will result in your place labels displaying as text rather than as another kind of symbol such as a circle.
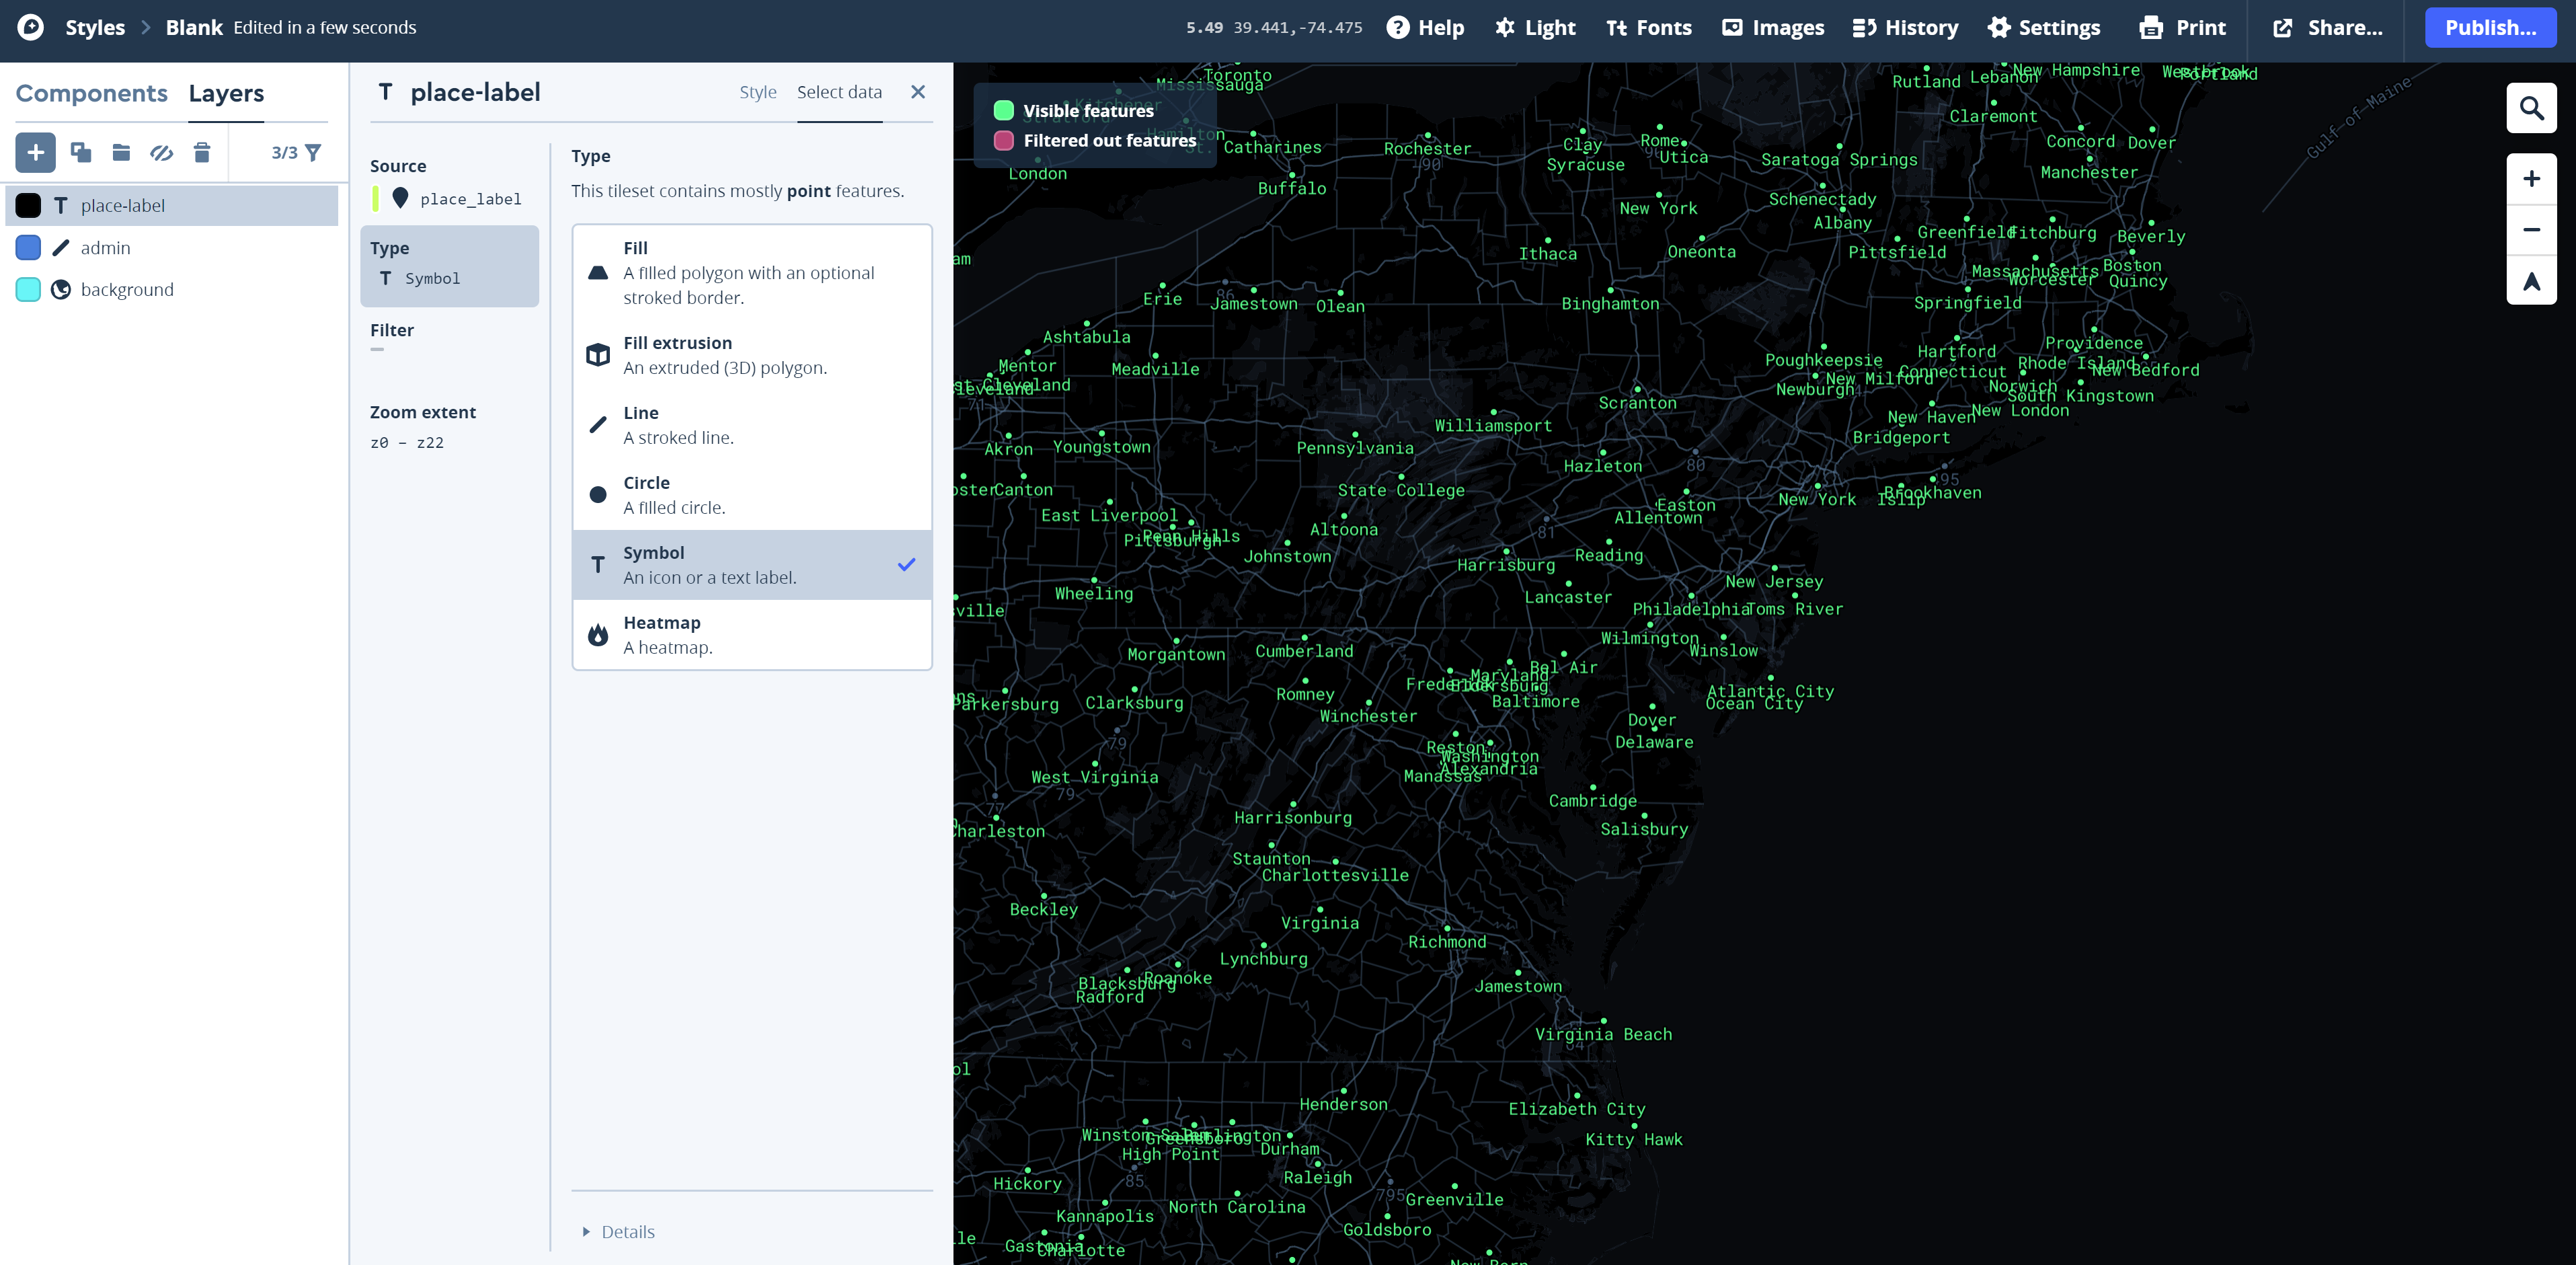 Visual Guide Figure 8.7. Adding a label layer (here, place_labels).
To display the labels and edit their appearance, you need to edit the Style of the place-label layer. To do this, click on the black rectangle to the left of the T place-label in the layer listing. On the menu items that appear, notice that the Text field option. Click on this option to select a "Text Field" that will be used to supply the text for your labels. Think of this process as choosing a field header of an attribute table. Select the Insert a data field that contains the labels you want.
-
If you look down the list of available data fields, you start your labeling by looking at either the "name" or "name_en" data field (Figure 8.8), depending on whether you would like the place names to display in the local language or always in English, respectively. You should explore other data fields for additional labels.
Once you have selected a data field to label, you will want to Style those labels using the Text, Icon, Position, and Placement options on the T Place-label window. Remember to work with the zoom across range option to maximize the visilibilty of your labels at different zoom ranges.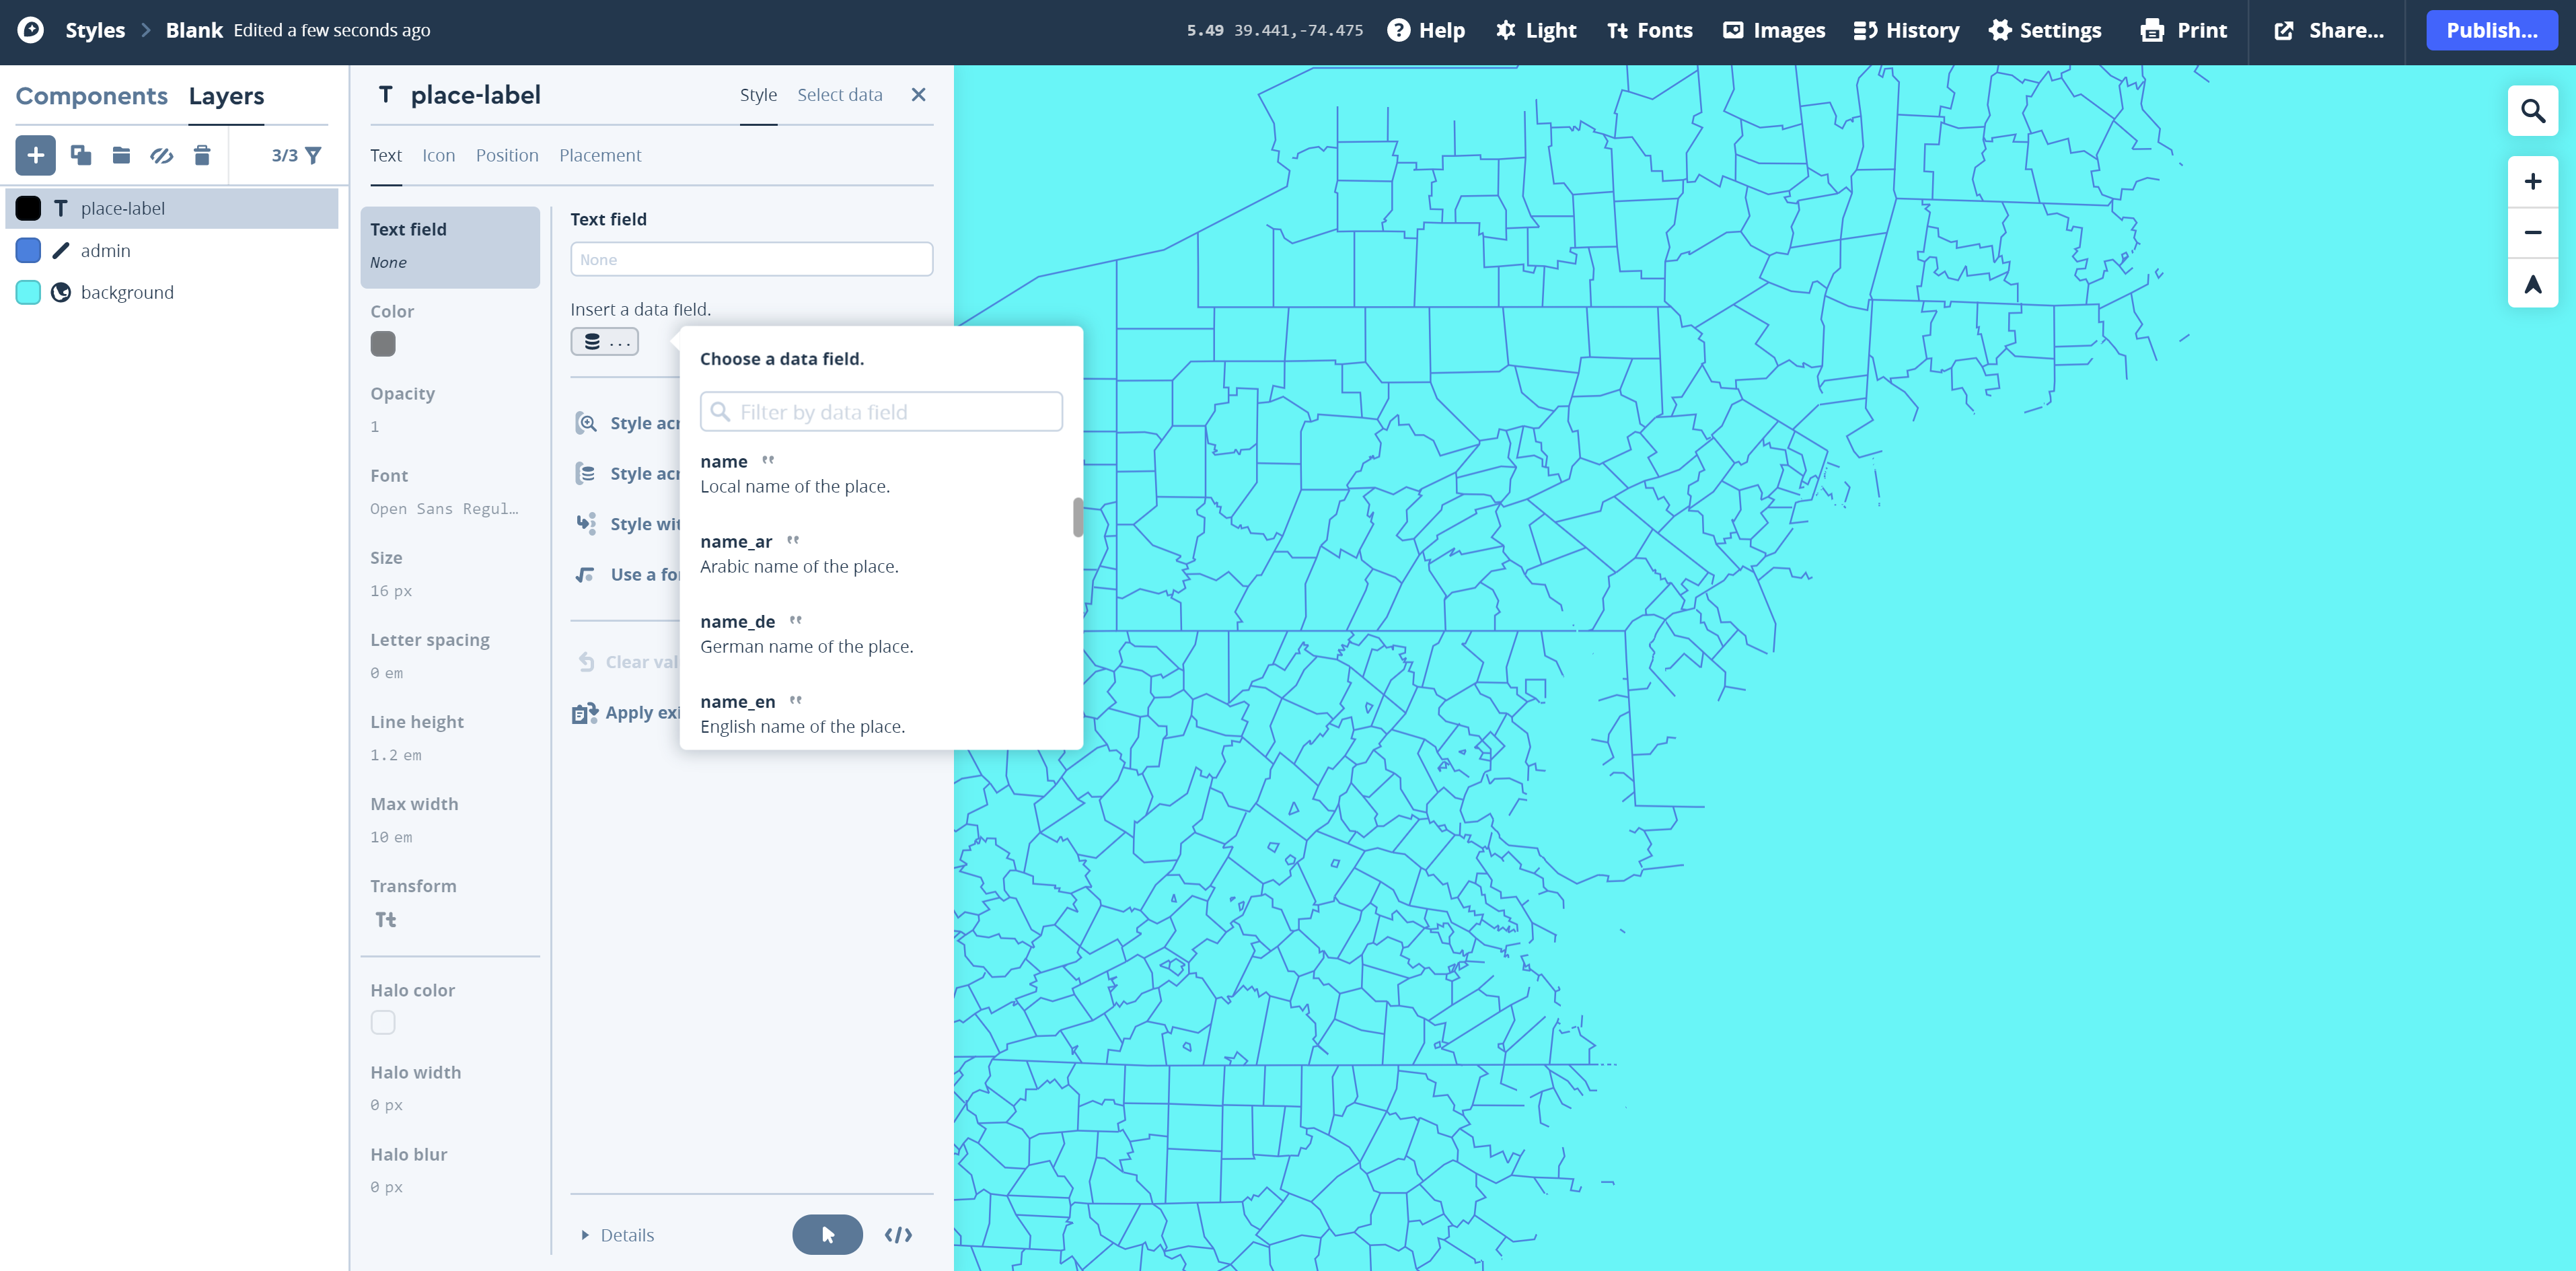 Visual Guide Figure 8.8. Choosing to insert a data field to display as a text label in Mapbox Studio.
 -
Publish and Add Creative Styling
Once you've made a bit of progress on your map, you should Publish it. To do so, click on the Publish button in the upper right-hand corner of the screen. The Publish Blank window appears (Figure 8.9) - this also saves the map in your account. You should re-publish as you work, similar to how you regularly save your work while using desktop software.
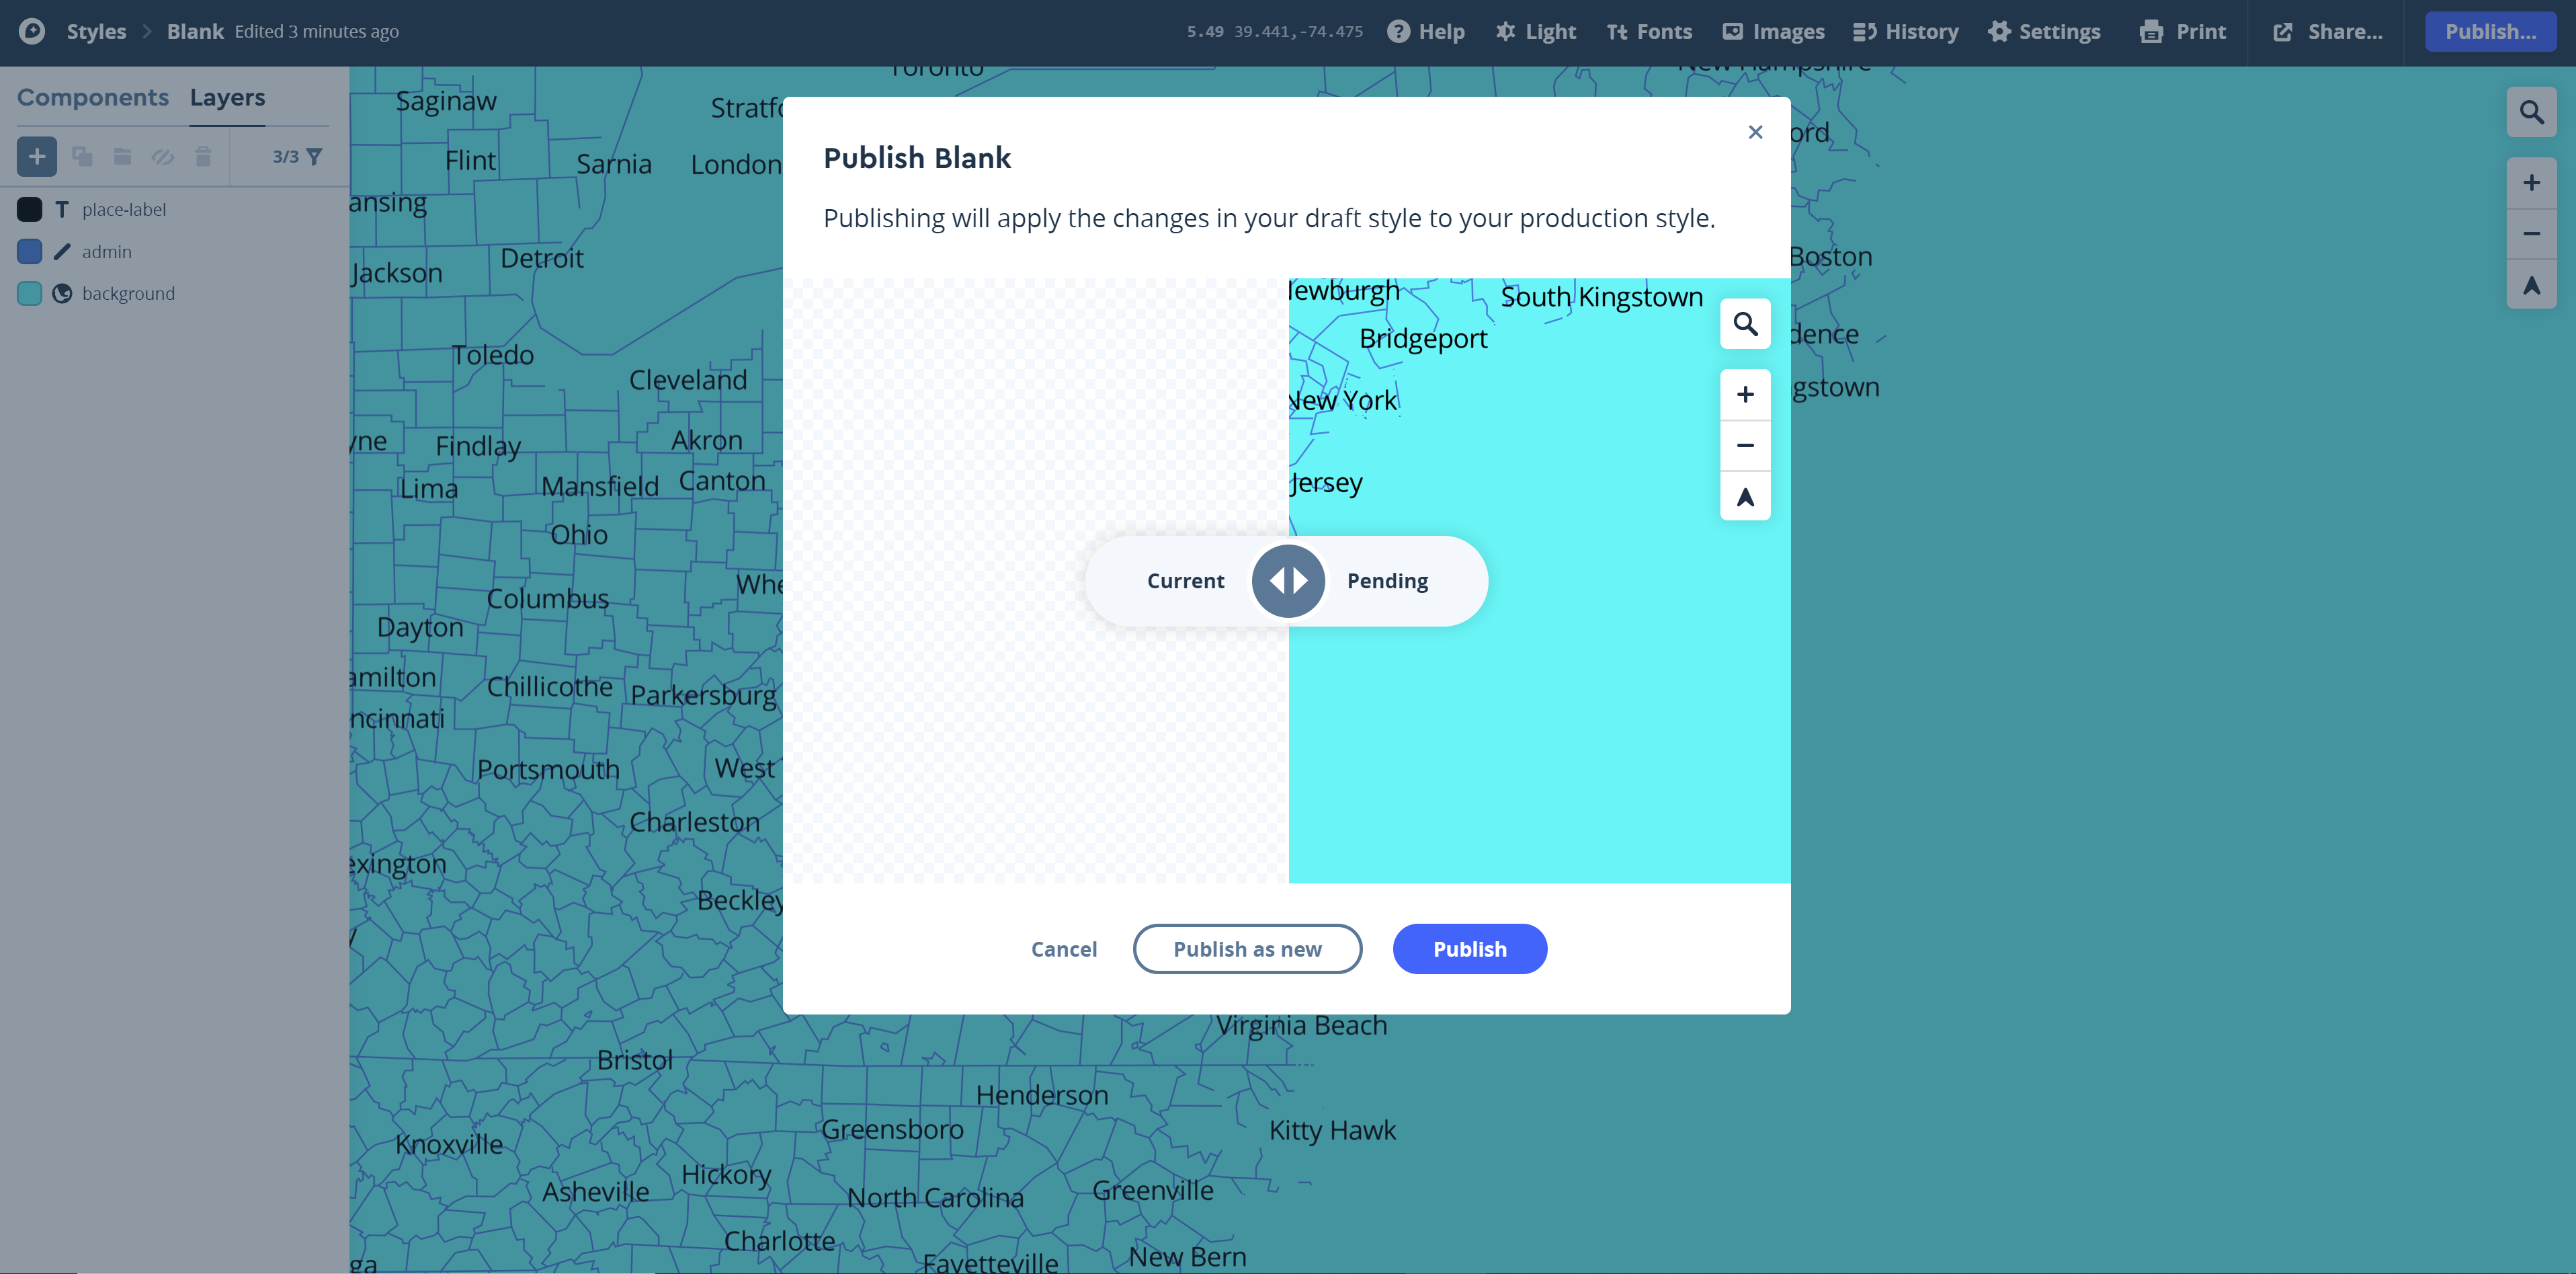 Visual Guide Figure 8.9. Publishing your mapbox basemap.
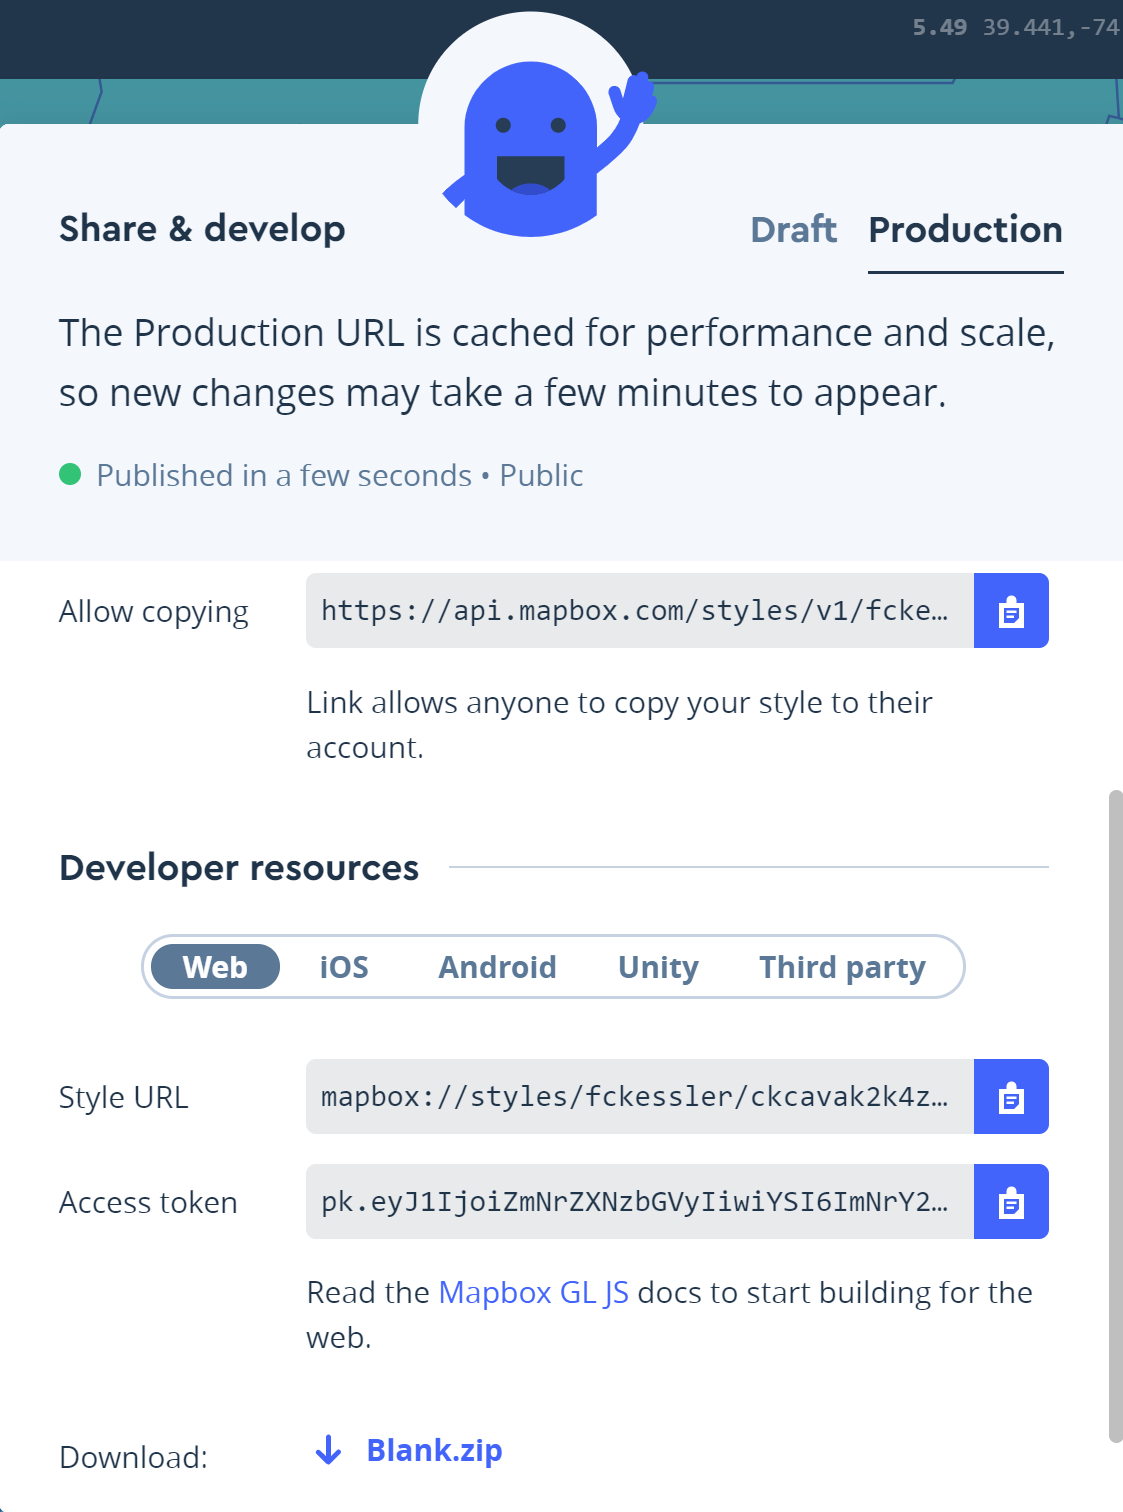
Once your map is published to the web, it will be available via a shared URL so that anyone with the link can view your map. Set your style to public. To Share your Mapbox creation through a URL, click on the Share button to the left of the Publish button (Figure 8.10a). On this window, you can Make public your Style URL. This is the URL that uniquely is attached to your Mapbox style. Note in FIgure 8.11 the Allow copying (at the top center of the window in Figure 8.10a) is how you can copy the URL, submit that URL with your deliverable, and share yoru Mapbox creation with others in the class for their peer review efforts.
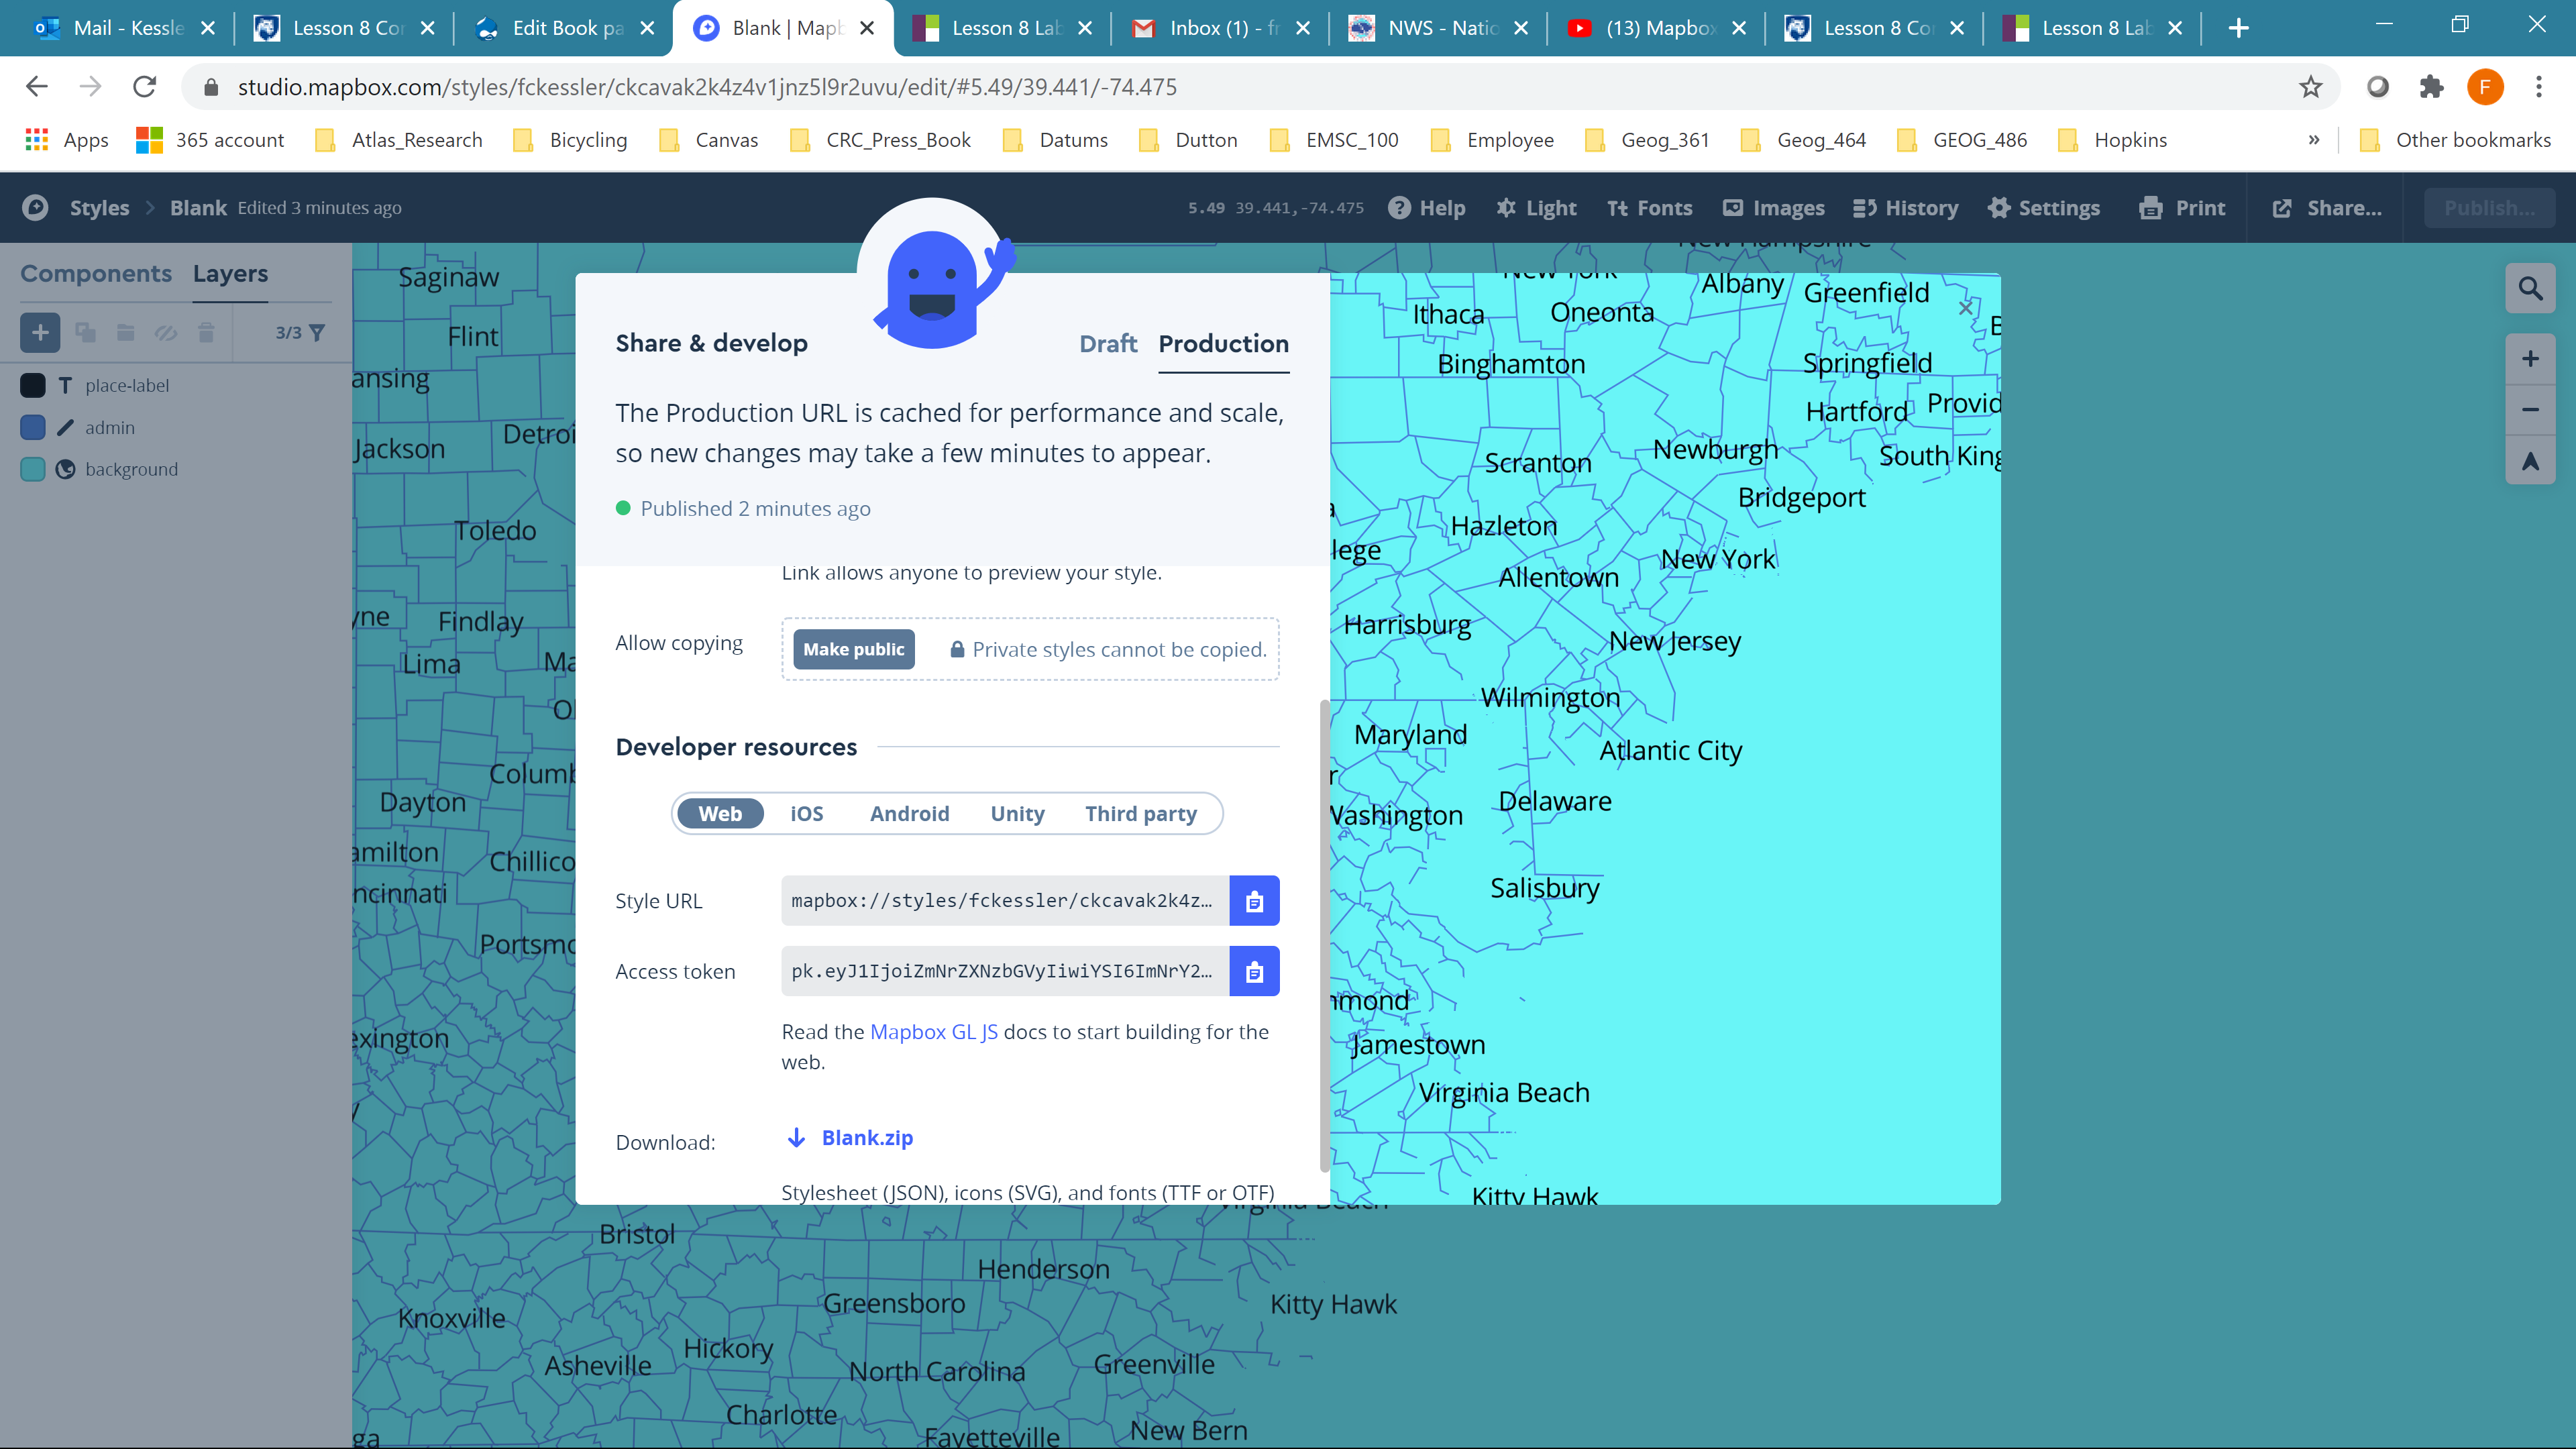 Visual Guide Figure 8.10a. Setting your map viewing settings to public.
Once you have Shared your style, you can let anyone with the link can view your map (Figure 8.10b). When you Allow copying with others in the class, make sure to copy the URL link that starts with https://api.mapbox.com/styles/v1/...
 Visual Guide Figure 8.10b. Setting your map viewing settings to public.
In addition to adding and styling new layers, Mapbox permits a lot of creative customization. Though it's not required, you may want to add a creative font to your map - such as one that is distinctly used in your inspiration source. Many open source fonts are available: here I've uploaded an OTF (OpenType Font) file, which I downloaded online from fontspace. This font is called the priest. The font looks kind of strange but it could work with a sci-fi kind of theme. To load the font for a particular layer, click on the Font option in the Style item (Figure 8.11). Select the "Manage font in your account: link at the bottom of the listing of available fonts. Note that TTF (TrueType Font) files will work as well - try Google Fonts for free downloadable font files.
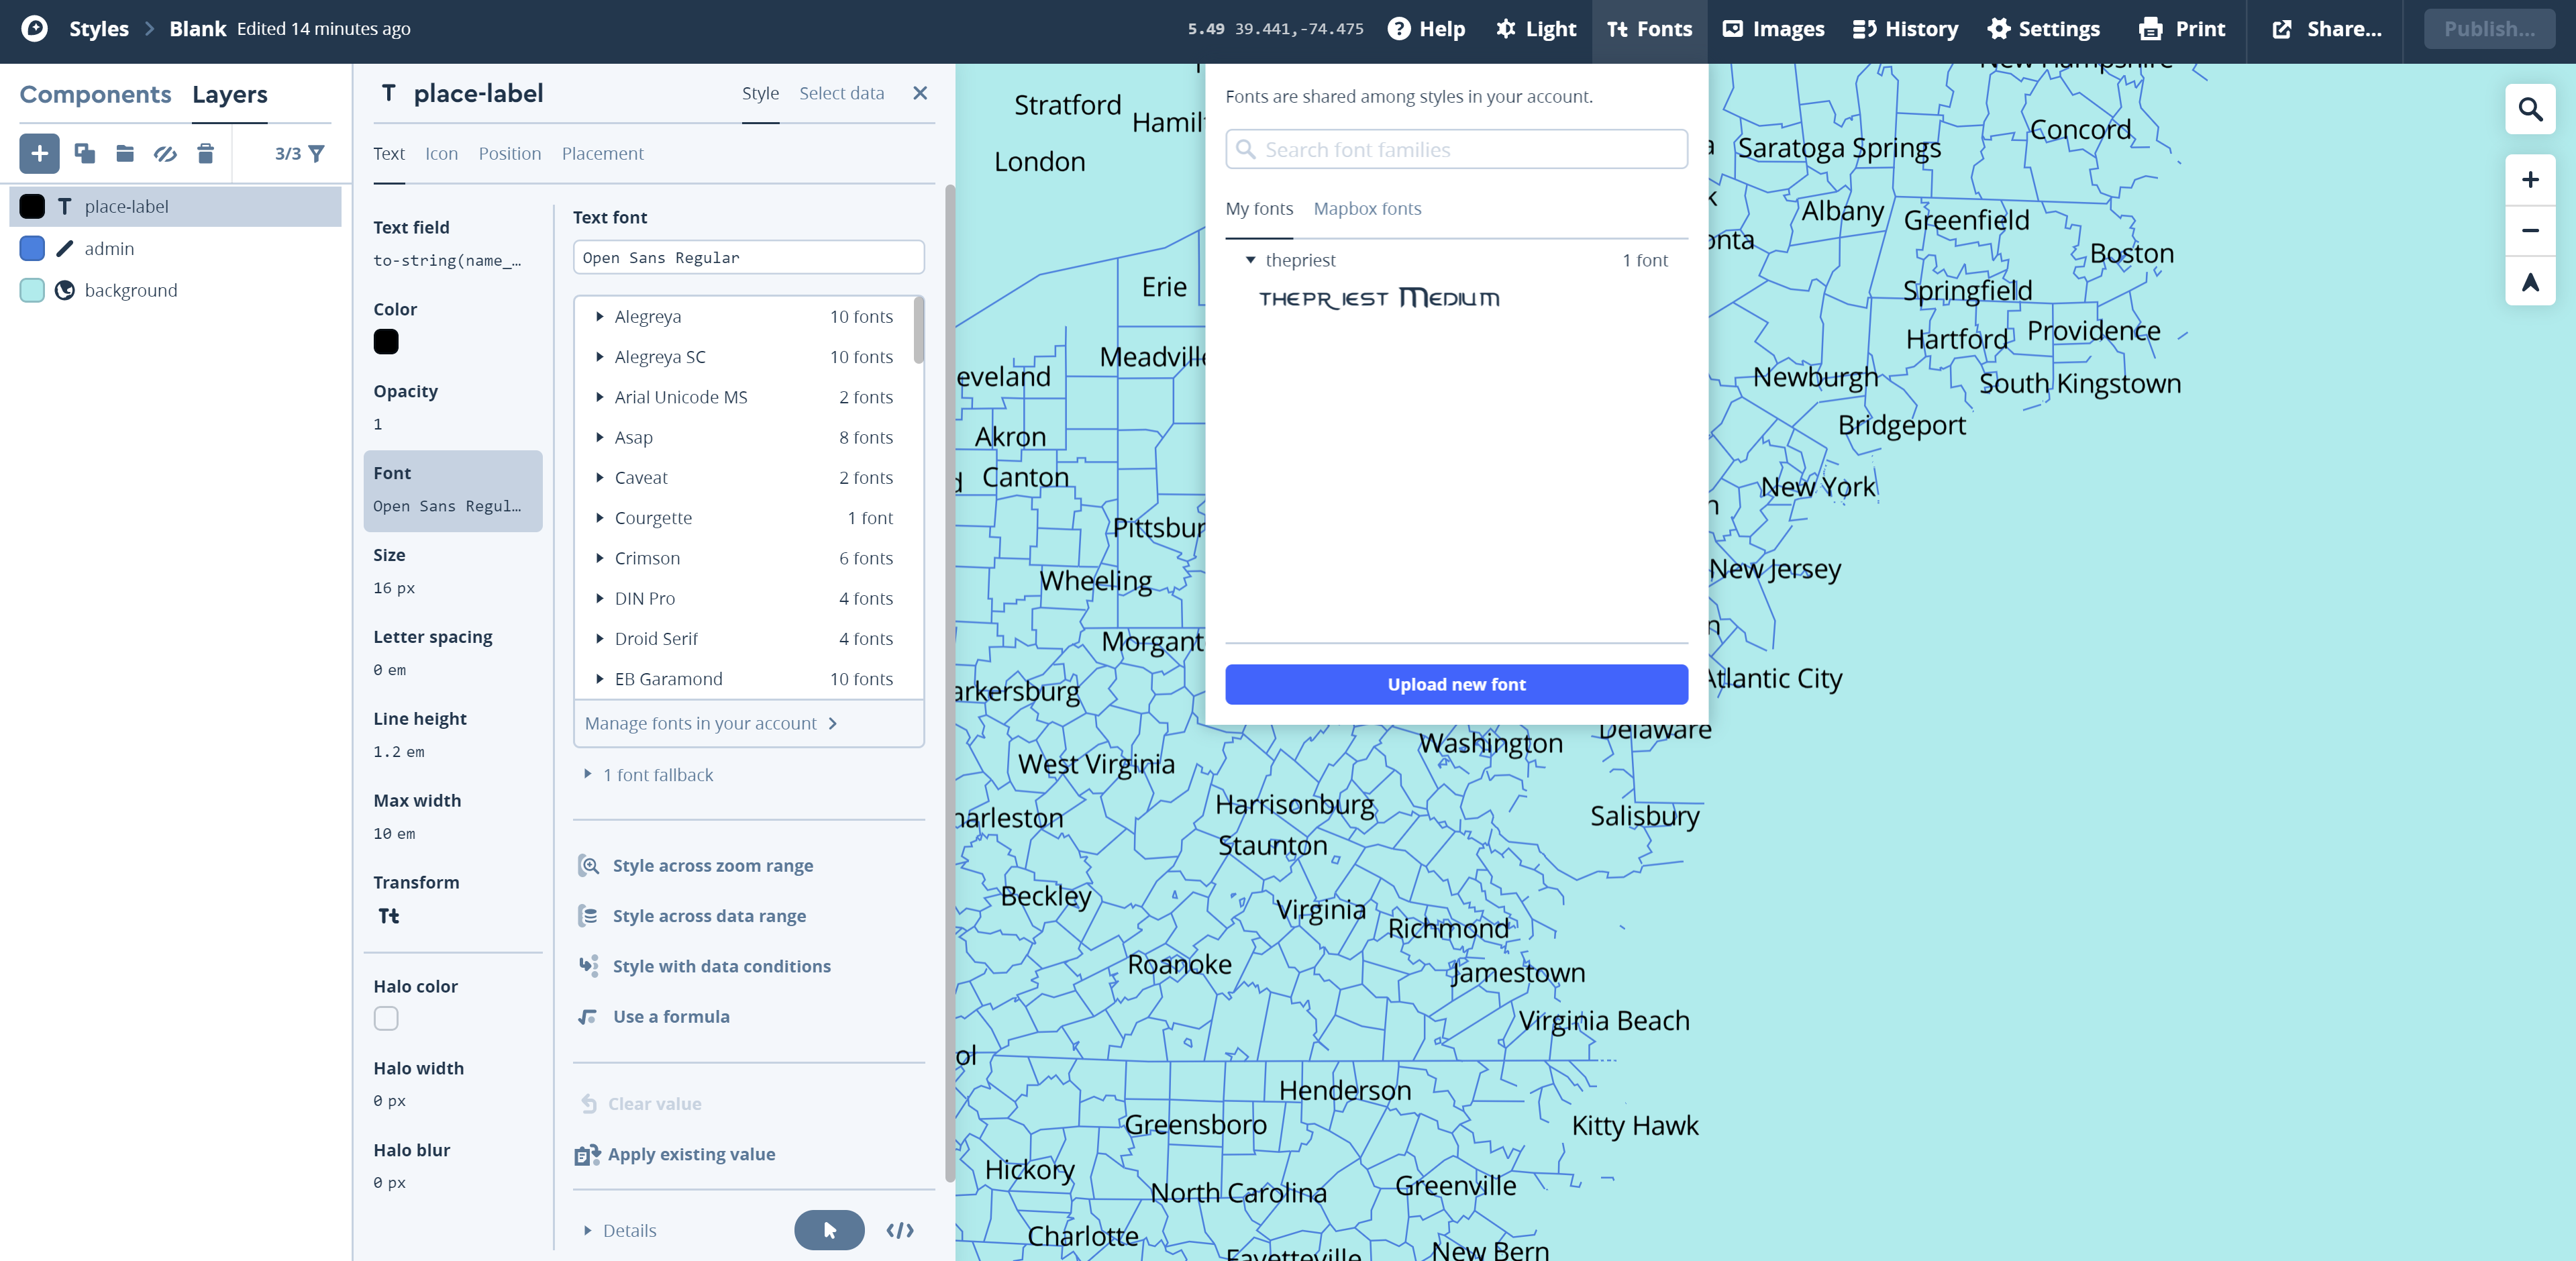 Visual Guide Figure 8.11. Uploading a new font.
As shown in Figure 8.12, this custom font creates an interesting look and feel to the map.
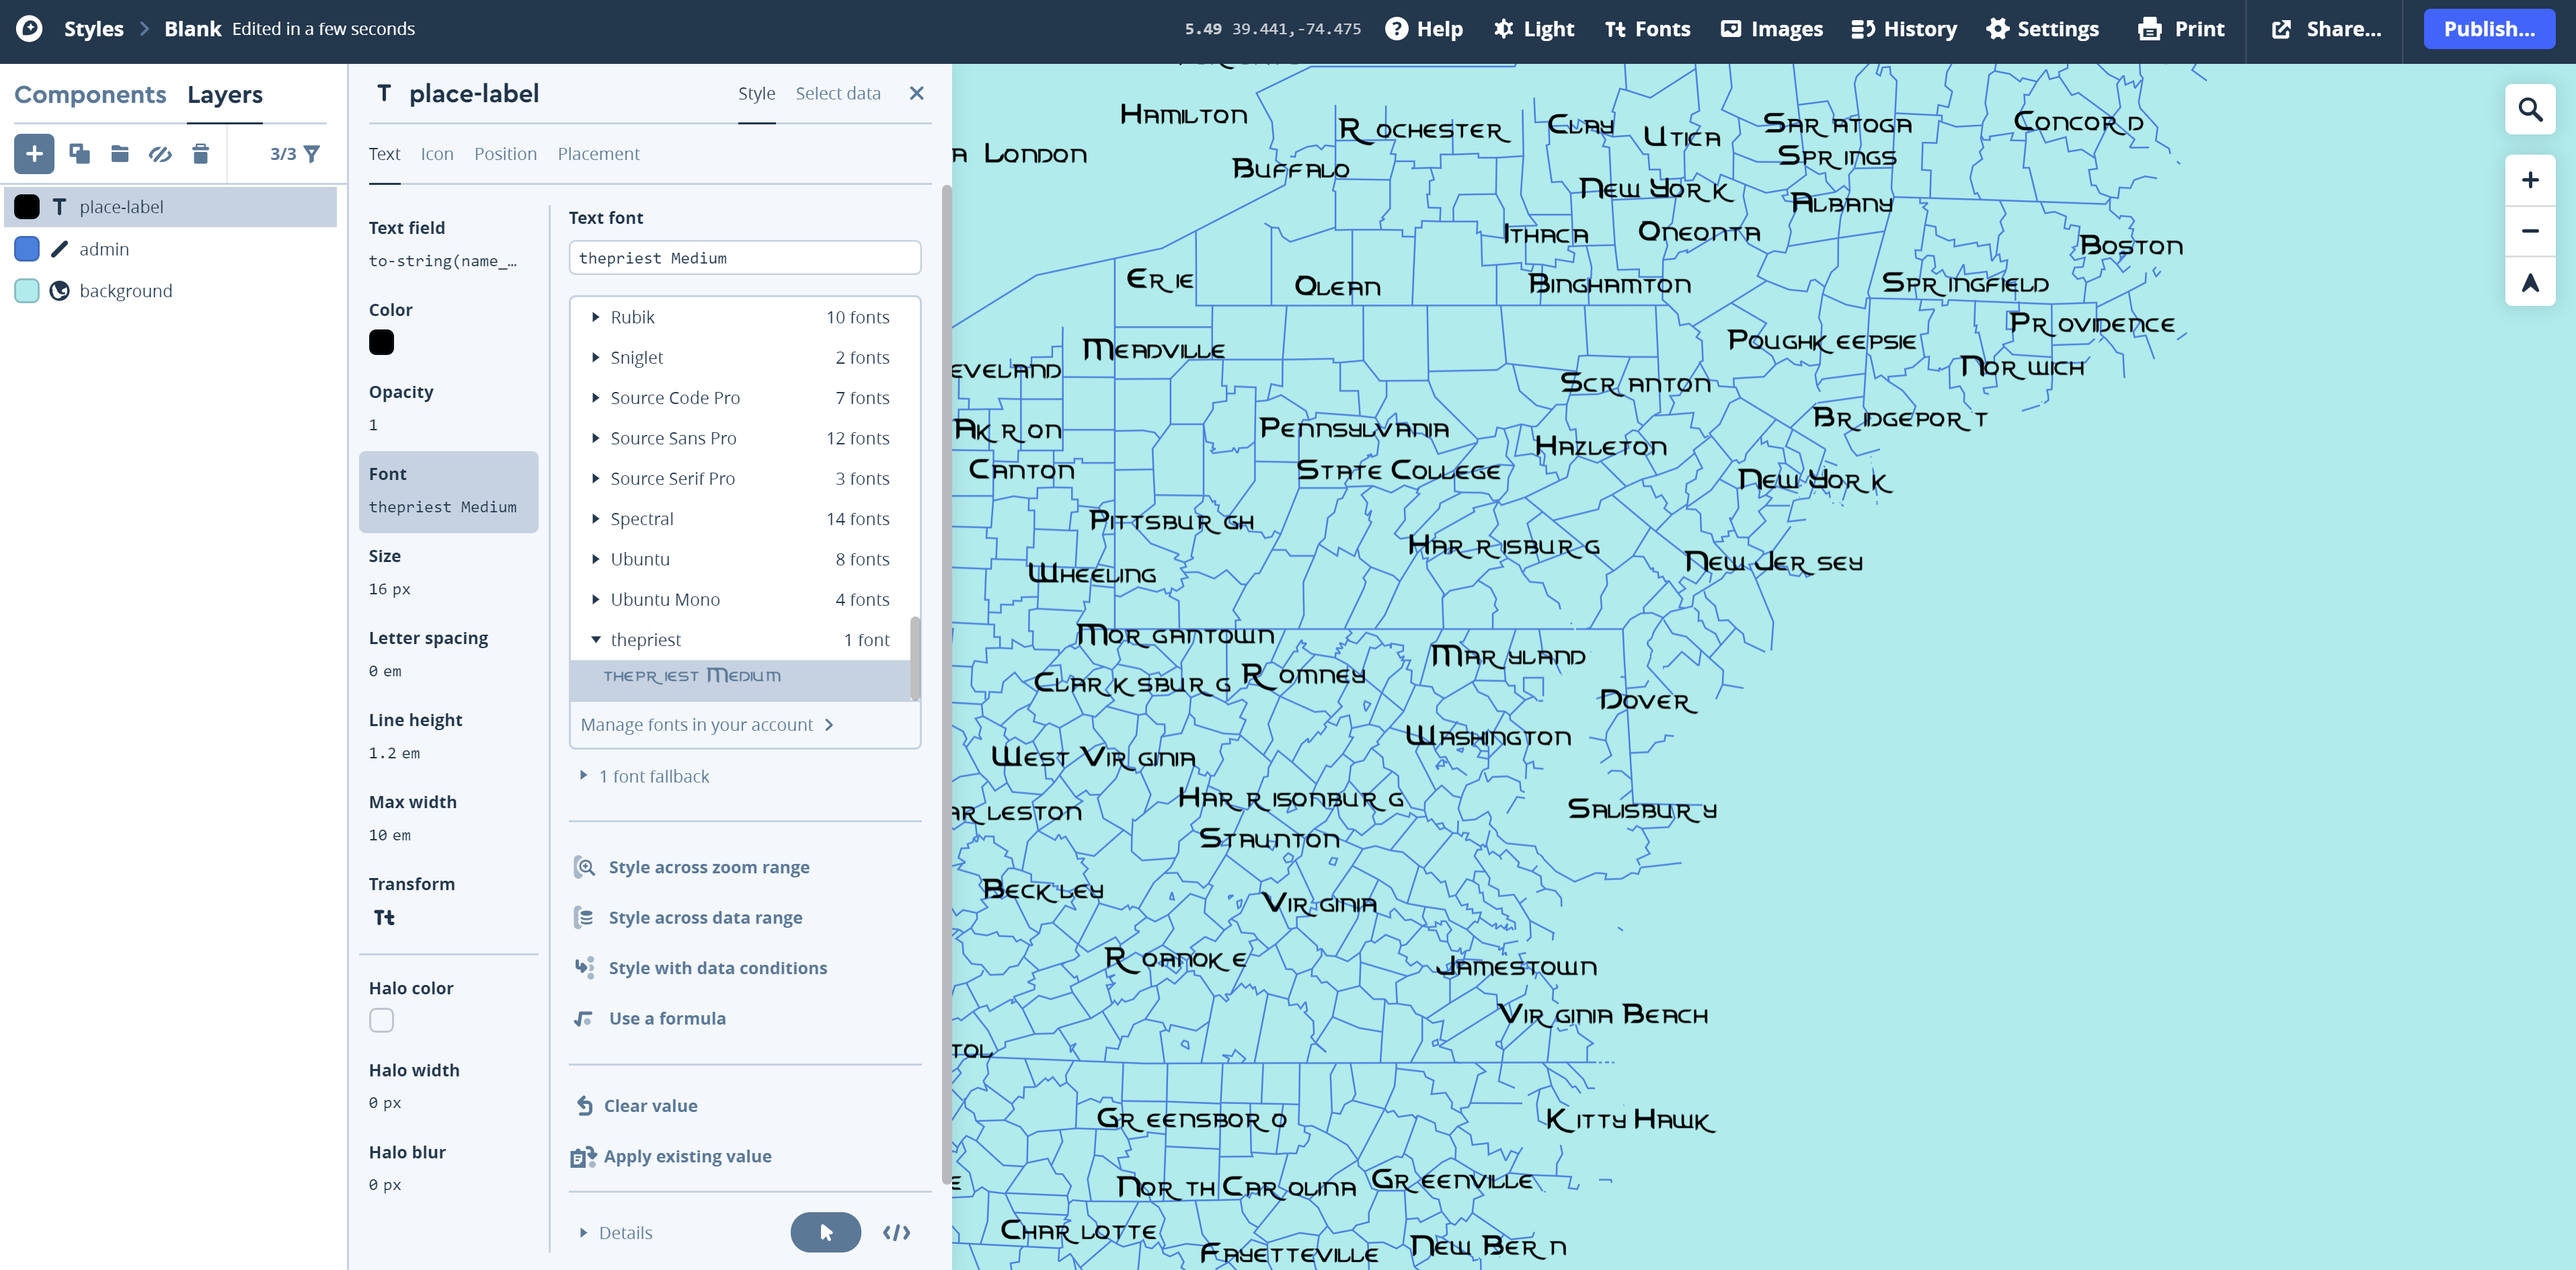 Visual Guide Figure 8.12. Creating place labels with a custom font.
 -
Styling with Conditions
Once you've made some progress on designing your basic map style, you should make some more detailed edits. Remember that we are creating a multiscale map. You may, for example, want your place labels to appear at a different point size based on the map's zoom level.
In Mapbox, certain layers have a minimum zoom level. For example, administrative boundaries are seen at all zoom levels (so, this layer has a minimum zoom level of 0), poi_labels have a minimum zoom level of 5, and large buildings have a minimum zoom level of 13 (all buildings show up at zoom level of 16).
To style place labels, use the "Style across zoom range" function (Figure 8.13).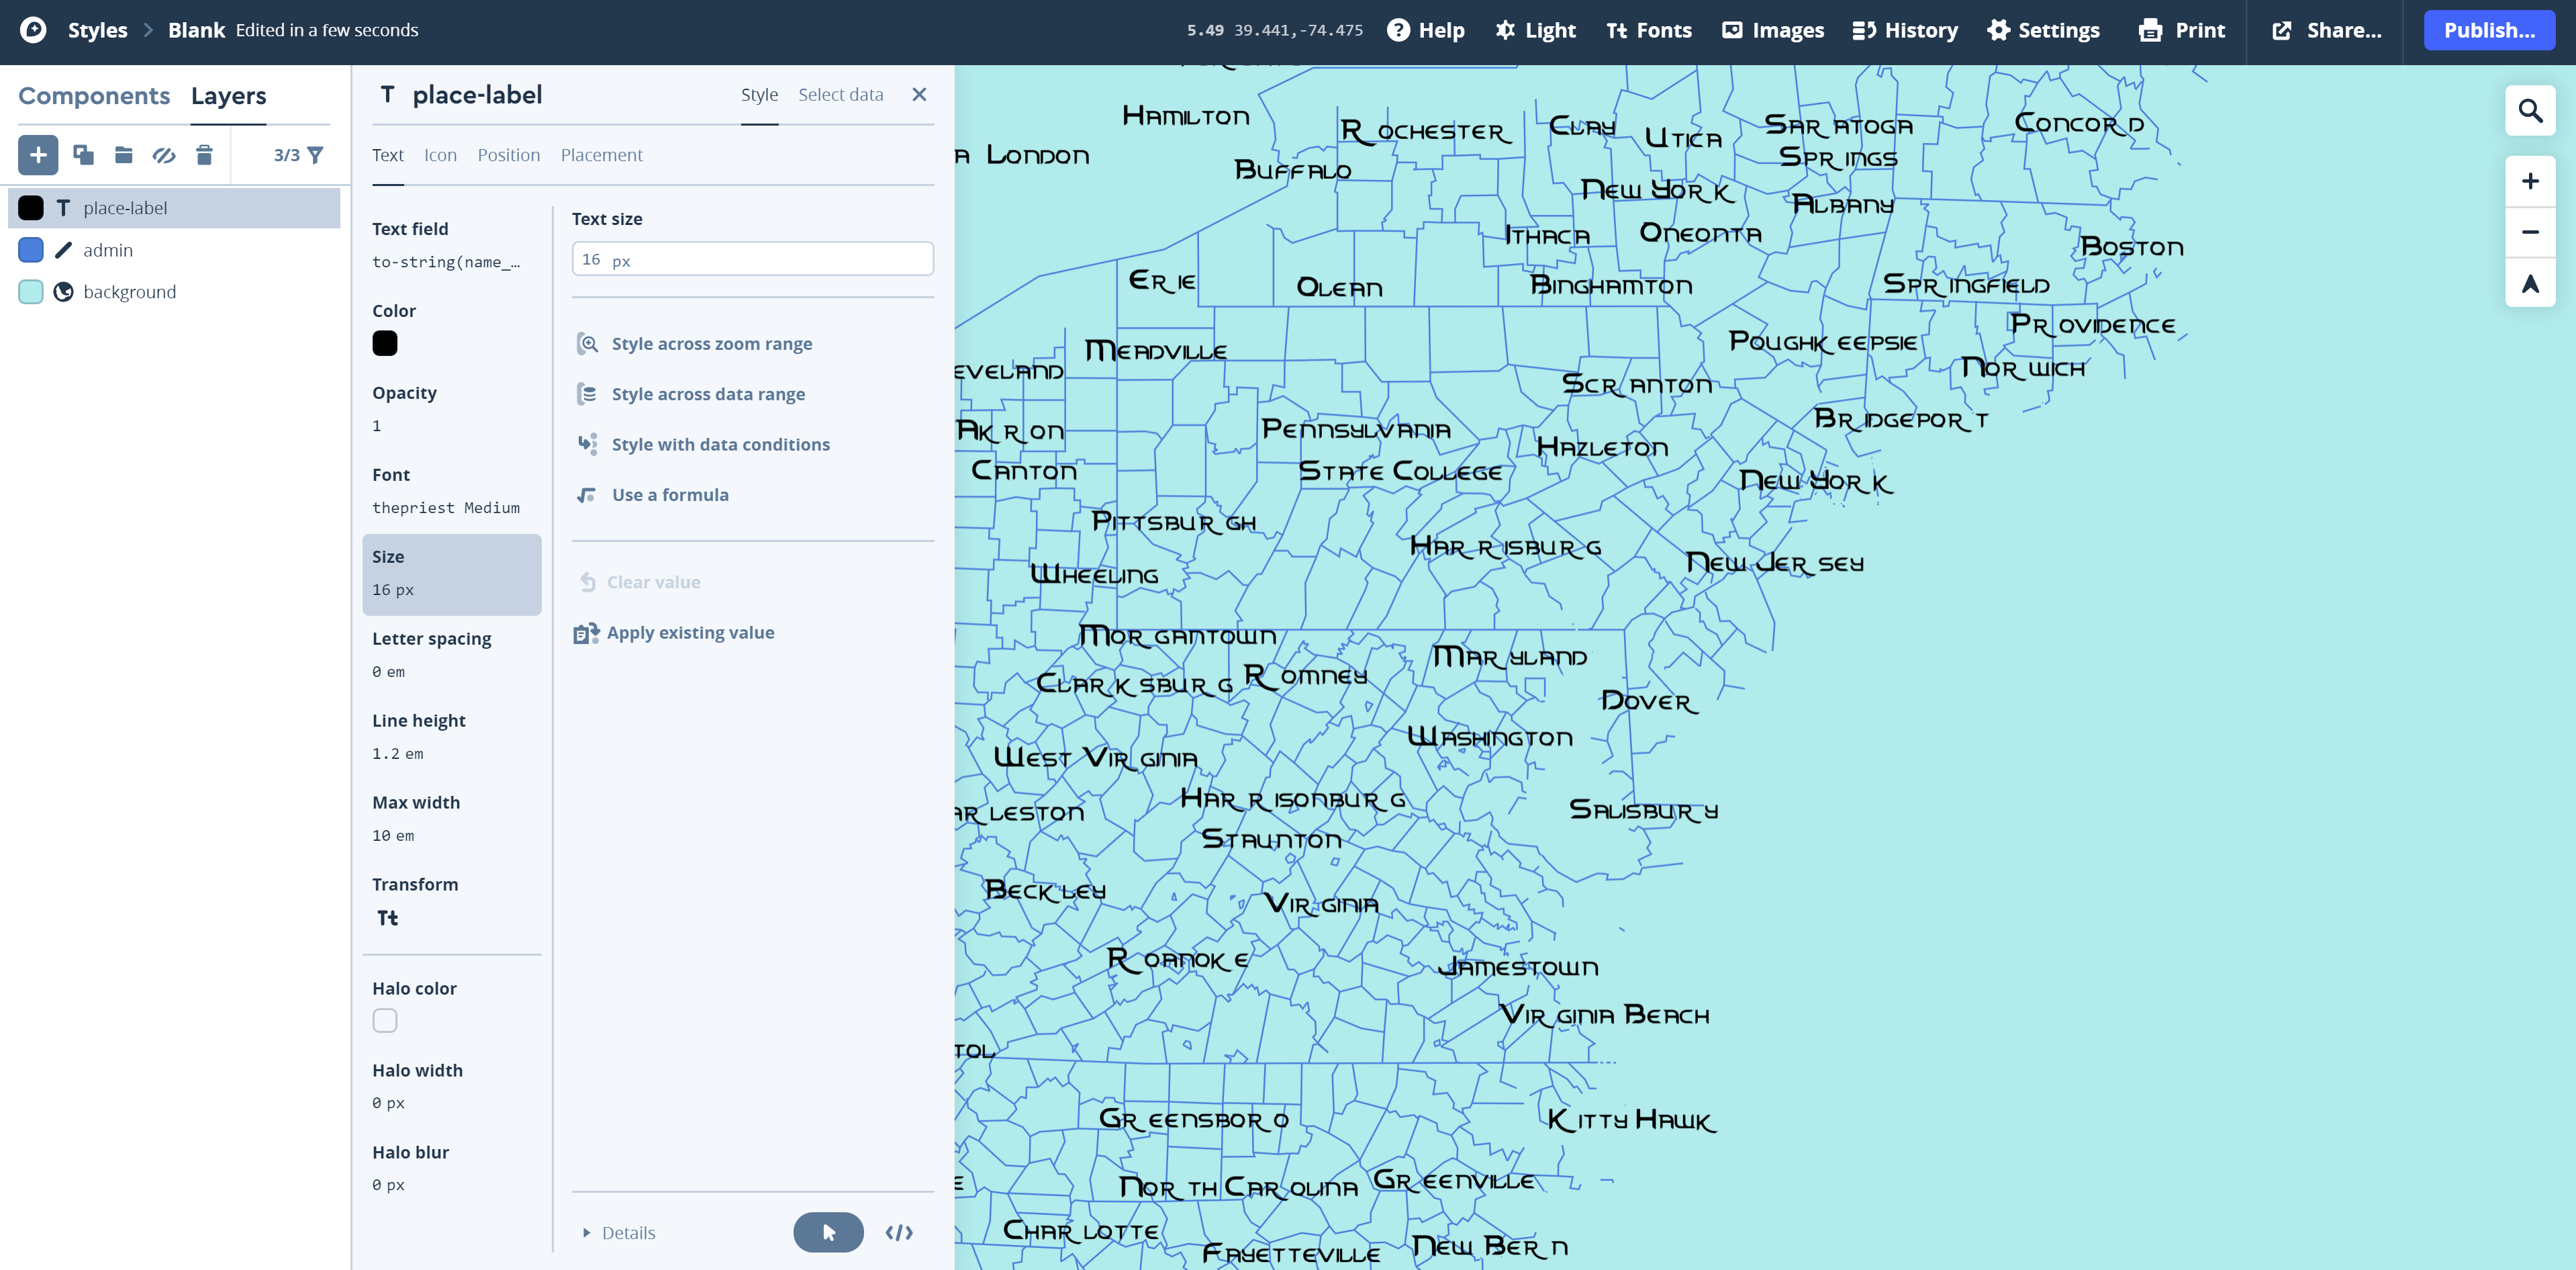 Visual Guide Figure 8.13. Changing style (here, font size) based on zoom range.
Style across zoom range permits you to alter the look and feel of a map symbol dynamically as the user zooms in and out of your map. Figure 8.13 shows that you can choose from different rates of change (e.g., linear - where symbols change gradually, or step - where symbols change abruptly at zoom levels you define). You don't have to do anything overly complicated - the goal is just to map your map look nice at small, medium, and large scales.
Tip! Look at other online interactive basemaps (e.g., Google Maps), as well as the Mapbox examples listed at the top of this guide for ideas about what symbols should appear at which scales, and how they might look best.
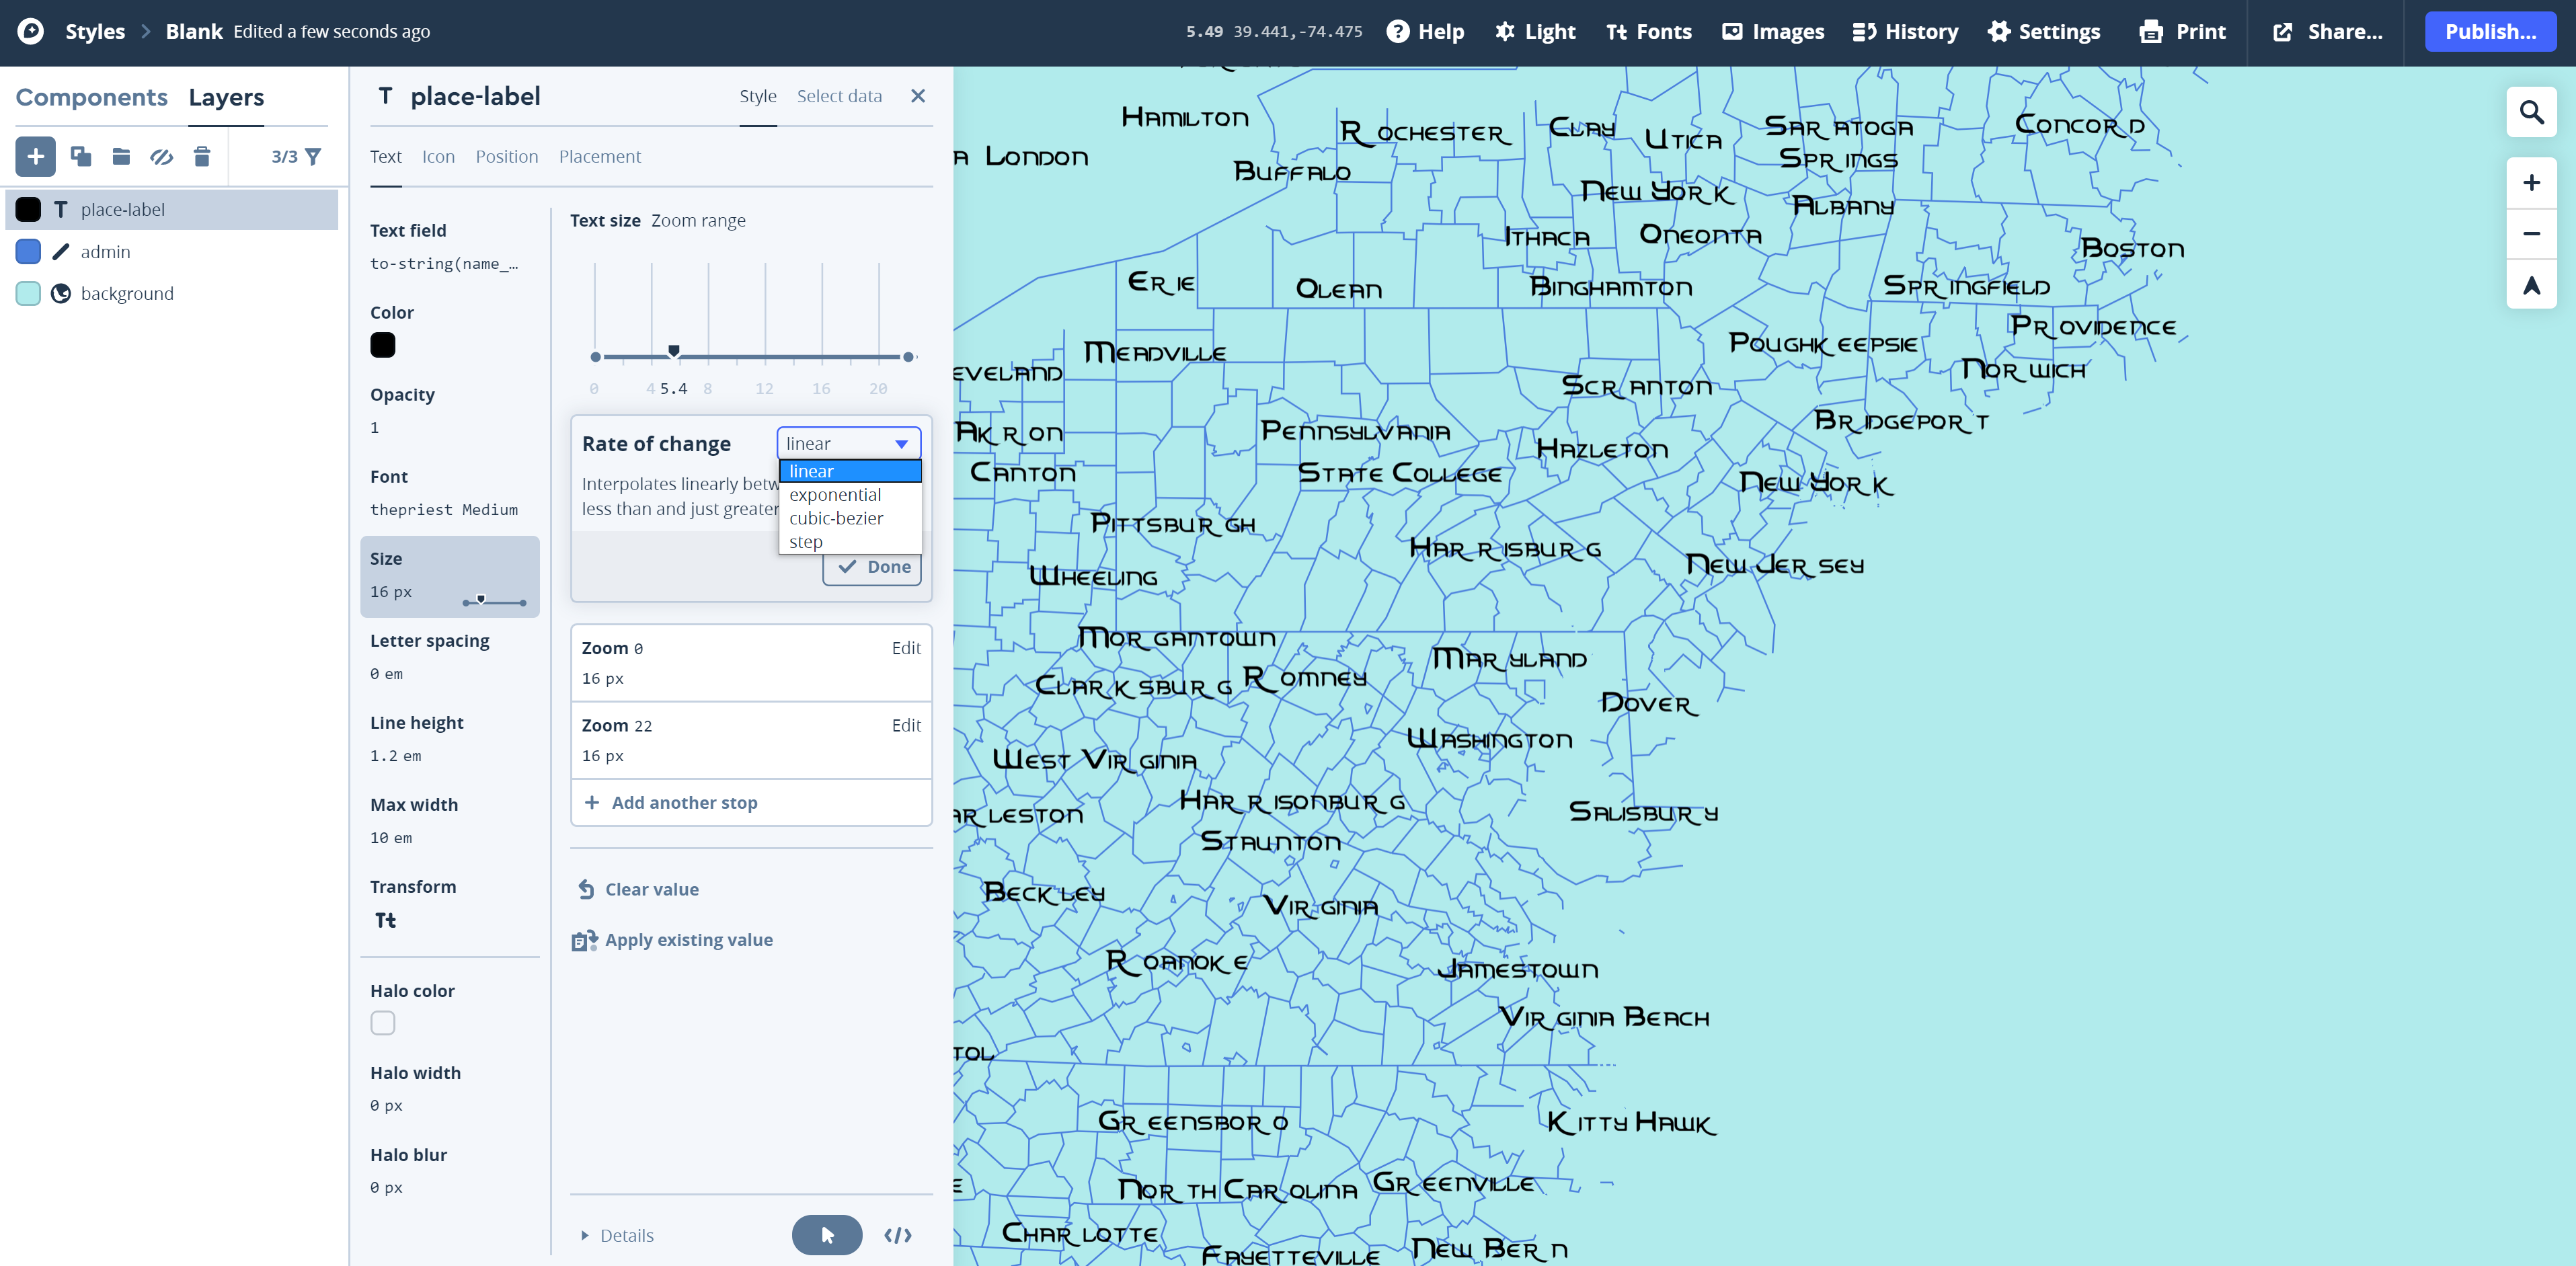 Visual Guide Figure 8.14. Linearly changing font size through zoom levels.
In addition to styling your layers based on the zoom layers, there is another type of condition you should utilize: the type of feature. Some layers contain contain multiple types of features - road is a prime example. Mapbox permits you to style features differently based on a data condition. In this example (Figure 8.15) roads with the class "primary" are assigned to be sized larger (2 pt.) than those with the class "secondary" roads (0.75 pt.). This weight difference is very similar to when we used TNMFRC codes (e.g., " 1 = Interstate," " 4 = Local Road").in ArcGIS Pro to assign different road types to label classes, and sized the labels based on their classification.
It is important to note that the naming convention of the different types of roads in Mapbox does not necessarily follow what you are accustomed to with interstate, secondary roads, and so forth. You should explore the different naming conventions to make sure you understand to what each class refers. This page may be of some use to you as you explore the different classes of roads.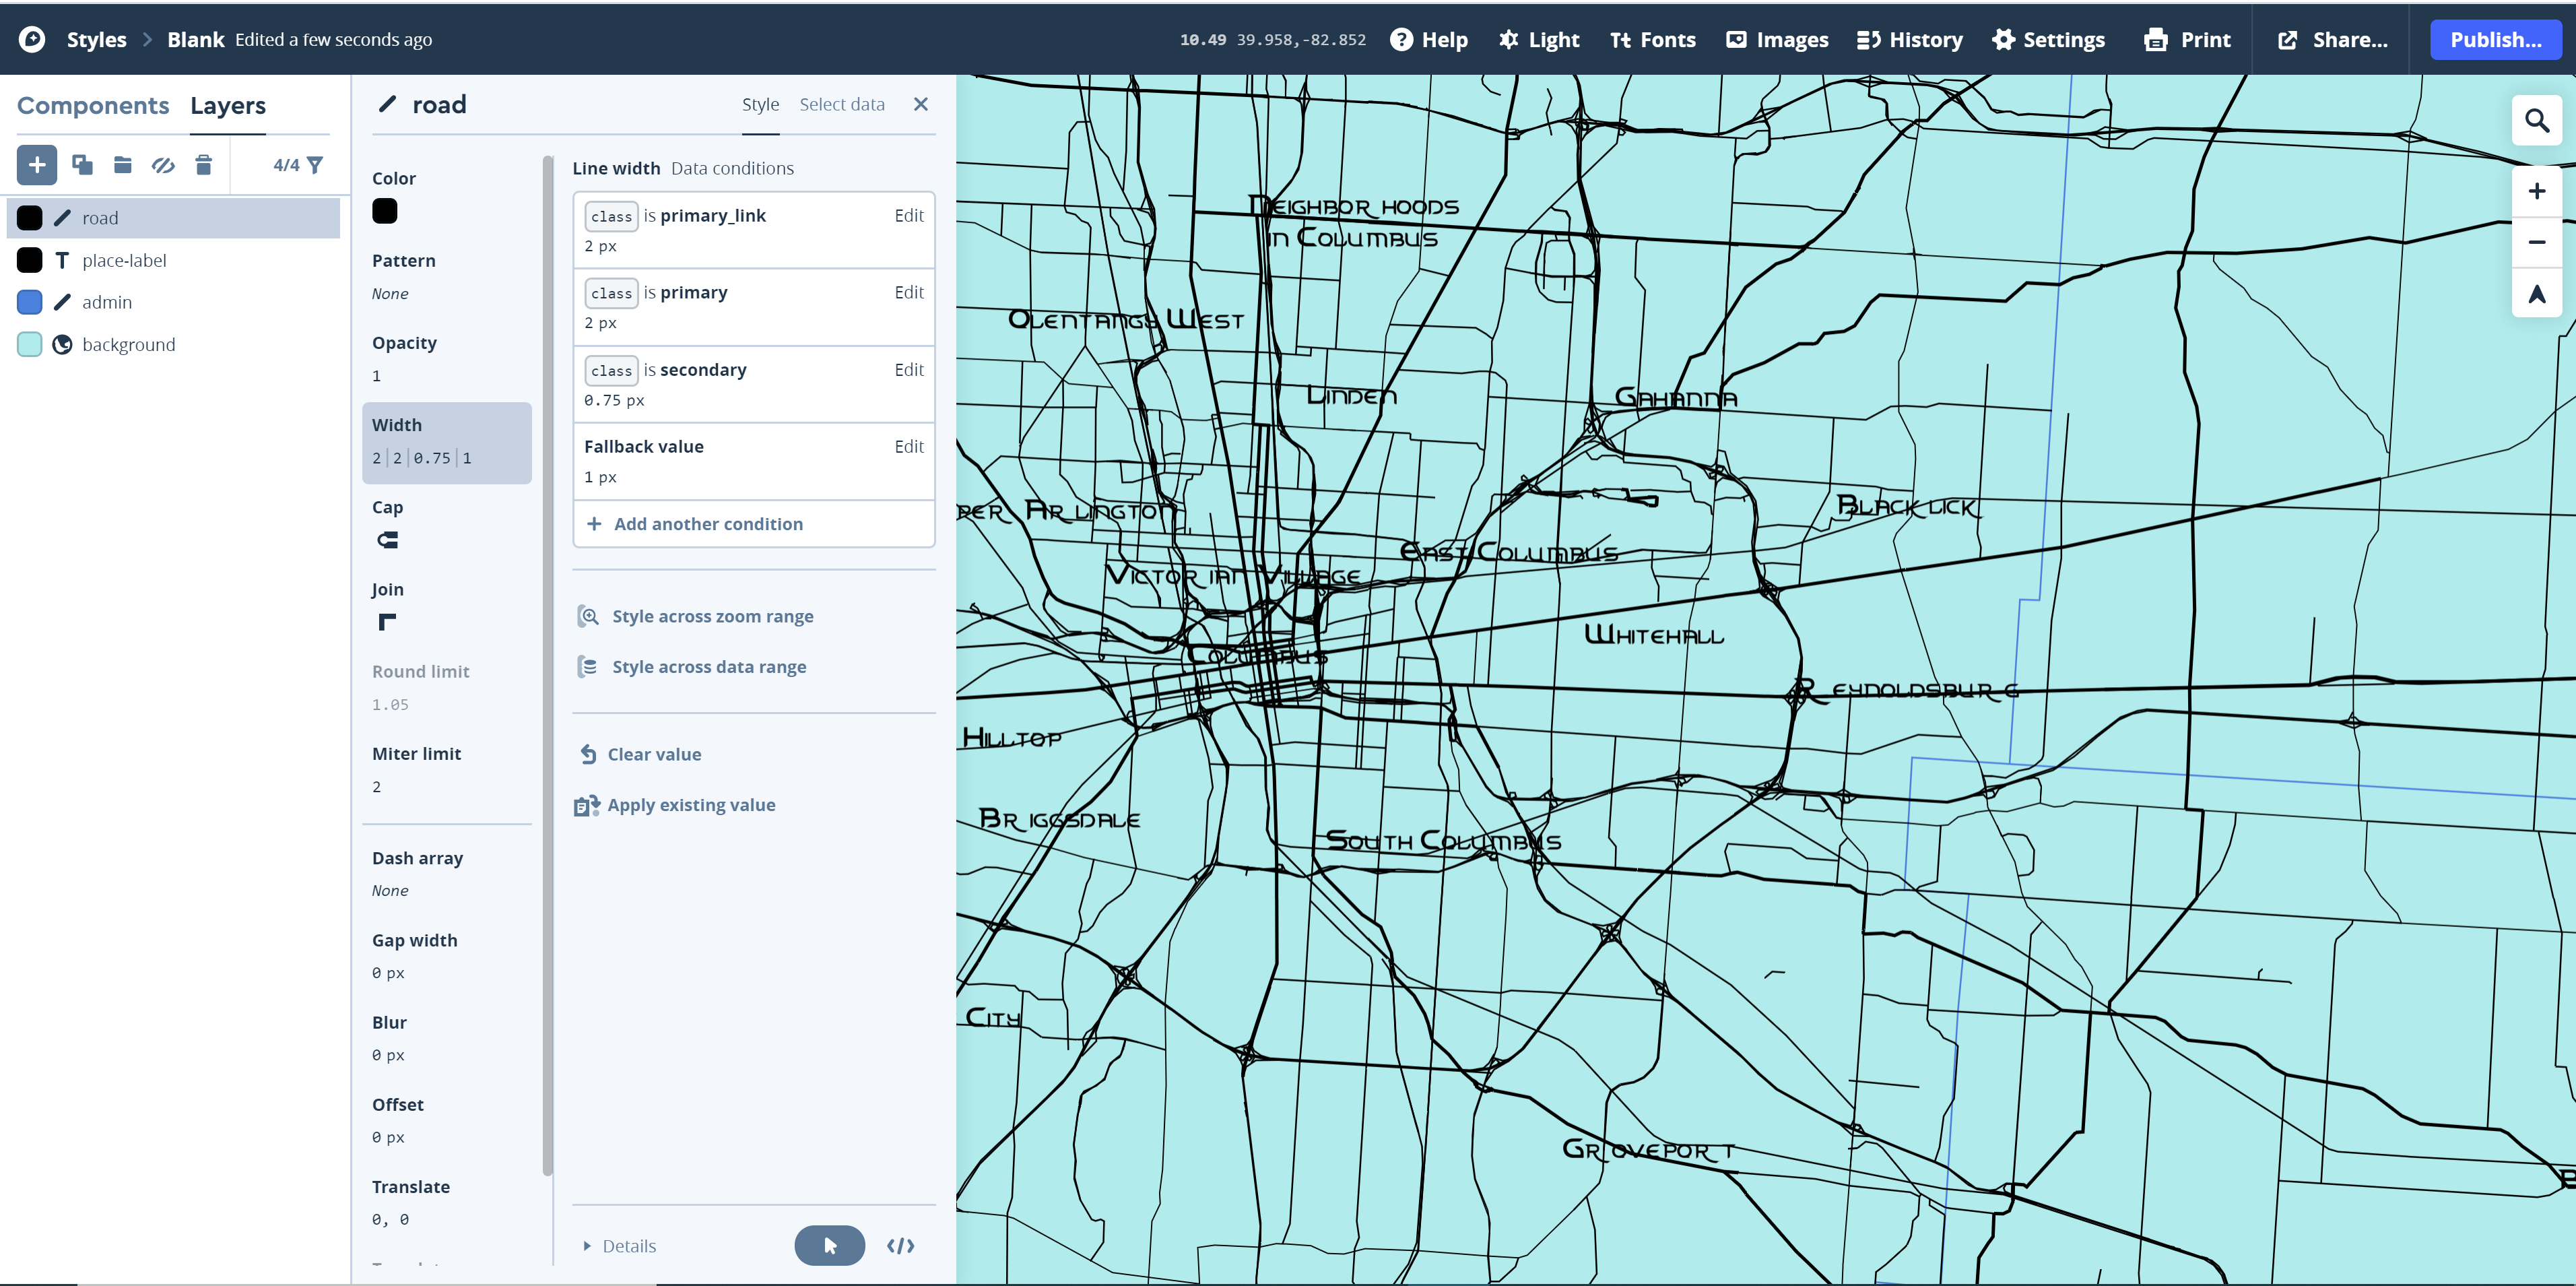 Visual Guide Figure 8.15. Sizing roads based on their classification in the Mapbox Streets data.
 -
Labeling Roads and More
Once you have added roads, buildings, etc. you will want to add additional labels to your map. We previously added the place-labels layer to our map, which is a layer intended just for labeling. However, we can also add labels using other layers. To label roads, for example, add another instance of the road layer using the "+" button, but this time select Symbol as the Type instead of Line (the default). See Figure 8.16.
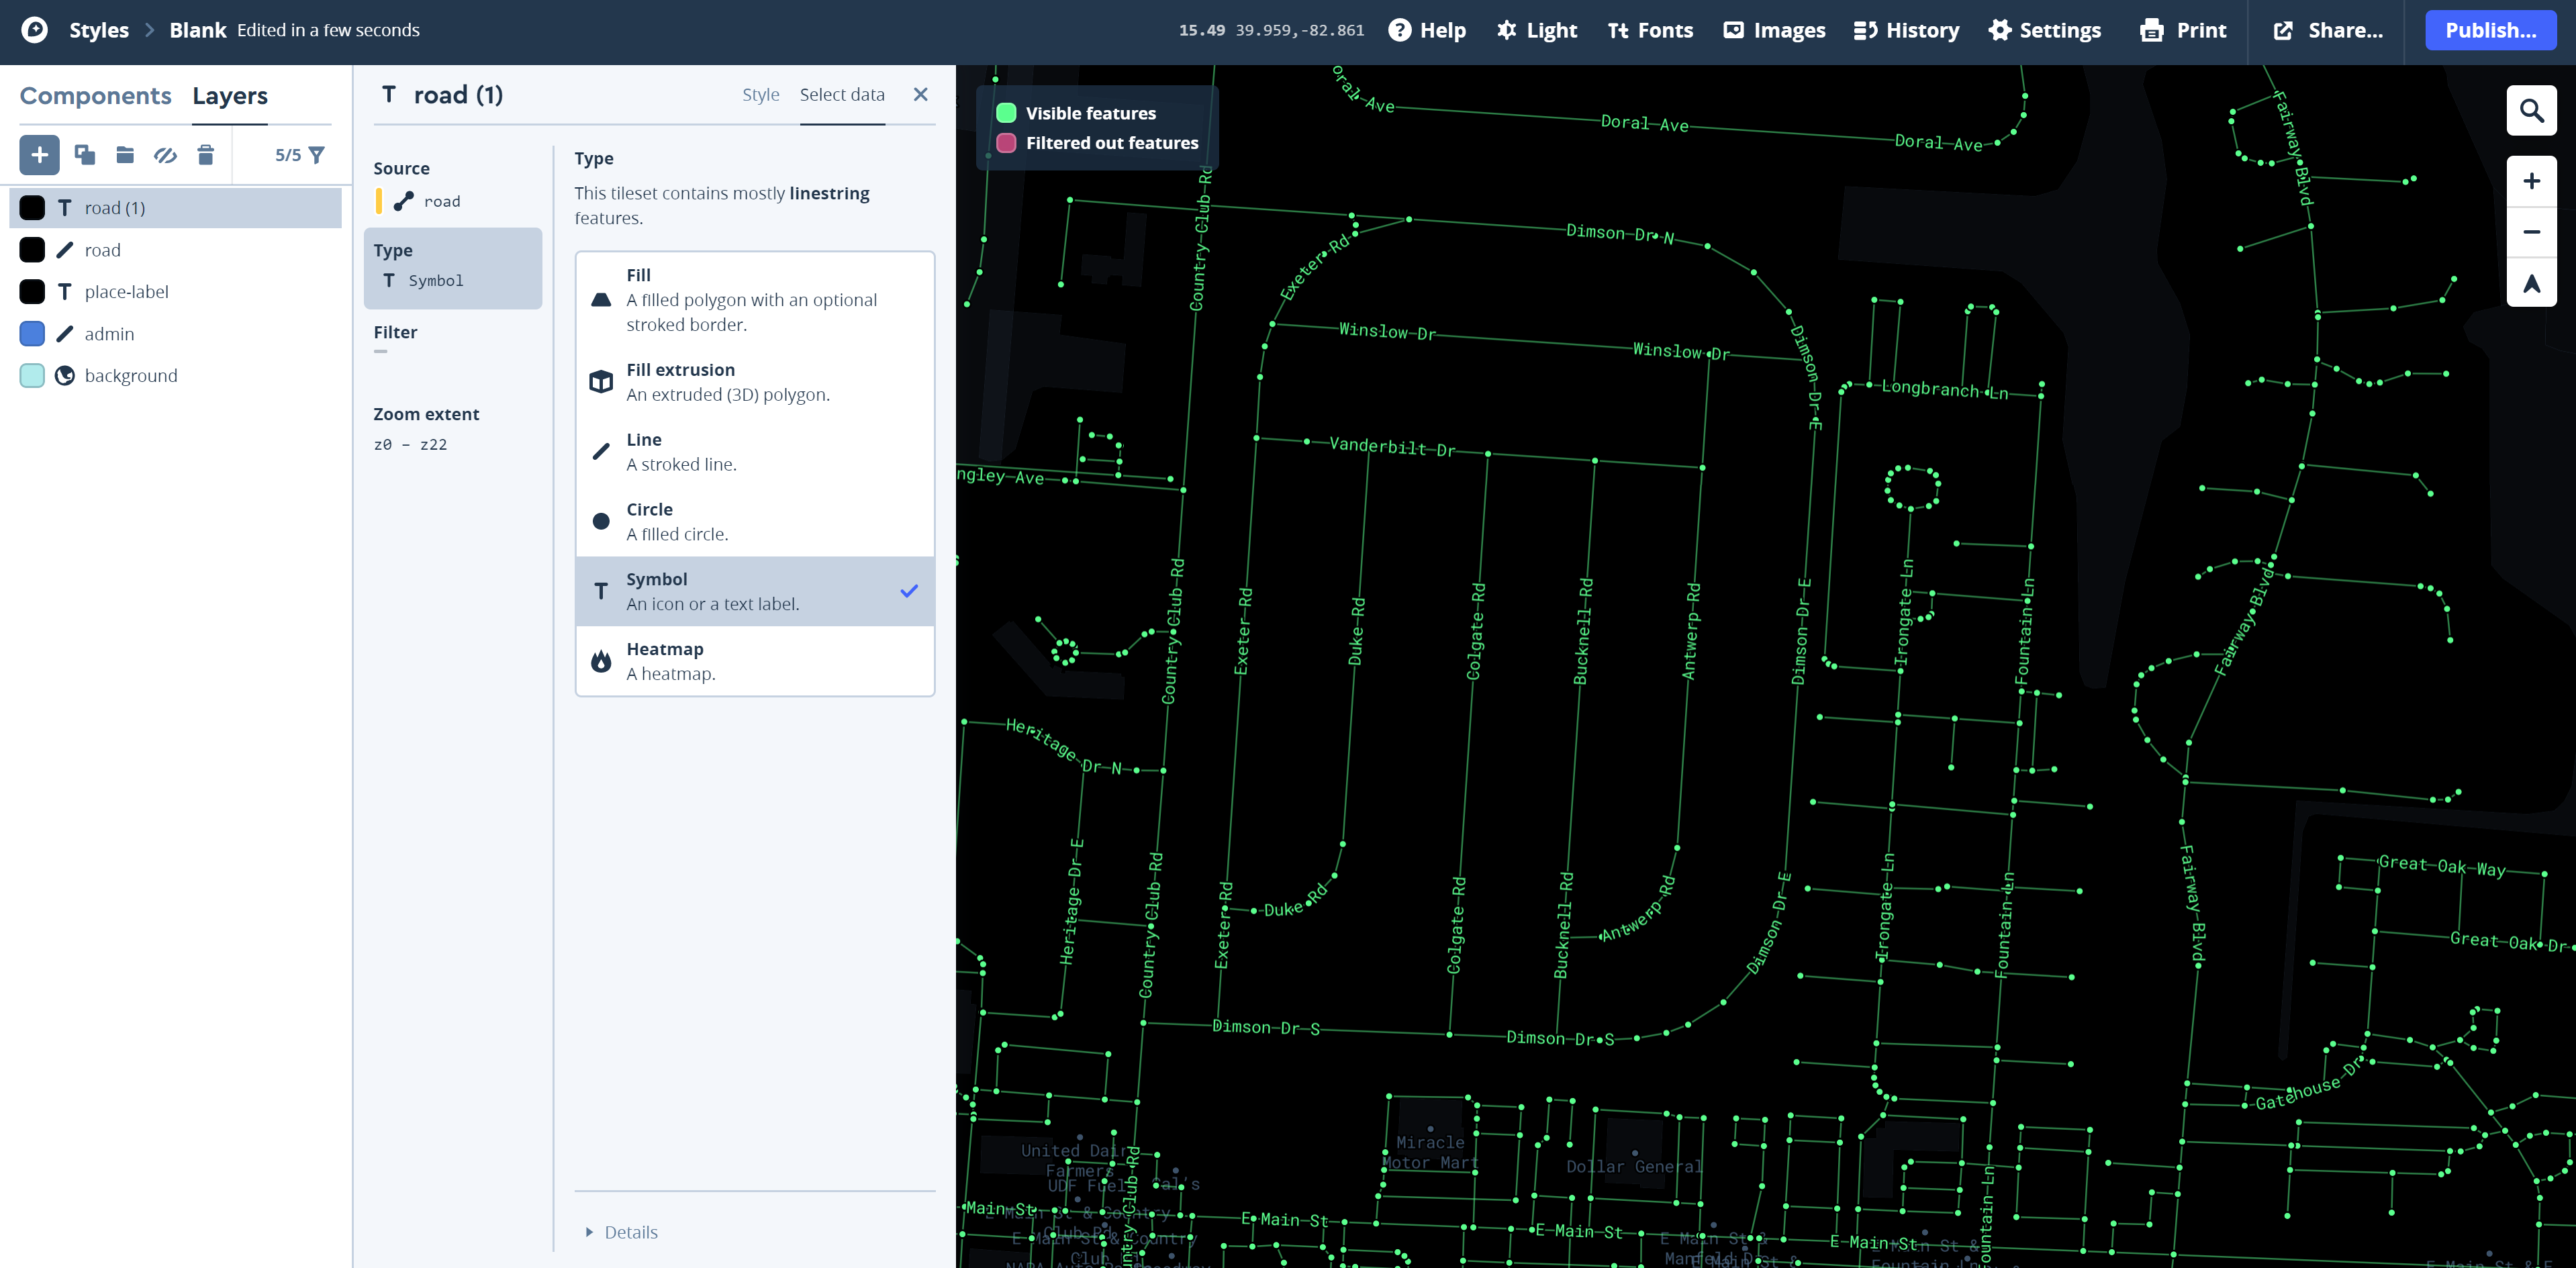 Visual Guide Figure 8.16. Adding a label layer for roads.
 -
Adding and Styling Terrain
Most of your layers will come from the Mapbox Streets source, but you should also add one terrain layer. Just as in Lab 6 (terrain visualization) you should use transparency and layer ordering to establish your terrain visualization effective. As usual, you want the terrain layer to be visible, but not visually overwhelming. You can drag and re-arrange layers in the left pane of Mapbox studio just as we did in ArcGIS Pro. Note that the design shown in Figure 8.17 is not that good. You can do better!!!
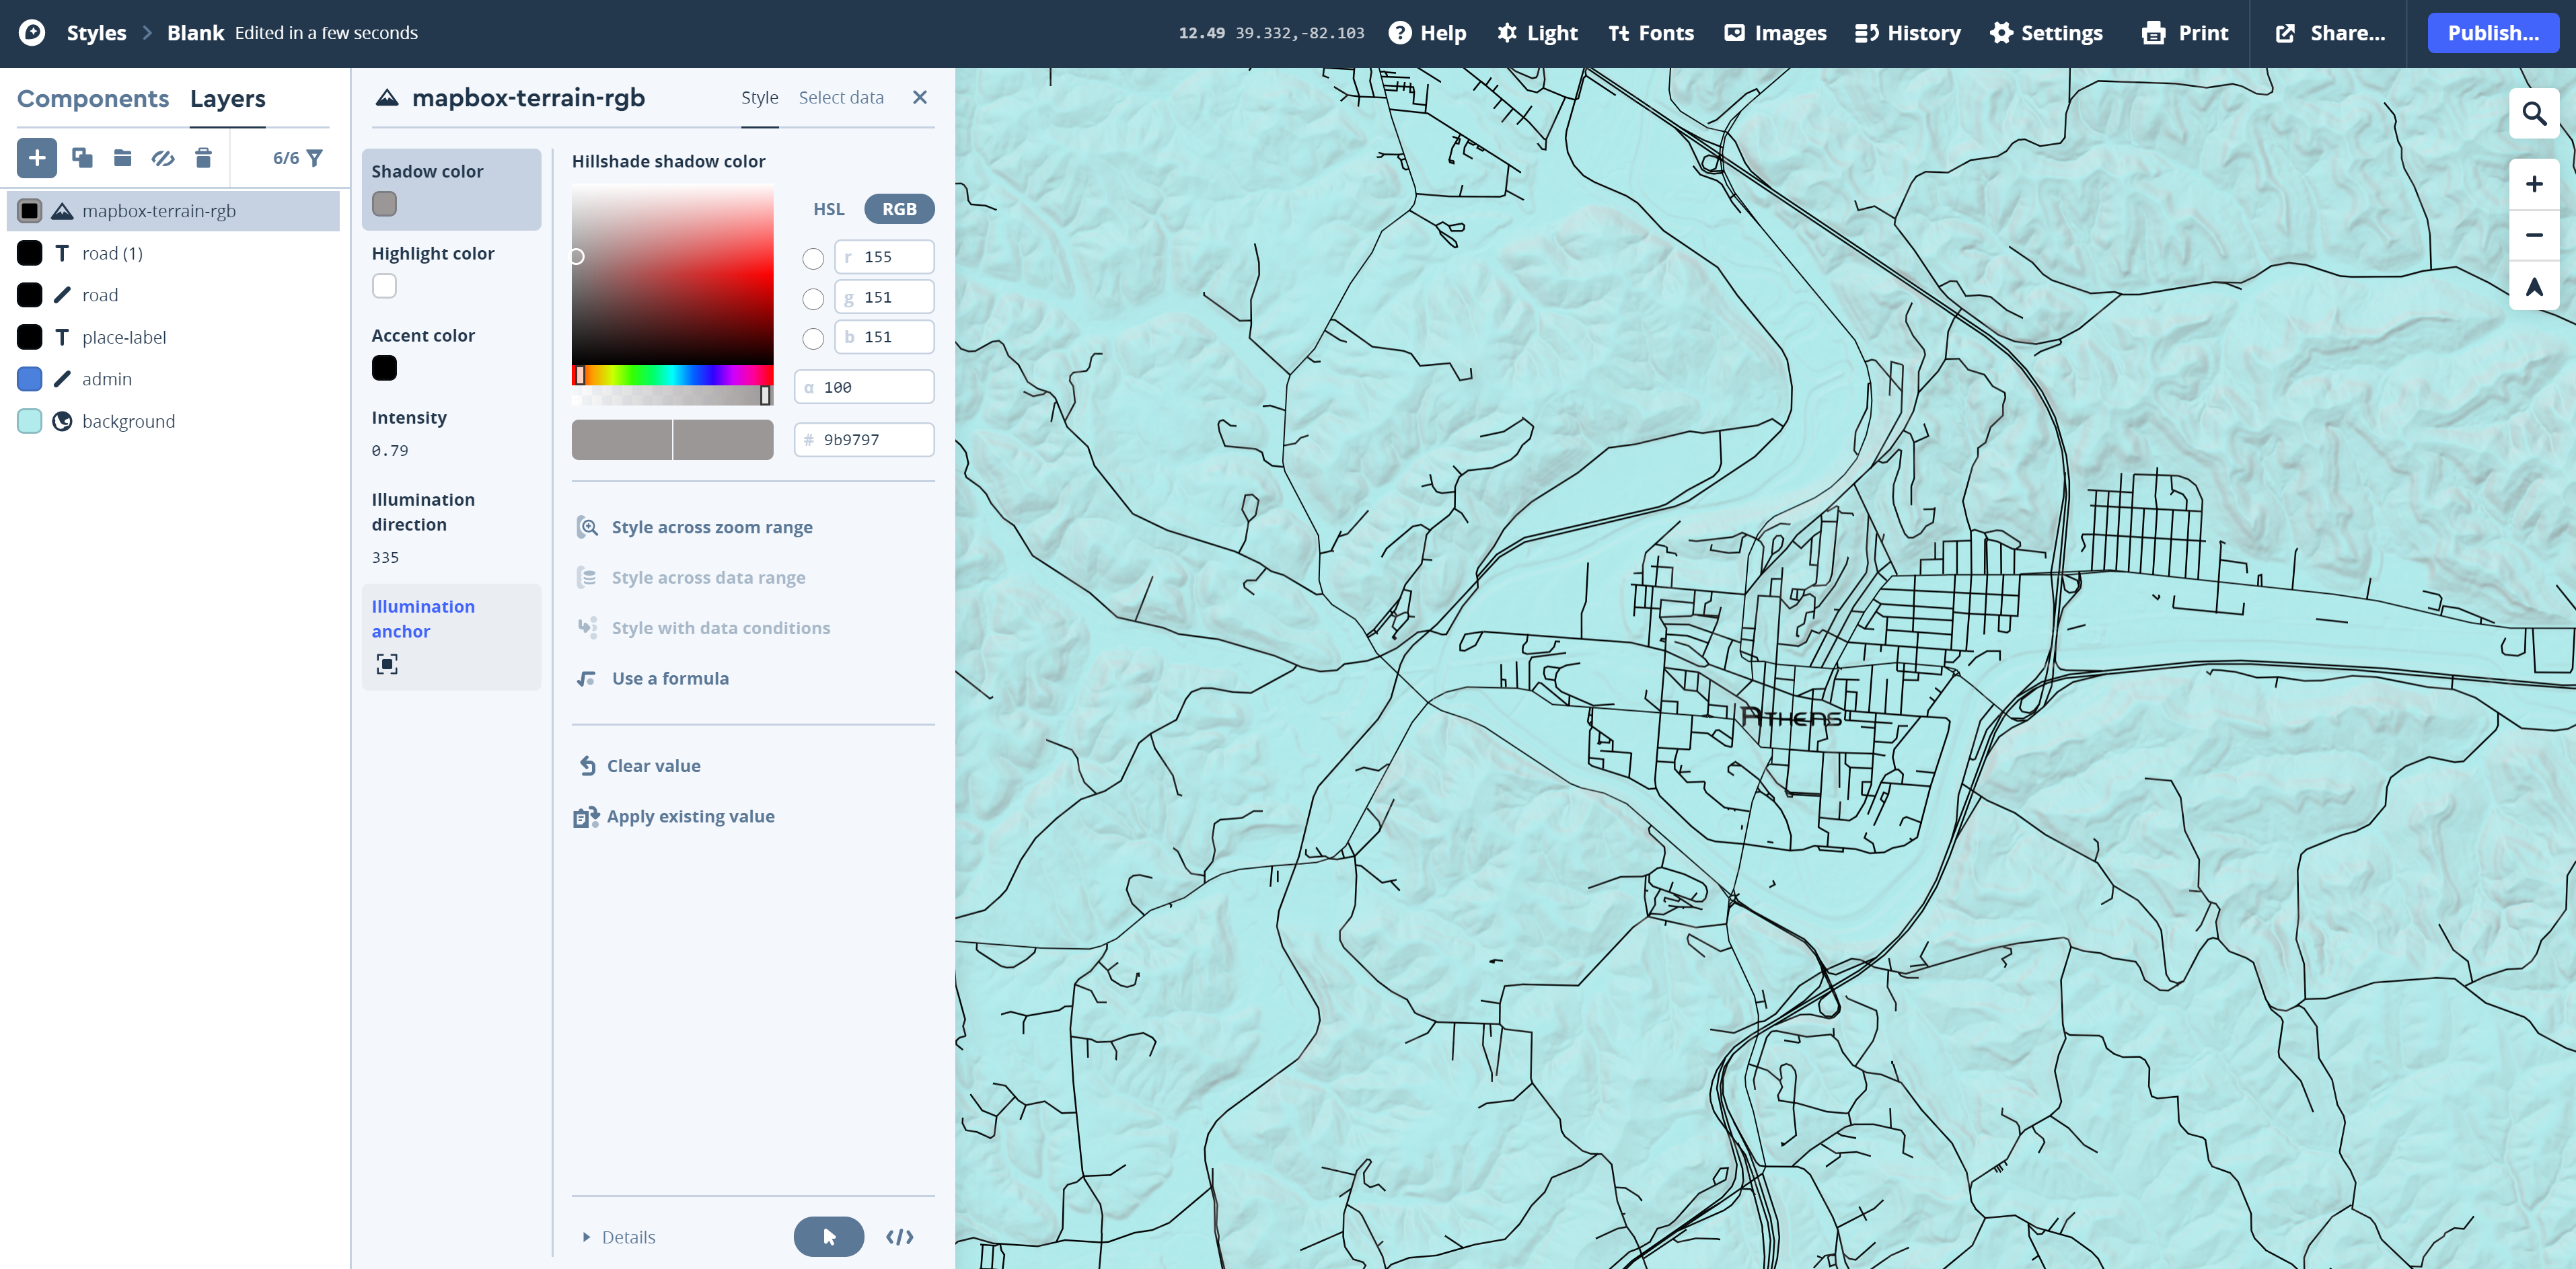 Visual Guide Figure 8.17 Symbolizing terrain in Mapbox studio - here, terrain is moved to the bottom layer, and transparency is added to layers above so that it is visible but pretty ugly.
 -
Additional Tips and Video Tutorial Links
As this is likely to be your first time using Mapbox Studio and the interface is different, take your time to become accustomed with how Mapbox works. For more practice, you might want to run-through an online tutorial such as Mapbox's Create a Custom Style Tutorial. Though this will be informative and helpful, you should still follow this guide and start from blank, rather than using a pre-made Mapbox template or the color suggested in an online tutorial.
Here is a video tutorial on how to filter what appears on your Mapbox creation.
Here are a series of video tutorials on some basic manipulations in Mapbox by a fellow colleague of mine: Ian Muehlenhaus.Map design is an iterative process and it may take time for you to get a design you are happy with - be patient with yourself and remember to draw ideas from other maps, your media/art inspiration, and course content.
Credit for all screenshots is to Fritz Kessler, Penn State University. Screenshots and data from Mapbox Studio.