Background Information
Land Cover Datasets
Land cover data represents continuous measurements from satellites such as Landsat, Sentinel, and MODIS. Raster products derived from satellite data, such as the National Land Cover Dataset (NLCD), are commonly used to study how much of a region is covered by forests, wetlands, impervious surfaces, agriculture, and other land and water types. We used an NLCD dataset updated in 2021 and created in 2019 in Lesson 2. NLCD is a national dataset with information on land cover for a given time period for all areas in the U.S. Each grid cell represents a particular land cover category and was derived from classification algorithms that processed Landsat satellite imagery. Currently, there are eight NLCD datasets that represent 2001, 2004, 2006, 2008, 2011, 2013, 2016, 2019, and 2021 (2021 released in 2023). The NLCD is one of the most commonly used land cover datasets since it is available for such a large area and at multiple time periods.
Land Cover Change - Urban Sprawl
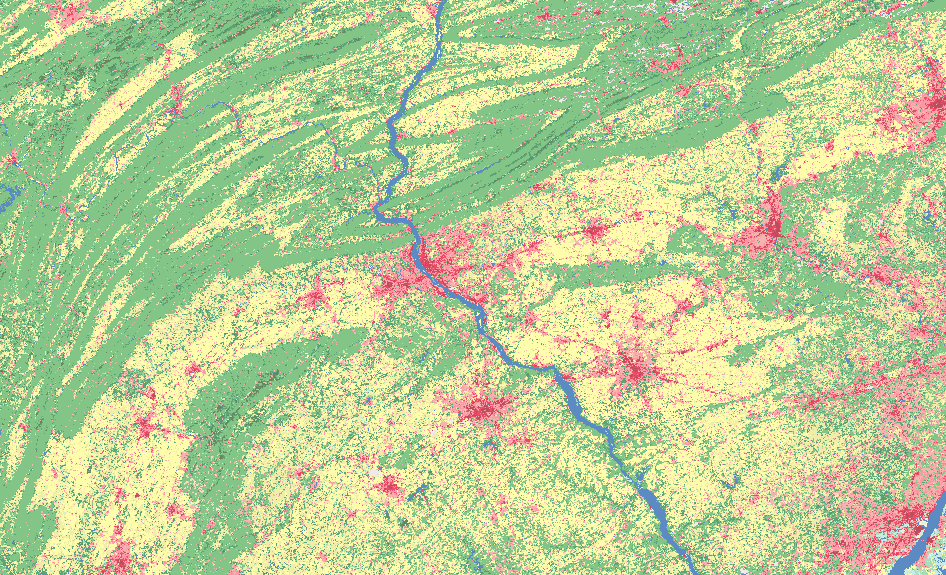
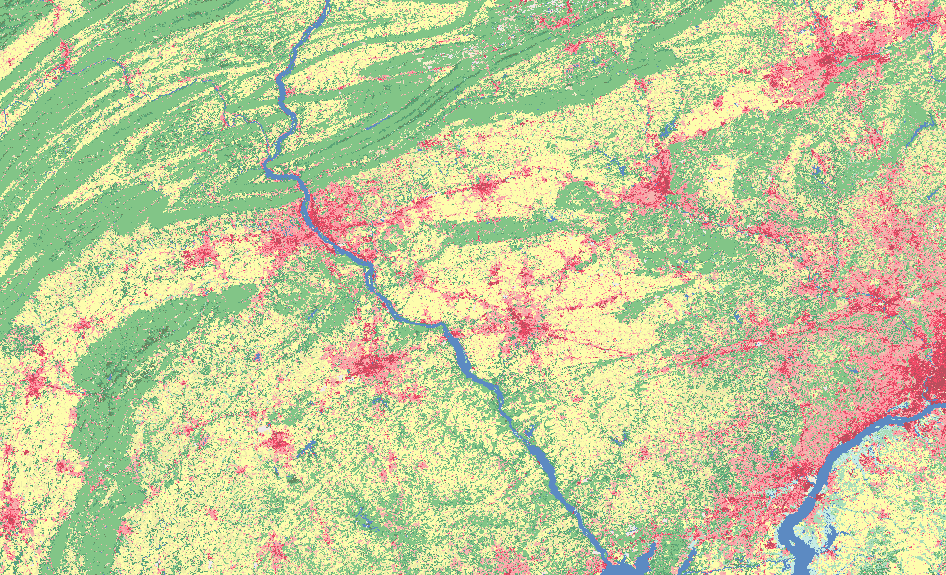
Land cover change is a common issue that has a wide range of environmental implications. Land cover will be an important driver of climate change in the next century. Some reasons for this are the increase in impervious surfaces and the reduction of agricultural and forested areas, which reduce the uptake of CO2 by plants. By reviewing Figure 1, it is easy to see the effect of urban sprawl, even over just a fifteen-year period. The increased amount of red and pink cells (which represent developed area) you see in the 2016 data highlight the urban sprawl that is taking place. During urban sprawl, areas that were previously covered in forests, grasslands, wetlands, etc., have become developed areas.
The reduction of agricultural and forest land due to the spread of low-density, single-use development into rural areas can increase air and water pollution. The loss of these lands affects human health, biological stability, wildlife habitat, and long-term sustainability. The disappearance of agricultural lands can also impact food security by reducing the amount of available food for the immediate area. This will most likely drive up prices, which will affect the overall economic health of that area. Forest loss will reduce the habitat for native species, which will cause them to encroach in urban areas and possibly result in population reductions or even extinction in that area.