Part II: Imagery and Land Cover Data
-
Explore Imagery & Create Map
- The first dataset we will explore is offered as a basemap in ArcGIS Online. Log in at Penn State AGO Organization using the Sign In link at the top (if you are not already logged in).
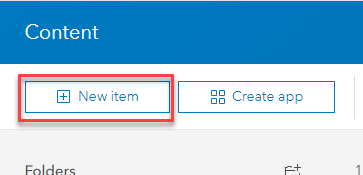
- Click on the Content tab
 .
. - Select the +New item button.
- Add the Lesson 2 Study Boundary.
- Download the L2Data.zip file from the Lesson Data tab on the main course website if you have not already done so. Be sure to keep the data zipped and follow the folder naming directions specified on the page. You will likely experience trouble later in the semester if you choose to use a different pathname.
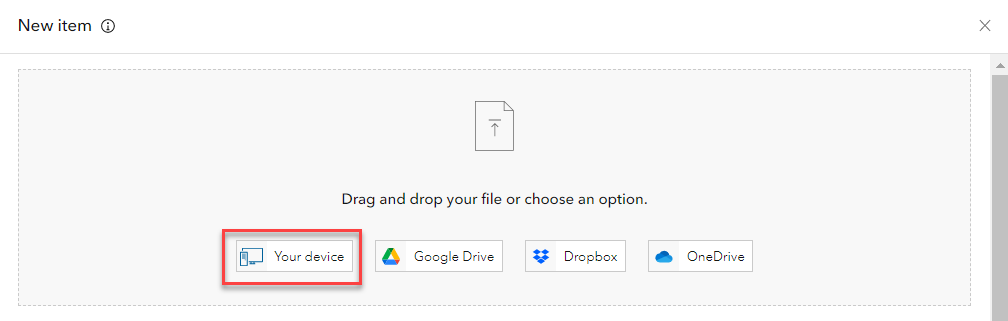
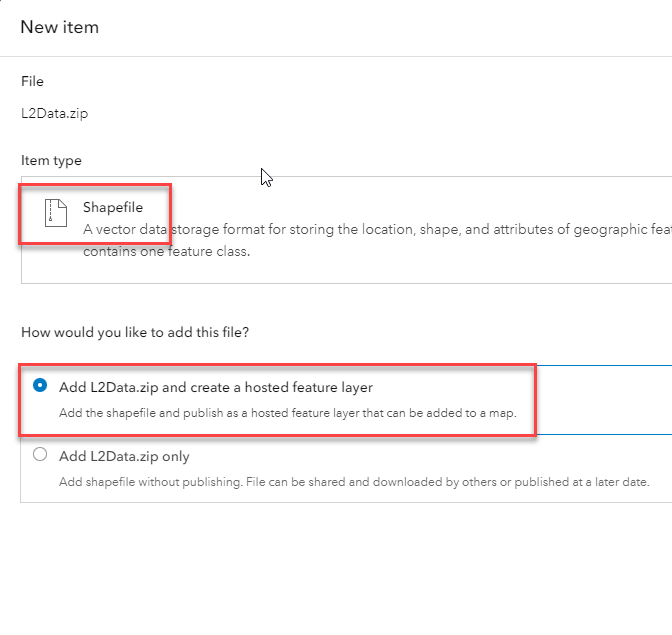
- Click Your device and then browse to the L2Data zip file. The item type is a Shapefile. Select the "Add the L2Data.zip and create hosted feature layer" radio button. Click Next.
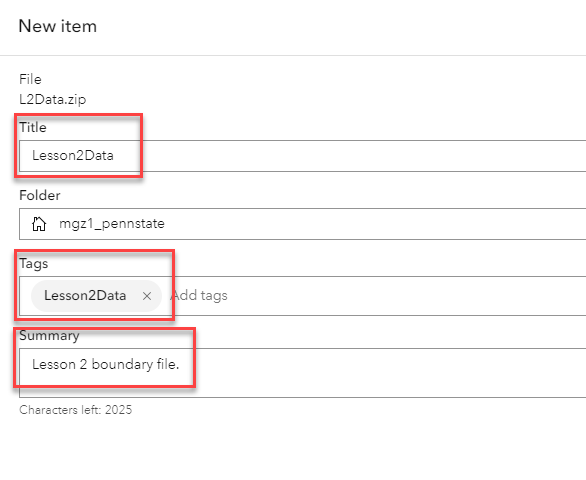
- Add a Title, Tags, and Summary description of the Lesson 2 study boundary file. Click Save.
- You will be redirected to an overview of the Lesson2Data shapefile. Verify and add relevant information.
- Click on the Open in Map Viewer button.
*Alternatively, you can select the Map tab to create an Untitled map in Map Viewer. Select Add a layer, navigate to My Content, and select "Lesson2Data" to add the Feature Layer.
- An "Untitled map" in a Map Viewer will open with the "Lesson2Data" added as a Feature Layer.
- Click on the "Lesson2Data" layer name to open the layer Properties along the right side. Click on Edit layer style under Symbology.

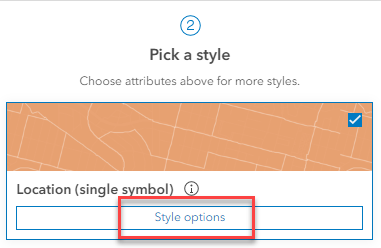
- Under #2 "Pick a style" select Style options.
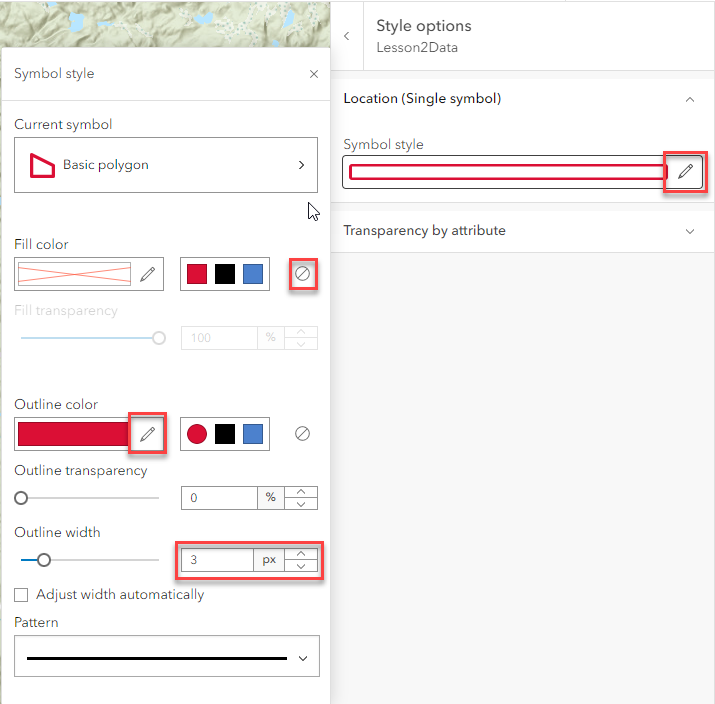
- A dialog box will open that allows you to change the symbol style of the features in the layer. Click on the pencil to change the style of the "Symbol" of the Lesson 2 study boundary to a hollow red outline. Select the "X" to close the window when your symbol style selections have been made, and click Done two times to exit the Styles options.
- Click on the Options icon "…" after the file name in the Table of Contents, then "Zoom to" to center the Map on the study area.
- Save your Map by clicking on Save
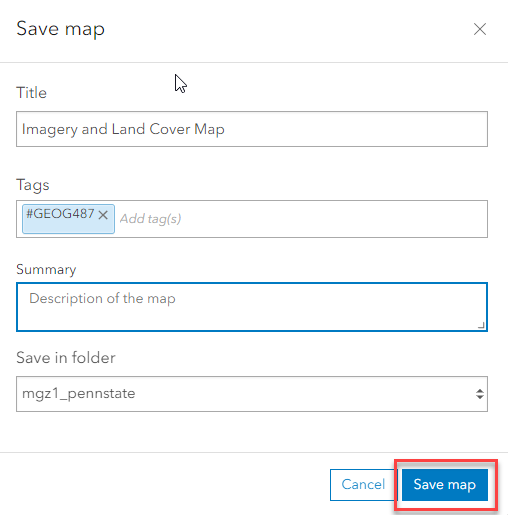
 > Save As. Note: It's a good idea to save often, just in case you lose your Internet connection or other unforeseen mishaps occur. Change the title to "Imagery and Land Cover Map," add tags for the class and your name, and write a summary of what the Map shows. The folder's name will default to match your login name (so it won't match the graphic below).
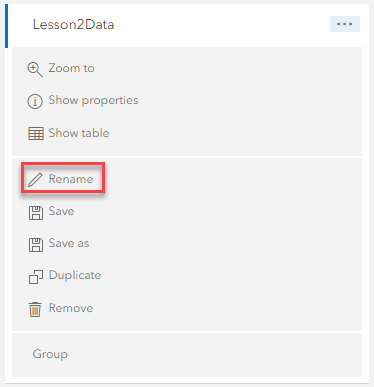
- Change the name of the Lesson2Data layer to "Study boundary" in the Table of Contents. To do this, click on the "…" after the layer name, then "Rename." Save your Map again to lock in your changes.
Note: Data layers often have default names that will be meaningless to most people who read your Map (like your boss and clients). Make sure you review layer names and change them, so your maps make sense to people other than yourself.
- Explore the surrounding area using the zoom and pan functions. To zoom, use the mouse wheel. To pan, left-click your mouse, hold it down, and then drag your mouse in the direction you want to view on the Map.
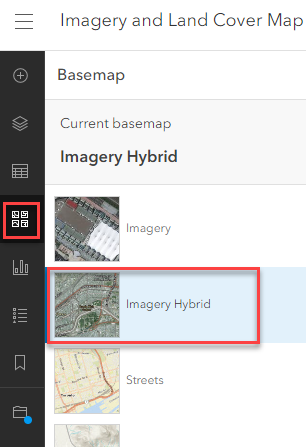
- Change the Basemap to "Imagery Hybrid."
- Explore the surrounding area again using the zoom and pan tools. Save your Map.

Which National Park is the Study Site near?
Which state(s) is the Study Area located in?
How much detail can you see in the imagery if you zoom in close?
-
Explore Land Cover Data & Add to Map
The second dataset we will explore is part of the United States Geological Survey (USGS) National Map. The land cover data service is hosted on their website and server. We can access the data in ArcGIS Online and by using their website (there are other options too).
- Let's start by exploring their website.
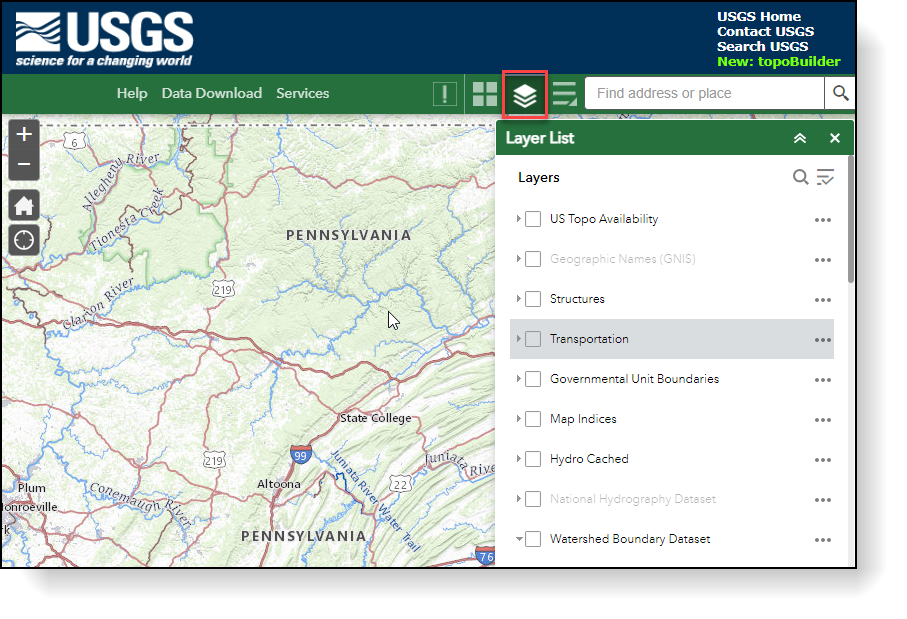
- Go to The National Map. Wait a few seconds, and the Map will automatically appear.
- Notice there are many datasets available in addition to Land Cover. Spend 10-15 minutes exploring the tools and datasets, as you will likely need to use these in many of your own environmental projects.
- Try to identify which layer or layers match the data sets we will add in this lesson. See the "Lesson Data" page for specific file names.
- Practice customizing the Map by turning layers on and off. You may need to click a button for the Map to redraw.
- Experiment with identifying the attributes of a vector data layer. Activate the vector feature layer by placing a check in the Layers List. For example, place a check beside the "Watershed Boundary Dataset" and "WBDLine" in the Layer List and then click on the Map to activate a pop-up containing attribute information.
- Look for tools or links to download datasets.
- Go to The National Map. Wait a few seconds, and the Map will automatically appear.
- Instead of downloading the data through the website, let's add the NLCD to our Map via ArcGIS Online. We can do this by performing a search. Search ArcGIS Online for the land cover dataset and add it to your Map.
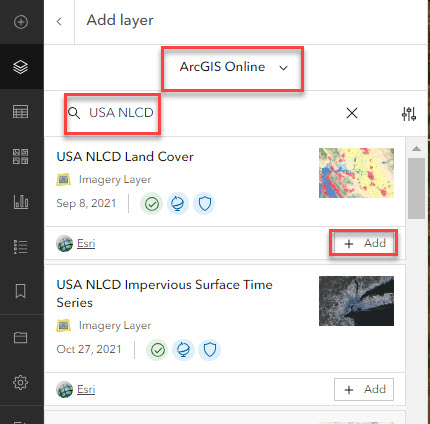
- Select Add layer
 and change the drop to ArcGIS Online. Enter "USA NLCD Land Cover" in the search, and you should see a service published by ESRI. Add the NCLD Land Cover time series layer to your Map.
- Select Add layer
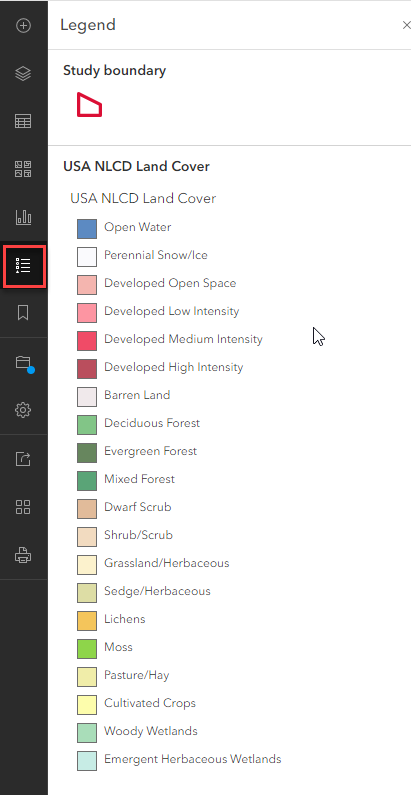
- Navigate back to the Map. Change the order of the layers if necessary, and click on the legend icon
 to show the Legend. Review the Legend so you can understand what the colors represent.
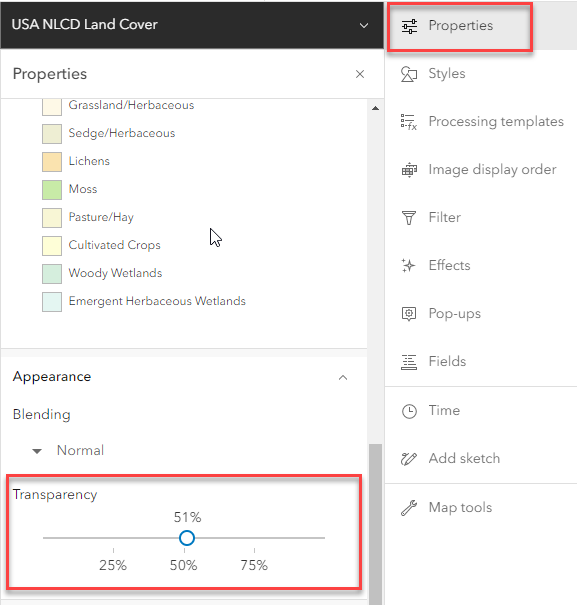
- Change the transparency to ~50% so you can see the imagery beneath it. You must click on the "Properties" top right to do this. You can also rename the layer if you would like. Do you remember how we did that earlier in the lesson?
- Explore the land cover for the study area using the zoom and pan tools. Click on the "X" to close the Legend.
- Save your Map.
After exploring the same dataset using ArcGIS Online and the online viewer provided by the data creation agency, can you think of any scenarios where one method would be preferable over the other?
- Let's start by exploring their website.