Final Project: Lead a GIS Team
Final Project Overview & Checklist
Final Project Overview
Scenario
You are a GIS Manager for a non-profit environmental organization where you lead a small team of GIS Analysts. A pre-proposal your organization submitted for a funding opportunity made it past the first round of review. You received an invitation to present your proposal to a panel of reviewers, who will choose between your organization and a pool of competitors for the project award.
Your job is to design a GIS work plan, summarize it in a visual presentation, and convince the panel of judges that your team is the best choice. Your role as a leader is to think through the potential opportunities and obstacles, provide a vision for your team to implement and bring in the project.
At the successful completion of the Final Project, you will:
- apply concepts and tools from previous lessons;
- design a Visual GIS Work Plan;
- consider your target audience and their requirements;
- persuade a client to hire you and your GIS team.
 |
 |
|||
Questions?
If you have questions now or at any point during this lesson, please feel free to post them to the Final Project Discussion.
Checklist
This lesson is two weeks in length and is worth a total of 200 points. Please refer to the Course Calendar for specific time frames and due dates. To finish this lesson, you must complete the activities listed below. You may find it useful to print this page out first so that you can follow along with the directions. Simply click the arrow to navigate through the lesson and complete the activities in the order that they are displayed.
- Read all of the pages listed under the Final Project Module. Read the information on the "Background Information," "Required Readings," "Approach," and "Summary and Deliverables" web pages.
- Review the required readings and videos. See the "Required Readings & Videos" page.
- Create and submit deliverables. Specific instructions are included on the "Summary and Deliverables" page.
- Review another student's project. Specific instructions are included on the "Summary and Deliverables" page.
- Optional - Check out additional resources. See the "Additional Resources" page. This section includes links to several types of resources if you are interested in learning more about the techniques or topics covered in this lesson.
If you have questions now or at any point during this lesson, please feel free to post them to the Final Project Discussion.
SDG image retrieved from the United Nations [1]
Background Information
Background Information
Spatial Problem Solving
-
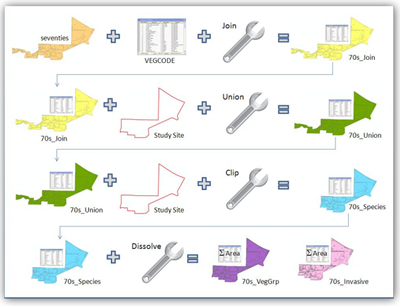
Seventies + VEGCODE + join = 70s_Join
-
70s_Join + Study Site + union = 70s_union
-
70s_union + Study Site + clip = 70s_species
-
70s_species + dissolve = 70s_VegGrp + 70s_Invasive
You have been applying spatial problem-solving skills throughout this course. In previous lessons, I provided step-by-step workflows illustrating how to use GIS to explore specific environmental scenarios.
Now, it is your turn to apply your spatial skills by designing a workflow from scratch. Workflow planning is not a linear process. It involves loops and iterations, and some dead ends along the way.
There are also multiple correct paths in GIS that will lead to the same end product, so you may need to think through a few different options. I find it easier to design a GIS workflow if I create a visual map of the process like the example shown here, from Lesson 3.
Designing a Visual Plan
Prezi.com is a great tool for planning complex processes. The program makes it is very easy to compile several ideas in one workspace, rearrange them into groups, and add more details later on as your plans solidify. Unlike Microsoft Word and PowerPoint, Prezi does not impose a linear order on your information. Another helpful feature of Prezi is the ability to include relative scale in your brainstorming map, so main ideas are larger than minor details. This approach makes it easier to break your analysis into several pieces, then focus on one piece at a time. With Prezi, you can also embed screenshots, videos, and other media to keep track of your ideas in a visual manner.
You may make a copy of a Prezi blue circles template [2] and then edit it for your own project. If you are not a Prezi fan, I also recommend Canva.com [3] or ArcGIS StoryMaps [4]. Canva is a cloud-based program that also allows you to map out your own ideas or use built-in templates. And, you will read more about ArcGIS StoryMaps in the required readings and videos section [5].
Video: How to Use Prezi (5:32)
Hello everybody. Welcome to a brand new tutorial. In this video, I will be showing you how to use a website called Prezi. And if you haven't heard of it, what it is is a zooming PowerPoint presentation type deal. So this is my personal account of Prezis I have made. So I just want to show you what all it can do and this is a good little example. I'm just going to click through it really fast. This is a project I did for a worldview class on Lord of the Rings with a couple of friends. So what it allows you to do is zoom around a background picture or a color, and move around. And this is basically what Prezi can do and zoom around to help get your point across and all that. It's often used in a lot of classes anymore as well as professional presentation situations. And it also allows you to add multiple photo layers. So when you zoom in further, you then enter a new photo layer of your background.
So without further ado, let's go ahead and get started. So, first things first, you will need to go to Prezi.com, you'll click the get started button, come over to the free account. When you have a free account then all your Prezis are publicly visible, you have no control over if it's private or not. I'm going to just fill this out. Once I am done, I will click "create your free public account". Once you have created an account, Prezi will show you the basics and you can continue editing the one they give you just for further playing around with Prezi. But to show you everything, I am going to create my own new Prezi and then a page like this will load and you can scroll through the ones they give you immediately. You can also look up more. I'm going to use this one. If you don't like any of the templates, you can start a blank Prezi. What they have here is a preset of where all your slides will go. You can also choose to move them elsewhere. Let's say you need more slides than what they give you, then you can add a frame just by clicking up here and it adds it right after whichever one you were just on, I think. But you can also rearrange the path. So if I want it to happen after it zooms out, then I can do that. I can edit the path. You can also have some form of animation happen just by clicking the edit path and then click on the star. You can apply a fade in effect but that is the only effect they give you, unfortunately. You're kind of limited effects-wise because most of the effects are from the zooming in and around and out and whatnot. So I'm going to be done editing the path. You can add text. This type of online presentation stuff is pretty easy to use. You can insert an image, you can insert symbols and shapes, you can even insert YouTube videos. You can add layouts, and they have single-frame, as well as multi-frame layouts to help you get the point that you want across. You can also highlight things, you can also add background music, and you can even insert slides from a PowerPoint. So if you want to upgrade a PowerPoint you just made and be able to zoom around and add a few more things, you can do that in Prezi. You can even customize the theme by clicking up here. You can also make your background a picture, you can add multiple photo layers in your Prezi. So to do that, you will come down to the advanced button, you'll come over to the 3D background and click Edit, then you can upload up to three photo layers. So this time I actually will use a weird picture of me. I'd rather embarrass myself. Then I will click done in the advanced area. You can adjust the theme colors and whatnot. Once you are done, then you click Done. If you zoom in far enough, then the picture changes, except I have awkwardly zoomed in on my own shirt. I zoom out and then we get the original picture that I started with. Otherwise, it is pretty simple to use and understand and it's not overly complex. So we're going to exit a presentation. It will exit and save automatically.
Let's get into the account settings. Let me go over to the profile page. If you want to add a picture, I believe it pulls your a picture. You can insert a profile picture via a site called Gravatar and I'll put a link to that down below.
So that was a brief overview of how to use Prezi. If you have any further questions about how to use it, you can leave me comments down below and I will do my best to answer your questions. So anyway, thank you guys so much for watching. If you enjoyed this video, give it a big thumbs up and don't forget to click on the red subscribe button to subscribe to the respective channels and as always I will see you guys in the next tutorial. Bye-bye.
Translating "GeoJargon"
GIS professionals who communicate well are the ones who get ahead. Effective communication in the GIS field involves researching your audience, choosing language that appeals to them, and communicating how you add value. Most clients and end-users are not interested in the nuts and bolts of GIS. They want to know how they can make better decisions, save money or time, more easily share information, or better reach their organization's goals. A general rule to follow is "simpler is better." The more you can make your products self-explanatory and appealing to your target audience, the more likely your audience is to use them and value your work.
My first boss told me a story that has stuck with me for many years. He said:
"When you take your car to the auto shop, do you want to receive a lengthy report about the model number of the tools the mechanic used, how high they had to raise your car on the lift or the particular order of steps they followed to change your oil or rotate your tires? Probably not. You likely just want to know when you can get your car back, how much it costs, any serious issues you need to address and what will happen if you wait too long to fix them. It's the same with GIS. Your client hired you to handle the technical details because it is not something they are particularly interested in, have time for, or are good at themselves. It's your job to apply your skills to their problem, then translate the results into terms that they care about."
I frequently experience GIS students and professionals tossing around data formats and Esri command names as though they were common verbs and nouns. To most prospective clients and proposal review teams, these are unknown terms. and they will quickly lose interest. My advice here is to avoid them, but when you feel they are necessary, you must remember to provide a definition.
You will need to apply these skills often - for example: when pitching a new project to a client, convincing your boss that your GIS department or team should receive funding, writing grant applications, responding to Request for Proposals (RFPs), presenting your work at technical conferences, or marketing your own portfolio and skills to potential new employers. Creating a communication plan is also an iterative process. Rarely is a first draft a final product.
Required Readings & Videos
Required Readings & Videos
- Use the Five-Step GIS Analysis Process [6]
- Thinking Spatially, Directions Magazine [7]
- Esri ArcGIS Story Maps Advice:
- How to Tell Your Story Using Esri's Storytelling Apps [8]
- Story Telling with Maps - Workflows and Best Practices [9]
- The Five Principles of Effective Storytelling [10]
- ArcGIS StoryMaps [11]
- Video: A Map for Every Story [12]
- Telling Stories with Maps Whitepaper [13]
- Adding Audio to Your Esri StoryMap [14]
Video: A map for every story (3:45)
Son: Even the birds?
Father: Some birds fly south for the winter.
Son: Do they go where the Penguins live?
Father: They don’t go that far. Penguins are really far south where its freezing cold.
Son: Where's that?
Father: Let's take a look. Here's a map of the South Pole where penguins live.
Son: Let me see.
Father: Look someone's tracked the migration on the map.
Male 1: Temperature is minus 18 degrees centigrade today in the Ross Sea of Antarctica. The Adderley penguins have returned from their nearly 13,000 kilometers journey, where they fed on krill, squid, and silverfish. They venture north during winter because they need light and open water to forage in the ocean.
[New Map Shown]
Woman 1: In addition to our main menu, we have some specials tonight. Fresh calamari flown in from Santa Cruz, Filet Mignon from the Blacktail Mountains of Dillon, Montana, fresh King Crab from Bristol Bay, Alaska and fresh Kiwi salad from New Zealand.
[New Map Shown]
Male 2: February 9, 2011, 3:00 a.m. This is the spirit of Enderby departing from Port of Bluff New Zealand. Current position 47.1 degrees south, 168.2 degrees east, steering one, seven, four, making 10.8 knots on route to Ross Island. We have landed at Auckland islands and while walking through the forest, we stumbled across seals resting on the grass. We have deployed the first Argo float at 51.4 degrees south, 165.1 degrees east, and it is now sending data to our satellite. There is a lot of ice around Cape Adare, so we have to make our way around that to go to our next destination, Franklin Island. We should spot a large rookery of penguins there.
[New Map Shown]
Male 3: This is a great trail. Yeah, fast and beautiful Let's follow the trail on the left, takes us to a great view of the coastline. Whoa!
[New Map Shown]
Male 4: Speaking is in Chinese (Translation: Using the public transportation demographic and population layers, we can determine the locations with the highest demand for housing, then align that information with our investment and location for the new mixed-use development. This area offers outdoor activities and is still close to the urban center.)
[New Map Shown]
Male 5: That was a great ride. Wow about the Appalachian Trail for our next trip.
Male 6: Cool. I'm in.
[New Map Shown]
Male 7: Sarah, this is Wiser State Reforestation, can you provide the GPS plots for the impacted areas from the fire last year and the reforestation zones? Over.
Woman 2: Copy that. I'm near the first reforestation area now, then we'll give you GPS coordinates of the area outline and some current photos for the map. Over.
[New Map Shown]
Father: This is where we saw the deer. It's about a mile up and we reach Eagle's Nest shelter, we can spend the night.
Son: Awesome, let's go.
Approach
Approach
Consider the questions below as you design your work plan. (You need to demonstrate evidence in your visual work plan that you considered questions in each section for full credit).
Why?
- Imagine a scenario where you can apply GIS to address a specific environmental question. Hint - review the introduction pages from previous lessons that describe several different scenarios.
- Briefly describe the scenario.
- What are the specific questions you need to address?
- Who are the main stakeholders?
- What's at stake?
- What is the purpose of using GIS in the project? (e.g., determine the best location, quantify change, compare multiple options, combine various information sources, create new information, etc.)
Where?
- Where does the scenario take place?
- What defines the boundaries of your site? (e.g., county, city, parcel, region, watershed, national park, etc.)
- Will you need to digitize your study area in ArcGIS, or can you download it from an internet source?
What Data?
- Describe the main data sets required for the analysis.
- What information do they need to contain (e.g., essential attributes or spatial data)?
- Note - You must use at least one of each of the formats listed below in your workflow:
- raster
- vector
- data table with either x,y coordinates or text description of the location (e.g., FIPS code)
- ArcGIS base map (why did you choose it?)
- Where are you likely to find the data you need (e.g., government websites, create in-house)? (It's OK if you can't find the actual data for this project. The point is to use your imagination to design a realistic project.)
- Will you need to collect field data? If so, why?
- Do you need to acquire high-resolution imagery?
- Does scale/accuracy matter? What about time?
Which GIS Tools?
- Which GIS tools and operations will you use to standardize and overlay the datasets? (Note - You should include at least five major steps in your workflow).
- Does order matter (e.g., step 1, step 2, step 3)?
- What will you use for your environment settings? Why?
- Briefly describe the conceptual inputs and outputs from each step?
- Tool/operation name (e.g., Reclassify) and why?
- Input (e.g., raster of rock types)
- Output (e.g., raster of DRASTIC ratings corresponding to each rock type)
- Important parameters (e.g., mask, extent, cell size)
- Purpose (e.g., create intermediate dataset needed for suitability analysis)
- Note: You do not need to include nearly as much detail as the Step-by-Step Activities from the course. For example, you do not need to describe how to access the tools, where to click, etc. You will be presenting this information to a board of non-GIS specialists, so it's better to focus on the big picture and purpose of each step.
- The table below lists the main GIS tools and operations covered in this course. You can use this as a basis for deciding the main steps in your workflow.
GIS Tools and Operations in Geography 487 Tables Vectors Rasters Present & Share Field Calculator Clip Raster to Polygon ArcGIS Explorer Online Summary Statistics Union Reclassify (Unique Values & Ranges) Google Earth Join Merge Reclassify NoData to Values Screen Captures/Videos Calculate Geometry Dissolve Tabulate Area Prezi Recode Missing Data Buffer Environment Settings Animations Convert units Feature to Raster Mosaic Multi-Dataframe Maps Plot X,Y Coordinates Interpolate to Raster Raster Calculator - Clip Graphs Change Projection Raster Calculator - Mathematical Overlay ArcGIS Online Maps Export Selection Raster Calculator - Select by Expression ArcGIS Online Web Apps Region Group Publish Web Services Zonal Geometry Zonal Histogram Slope Extract by Attributes Change Projection
How Do You Know You Are Right?
- What types of checks will you have your team do to make sure they have the correct answer?
- How will you advise your team to avoid common issues with projections, coded values, unit changes, etc.?
- Are there any references/past work that you can compare your results to make sure your outputs are reasonable?
Who is Your Audience?
- Describe your client and target end-user. Are they the same?
- What is their level of GIS/technical expertise? Are they executives, managers, GIS analysts, scientists, members of the general public or a particular interest group, etc.?
- Tip: It may help you create a mental picture if you find and download an actual photo that portrays your target audience.
How Will You Add Value? (a.k.a. Who Cares?)
- How will they use your analysis results?
- Will your analysis and end products help your client save money, time, make their processes more efficient, make it easier to share information, reduce redundancies, improve communication, facilitate participation, etc.?
How Will You Communicate?
- What are the three main messages you want to share about the analysis and results with your target audience?
- What buzz words do they use? (A good place to find this type of information is on client websites, in their professional newsletters, or within the call for proposals.)
- Will you provide recommendations for action based on your interpretation of the analysis results?
- What types of questions or resistance do you expect your audience to have?
- What end products will you produce for your client (raw data, static maps, interactive maps, custom mapping applications, animations, videos, an executive summary, a technical report, a website with embedded interactive maps with supporting text, etc.)? How will you share your results?
- What types of visual aids do you need to communicate your message to your target audience best? (e.g., diagrams, videos, graphics, etc.)
- If you choose to use a story map or other ArcGIS Online template, will you include pop-ups? If so, what will they contain?
Summary and Deliverables
Summary and Deliverables
In the Final Project, we applied spatial problem-solving skills and concepts covered in the course to design a GIS work plan from scratch and pitch it to a client.
Final Project Deliverables
The Final Project is worth a total of 200 points (20% of total course points).
Part I: (See Course Calendar for Due Date)
- (100 points) Visual GIS Work Plan
- Create a visual plan outlining your approach (see the Approach Page).
- Text should be concise (bullet points/short sentences/talking points).
- Include at least 3 screen captures and 1 visual aid (photo, video, etc.)
- Required Format: Prezi.com or Canva.com or Esri StoryMap
- (50 points) Video Presentation
- Present your plan to the review board in a short video (up to 5 minutes long). You need to convince them that they should choose your team for the project award. Remember, your audience is NOT your instructor and classmates.
- Use Kaltura, Screencast-O-Matic, or another video program of your choice.
- (25 points) Public Post
- Create a new Public Post.
- Use a meaningful title for your post (e.g., Wetland Restoration in Michigan).
- Include the URL of your Visual GIS Work Plan in Prezi, Canva, or ArcGIS StoryMap.
- Include the URL of your video presentation.
- Include a short reflection (~ 200-300 words). What did you like about this project? Which parts were easiest/hardest?
Part II: (See Course Calendar for Due Date)
- (25 points) Peer Review
- Select another student's project to review.
- Respond to their post with two positive comments and one tip for improvement.
- Your review should be ~ 200-300 words.
Final Project Evaluation Criteria:
- Mastery: Demonstrate a conceptual understanding of a range of GIS tools and operations covered in the course, including Spatial Analyst.
- Accuracy: Analysis steps and the scenario make sense and are plausible in the real world.
- Creativity: Incorporate resources beyond ArcGIS such as Kaltura, Prezi, Canva, ArcGIS StoryMaps, other ArcGIS Online Maps and Apps, Google Earth, etc.
- Effective Communication: Supporting graphics, appropriate word choice, confidence, speaking pace, etc.
- Follow Instructions: Demonstrate that you considered the questions in the Approach Section, include at least 5 main steps in your workflow, follow time limits for video, submit on time, etc.
| Work Plan (Mastery) | Demonstrates conceptual understanding of GIS concepts and operations. (25pts) | Demonstrates an understanding of most GIS concepts, but appears unclear about some. (15pts) | Demonstrates a complete lack of understanding of most GIS concepts and operations. (0pts) | 25pts |
|---|---|---|---|---|
| Work Plan (Accuracy) | Work plan accurately represents a real-world scenario. (25pts) | Work plan is incomplete or is in some ways unrealistic. (15pts) | Work plan is not plausible to a real-world scenario. (0pts) | 25pts |
| Work Plan (Creativity) | Work plan is designed in a creative way utilizing a variety of tools. (15pts) | Work plan shows some creativity but is largely out-of-the-box ArcGIS. (8pts) | Work plan contains little creativity beyond basic ArcGIS tools. (0pts) | 15pts |
| Work Plan (Effective Communication) | Work plan is designed in a way that effectively communicates the scenario. (15pts) | Work plan communicates all required information but is a bit hard to understand. (8pts) | Work plan is poorly designed and is confusing or overwhelming to the reader. (0pts) | 15pts |
| Work Plan (Follow Instructions) | Work plan includes all required elements (Prezi/Canva/StoryMap, raster/vector/xy, >5 steps, 3 screen captures, etc.). (20pts) | Work plan is missing an element or two. (10pts) | Work plan is missing several required elements. (0pts) | 20pts |
| Video Presentation (Effective Communication) | Video conforms to instructions and was produced in a manner that renders it compelling and informative. (25pts) | Video adequately meets requirements but appears hastily produced making it more difficult to follow and understand. (15pts) | Video was poorly produced making it difficult or impossible for the audience to understand the work plan. (0pts) | 25pts |
| Video Presentation (Follow Instructions) | <5-minute video is linked. (25pts) | Video is linked but does not conform to instructions. (15pts) | Video is missing. (0pts) | 25pts |
| Reflection | Post includes 200-300 words sufficiently discussing the favorite, hardest, and easiest parts of this project. (25pts) | Post is present but does not adequately discuss the experience of working on this project. (15pts) | Posting is missing. (0pts) | 25pts |
| Peer Review | A 200-300 word post about another student's project is present and includes 2 positive comments and 1 suggestion for improvement. (25pts) | Post is present but does not adequately evaluate another student's project. (15pts) | Post is missing. (0pts) | 25pts |
| TOTAL | 200pts | |||
Tell us about it!
If you have anything you'd like to comment on, or add to the lesson materials, feel free to post your thoughts in the Final Project Discussion. For example, what did you have the most trouble with in this lesson? Was there anything useful here that you'd like to try in your own workplace?
Additional Resources
Additional Resources
This page includes links to resources such as additional readings and websites related to the lesson concepts. Feel free to explore these on your own. If you'd like to suggest other resources for this list, please send the instructor an email.
Additional Information and Example Story Maps:
- Lifeways of the Little Colorado River [15], Grand Canyon Trust.
- Sounds of the Wild West [16], Acoustic Atlas.
- A Year in the Life of a Piping Plover [17], The National Audubon Society.
- Five Compelling Story Maps for Earth Day [18], Esri.
- ArcGIS StoryMaps: An Introduction to the What, Why, and How of Storytelling with Maps [19], Esri (58:41)
- Coral Reefs at Risk [20], World Resources Institute.
Presentation Best Practices:
- Slide:ology, The Art and Science of Creating Great Presentations [21], by Nancy Duarte.
- What It Takes to Give a Great Presentation [22], Harvard Business Review