Background Information
Background Information
Locating & Acquiring Data
One of the first steps in any geospatial project is finding data and metadata related to your topic and study area. I like to think of this phase as detective work. You often need to search for detailed clues in many different places before you can understand the bigger picture. For example, the same data set can often be obtained from multiple agencies, in multiple formats, and in multiple geographic packages (e.g., grouped by state or county vs. seamless).
You may need to consult several different sources to find all of the information you need to use the data, such as date, scale, description of coded values, etc. You may also use different sources to pre-screen and download the data. These websites are often hyperlinked to each other, so you may bounce back and forth a few times before landing in the right spot. You may find that some interfaces and data products are much easier to work with than others. We will experiment with a few different data providers to demonstrate this concept. The keys to success are budgeting ample time, keeping detailed notes along the way, and asking the right questions before you begin your search.
The best place to start looking for geospatial data is on the web. There has been a push to democratize environmental and climate-related data, and we will take full advantage of that initiative. I have listed a few different types of websites, typical data you will find on them, and links to some example sites below. This is not meant to be an exhaustive list, but rather an overview to get you pointed in the right direction.
Federal Websites
- Range of low to high-resolution data covering either large geographic areas, such as global or national extents, or smaller units like counties.
- Some websites compile data sets from multiple organizations (e.g., The National Map); others only have data from a specific agency (e.g., Environmental Protection Agency).
- Metadata is usually very complete, though sometimes scattered among multiple websites.
- Common data - topography, elevation, temperature, wind, land use, transportation networks, hydrography, wetlands, floodplains, soils, place names, current and historic aerial photos, time-series satellite images, and data related to a specific government agency’s areas of focus.
- Example sites:
- National Geospatial Program [1]
- US Department of Agriculture Geospatial Data Gateway [2]
- Environmental Protection Agency [3]
- USGS Earth Explorer [4]
- USGS Data [5]
- USGS National Hydrography Dataset [6]
- USGS Water Resources and Water Data for the Nation [7]
- USGS 30-Meter SRTM Tile Downloader [8] - elevation data from the Shuttle Radar Topography Mission
- USGS GloVis [9] - remote sensing data
- NASA Earth Observations [10]
- NASA Socioeconomic Data and Applications Center (sedac) [11]
State Websites:
- Subsets of federal data sets clipped to the state level; sometimes include more detailed information produced by the state itself.
- Medium to high-resolution data related to the state.
- Metadata varies.
- Common data - watershed boundaries, boundaries of management units such as counties, cities, and townships, and wildlife surveys.
- Example sites:
- Pennsylvania: PA Spatial Data Access [12]
- Texas: The Texas General Land Office [13]
- Philadelphia: OpenDataPhilly [14]
Local Government Websites:
- High-resolution data sets covering small geographic areas (counties, cities, project sites).
- Sometimes difficult to access and obtain datasets.
- Metadata varies.
- Common data - cadastral information, land use plans (zoning, future land use, parks, and recreation plans), high resolution & time series aerial photos, local roads, utilities, and building footprints.
- Example site:
- Los Angeles County, CA: LA County GIS Portal [15]
University & Library Websites:
- Universities and libraries often maintain lists of links to international, federal, state, and local data clearinghouses.
- Example sites:
- Penn State University Finding GIS Data: Pennsylvania [16]
- Penn State University Finding GIS Data: US [17]
- University of Colorado at Boulder: Map Library [18]
- OpenTopography [19] is based at the University of California, San Diego, and is operated in collaboration with Arizona State University and UNAVCO.
- Index Database [20] from University of Bonn, Germany
- Alaska Satellite Facility [21] from the Geophysical Institute at the University of Alaska Fairbanks
International Websites
- Copernicus Open Access Hub [22] - European Union's Earth Observation Programme
- Humanitarian Data Exchange [23]
- United Nations Maps and Geospatial Services [24]
- LAADS DAAC [25] - Level-1 and Atmosphere Archive & Distribution System Distributed Active Archive Center
- Penn State University Finding GIS Data: International [26]
- DIVA-GIS: Free Spatial Data [27]
- National Remote Sensing Centre [28] - Government of India
- European Space Agency [29] - Coarse vegetation data from PROBA-V, SPOT-Vegetation and METOP. Register for free data downloads.
- VITO Vision Catalog [29]
Environmental Groups and Non-Governmental Organizations (NGOs) Websites:
- The resolution and extent of data vary.
- Sometimes difficult to access and obtain datasets.
- Metadata varies.
- Typically focused on a specific topic related to the organization’s goals (e.g., habitat conservation).
- Example Organizations: World Wildlife Fund, Global Forest Watch, Ducks Unlimited, Sierra Club, The World Bank, Food and Agriculture Organization (FAO)
- Example sites:
Esri Websites:
- Includes pre-symbolized base maps, environmental datasets, and industry-specific data such as economic models and quality-of-life indicators. Many organizations also share their data in ArcGIS Online, so the potential topics are endless.
- The resolution and extent of data vary.
- Some data requires payment or subscription.
- Metadata is typically very good.
- Example sites:
Site-Level Data:
- High-resolution data sets covering small geographic areas (project sites).
- Sometimes difficult to access and obtain datasets.
- Metadata varies.
- Results from academic research projects or for-profit corporations focused on a very specific set of questions.
- Example Sites:
Downloading Data
Most websites provide links to download raw GIS and geospatial data that you can input into spatial analyses. Shapefiles, geodatabases, GeoJSON, and rasters are typically available for download in one or more of the following options:
- Extraction using an interactive mapping website that allows the user to define an area on a map; a compressed file clipped to your defined region will be available to you for download.
- Browsable FTP sites with compressed files you can immediately download.
- Web pages that allow you to place custom data orders.
GIS and geospatial files from Options 2 and 3 are typically aggregated by one or more geographic units such as counties, 7.5‘ topographic quadrangles (topo quads), or watersheds. You may need to download multiple files to cover your entire study area, and then merge them into a single data set using ArcGIS. The higher-quality sites typically offer interactive maps where you can browse available GIS and geospatial data and metadata.
Choosing Data Formats
Several years ago, finding information in a readable format was one of the most challenging parts of geospatial work. This is no longer the case, as most government data sets have been converted into GIS and geospatial formats accessible on the Internet. Typically, government data is available in at least two different formats: raw geospatial files (e.g., shapefiles, geodatabases, rasters) and online data services. You are likely familiar with working with raw GIS data within ArcGIS Pro or using online data services such as the ArcGIS Living Atlas.
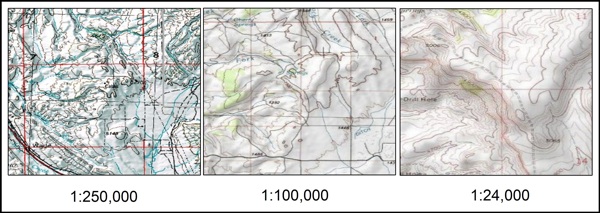
Online data services are geospatial layers that you can connect to via the Internet. One of the major benefits of online data services is that they contain seamless versions of data. Seamless data sets combine individual data sets from different locations, scales, and time periods into one dataset. This lets you view and interact with hundreds to thousands of individual data sets simultaneously. For example, you may have worked with paper versions of topographic maps in the past. Each paper map only shows a finite area (e.g., 7.5 minutes) at one scale (e.g., 1:24:000). If you want to view a larger area or a different scale (1:100,000 or 1:250,000), you would need to gather many different paper maps. Using a seamless map service, you only need to use one data product to access the information from all of these paper maps at the same time. As you zoom to different scales, the underlying data source changes automatically. For example, if you zoom out to view an entire state, the map will display scans of the 1:250,000 maps. As you zoom in closer, the images will be replaced by more and more detailed data sets (1:100,000, 1:24,000).
While seamless datasets can be extremely valuable, they also have their drawbacks. For example, many seamless data sets were created by digitally stitching together multiple adjacent data layers that were created at different time periods. Mosaicking them together into one dataset gives the impression that the metadata of the underlying data sets are uniform when they are not. You must be careful using seamless data sets if time is an important variable in your analysis. This is only a concern if the data were not collected continuously, such as via satellite. Examples of continuous data include digital elevation models and products derived from remote sensing sources such as the National Land Cover Data Set (NLCD).
Accessing Online Data Services
You can view online data services in a variety of ways. For example, you can use viewers embedded in an organization's website, ArcGIS.com, or add them directly to your layout in ArcGIS Pro. Interactive mapping websites allow you to view and interact with online data services using any Internet browser. Sites will usually include a map viewer, legend, tools to interact with your data such as zoom and identify, and tools to download subsets of data directly from the interactive map. Interactive maps allow you to customize what is displayed on the map by turning available layers on and off in the legend. They may also enable you to view the underlying attributes of each data source.
You will find that the quality and user-friendliness of online interactive map viewers vary dramatically depending on the organization and software used to create them. For example, on some websites, the identify tool only allows you to identify features within one layer at a time. You have to specify which layer is “active” in the legend to view its attributes. On other sites, you must manually refresh the map by clicking on a button every time you turn layers on and off.
Adding online data services directly to your ArcGIS session gives you many of the benefits of interactive mapping websites while providing much more flexibility to customize your map. Depending on the type of service, your options for controlling how the data are displayed are limited. For example, you may be unable to change certain aspects of the symbology or use them for input into geoprocessing tools such as the Clip Tool. They often have scale-dependent rendering settings that you may be unable to alter. Aside from these limitations, there are many benefits to using online data services. They can save a lot of time since you don’t have to download each data set individually and set the symbology for each one. This could trim a few days from your work schedule if you use many complex data sets.
Conclusion
Interactive mapping websites are a great way to get to know your study area and check the availability of several data sets simultaneously, but they may lack tools for robust spatial analysis. Connecting to map services or the AGO Living Atlas within ArcGIS is an easy way to create base maps, combine data from multiple sources, or integrate your own data layers with publicly available data. Since the data come pre-symbolized, you can save a lot of time setting up your map. Working with raw data gives you the most flexibility as far as interacting with your data within ArcGIS. However, there is typically a steep learning curve in figuring out which attributes to use to symbolize your map and use for your analysis. This can become a very time-intensive exercise. It is best to download only the datasets that you need to modify or input into an analysis project and rely on online data services for the remaining data.
Metadata
Once you have located and acquired your data, your job is only just beginning. Your input data will likely come from several different sources, have a variety of data formats and extents, cover a range of time periods, and include many different attributes. You need to be aware of these properties before you start to work with your data. A lot of this information is not immediately obvious just by looking at the files. You will need to locate metadata documents to figure out many of the details. You will find that the quality of metadata necessary to understand and work with data varies depending on the source. Oftentimes, official FDGC metadata files are not packaged with the data. It is also possible that the metadata will be packaged with the data but not in a format recognized by ArcGIS (e.g., PDF or Word Document). This means you won’t be able to view the metadata in ArcGIS. If metadata files are not packaged with the raw data, you can usually find the information you need somewhere on the source website, by doing a general Internet search or by contacting the agency or organization that created the data. You may need to visit several different websites to find all of the information you need to answer all of the questions below. Sometimes, one of the most time-consuming parts of an analysis project is figuring out what different fields and attribute values mean (e.g., coded or abbreviated values).
- What agency or organization created the data?
- What format is the underlying geospatial data, raster or vector?
- What is the resolution of the data (rasters - cell size; vectors - map scale)?
- What is the spatial reference of the data?
- coordinate system (e.g., Geographic, UTM, State Plane)
- projection (e.g., unprojected, Transverse Mercator, Albers Equal Area)
- datum (e.g., WGS84, NAD83, NAD27)
- Was the original data created by scanning/digitizing paper maps or was it collected in a continuous manner (remotely sensed by a satellite)?
- If it was not collected in a continuous manner, in what geographic unit was it created (e.g., 7.5-minute topo quads)?
- What time period does the data represent? Does the date vary by location?
- What are the units of any measured attribute values?
- Are there any coded attribute values? If so, where can we find the definitions?