Lesson 2: Find and Share Environmental Data
Lesson 2 Overview and Checklist
Lesson 2 Overview and Checklist
Introduction
One of the first steps in any geospatial project is to find relevant datasets that you will use either to create maps, conduct an analysis, or both. For example, many projects in the environmental field require a site assessment with an inventory of natural features and concerns or related opportunities. This information is necessary to create management plans for conservation and recreation areas, environmental impact assessments for development projects, future land use plans, zoning, and parks and recreation plans for city planning, to screen and rank potential sites for various uses, and to plan for field data collection events.
In the U.S., most of this information is readily available on the Internet from various federal and state agencies. For example, the United States Geological Survey (USGS) [1], the U.S. Department of Agriculture (USDA) [2], the National Renewable Energy Laboratory (NREL) [3], the U.S. Forest Service (USFS) [4], the U.S. Fish & Wildlife Service (USFWS) [5], the U.S. Environmental Protection Agency (USEPA) [6], the National Oceanic and Atmospheric Administration (NOAA [7]), the Federal Emergency Management Agency (FEMA) [8], and the U.S. Census Bureau [9] provide geospatial datasets related to elevation, soil types, current and historical land use/land cover, wetland inventories, hydrological features, wildlife inventories, habitat assessments, invasive species, proximity or susceptibility to pollution, climate, energy potential, and risks of fires, drought, flooding, and demographic data. Also, many datasets are available within ArcGIS Online as data services.
GIS and geospatial technology make it very easy to combine this information into one place, analyze it, and create maps to communicate the information to interested parties. Before we can start analyzing data, we need to know where to find it and how to work with it. We are going to explore several providers of environmental data to create a series of natural features maps. We will explore each organization’s website to find which data sets they offer and information about each data set (metadata). We will also explore different methods to view each dataset, including interactive mapping websites and online data services.
Scenario
Your organization is beginning a new conservation project on the border of Montana and Wyoming. The project management team needs to understand the natural features of the site to plan field data collection efforts. Your job is to locate relevant geospatial datasets, communicate their opportunities and limitations, and share them with the team in a user-friendly format.
Goals
At the successful completion of Lesson 2, you will have:
- located publicly available geospatial datasets for environmental projects;
- chosen which format(s) are best suited for your project;
- explored opportunities and limitations of datasets by reviewing metadata;
- shared data and maps using ArcGIS.com.
 |
 |
 |
 |
 |
Questions?
If you have questions now or at any point during this lesson, please feel free to post them in the Lesson 2 Discussion.
Checklist
This lesson is one week in length and is worth a total of 100 points. Please refer to the Course Calendar for specific time frames and due dates. To finish this lesson, you must complete the activities listed below. You may find it useful to print this page out first so that you can follow along with the directions. Simply click the arrow to navigate through the lesson and complete the activities in the order that they are displayed.
- Read all of the pages listed under the Lesson 2 Module.
Read the information on the "Background Information," "Required Readings," "Lesson Data," "Step-by-Step Activity," "Advanced Activities," and "Summary and Deliverables" pages. - Download and read the required readings.
See the "Required Readings" page for links to the PDFs. - Download Lesson 2 datasets.
See the "Lesson Data" page. - Download and complete the Lesson 2 Step-by-Step Activity.
- See the "Step-by-Step Activity" page for a link to a printable PDF of steps to follow.
- Complete the Lesson 2 Advanced Activity.
See the "Advanced Activity" page. - Complete the Lesson 2 Quiz.
See the "Summary and Deliverables" page. - Create and submit Lesson 2 Maps and App.
Specific instructions are included on the "Summary and Deliverables" page. - Optional - Check out additional resources.
See the "Additional Resources" page. This section includes links to several types of resources if you are interested in learning more about environmental data covered in this lesson.
SDG image retrieved from the United Nations [10]
Background Information
Background Information
Locating & Acquiring Data
One of the first steps in any geospatial project is finding data and metadata related to your topic and study area. I like to think of this phase as detective work. You often need to search for detailed clues in many different places before you can understand the bigger picture. For example, the same data set can often be obtained from multiple agencies, in multiple formats, and in multiple geographic packages (e.g., grouped by state or county vs. seamless).
You may need to consult several different sources to find all of the information you need to use the data, such as date, scale, description of coded values, etc. You may also use different sources to pre-screen and download the data. These websites are often hyperlinked to each other, so you may bounce back and forth a few times before landing in the right spot. You may find that some interfaces and data products are much easier to work with than others. We will experiment with a few different data providers to demonstrate this concept. The keys to success are budgeting ample time, keeping detailed notes along the way, and asking the right questions before you begin your search.
The best place to start looking for geospatial data is on the web. There has been a push to democratize environmental and climate-related data, and we will take full advantage of that initiative. I have listed a few different types of websites, typical data you will find on them, and links to some example sites below. This is not meant to be an exhaustive list, but rather an overview to get you pointed in the right direction.
Federal Websites
- Range of low to high-resolution data covering either large geographic areas, such as global or national extents, or smaller units like counties.
- Some websites compile data sets from multiple organizations (e.g., The National Map); others only have data from a specific agency (e.g., Environmental Protection Agency).
- Metadata is usually very complete, though sometimes scattered among multiple websites.
- Common data - topography, elevation, temperature, wind, land use, transportation networks, hydrography, wetlands, floodplains, soils, place names, current and historic aerial photos, time-series satellite images, and data related to a specific government agency’s areas of focus.
- Example sites:
- National Geospatial Program [11]
- US Department of Agriculture Geospatial Data Gateway [12]
- Environmental Protection Agency [13]
- USGS Earth Explorer [14]
- USGS Data [1]
- USGS National Hydrography Dataset [15]
- USGS Water Resources and Water Data for the Nation [16]
- USGS 30-Meter SRTM Tile Downloader [17] - elevation data from the Shuttle Radar Topography Mission
- USGS GloVis [18] - remote sensing data
- NASA Earth Observations [19]
- NASA Socioeconomic Data and Applications Center (sedac) [20]
State Websites:
- Subsets of federal data sets clipped to the state level; sometimes include more detailed information produced by the state itself.
- Medium to high-resolution data related to the state.
- Metadata varies.
- Common data - watershed boundaries, boundaries of management units such as counties, cities, and townships, and wildlife surveys.
- Example sites:
- Pennsylvania: PA Spatial Data Access [21]
- Texas: The Texas General Land Office [22]
- Philadelphia: OpenDataPhilly [23]
Local Government Websites:
- High-resolution data sets covering small geographic areas (counties, cities, project sites).
- Sometimes difficult to access and obtain datasets.
- Metadata varies.
- Common data - cadastral information, land use plans (zoning, future land use, parks, and recreation plans), high resolution & time series aerial photos, local roads, utilities, and building footprints.
- Example site:
- Los Angeles County, CA: LA County GIS Portal [24]
University & Library Websites:
- Universities and libraries often maintain lists of links to international, federal, state, and local data clearinghouses.
- Example sites:
- Penn State University Finding GIS Data: Pennsylvania [25]
- Penn State University Finding GIS Data: US [26]
- University of Colorado at Boulder: Map Library [27]
- OpenTopography [28] is based at the University of California, San Diego, and is operated in collaboration with Arizona State University and UNAVCO.
- Index Database [29] from University of Bonn, Germany
- Alaska Satellite Facility [30] from the Geophysical Institute at the University of Alaska Fairbanks
International Websites
- Copernicus Open Access Hub [31] - European Union's Earth Observation Programme
- Humanitarian Data Exchange [32]
- United Nations Maps and Geospatial Services [33]
- LAADS DAAC [34] - Level-1 and Atmosphere Archive & Distribution System Distributed Active Archive Center
- Penn State University Finding GIS Data: International [35]
- DIVA-GIS: Free Spatial Data [36]
- National Remote Sensing Centre [37] - Government of India
- European Space Agency [38] - Coarse vegetation data from PROBA-V, SPOT-Vegetation and METOP. Register for free data downloads.
- VITO Vision Catalog [38]
Environmental Groups and Non-Governmental Organizations (NGOs) Websites:
- The resolution and extent of data vary.
- Sometimes difficult to access and obtain datasets.
- Metadata varies.
- Typically focused on a specific topic related to the organization’s goals (e.g., habitat conservation).
- Example Organizations: World Wildlife Fund, Global Forest Watch, Ducks Unlimited, Sierra Club, The World Bank, Food and Agriculture Organization (FAO)
- Example sites:
Esri Websites:
- Includes pre-symbolized base maps, environmental datasets, and industry-specific data such as economic models and quality-of-life indicators. Many organizations also share their data in ArcGIS Online, so the potential topics are endless.
- The resolution and extent of data vary.
- Some data requires payment or subscription.
- Metadata is typically very good.
- Example sites:
Site-Level Data:
- High-resolution data sets covering small geographic areas (project sites).
- Sometimes difficult to access and obtain datasets.
- Metadata varies.
- Results from academic research projects or for-profit corporations focused on a very specific set of questions.
- Example Sites:
Downloading Data
Most websites provide links to download raw GIS and geospatial data that you can input into spatial analyses. Shapefiles, geodatabases, GeoJSON, and rasters are typically available for download in one or more of the following options:
- Extraction using an interactive mapping website that allows the user to define an area on a map; a compressed file clipped to your defined region will be available to you for download.
- Browsable FTP sites with compressed files you can immediately download.
- Web pages that allow you to place custom data orders.
GIS and geospatial files from Options 2 and 3 are typically aggregated by one or more geographic units such as counties, 7.5‘ topographic quadrangles (topo quads), or watersheds. You may need to download multiple files to cover your entire study area, and then merge them into a single data set using ArcGIS. The higher-quality sites typically offer interactive maps where you can browse available GIS and geospatial data and metadata.
Choosing Data Formats
Several years ago, finding information in a readable format was one of the most challenging parts of geospatial work. This is no longer the case, as most government data sets have been converted into GIS and geospatial formats accessible on the Internet. Typically, government data is available in at least two different formats: raw geospatial files (e.g., shapefiles, geodatabases, rasters) and online data services. You are likely familiar with working with raw GIS data within ArcGIS Pro or using online data services such as the ArcGIS Living Atlas.
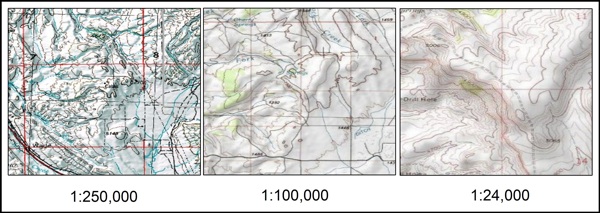
Online data services are geospatial layers that you can connect to via the Internet. One of the major benefits of online data services is that they contain seamless versions of data. Seamless data sets combine individual data sets from different locations, scales, and time periods into one dataset. This lets you view and interact with hundreds to thousands of individual data sets simultaneously. For example, you may have worked with paper versions of topographic maps in the past. Each paper map only shows a finite area (e.g., 7.5 minutes) at one scale (e.g., 1:24:000). If you want to view a larger area or a different scale (1:100,000 or 1:250,000), you would need to gather many different paper maps. Using a seamless map service, you only need to use one data product to access the information from all of these paper maps at the same time. As you zoom to different scales, the underlying data source changes automatically. For example, if you zoom out to view an entire state, the map will display scans of the 1:250,000 maps. As you zoom in closer, the images will be replaced by more and more detailed data sets (1:100,000, 1:24,000).
While seamless datasets can be extremely valuable, they also have their drawbacks. For example, many seamless data sets were created by digitally stitching together multiple adjacent data layers that were created at different time periods. Mosaicking them together into one dataset gives the impression that the metadata of the underlying data sets are uniform when they are not. You must be careful using seamless data sets if time is an important variable in your analysis. This is only a concern if the data were not collected continuously, such as via satellite. Examples of continuous data include digital elevation models and products derived from remote sensing sources such as the National Land Cover Data Set (NLCD).
Accessing Online Data Services
You can view online data services in a variety of ways. For example, you can use viewers embedded in an organization's website, ArcGIS.com, or add them directly to your layout in ArcGIS Pro. Interactive mapping websites allow you to view and interact with online data services using any Internet browser. Sites will usually include a map viewer, legend, tools to interact with your data such as zoom and identify, and tools to download subsets of data directly from the interactive map. Interactive maps allow you to customize what is displayed on the map by turning available layers on and off in the legend. They may also enable you to view the underlying attributes of each data source.
You will find that the quality and user-friendliness of online interactive map viewers vary dramatically depending on the organization and software used to create them. For example, on some websites, the identify tool only allows you to identify features within one layer at a time. You have to specify which layer is “active” in the legend to view its attributes. On other sites, you must manually refresh the map by clicking on a button every time you turn layers on and off.
Adding online data services directly to your ArcGIS session gives you many of the benefits of interactive mapping websites while providing much more flexibility to customize your map. Depending on the type of service, your options for controlling how the data are displayed are limited. For example, you may be unable to change certain aspects of the symbology or use them for input into geoprocessing tools such as the Clip Tool. They often have scale-dependent rendering settings that you may be unable to alter. Aside from these limitations, there are many benefits to using online data services. They can save a lot of time since you don’t have to download each data set individually and set the symbology for each one. This could trim a few days from your work schedule if you use many complex data sets.
Conclusion
Interactive mapping websites are a great way to get to know your study area and check the availability of several data sets simultaneously, but they may lack tools for robust spatial analysis. Connecting to map services or the AGO Living Atlas within ArcGIS is an easy way to create base maps, combine data from multiple sources, or integrate your own data layers with publicly available data. Since the data come pre-symbolized, you can save a lot of time setting up your map. Working with raw data gives you the most flexibility as far as interacting with your data within ArcGIS. However, there is typically a steep learning curve in figuring out which attributes to use to symbolize your map and use for your analysis. This can become a very time-intensive exercise. It is best to download only the datasets that you need to modify or input into an analysis project and rely on online data services for the remaining data.
Metadata
Once you have located and acquired your data, your job is only just beginning. Your input data will likely come from several different sources, have a variety of data formats and extents, cover a range of time periods, and include many different attributes. You need to be aware of these properties before you start to work with your data. A lot of this information is not immediately obvious just by looking at the files. You will need to locate metadata documents to figure out many of the details. You will find that the quality of metadata necessary to understand and work with data varies depending on the source. Oftentimes, official FDGC metadata files are not packaged with the data. It is also possible that the metadata will be packaged with the data but not in a format recognized by ArcGIS (e.g., PDF or Word Document). This means you won’t be able to view the metadata in ArcGIS. If metadata files are not packaged with the raw data, you can usually find the information you need somewhere on the source website, by doing a general Internet search or by contacting the agency or organization that created the data. You may need to visit several different websites to find all of the information you need to answer all of the questions below. Sometimes, one of the most time-consuming parts of an analysis project is figuring out what different fields and attribute values mean (e.g., coded or abbreviated values).
- What agency or organization created the data?
- What format is the underlying geospatial data, raster or vector?
- What is the resolution of the data (rasters - cell size; vectors - map scale)?
- What is the spatial reference of the data?
- coordinate system (e.g., Geographic, UTM, State Plane)
- projection (e.g., unprojected, Transverse Mercator, Albers Equal Area)
- datum (e.g., WGS84, NAD83, NAD27)
- Was the original data created by scanning/digitizing paper maps or was it collected in a continuous manner (remotely sensed by a satellite)?
- If it was not collected in a continuous manner, in what geographic unit was it created (e.g., 7.5-minute topo quads)?
- What time period does the data represent? Does the date vary by location?
- What are the units of any measured attribute values?
- Are there any coded attribute values? If so, where can we find the definitions?
Required Readings and Videos
Required Readings & Videos
Instructions: Watch the seven short videos below (~20 minutes total) and review the two Esri web pages listed as required readings. You will need information covered to complete the Lesson 2 Quiz. You may want to print the quiz from Canvas and keep track of your answers as you watch each video.
Videos
Video 1
PRESENTER: ArcGIS Online is a cloud-based mapping and analysis solution where you can find a collection of geographic information from around the world, and make your own maps, 3D scenes, and apps. Use ArcGIS Online to share your geospatial content with the community and organize collections of content into groups to collaborate with others on projects and initiatives.
Find and use content from your organization, Esri, and other organizations. While searching for content, you can mark items as favorites to make them easy to find later. Search through thousands of content items, and sort and filter your results to drill down to what you need.
In this example, we’ll filter search results using ArcGIS content categories. We want to find environmental data focusing on weather and climate. You can also add your own items to ArcGIS Online. For example, you can add files such as spreadsheets from your computer, or link to layers on the web such as KML or OGC layers. You can even pull in data from your web and mobile apps.
Items you add can be shared with your organization, with everyone, with groups you belong to, or with a combination of these. Try ArcGIS Online now to get answers to spatial questions and share your results to tell compelling stories. ArcGIS Online has plenty of resources to help you get started! Visit the Resources page for product documentation, discovery paths, and more.
Video 2
PRESENTER: There are patterns hidden in your data. ArcGIS Online empowers you to reveal those patterns and explore new perspectives using maps.
As the map author, you have options about how to present your data. To start mapping, open Map Viewer and browse the basemap gallery. ArcGIS Online includes a collection of basemaps that emphasize different views of our world. Administrators can also add custom basemaps, including basemaps in different projections, to their organization's gallery.
You can add layers to your map from a variety of sources. Use your own data, bring in layers from the web, or access authoritative data from ArcGIS Living Atlas and from a global community of ArcGIS users.
Once you've added data to the map, smart mapping defaults suggest the best way to represent it based on the data fields you choose. Different styles are available depending on the data and layer type. For example, you can style your data by location, by number, or by category. Try choosing two or more fields to explore other styles. Smart mapping styles make it easy to uncover and show comparisons, predominance, and other patterns in your data.
Once you've chosen a map style, you can further customize the look and feel of your map with curated color ramps and symbol sets. Color ramps are sorted into collections like best for light backgrounds, best for dark backgrounds, and colorblind friendly. This helps you make smart cartographic decisions.
You can also experiment with filters to get a focused view of your data. Create a filter to display only the data that matches the expression. This helps you highlight important and relevant locations. Pop-ups help make your maps engaging and informative. Enhance your pop-up with custom-formatted text, charts, and other content to provide an interactive way to explore data.
Once your map is complete, add it to your collection of ArcGIS Online items. Then you can share the map with your organization, with specific groups, or with the public. You can even use the map to make a web app.
With ArcGIS Online, you can explore and harness the power of your data and create maps that tell stories and answer questions. To learn more about mapping in ArcGIS Online, visit the Resources page for product documentation, Discovery Paths, and more.
Video 3
PRESENTER: ArcGIS Online helps you put your data to work. See how sharing your maps, layers, scenes, apps, and other content allows you to connect and collaborate with others. Until items in your organization are shared, only their owners and organization members with the correct privileges can access them.
For items you choose to share, be sure to complete and refine the item details. This helps others find your content and understand its purpose. Several sharing options are available. Depending on your privileges and your organization’s security settings, you can share items with your organization, with the public, with groups you belong to, or with a combination of these. On the Content page, you can filter your items by sharing level and see at a glance how your items are shared.
Sharing your content offers many benefits. For example, sharing with groups allows you to collaborate securely with specific members of your organization or partner organizations on projects and initiatives. To engage and share your insights with the public, try sharing a map as an app. Or share your feature data as a hosted web layer that others can add to their maps and scenes. To learn more about sharing content in ArcGIS Online, visit the Resources page for product documentation, discovery paths, and more.
Video 4
PRESENTER: A group is a collection of items, usually related to a specific region, subject, or project. Groups allow you to organize and share your items. You decide who can join your group, who can find and view it, and who can contribute content.
Most organizations have many items and members. Administrators can use groups to help manage the organization. For example, configure groups to feature content on your organization's home page and build custom galleries for basemaps and apps.
You can also use groups to make your public items available to Open Data sites or set up administrative groups to help with member management. Groups allow members to work closely together on projects and initiatives. Shared update groups are useful when multiple people need to update the same items. You can even use groups to collaborate securely with another organization through a partnered collaboration.
To learn more about groups, visit the Resources page for product documentation, discovery paths, and more.
Video 5
PRESENTER: Starting at the web map from the previous video, we're now going to make this into a web app builder app. So, to do this, there are two versions of Web App Builder, one that's hosted on ArcGIS online, and one called the Developer Edition, which you can download and modify yourself.
So first, we're going to go over the hosted version, on ArcGIS online. I'm going to get there, once you're in your web map you can click share, and make a web application button. Then there's this Web App Builder tab. So it's already filled in, our title tags summary for us. I'm going to click, get started, and we are brought into the web builder for ArcGIS. So over here we can see we have our web app and this is kind of the interface surrounding it. That's the app that Web App Builder is building for you. You can customize the style of that with this left pane as well as changing layout, um, different themes. Web App Builder works around these widgets. So, we have two widgets here, legend, and layer list. There's widget slots as well, here. The widgets pane is where you configure exactly what widgets are going to show up where. So we can see we've got these two slots available. You click that, I can add, for example, a bookmark widget here. And there it is. Web App Builder lets you customize also, name, logo. The map that's loaded in, we're using the map from the previous video, but you can choose other ones that you saved on your account. And going back to the widgets, these are customizable. So, if you click the pencil icon of these widgets, you can actually add new bookmarks, and for this particular one, but the settings will be different for every widget.
So, besides just seeing what it's going to look like in the browser, in the browser we can see, preview it and see what it will look like on mobile devices. So, here it is on an iPad size device. We can make it so what you look like on a phone. And Web App Builder makes apps that are responsive. So, as you can see here, the UI fits the screen depending on what size a device you have. Get to the other widgets here, just a different way of looking at it when it's at a smaller screen size, but the map is still fully accessible. So, that's the hosted version of web app builder.
The developer edition can be found on the developer site. Go to documentation, I've already downloaded web builder, so I'll go there now. Once you unzip the file, you'll find there's a startup file which you'll use to launch Web App Builder. So, start it up and open a new browser window. The first thing you'll specify is your organization, or portal URL. If you are using a developer account, you'll find this by clicking on your profile name, and then the account URL path. So that's been filled in already. So for app ID we're going to create a new app. It can be found by clicking the applications button, and we see we already have a ECCE app challenge. That's from previously opening up a hosted version of Web App Builder. So we'll go there and click, register application. There we have our client ID. Paste that into the box, click continue. We get an error message, invalid redirect, so to fix this, we need to go to the authentication tab under the application you're using, and enter in the machine name for current redirect URLs. So, we're going to add in, machine name can be found here, the URL. We’re going to use that HTTP, and HTTPS. And when we refresh this, continue, we now get this request for permission. And this is Web App Builder asking for the ability to access your ArcGIS online account. So we'll approve that, and now we're a Web App Builder, developer edition.
So, we're going to create a new app, and once this loads we'll see that we're in the same type of environment that we were in on the hosted version, which looks exactly the same with the same widgets and themes. We haven't chosen the right web app, so we can go in here and you can choose our ECCE map, challenge map, but the rest of the interface is the same. I'm going to save that, and go back to the main screen.
So, now with this screen, we can create a whole bunch of web apps here, but the one we just created we want to download and modify. So, I'm going to hit this button and then the download link. And once it is downloaded it’ll give you a zip of all the code behind that app. I'm going to go there and unzip it to my server. Take all these files, extract, and I'll create a new Web App Builder folder and unzip it, those files, into there.
Once that's done, we can go and view the app, on our local server. So, we've just been, used the default widgets. These are already created for us. But to create your own, that's really the benefit of using the developer edition, is now we can go into the widgets folder and here are all the widgets that were already created for us. We can add our own widget. And actually, the web app builder installation has a sample widget you can use. So, inside of this path there is a sample widgets directory, and you can use the custom widget template. Copy this, as the base for the widget you're going to develop. And this structure is how all the other widgets, all the other widgets follow the same structure for organizing their code. So all the actual code is in the JS file, the widget.js file, and the HTML structure, the markup.
So, I'm going to open up the widget.js file. And you can see these functions here, messages to communicate with the app container. These are methods you'll, you'll use and comment when you actually go ahead and start putting in your own code. On the home screen of the web app builder page, I go back to the documentation. There's a guide that has some help for widget development. So I recommend you read through this to get comfortable how the Web App Builder works and how it uses widgets. There’s also themes you can develop to change how it looks, and some sample code you can use.
Video 6
PRESENTER:
Hello, my name is Emily Mariam, and I'm a product engineer specializing in cartography with a Living Atlas environment team. Now, in case some of you aren't familiar with the Living Atlas, Living Atlas is a trustworthy source for layers maps and apps that are contributed by the gis community and are enabling a global web-based GIS.
What's new? Well, we are building a collection of analyzed layers from high-resolution US and global climate models and are also summarizing them into zones that can be enriched with population data. New additions like WorldClim and NASA's IMERG, which you see animated here. Provide updated global precipitation estimates in the US. There are new layers for the US drought monitor and NOAA's urban heat mapping campaign. Storm reports have been updated with more unique storm identifiers, and stream gages have been expanded to include new networks from our community map contributors in the ocean sustainable development goal 14.1. Monthly reporting on coastal eutrophication has been automated. And you've already heard about the ecological marine unit updates and the release of ecological coastal units.
What's new with our partners? There have been several contributions recently from the US forest service with a series of 15 new layers that are available to help map and analyze community wildfire risk. There are also new layers from National Geographic's Pristine Seas Project that show numerical rankings of the global ocean to prioritize conservation activities for biodiversity, food, and carbon. NOAA has added two fire and smoke layers which are identified through their hazard mapping system. Both of these go through quality control procedures that is performed using both machine and analyst-based data screening.
What's coming? There's so much great content being worked on within Esri and in our partner network so stay tuned as these make their way into the Living Atlas collection. Let's jump right into showcasing a few different maps and apps. Alright, I'll start with the high tide flooding app, which is a visualization and data access utility created by Esri where you can explore nuisance flooding projections through 2100 and different scenarios across the United States. Nuisance flooding projections are an invaluable resource made available by NOAA CO-OPs. This information can help coastal planners better understand potential flooding impacts and identify locations at risk. Next, Esri's drought-aware app provides an interactive experience to examine past, present, and future drought conditions for the US, along with potential impacts to population and agriculture. You can click on a county or estate and get the latest information as well click through the time series to use data from NOAA, the US department of Agriculture, and the US Census.
Another recent addition to the Living Atlas is the PADDDtracker from Conservation International. This includes validated data on protected area downgrading, downsizing, and degazettement events. PADD tracks the legal changes that ease restrictions on the use of a protected area, shrink a protected area's boundaries, or eliminates legal protections entirely. They have documented more than 3000 enacted cases of PADDD in nearly 70 countries for a total area of more than 130 million hectares. Also shown on this map is the world database of protected areas and is also available in Living Atlas.
There are also new maps from the First Street Foundation. A non-profit research and technology group that has a nationwide flood model called Flood Factor, which shows any location's risk of flooding from rain, rivers, tides, and storm surge. It forecasts how flood risks will change over time due to changes in the environment. The pop-ups have detailed information by county, state, congressional district, and zip code.
One of the things I love about the map viewer are the blend modes. Let's add from Living Atlas, the world population density estimates so that we can use it to highlight only those areas within the polygon where people actually live. The blend mode destination atop will allow the flood layer to be drawn only where it overlaps with the population layer. So now, instead of using polygons, you get a clear picture of where people are actually living with just a few clicks. I hope you've enjoyed the latest and greatest from living atlas, and thank you very much.
Video 7
[Female VO] Maps... A foundation of geographic knowledge... to help us navigate the world, explore, protect and sustain our resources, save lives, and preserve these lands for our children. As part of the Department of the Interior, the United States Geological Survey has led the way in mapping the nation. Mapping goes hand and hand with American history, the exploration of the west, and the development of our country.
[Male VO] A government cannot do any scientific work of more value to the people at large than by causing the construction of proper topographic maps of the country.
[Female VO] In 1884 John Wesley Powell established a program for mapping the nation and helped define a new frontier. Over the next 125 years, mapping methods changed as the use and technology matured. Evolving from field sketching and manual cartography to producing paper maps, then modernizing to digital mapping using the latest geospatial technologies.
[Allen Carrol, National Geographic Society] Maps are the heart and soul of what we do here, at National Geographic. We were founded in 1888 and almost from the very beginning we worked closely with the U.S. Geological Survey for accurate and authoritative base maps of our country. Now in digital form, maps are constantly changing and that’s a very exciting opportunity for us. We can take those data layers in The National map, things like roads, buildings and rivers and we can shape them and customize them and serve various audiences on new platforms in ways that we could never have imagined even just a few years ago.
[Female VO] Born from the digital revolution is The National Map. Today The National Map is everywhere.
Text fly-ins: -- based on data from US Geological Survey-Google Maps
-- New generation of digital topographic maps-Directions Magazine
-- archived imagery and maps provided by US Geological Survey-TerraServer USA
-- including ”imagery: US Geological Survey”-Google Earth
When you see computer simulations of the earth’s surface, you are likely looking at data from The National Map.
Text fly-ins: -- compiled from best available sources including the US Geological Survey”-ESRI
It’s fundamental data; It’s familiar information we use every day and may not even know it.
[Jack Dangermond] Today geospatial technologies are advancing the way we are thinking as human species. The USGS has done us a major service by providing a key base map which spans from sea to sea, from border to border. This will affect how we plan things it’ll effect economic development, it’ll make our society better, it will help us manage our environment more effectively and get citizens engaged. I really strongly support The National Map and the efforts that the USGS is making to provide this foundation.
[Female VO] The National Map provides foundational information nationwide. These include... Aerial Imagery... Elevation...
Place and feature names... Water... Land cover... Transportation... Structures... and Boundaries. With innovative services like the new National Map viewer platform, a user can visualize data they want to download or manipulate and make their own map.
Another new product built on the USGS legacy and data from The National Map is US Topo(TOE-PO). US Topo provides updated electronic topographic maps that are available at nationalmap.gov. To acquire and maintain better data, The National Map relies heavily on partnerships with Federal, State and local agencies...along with industry. With huge challenges ahead in the areas of Energy, Emergency Operations, Human Services and Natural resource Management, finding solutions will depend on stewardship of geospatial data.
[Tommy Dewald, EPA] The U.S. Environmental Protection Agency works with many different organizations to provide the
nation with clean and safe water. Together we collect a vast amount of water quality data. The mapping of water data is accomplished in partnership with the U.S. Geological Survey. This partnership lead to the development of The National Hydrography Dataset that provides a common referencing system of the nations surface waters. The federal and state organizations who work together to develop the National Hydrography Dataset now also contribute to its improvement through The National Map’s data stewardship program. The U.S. Environmental Protection Agency is one of many organizations that benefit from the geospatial data from The National Map.
[Female VO] The National Map of the future will offer more innovations and online capabilities, increased investment in stewardship, leading to greater knowledge and easier accessibility to national geospatial information for everyone.
[Marcia McNutt, USGS Director] At the USGS we are committed to forward-looking, advanced research and development of geospatial technologies. With the support of our partners, The National Map provides valuable data and services
to meet the changing needs of our nation. The future holds endless possibilities for using maps and geo-referenced datasets allowing citizens and scientists alike to explore the true nature of our planet’s geography. To learn more about The National Map and how to become a valuable partner, visit www.nationalmap.gov [49].
Readings
Reading 1: Skim the Esri Living Atlas of the World Story Map [50] and browse the Esri Living Atlas [51] content.
Reading 2: Skim the content of the Web App Builder for ArcGIS help information about the Swipe widget [52]
Lesson Data
Lesson Data
This section provides links to download the Lesson 2 data and reference information about each dataset (metadata). Briefly review the information below so you have a general idea of the data we will use in this lesson. You do not need to click on any hyperlinks, as we will do this in the Step-by-Step Activities.
In this lesson, we will experiment with two types of online datasets: Esri Base Maps and data services hosted by the U.S. Geological Survey's National Map.
Note:
The websites and servers may occasionally experience technical difficulties. If you happen to work on this lesson while one of the sites is down, you may need to stop work and start again the following day to allow time for the servers to come back online. Beginning this lesson before Wednesday will help avoid any issues.
Lesson 2 Data Download:
Note: You should not complete this activity until you have read through all of the pages in Lesson 2. See the Lesson 2 Checklist for further information.
Create a new folder named "GEOG487" directly on your C drive. It should have a pathname of "C:\GEOG487." You will use this folder for the remaining lessons. It is very important that your pathname is short and has no spaces in it, as this will cause problems later in the course when we use geoprocessing and spatial analyst tools.
Create a new folder in your GEOG487 folder called "L2." Download a zip file of the Lesson 2 Data [53]and save it in your "L2" folder. The rest of the datasets we will use in the lesson are available as online data services. Information about all datasets used in the lesson is provided below:
Metadata
Study_area.shp: Shapefile showing the boundaries of the proposed project.
Esri ArcGIS Online Basemap - Imagery Hybrid
Metadata:
- Imagery Hybrid [54]
- World Imagery [55]
- Hybrid Reference Layer [56]
Note:
You can also view the metadata for layers in ArcGIS Online by clicking on the "Show Properties" tab. When you hover over each dataset, you should see the horizontal ellipsis or more options menu. Click on the ellipsis > Show Properties > Information.
The National Map - National Land Cover Dataset (NLCD):
- Interactive Website: Multi-Resolution Land Characteristics Consortium (MRLC) Viewer [57]
- Data:
- NLCD 2016 Results Paper [61]
- NLCD 2021 Web Map Services (WMS) Information [62]
Additional resources:
Sentinel-2 10m Land Use/Land Cover Time Series [63] - Global map of Land Use/Land Cover (LULC) from ESA Sentinel-2 imagery
Step-by-Step Activity
Step-by-Step Activity: Overview
Step-by-Step Activity: Overview
In the Step-by-Step section for Lesson 2, we will explore a variety of environmental geospatial datasets available online, review metadata, create maps using ArcGIS.com, and share the maps as an interactive web application.
Lesson 2 Step-by-Step Activity
Note: You should not complete this step until you have read through all of the pages in Lesson 2. See the Lesson 2 Checklist for further information.
Introduction
Introduction
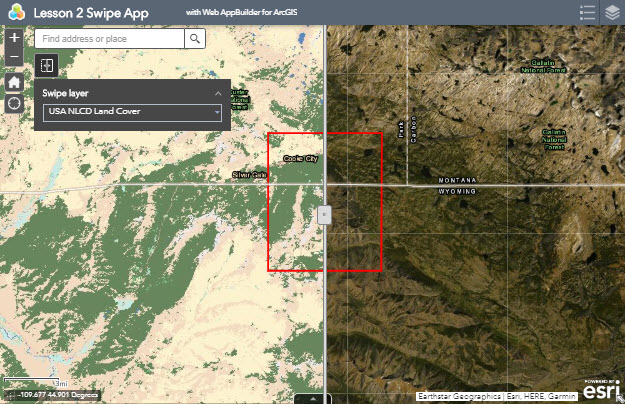
In Lesson 2, we are going to create a website that contains interactive maps with datasets related to our project scenario described in the Introduction. We will create maps and web applications using ArcGIS Online. We will save our maps in the cloud using Penn State’s ArcGIS Online for Organizations account. Our final product will look like the example below.
Lesson 2 will cover the major steps listed below
Part I
- Explore Metadata
- Configure ArcGIS Online Account
Part II
- Explore Imagery Data & Land Cover Data
- Create Imagery & Land Cover Map
Part III
- Configure Swipe Web Application to Display Map
Note
This lesson will provide many details and graphics illustrating how to do each step using ArcGIS Online. Later lessons will not provide as much detail, as we expect you to reference previous lessons and explore help topics if you get stuck.
Part I: Metadata
Part I: Metadata
-
Explore Metadata
It is important to understand the opportunities and limitations of your input datasets before you begin working with them. We will do this by exploring the available metadata. As a geospatial professional, you will often be the only person reviewing this level of detail about the datasets. It will be your job to communicate what you find with the rest of your team.
- Use the links to metadata provided in the Lesson Data section to fill in the table below. Note: It is OK if you can’t find the answers to all of the questions for both data sets. This exercise is meant to demonstrate that finding the metadata you need is not always easy.
Metadata Metadata Imagery Land cover Timeframe
(Year or Range)Scale
(1:x or cell size)Organization(s) that
Created DataOrganization Hosting
Web DataCitation Information
Requested by Data ProviderDescription of Coded Attribute
Values Included? Y/N
Were there particular pieces of information that were harder to find than others? Did you notice any differences in the quality and ease of use of different data provider’s websites?
Note: Critical Thinking Questions are not graded. They are provided to help you think about the lesson concepts. I encourage you to share your thoughts on the lesson discussion forum.
- Use the links to metadata provided in the Lesson Data section to fill in the table below. Note: It is OK if you can’t find the answers to all of the questions for both data sets. This exercise is meant to demonstrate that finding the metadata you need is not always easy.
-
Confirm your account on ArcGIS Online for Organizations
Before you can access ArcGIS Online, you need to confirm your account. We will only have to do this once to have access for the rest of the semester. ArcGIS Online has a feature that helps us to manage a group such as this course. In order to take advantage of the Group features, I will need you to "Sign In" to the Penn State ArcGIS Online organization using your Penn State Username and Password. Follow the steps below to Sign In and confirm your account for the first time. There are directions at arcgis.com to create a Personal Account that you can use to complete this course. Note: If you are not enrolled in the class, you will not have access to Penn State’s ArcGIS Online for Organizations account.
- Go to ArcGIS Online and login using your university single sign-on account username and password:
- Go to ArcGIS Online and login using your Penn State Username and Password. URL: https://pennstate.maps.arcgis.com [64]

- This should log you onto Penn State’s ArcGIS Online for Organizations account titled “ArcGIS Online at Penn State”
- Click on your name > My Profile (upper right) > My Settings > Licenses and confirm your “Role” as a “Publisher".
- Notify the instructor if you are not able to successfully complete this step.
- Go to ArcGIS Online and login using your Penn State Username and Password. URL: https://pennstate.maps.arcgis.com [64]
- Begin Step #3 once you are able to sign in to the Penn State AGO Organization.

Please do not log in using an account that you created outside of the program. According to Esri’s website, “you will transfer ownership of your items to Penn State's Online for Organizations” for any content that is saved in the account you log in with. This means that any instructors or students using the Penn State account will be able to have administrative rights to your preexisting content.
- Go to ArcGIS Online and login using your university single sign-on account username and password:
-
Confirm that you are also listed within our Geog487 Group.
- Click the “Groups” tab at the top of the Pennsylvania State University AGO Organization page. This will return a list of all of your Groups, or, you can type in GEOG487 into the search box and select the option that says “Search for Groups” and look for the current semester (e.g., GEOG487 Fall 1 2023).
Note: There is a group for each semester. - Click on the group name to access our Group’s space.
- As the course progresses, we will be posting several assignments here for review and discussion.
- Click the “Groups” tab at the top of the Pennsylvania State University AGO Organization page. This will return a list of all of your Groups, or, you can type in GEOG487 into the search box and select the option that says “Search for Groups” and look for the current semester (e.g., GEOG487 Fall 1 2023).
Part II: Imagery and Land Cover Data
Part II: Imagery and Land Cover Data
-
Explore Imagery & Create Map
- The first dataset we will explore is offered as a basemap in ArcGIS Online. Log in at Penn State AGO Organization [65] using the Sign In link at the top (if you are not already logged in).
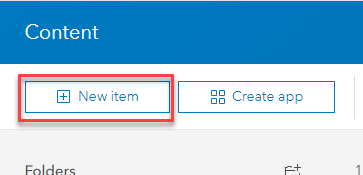
- Click on the Content tab
 .
. - Select the +New item button.
- Add the Lesson 2 Study Boundary.
- Download the L2Data.zip file from the Lesson Data tab on the main course website if you have not already done so. Be sure to keep the data zipped and follow the folder naming directions specified on the page. You will likely experience trouble later in the semester if you choose to use a different pathname.
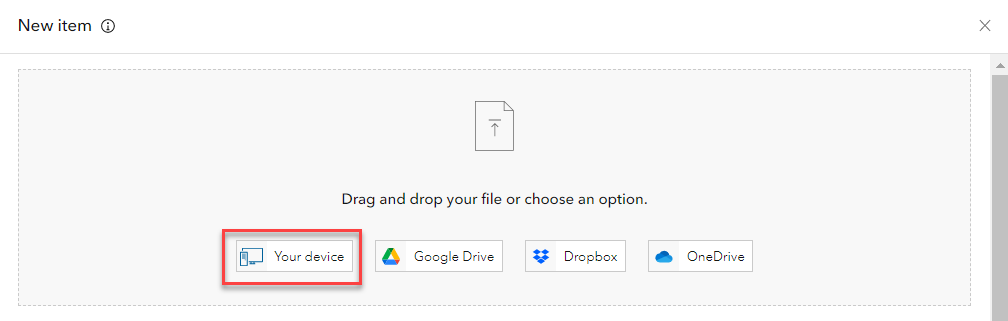
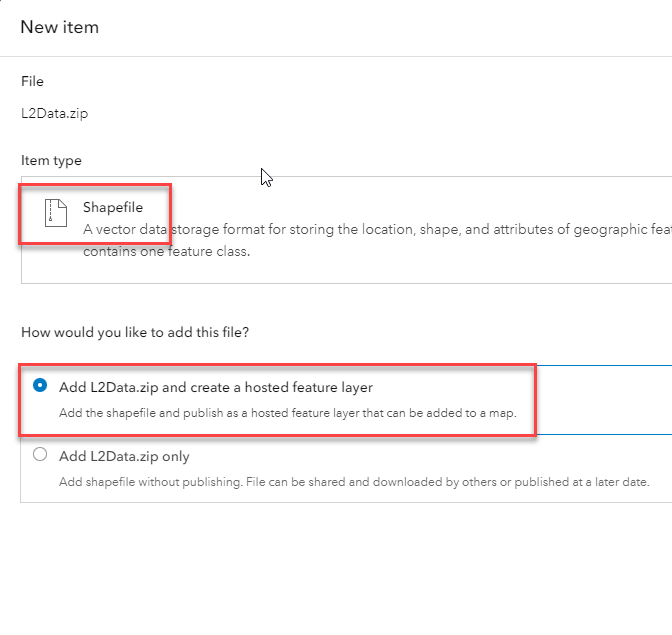
- Click Your device and then browse to the L2Data zip file. The item type is a Shapefile. Select the "Add the L2Data.zip and create hosted feature layer" radio button. Click Next.
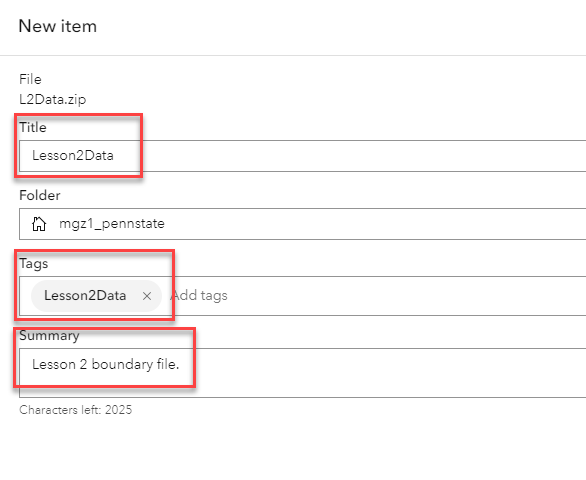
- Add a Title, Tags, and Summary description of the Lesson 2 study boundary file. Click Save.
- You will be redirected to an overview of the Lesson2Data shapefile. Verify and add relevant information.
- Click on the Open in Map Viewer button.
*Alternatively, you can select the Map tab to create an Untitled map in Map Viewer. Select Add a layer, navigate to My Content, and select "Lesson2Data" to add the Feature Layer.
- An "Untitled map" in a Map Viewer will open with the "Lesson2Data" added as a Feature Layer.
- Click on the "Lesson2Data" layer name to open the layer Properties along the right side. Click on Edit layer style under Symbology.

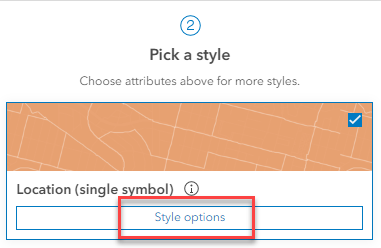
- Under #2 "Pick a style" select Style options.
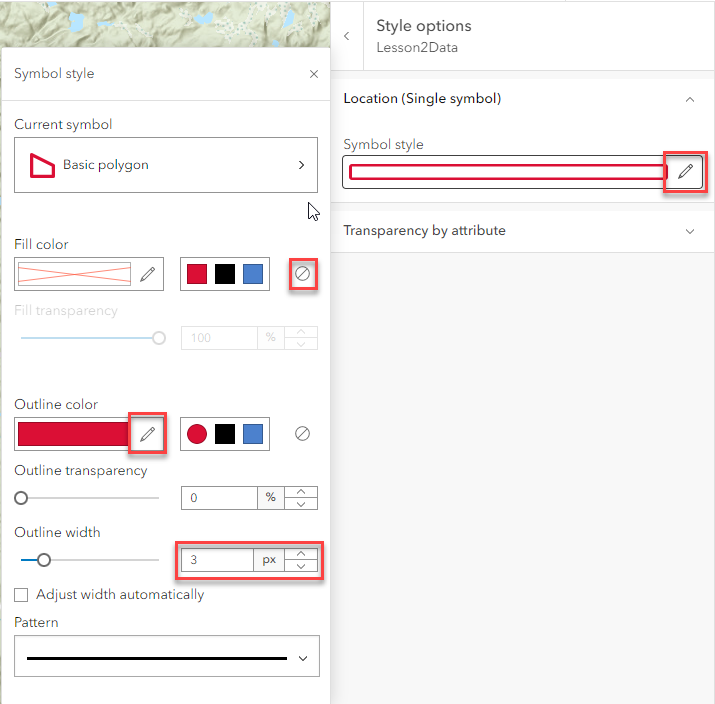
- A dialog box will open that allows you to change the symbol style of the features in the layer. Click on the pencil to change the style of the "Symbol" of the Lesson 2 study boundary to a hollow red outline. Select the "X" to close the window when your symbol style selections have been made, and click Done two times to exit the Styles options.
- Click on the Options icon "…" after the file name in the Table of Contents, then "Zoom to" to center the Map on the study area.
- Save your Map by clicking on Save
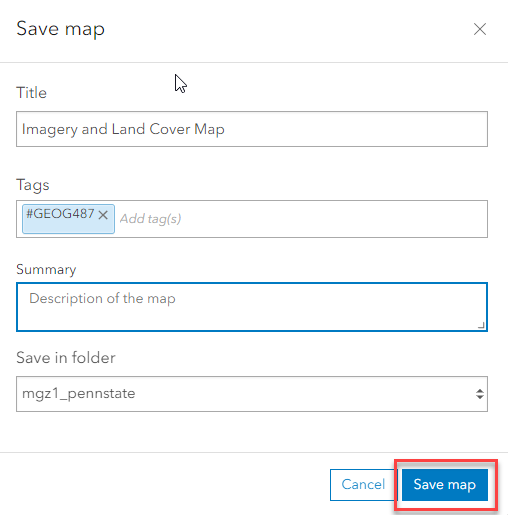
 > Save As. Note: It's a good idea to save often, just in case you lose your Internet connection or other unforeseen mishaps occur. Change the title to "Imagery and Land Cover Map," add tags for the class and your name, and write a summary of what the Map shows. The folder's name will default to match your login name (so it won't match the graphic below).
- Change the name of the Lesson2Data layer to "Study boundary" in the Table of Contents. To do this, click on the "…" after the layer name, then "Rename." Save your Map again to lock in your changes.
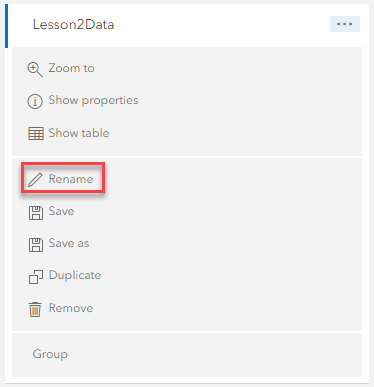
Note: Data layers often have default names that will be meaningless to most people who read your Map (like your boss and clients). Make sure you review layer names and change them, so your maps make sense to people other than yourself.
- Explore the surrounding area using the zoom and pan functions. To zoom, use the mouse wheel. To pan, left-click your mouse, hold it down, and then drag your mouse in the direction you want to view on the Map.
- Change the Basemap to "Imagery Hybrid."
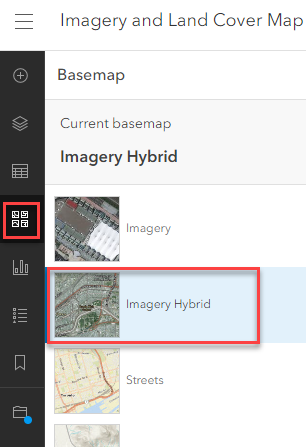
- Explore the surrounding area again using the zoom and pan tools. Save your Map.
Which National Park is the Study Site near?
Which state(s) is the Study Area located in?
How much detail can you see in the imagery if you zoom in close?
-
Explore Land Cover Data & Add to Map
The second dataset we will explore is part of the United States Geological Survey (USGS) National Map. The land cover data service is hosted on their website and server. We can access the data in ArcGIS Online and by using their website (there are other options too).
- Let's start by exploring their website.
- Go to The National Map [66]. Wait a few seconds, and the Map will automatically appear.
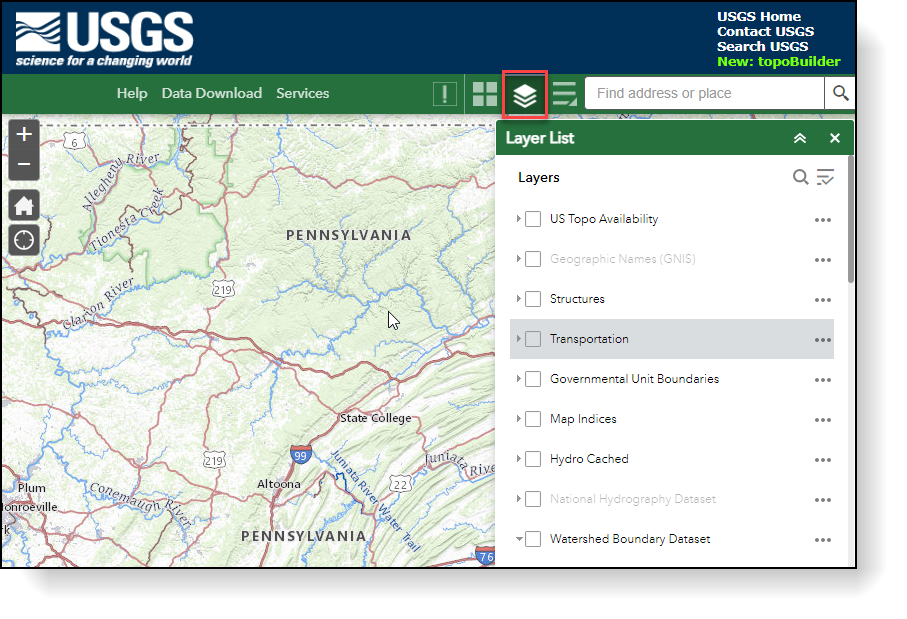
- Notice there are many datasets available in addition to Land Cover. Spend 10-15 minutes exploring the tools and datasets, as you will likely need to use these in many of your own environmental projects.
- Try to identify which layer or layers match the data sets we will add in this lesson. See the "Lesson Data" page for specific file names.
- Practice customizing the Map by turning layers on and off. You may need to click a button for the Map to redraw.
- Experiment with identifying the attributes of a vector data layer. Activate the vector feature layer by placing a check in the Layers List. For example, place a check beside the "Watershed Boundary Dataset" and "WBDLine" in the Layer List and then click on the Map to activate a pop-up containing attribute information.
- Look for tools or links to download datasets.
- Go to The National Map [66]. Wait a few seconds, and the Map will automatically appear.
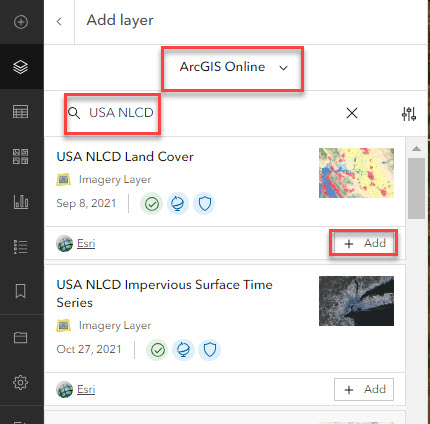
- Instead of downloading the data through the website, let's add the NLCD to our Map via ArcGIS Online. We can do this by performing a search. Search ArcGIS Online for the land cover dataset and add it to your Map.
- Select Add layer
 and change the drop to ArcGIS Online. Enter "USA NLCD Land Cover" in the search, and you should see a service published by ESRI. Add the NCLD Land Cover time series layer to your Map.
- Select Add layer
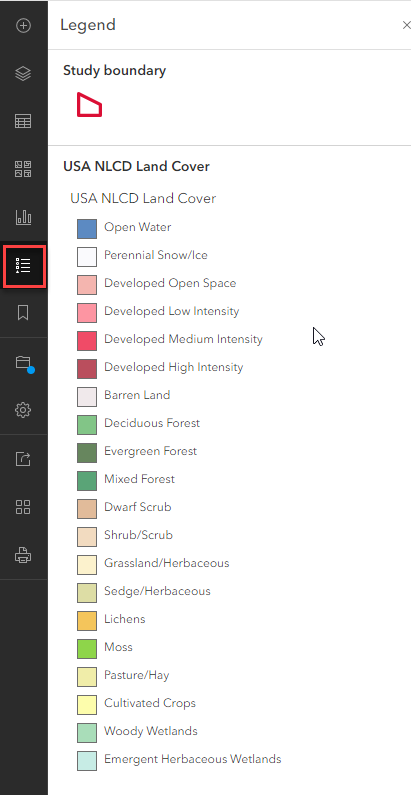
- Navigate back to the Map. Change the order of the layers if necessary, and click on the legend icon
 to show the Legend. Review the Legend so you can understand what the colors represent.
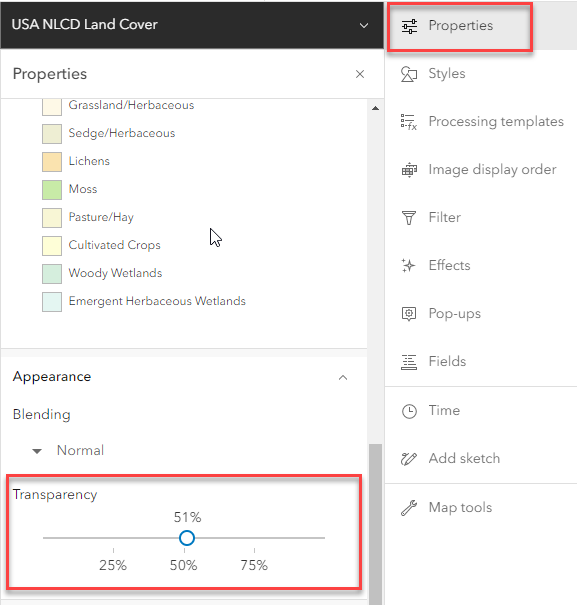
- Change the transparency to ~50% so you can see the imagery beneath it. You must click on the "Properties" top right to do this. You can also rename the layer if you would like. Do you remember how we did that earlier in the lesson?
- Explore the land cover for the study area using the zoom and pan tools. Click on the "X" to close the Legend.
- Save your Map.
After exploring the same dataset using ArcGIS Online and the online viewer provided by the data creation agency, can you think of any scenarios where one method would be preferable over the other?
- Let's start by exploring their website.
Part III: Building a Web Application on the Penn State AGO Website
Part III: Building a Web App on the Penn State AGO Website
Now that we have created individual maps for each dataset, we can combine them into one using a template web application provided by Esri. You can use these templates to share your data in an easy-to-use format. Note: You need to be a member of the GEOG487 group to complete this section.
-
Share the Display Map
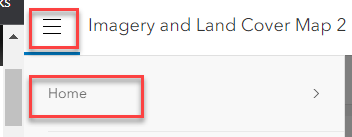
- Click on Home > Content to view the list of maps you created. The map list is found under the My Content tab.
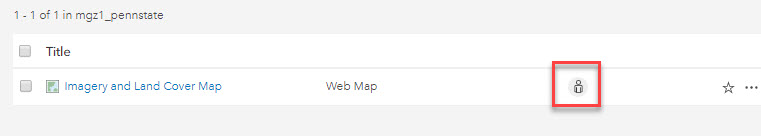
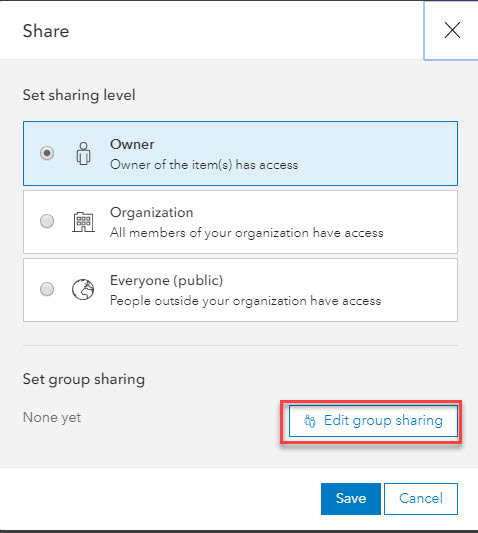
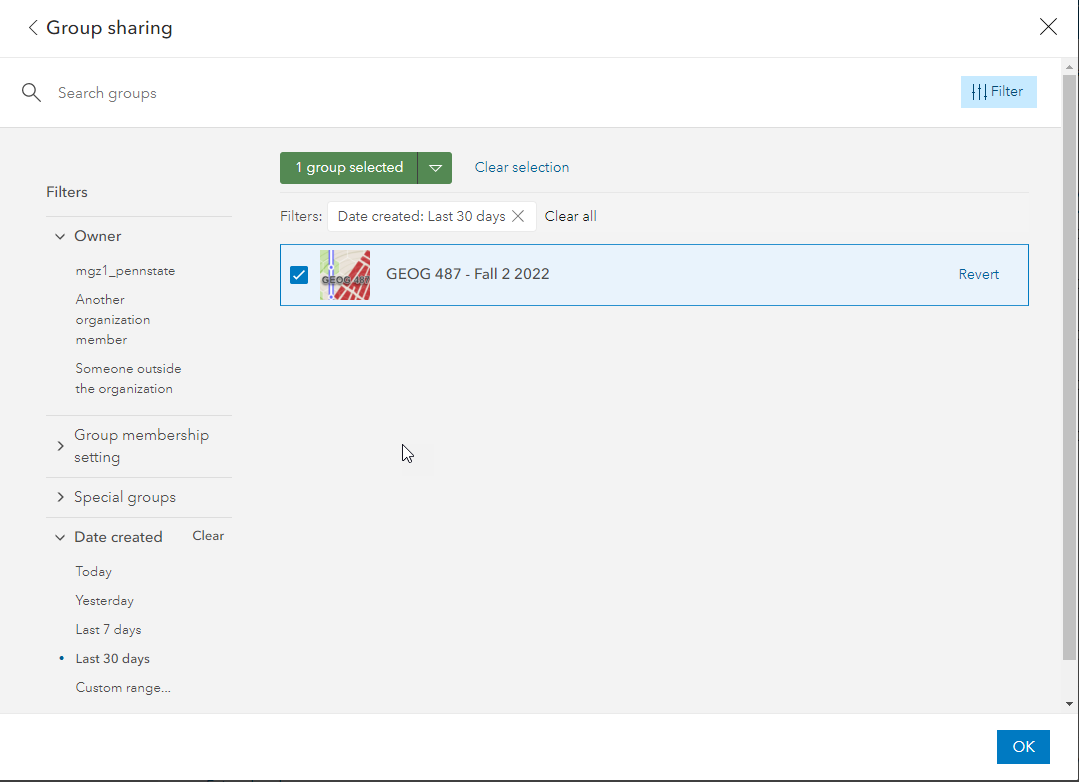
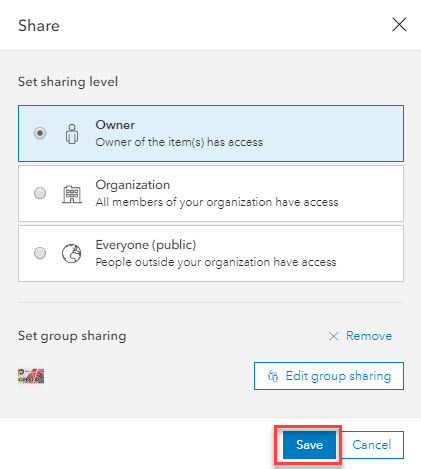
- Share your maps with the class by using the visual guides below.
- Select “Geography 487 - Semester”
-
Click Update to synchronize sharing of the dependent items you have permission to update Lesson2Data.
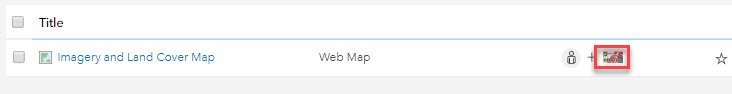
- You should see the Group listed as the Shared Status as shown below.
We will be sharing our work with the class throughout this course in ArcGIS Online. Please follow Penn State’s Academic Integrity guidelines covered in the Syllabus. (As a group administrator, I will be able to see if you created your own maps or made a copy of another student’s work).
I encourage you to view other students' work to learn and be inspired. If you incorporate any of their ideas in your own work, please list their name and map URL in your sources.
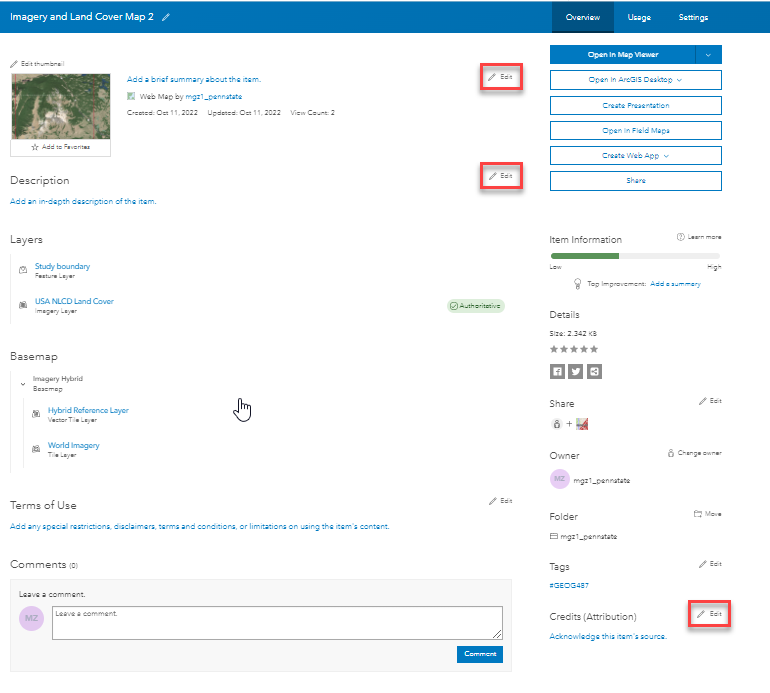
- Edit the descriptions for a map by clicking on the title. Your text should be short and to the point. What do map viewers need to know about this dataset to use it quickly?
- Include the citation information requested by the data provider (see metadata) in the credits section.
When designing maps and applications, it is best to assume that your end users don’t know where the study area is and are not familiar with the data – where it came from, what it is supposed to be used for, etc.
It is your job to point them in the right direction by crafting descriptive titles, useful captions, and helpful legends. Be nice to your audience! A good rule of thumb is to show your map to a non-geospatial friend. If they look confused, you need to revise it.
Good captions describe what a map shows AND why the reader should care.
Bad Caption – “This map shows the study area in red.”
Good Caption – “The study area (shown in red) is located near Yellowstone National Park along the border of Montana and Wyoming. The terrain consists of steep mountains and valleys, making transportation by car difficult.
- Click on Home > Content to view the list of maps you created. The map list is found under the My Content tab.
-
Create Web Application
- Click on the Content tab to once again view a list of the maps you have created.
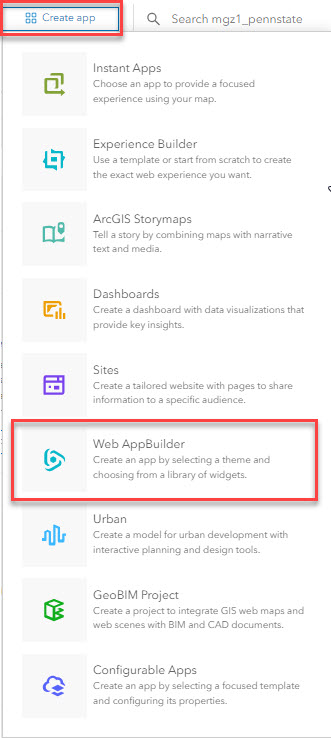
- Click on the + Create app menu. Select Web AppBuilder.
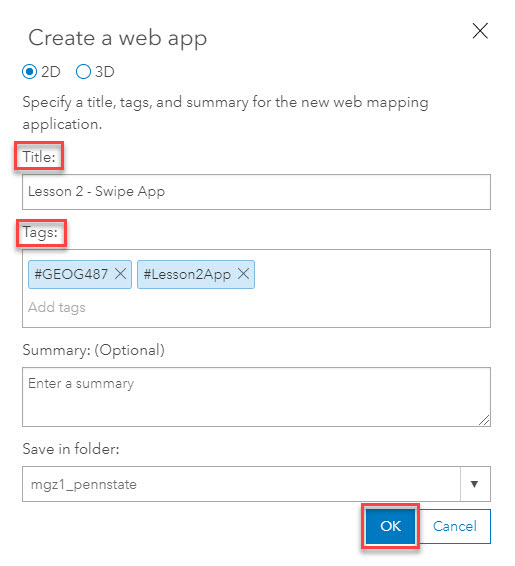
- Specify the Title: and Tags: for your web app. Make the title meaningful but succinct. The Summary: is optional and folder location will default to your My Content folder.
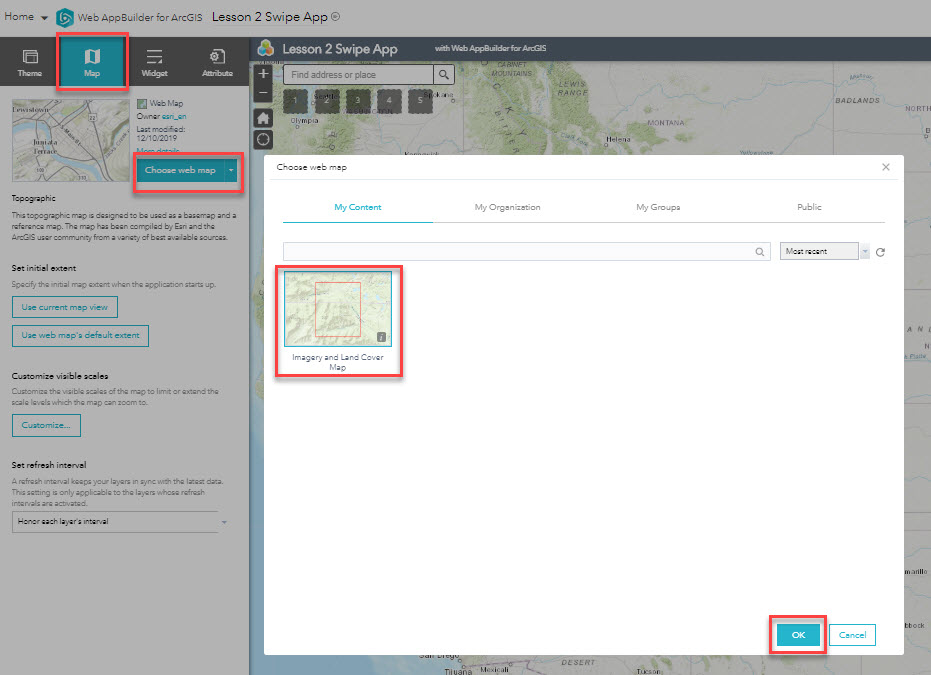
- The Web AppBuilder for ArcGIS will open. Click on the Map tab and select Choose web map.
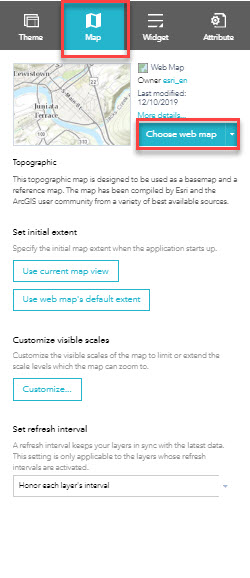
- Under Choose web map, select the "Imagery and Land Cover Map"
- Click on the Widget tab, and select click on a widget placeholder.
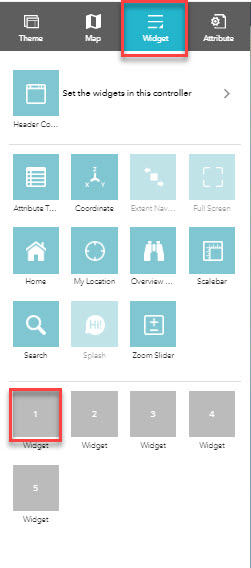
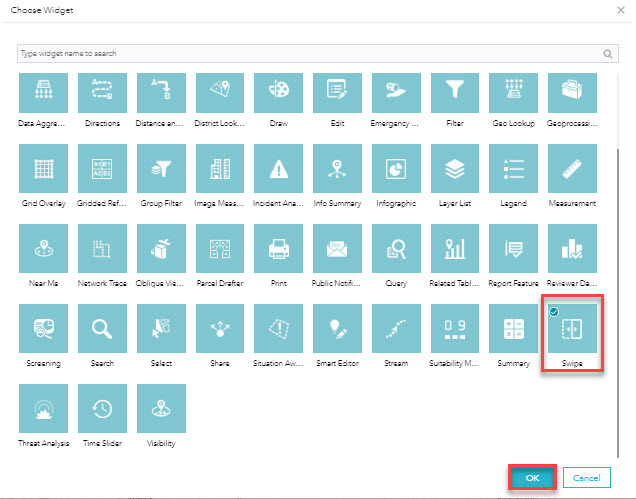
- The Choose Widget window will open. Select the Swipe widget.
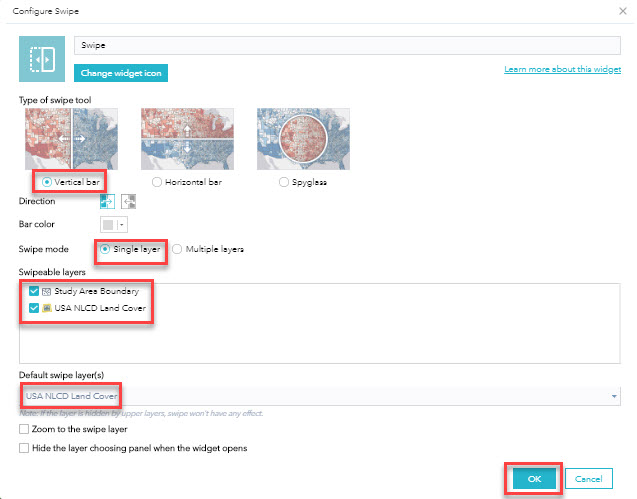
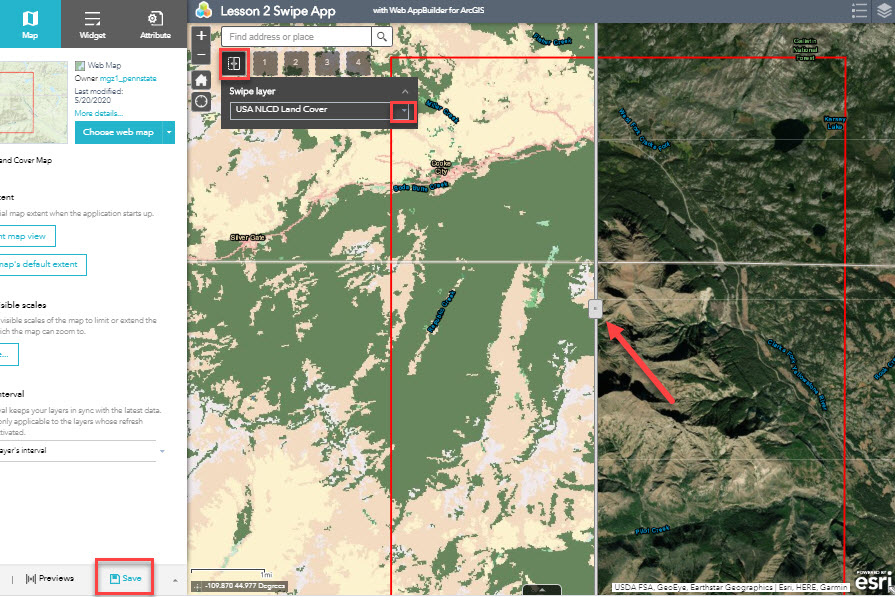
- Configure the Swipe widget based on the following options. The type of swipe tool will be a Vertical bar, the swipe mode is Single layer, the swipeable layers are "Study Area Boundary" and "USA NLCD Land Cover," and the default swipe layer is "USA NLCD Land Cover."
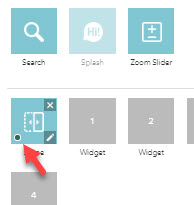
- To open the Swipe widget automatically when the app starts, hover over the bottom left of the Swipe icon under the Widget tab and click the circle.
- Select the Map tab. You should see the Swipe widget icon on the upper left corner of the map. Click on this widget icon to turn the widget on and off. Take some time to explore the functionality of the widget. Click on the Vertical bar to move it right or left. Be sure to Save your work.
- Navigate back to the Content tab within the Penn State AGO Organization [64] and notice that the new App has been added to your My Content list.
- Be sure that your App is shared with the GEOG 487 Group.
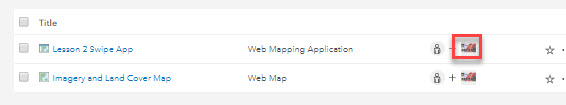
- Click on the Title of your App to open it. Review your final web application to make sure the titles, descriptions, and other information are correct. You may need to edit the individual maps for the information to update in the web application (legend titles, colors, extent, etc.). Double-check that you listed your map sources.
That’s it for the required portion of the Lesson 2 Step-by-Step Activity. Please consult the Lesson Checklist for instructions on what to do next.
Try This!
Review some of the other configurable web application templates at ArcGIS> Gallery > Apps [67]. Do you think the Swipe/Spyglass WebApp widget is the best choice to present the two datasets from our lesson? Post your thoughts in Canvas Lesson 2 Discussion.
Try This! Activities are voluntary and are not graded, though I encourage you to complete the activity and share comments about your experience on the lesson discussion board.
Advanced Activity
Advanced Activity
Advanced Activities are designed to make you apply the skills you learned in this lesson to solve an environmental problem and/or explore additional resources related to lesson topics.
Directions:
In Lesson 2, we learned about several places to search for GIS and geospatial data online and created a web app to help a team get acquainted with their new field site. We only included a few pieces of information so far - imagery, land cover, and the study area boundary. Browse or search through the available datasets in ArcGIS Online (Click on Map > + Add layer > select Living Atlas from the pulldown and browse or search for available layers). Choose another dataset you feel would support the team's mission and add it to the map. Include the Study Area Boundary and Imagery Hybrid basemap. Save your map as "Map 3 - Your Dataset Name." Update the tags and description and share it with the class in ArcGIS Online. Esri has recently added a lot of new data to AGO (including ArcGIS Living Atlas live feeds [68] that you can search for when you add features using +Add layer in the Map Viewer).
Summary and Deliverables
Summary and Deliverables
In Lesson 2, we discussed how and where to find geospatial data for environmental projects and common formats of GIS and geospatial data available on the Internet. We also used several online data services to create an interactive mapping application in ArcGIS Online for Organizations. There are both pros and cons of using online data services. In the next lesson, we will compare and contrast them with using raw geospatial data.
Lesson 2 Deliverables
Lesson 2 is worth a total of 100 points.
- (30 points) Lesson 2 Quiz
- (70 points) Lesson 2 Discussion Post The online maps and app you created in the Step-by-Step and Advanced Activities must be saved in Penn State's ArcGIS Online for Organizations Account to receive credit. To submit your assignment, post a note in the Lesson 2 [Deliverable] Discussion. Include your name and the elements below:
- Map Links:
- URL of your Interactive Web Application from the Step-by-Step Activity
- URL of your Web Map or Web Map Application from the Advanced Activity
- Reflection: (150-300 words) Consider the power of sharing your own maps and data on the Internet. Describe how you could have used this functionality for a previous project or could use it for a future project you'd like to work on. Describe at least one benefit and one drawback of publishing your maps online instead of creating a static map layout. Explain why you choose the particular dataset for your third map from the Advanced Activity.
- Map Links:
- Peer Review (optional): Explore other students' submission and add a short comment on their post.
Evaluation Criteria:
- Mastery: Demonstrate that you can find and share data using tools and templates in ArcGIS Online.
- Effective Communication: Map design (colors, titles, legends, and captions) makes it easy for readers to use maps for a specific, intended purpose and understand a particular message.
- Reflection: Demonstrate ability to recognize tradeoffs between different approaches.
- Follow Instructions: Include all required map elements, end products saved in Penn State's ArcGIS Online for Organizations Account, post deliverables, submit on time, etc.
| Swipe Map App | Link to swipe map app is present and includes proper imagery and land cover maps. (20pts) | Link is present, but app is missing an element. (15pts) | Link is present, but app is missing several elements. (10pts) | Link is missing. (0pts) | 20pts |
|---|---|---|---|---|---|
| Advanced Activity Map | Link to map is present and includes imagery, study area boundary, and one additional layer. Map is properly described. (20pts) | Link is present but is missing an element (map layers, descriptions.) (15pts) | Link is present but is missing several elements (map layers, descriptions or does not function properly. (10pts) | Link is missing. (0pts) | 20pts |
| Reflection | Discussion is present and includes 150-300 words addressing other applications for this activity, benefits, and drawbacks of online maps, and why the 3rd data layer was chosen. (15pts) | Discussion is present but is missing a required topic. (15pts) | Discussion is present but is missing several required topics. (10pts) | Discussion is missing. (0pts) | 20pts |
| Prose Quality | Is free or almost free of errors (complete sentences, student's own words, grammar, spelling, etc.). (10pts) | Has errors, but they don't represent a major distraction. (5pts) | Has errors that obscure meaning of content or add confusion. (0pts) | 10pts | |
| TOTAL | 70pts | ||||
Tell us about it!
If you have anything you'd like to comment on or add to the lesson materials, feel free to post your thoughts in the Lesson 2 General Discussion. For example, what did you have the most trouble with in this lesson? Was there anything useful here that you'd like to try in your own workplace?
Additional Resources
Additional Resources
This page includes links to resources such as additional readings, websites, and videos related to the lesson concepts. Feel free to explore these on your own. If you'd like to suggest other resources for this list please send the instructor an email.