GEOG 488
Lesson 1: Assessing Data Needs
Did you complete the Course Orientation?
Before you begin this course, make sure you have completed the Course Orientation (see the Start Here! menu at left).
Module 1: State College Borough Water Authority
Introduction
In the first part of this module, you will be introduced to a scenario in which an organization is trying to decide whether or not to make the investment in GIS. You will browse some of their existing data and draw some of your own conclusions about the decision.
In the second part of this module, you will begin to formulate your course project idea and plan. That will be your main focus this week. The first phase of your GIS plan will be to assess your local GIS situation. The assessment phase will require a lot of legwork. If you don't already have an idea, this assessment phase may help you come up with one and to go out on your own and find a few organizations (local government, utilities, consultants, etc.) and begin to document their past, present, and future plans for GIS. A couple of possible scenarios are listed in Part II. You will be expected to contact at least three people in your community by week 3 of the course.
A. Goals
Upon completion of Module 1, you will be able to: define some data needs of a particular organization; identify appropriate and cost-effective data sources for that organization; determine whether available data are sufficient for the needs of that organization, or if new data should be produced; and try to determine whether or not land surveyors should be called upon to produce data.
B. Background
You will load and assess some data provided by a local water authority and think about what the authority's GIS data needs are, what the potential cost to convert their system might be, and consider what steps the authority might take in the future. You will then start to work on your own GIS assessment. You will get in touch with an organization in your area (i.e. local government or utility), find out if they are using GIS, and provide information about how they've made choices in regards to GIS.
C. Module Overview
- Make sure you have applied for your copy of Safe Software FME and the license (see Orientation for instructions, if you skipped it). Support for the Safe Software FME is through the course instructor, not Safe Software or World Campus.
- Define data needs in terms of a User Needs Assessment.
- Identify appropriate and cost-effective data source(s) for a given task or project and consider the merits of private versus public data acquisition.
- Determine whether available data are sufficient for a given task in terms of timeliness, accuracy, precision, ethical use, or if new data should be produced.
- Recognize legal situations in which land surveyors should be called upon to produce data.
D. Deliverables
This module is one week in length. The required deliverable this week is the beginning of a course project -- problem based learning proposal -- in the form of a simple narrative. Other than that you should be loading the software from Safe, finishing the required readings, and participating in the online discussion. The topic is posted in this week's discussion forum - reply to that post. At the end of the lesson you will see a list of things to post to your web page, but these are mostly to get you to start thinking about your project. If you are having trouble coming up with a project, jot down a few ideas and send them to me and I will help you choose between the possibilities. I realize there is a lot to process this week. Ideally, you will get an idea for your project and start to gather some contact information for your area. If you are able to post some of the information listed in addition to a basic outline narrative, that's great. If not, it should be posted by the end of week 2. By the end of the course, the weekly deliverables should all come together as the final deliverable. It should only need to be polished at that point.
Please see the Deliverables section at the end of Part II for this week's readings and action items.
Checklist
Lesson 1 is one week in length. Please refer to the Calendar in ANGEL for specific time frames and due dates. To finish this lesson, you must complete the actvities listed below. You may find it useful to print this page out first so that you can follow along with the directions.
| Step | Activity | Access/Directions |
|---|---|---|
| 1 | Work through Lesson 1 | You are in the Lesson 1 online content now. The overview page is previous to this page, and you are on the Checklist page right now. |
| 2 | Complete the deliverables for Lesson 1 | Page 4 has this week's deliverables. |
Part I: My Story; The Process of Assessing Data
Module 1: State College Borough Water Authority
A. Download the Lesson Data
My story:
The State College Borough Water Authority (SCBWA) serves approximately 65,000 customers in seven municipalities and has about 220 miles of mains. The Authority is not yet using GIS, but is aware of the benefits and costs of a GIS conversion. They have talked to consultants and are starting on a few small projects involving GIS. The Authority has a fairly common story to tell. They have CAD data and paper maps. There are some employees who have worked for the Authority for 25 years who don't even need to refer to the paper maps when responding to a call. At this point in time, starting from scratch and GPSing all features, as one firm suggested, is not an option for the Authority; the cost is too great. They do, however, realize that there are a lot of basemap data freely available at the local and county authority levels, so they wouldn't actually be starting from scratch.
Currently, the Authority's maps just show valve locations and line sizes. Updates are sent to an engineer located in a nearby city. Updates are only made once every two years. The Authority gets about 300-350 "locates" a month, in which Pennsylvania One-Call asks them to locate a line. They also have to go out and work on a line approximately 100 times a month. The design stage for a new development project can take up to a month because they have to wait on other utilities to mark their lines. Therefore, having just the water system in a GIS would not make all jobs much more efficient. The sewer authority has their system in GIS, so the water authority can look to them as an example of what the costs and benefits might be.
The Authority has come up with a list of mapping layers that would be beneficial to them:
- Streets (part of county basemap)
- Property Lines (part of county basemap)
- House Footprints (part of county basemap)
- Elevation Contour Lines (part of county basemap)
- Well Fields
- Storage Tanks
- Pump Stations
- Reservoirs
- Water Treatment Plants
- Water Lines with Valves (including line size, date of installation, length of pipe, date of repairs etc.)
- Fire Hydrants (including hydrant number, flow data with date, manufacturer and model number, etc.)
User Needs Assessment
A User Needs Assessment is a job identification methodology common in Information and Database Technologies. The task of an assessment is to identify end products that the user needs to perform the tasks. The methodology does not need to be identical as long as all the required tasks can be performed. Often it attempted to speed up all tasks through some form of automation. You can see how GIS fulfills that role. If this can be done, all well and good, however, often there is a trade off and common tasks can be expedited at the cost of a more unusual task. Formally, a User Needs Assessment starts with identifying all the procedures and data required to perform all of the tasks as they are done now. Next, automation of the most common tasks is sought. This can be done through technology, better information utilization through better data structures, storage, and retrieval. Frequently, these improvements take the form of automatic data lookup, e.g., returning the location coordinates for a GPS, and an address upon click on a point. In this way, forms can be filled out with minimum of end user input. Next, the rarer tasks are looked at and prioritized according to length of time they take and the frequency they are performed. Finally, any security or procedural upgrades are investigated. Often it is better to introduce these later as it cuts down on the re-training component and staff resentment. However, if they are to be deferred, the data structures need to be in place to facilitate future upgrades. When you start your own problem, think about the end results that users will require. (In real-life these are very complex, but this will give you an idea how they are constructed.)
Infrastructure Maintenance
Locations and line sizes.
Data: Infrastructure position, Pipelines and Valves as lines and points, Attributes: size , pipe type, date of installation, length of pipe, date of repairs etc., Projection, Datum.
Location Services
The Authority gets about 300-350 "locates" a month, for Pennsylvania One-Call.
Data: Infrastructure positions, Property Lines, Building Lines and Footprints as Lines and Polygons, Projection, Datum..
Line work approximately 100 times a month.
Data: Infrastructure Location, Property Information, Work Order No. Work Required, Equipment and Parts Required, Projection, Datum.
Threat avoidance
The sewer authority has their system in GIS, so the water authority can use this to identify contamination problems.
Data: Storage Tanks, Pump Station, Well Fields, Sewage Company Data, Projection, Datum., Distance to Sewer from Well Head, Sewer Line to Pipe Line Junction Distance , Uphill or Down Hill, etc.
Code Compliance
Ensure that buildings are adequately covered by Fire Hydrants.
Data: House Lines and Footprints, Fire Hydrants Location and Attributes (including hydrant number, flow data with date, manufacturer and model number, etc.), Number of houses in fire hydrant service radius, required Flow Rate, Projection, Datum.
I contacted the engineer who updates and maintains the Authority's data and requested a portion of the service area. It is usually easier to convince someone to share data when the use is for "education purposes only." Agreeing to share data inevitably means that you are agreeing to answer questions about those data that you may or may not know the answer to. The data I originally acquired from the firm were CAD data. After a conversation with the engineer about why I wanted the data, he indicated that he did have the same data converted into shapefiles. He converts the data from CAD to GIS for mapping purposes. In this activity we will look at the CAD data provided.
I also acquired basemap data from Centre County. This data is available for public use. I met with the County director and he provided me with a CD of the data. We will look at a few of the county layers, which have been clipped to the extent of the SCBWA Pine Grove Mills Service Area.
Registered Students download from ANGEL the Lesson 1 data (lesson1files.zip) to a new folder (e.g., C:\MGIS\GEOG488\Lesson1).
The data in this exercise are used by permission of the State College Borough Water Authority and the GIS Director of Centre County, Pennsylvania. I want to thank the Centre County GIS Director, Steve Albright of the Water Authority, and Jeff Sergeant of Gwin, Dobson & Foreman Inc.
B. View the Data in Safe Data Inspector or ArcCatalog and ArcMap
- From the above description, write a brief User Needs Assessment Statement, e.g. Location, Identification etc.
- Unzip the files for lesson 1.
- You need FME for this lesson. If you have not already obtained it, obtain it now. See Orientation Lesson for instructions. Otherwise, you can use ArcCatalogue and ArcMap.
- Start Universal Viewer, ArcMap, and ArcCatalog.
- Start FME Universal Viewer to view the SCBWA (State College Borough Water Authority) data; under file menu use the open dataset. Support for the Safe Software FME is through the course instructor and not through Safe Software or World Campus.
- Set Format to Autocad Drawing in the format gallery and take the time to scroll up and down the list to realize how daunting format change is in GIS. There are hundreds of data types in this list.
- Navigate to the Autocad Drawing on your computer.
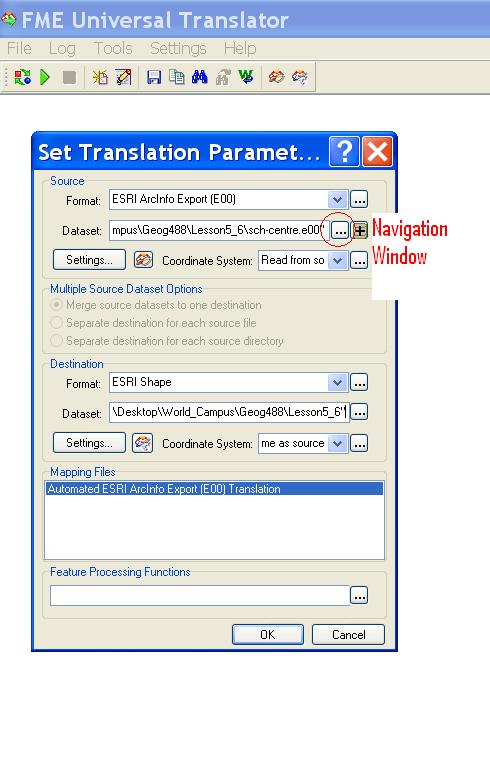
- Use the information button with an "I "on it to look at some of the details. Here is an example: Autocad drawing in Universal Viewer Figure 1. [1]You can use the button with three dots to navigate Figure 2. [2]
- Now open the Centre data Street data in the same way. Do not forget to set data type to Esri shape file in the format gallery. Here is an example, Shapefile in Universal Viewer Figure 2. [3]
- In ArcCatalog, view the SCBWA (State College Borough Water Authority) data. You'll notice that the data are represented two ways: as a CAD drawing file and as a CAD feature dataset. The drawing file should be used for display only and the feature dataset should be used for display and geographic analysis. Now look in Safe Universal Viewer.
- Preview each representation. You'll see that the drawing file is using symbology as defined in the CAD file (features are represented with different colors.)
- Add both the drawing file and the feature dataset to ArcMap.
- Check out the Data Frame Properties of the data. Take a look at the Coordinate System. The data aren't projected.
- Now take a look at the attribute table for one of the feature datasets. Without being very familiar with this data set or having an extensive data dictionary, the fields and records are fairly cryptic. After talking to the Authority's engineer, I was able to make a look-up table for the lines.
- Add the layer_descrip lookup table to your map document and join it to the polyline feature dataset. This additional information might make it a bit easier to symbolize the layer.
- Imagine that you want to edit these data. You can select certain features and create shapefiles or personal geodatabases from them. Let's create a roads shapefile. Select all the features that meet these criteria: "Layer" = 'ROAD_CL' OR "Layer" = 'PADOT_CL'
- Export those features to a shapefile called "roads."
- Add a new data frame and add the Centre County data.
- If you look at the streets_cl layer, you can see where the two datasets would come together, even though the roads shapefile created from the CAD data has gaps in it.
How can we integrate these data sources?
Does the county coordinate efforts with the water authority on standards and interoperability? These are just a couple of questions we need to address. - We'll work with these CAD data again in Lesson 5/6, when we'll georeference them so we can overlay them with the Centre County basemap data.
C. Save Your Map Document
Click the Save button on the Standard toolbar or click the File menu and choose Save.
That's it for Part I!
You have just completed Part I of this module, which involved looking over some data provided by a water authority. In Part II, you will start a GIS assessment for your local area.
Part II: Assessing Data for Your Local Area
Module 2: Starting your Own Course Project
A. Assessment of Data in Your Local Area
Your story:
You can take any number of approaches for this module. Be sure that you feel comfortable with your decision as this modules continues on throughout the class and is ultimately part of the final course project.
A couple possible scenarios:
- You work in local government and have a very good idea about what GIS data exist in your area. You might assume that as a decision-maker for your municipality you will be making contributions to The National Map. What layers exist? What layers don't? Where are you in terms of being ready to share your data?
- You work in the private sector for a GIS consulting firm and are aware of what GIS data need to be created for the area. Can you help your local government offices prepare data to be shared in a GIS portal? Are they aware of what data are needed? What is the estimated cost of what they need?
- You work for the Fish and Wildlife Service and would like to be using GIS more to enhance your projects. You realize the value of having data acquired at the local level that is then shared upward through the state and then the federal government. You decide to assess your local situation and find out how it works in your area. You're not sure if they are aware of national initiatives or if they are interested in creating or sharing data for use by anyone outside the area.
- You are a GIS hobbyist and want to map the piece of land you own. You have been able to download some basic layers from a state clearinghouse, but are interested in acquiring some more detailed layers. You decide to meet with some folks in the area to determine what data are available and find out if they have a need for someone to do some contract work and help them fill in some gaps in their system.
- You are a high school teacher and want to teach your students about GIS. You want them to realize that they don't always have to be data consumers, but can contribute something back to their community. You would like to meet with some county and municipal officials and have them visit the school and talk about what data they have and how they were created. You want them to emphasize that there are always more data to collect and updates to be made.
Questions you might ask local contacts:
- Would you be willing to share information and data for a project I am working on for a class? Can I list you as a contact in my online portfolio? If not, then use a cumulative document to build the final project.
- Does a GIS exist in our area? If yes, what data exist? If no, what data would you like to have?
- From where do the data originate?
- How many departments use GIS data? Is there collaboration between departments? Between municipalities?
- Can you give me any idea about how much has been spent on data?
- Are the data available to the public - free or fee?
- Are you familiar with The National Map? Are there any plans to contribute to that effort?
- What are the local requirements that require a Licensed Land Surveyor to be used (Hint: always for land-title issues, buildings, and rights of way).
B. Deliverables
This module is one week in length. There is no required deliverable this week other than finishing the required readings and participating in the online discussion. The topic is posted in this week's discussion forum - reply to that post. Below you will see a list of things to post to your web page, but these are mostly to get you to start thinking about your final project. I realize there is a LOT to read this week and a lot to process. Ideally, you will get an idea for your project and start to gather some contact information for your area. If you are able to post some of the information listed below, that's great. If not, it should be posted by the end of week 2. By the end of the course, the weekly deliverables should all come together as the final deliverable. It should only need to be polished at that point.
1. Readings:
Required:
- CHAPTER 1 [4] Thurston, J., T. K. Poiker, & J.P. Moore. Integrated Geospatial Technologies: A Guide to GPS, GIS, and Data Logging. Hoboken, NJ: Wiley. 2003. ISBN: 0471244090 This chapter provides a decent overview about geotechnology.
- IN LINE WITH GIS: GIS AND SURVEYING ISSUES PART I [5] AND PART II [6] Articles about bridging the gap between surveying and GIS
- WHY DOESN'T THIS FIT? [7] An article comparing GIS and surveying when it comes to the land base
- INTEROPERABILITY: [8] A look at Safe Software's approach to interoperability.
Recommended:
- REPORTS: THE NATIONAL MAP [9]
So many things to read... So little time... At least take a look at the final report published on 11/30/01 - WEAVING A NATIONAL MAP [10]
Review of the U.S. Geological Survey Concept of The National Map - A TALE OF TWO MAP PROGRAMS [11]
An opinion article about The National Map and Geospatial One Stop - OVERCOMING NON-TECHNICAL CHALLENGES TO THE NATIONAL MAP PROJECT [12]
Another opinion article about The National Map
2. Post a paragraph about your course final project topic.
3. Post a list of GIS project specifications to your cumulative document or e-portfolio, including write-ups of:
- Data needs
- Data availability/cost
- Data accuracy
- Future considerations for completion of final project
4. Start a "digital rolodex." List the contacts you made this week and explain how they helped or what they contributed to your plan. You should make at least three contacts by week three of the course.
5. Discuss the weekly topic on the discussion forum.
6. Start to think about and write your course paper. See the Course Paper Assignment [13] page for more information about this assignment. It will be due by week five. If you are waiting for contacts to get back to you, this is a great time to polish off the course paper, that is, before your final project starts to occupy all your time.
That's it for Part II...and Lesson 1!
You have just completed Project 1.
Don't forget...if you have any questions,feel free to post them to the Lesson 1 Discussion Forum.
Lesson 2: Understanding and Producing Metadata
Module 2: State College Borough Water Authority (cont.)
Introduction
Throughout the creation of your GIS Plan, metadata should always be on your mind, whether you are assessing, acquiring, creating, or publishing data. In the first part of this module, you will view the existing metadata (or lack thereof) for the data we worked with in Lesson 1. You will input information collected from the data providers about the data. You will comment on how these metadata can be improved. In the second part of this module, you will begin to document the status of the metadata for your local area.
A. Goals
Upon completion of module 2, you will be able to: produce and publish metadata for some data you acquired or would like to acquire, check the validity of information found in metadata, create data dictionaries and plan what to collect, and look at metadata downloaded from online data portals.
B. Background
In module 1 you were given some data sets provided by a water authority and the engineer they work with. You may have noticed the lack of documentation in those data. It was a good lesson for me to see that some of the first data I acquired for my module were lacking metadata. I was also surprised at how hard it was to track down complete information. In a continuation of the first week's scenario, I will share the information I was able to find about my data in the hopes of making you familiar with the types of information you have to gather and the types of questions you might ask when acquiring data.
C. Module Overview
- Produce and publish metadata.
- Check the validity of information found in metadata.
- Check Dates and timeliness and currency of data.
- Create data dictionaries and plan what to collect.
- Look at Web Data Sources.
D. Deliverables
This module is one week in length. Please refer to the course Calendar tab, in ANGEL, for the due date.
Please see the Deliverables section at the end of Part II for this week's readings and action items.
Checklist
Lesson 2 is one week in length. Please refer to the Calendar in ANGEL for specific time frames and due dates. To finish this lesson, you must complete the actvities listed below. You may find it useful to print this page out first so that you can follow along with the directions.
| Step | Activity | Access/Directions |
|---|---|---|
| 1 | Work through Lesson 2 | You are in the Lesson 2 online content now. The overview page is previous to this page, and you are on the Checklist page right now. |
| 2 | Complete the deliverables for Lesson 2 | Page 4 has this week's deliverables. |
Creating Metadata
Module 2: State College Borough Water Authority (cont.)
Part I: Creating Metadata
A. Download the Lesson Data
My story:
If you're like me and you hear the word metadata, you say, "I know, I know. They're daaaaata about daaaaata." I was at the ESRI User conference this year and went to a session about metadata. The presenter said, "For those of you who are properly documenting your data - both of you..." He was speaking to a decent sized crowd and got a good laugh. It does seem to be a running joke that everyone pays a lot of lip service to metadata but then doesn't take the time to create, complete, or update them. In this lesson, we'll briefly go over the importance of metadata (as if you haven't heard it enough). You will soon learn to appreciate good metadata when you start to combine data from other people, or colleagues that have left.
We will use one metadata editor to fill in a few fields about one of the Centre County layers provided in Lesson 1 and another editor to complete the metadata for the shapefile you created in lesson 1 from the CAD data. I had a conversation with the engineer for the water authority and explained that in order for the data he shared to be really worthwhile, I needed to be able to provide as much documentation about them as possible. I have to admit, it is a very hard task to track down metadata. The engineer for the water authority didn't have any kind of digital metadata, but was able to answer most of the questions in order for us to document the data. Other datasets I've acquired have been quite a different story. I won't name names, but one person I talked to regarding a dataset wrote, "You really think people produce metadata? That costs money and then I would be over budget and then I would need to bill to non-billable time and then I don't even want to know what would happen." This was said in a joking manner, but it is a real issue. What most people do not seem to understand is that over the life of a GIS system the cost of metadata is very small compared to the costs of misused data. Once the GIS cycle moves beyond the first adopters and the corporate memory is lost, it will make some data of dubious quality and open the corporation to possible liabilities.
Registered Students download from ANGEL the Lesson 2 data (lesson2files.zip) to a new folder (e.g., C:\MGIS\GEOG488\Lesson2).
B. Read an Overview about Metadata in ArcGIS
Metadata is the official language for the geospatial community. Unfortunately, it is common to acquire data that aren't documented properly, which therefore makes it hard to communicate with that data provider. Another common occurrence is to create your own data and scrimp on documentation because you know when the data were created, who created them, etc. and you don't want to take the time to document that information. This makes it very hard to use or share these data. Often, the key components necessary for documentation can be tracked down, but that is often as time consuming as the acquisition. I hope that this lesson will show that the initial investment in tracking down or creating metadata is worth the time it takes to be a good data steward; one who can communicate well with others in the community.
Source: ArcGIS Desktop Help
Good documentation protects your investment in the resources you have created or purchased. Many details about your data such as source, publication date, quality, and spatial reference are important if you plan to make decisions based on them. When creating your own data, documenting them enables you to share with others or contribute to a portal, such as geodata.gov. Whether internal to your organization or available on the Internet, portals let others search, find, and access the GIS resources they need.
Standards:
Following a well-known metadata standard is a good idea because tools already exist with which you can create metadata. If you plan to publish your metadata to a large audience, following a standard will also make it easier for people from different communities, industries, and countries to understand the documentation because the standard acts as a dictionary, defining terminology and the expected values. The number of metadata content standards are now converging on ISO 19139 that was adopted in 2007. This move should help eliminate some of the barriers to sharing data worldwide. There is now a way to crosswalk the FGDC's Content Standard for Digital Geospatial Metadata (CSDGM) to ISO19139. This standard aims to provide a complete description of a data source, and in XML (Extendable Markup Language), so that it is machine readable.
Because so many standards exist in legacy data, metadata in ArcCatalog isn't required to meet any specific standard. However, your organization may be required to follow a particular standard. For example, U.S. Federal Government funded projects are mandated to provide metadata following the FGDC standard, which is now adopting the ISO metadata format.
Documentation:
As with any project, you should have a plan outlining what content your metadata should include. Look over the metadata standard to get an idea of the content it suggests. Then, decide what pieces of documentation are most important to your organization based on how you intend to use it. If you plan to publish your metadata so that people can find your resources by doing a search, you need to consider what information needs to be present to do different types of searches. Typically, people will search by keywords describing the theme or subject of the resource, by the type of resource, by how current it is, and depending on the portal, by the publisher of the resource. Keywords are more useful if they are derived from a thesaurus; otherwise, you might be searching for "roads" while the data you're looking for is described as "streets". If the spatial extent of the resource is present, then people can find it if they include an area of interest in their search; for most GIS portals, the extent must be provided in decimal degrees. If a data source's coordinate system has been defined, ArcCatalog will automatically record its extent in decimal degrees. If an item, such as a geoprocessing tool, isn't specific to a place, defining its extent as covering the entire globe will ensure that it will be found by any spatial search.
Once someone has found information about a resource, it needs to be determined if this information will work for his or her application. Several pieces of information may be used to determine if the resource is appropriate. Include a description, its age, its cost, and any legal information specifying how the resource may be used. For data sources, you should also include its accuracy, its scale or resolution, and descriptions of its attributes. Information must also be provided about how to get the resource if someone wants to use it. Some pieces of information may also be required by the GIS catalog portal to which you will be publishing your metadata. These requirements are unrelated to whatever standards the portal supports. For example, if the portal lets people search using some predefined queries, you may be required to provide information in your metadata for those queries to work. The metadata librarian who runs the portal may give you a list of keywords and a thesaurus, then require at least one of the keywords in your metadata to be derived from that list.
Templates:
There are ways to reduce the documentation effort without sacrificing its quality. An ideal solution is to create a metadata template containing documentation that is the same for a group of resources. A template can be a standalone XML document that you import before adding more documentation; this effectively lets you copy information from one document to another. A template could include contact information, the publication date, and legal restrictions, but it should not include properties that will be added and maintained automatically by ArcCatalog. With ArcCatalog maintaining the item's properties and a template for adding repetitive documentation, the metadata author is left to focus on documentation that is specific to the individual resource, such as the quality of the data.
Creating a template from scratch can be difficult because it is an abstract process. An easier way to approach this is to document a resource as best you can, then use the Tools in the ArcToolbox Conversion Tools Metadata section to export only the documentation. Then, print out the documentation. Cross out any information that is specific to the resource, and think about how you can modify the rest so that it will apply to other resources as well. Then, make your edits to the template XML document-its information should be the same for all the resources that you have to document. You may need several templates to use with resources created by different departments or for different projects.
Similarly, you could create one document representing a series of resources. Suppose the data for a region is broken down into several tiles. You could create metadata describing one of those tiles, then use the Export Metadata Multiple exporter to copy its documentation to a standalone XML document. There are shortcuts to these Tools in ArcCatalog as a Toll Bar unless the interface has been customized. Select the XML document in the Catalog tree, and use a metadata editor to modify its content so the properties and documentation reflect the series of tiles rather than a specific tile. When you're done, you can publish the standalone XML document to the appropriate GIS catalog portal.
C. Use the Metadata Editor
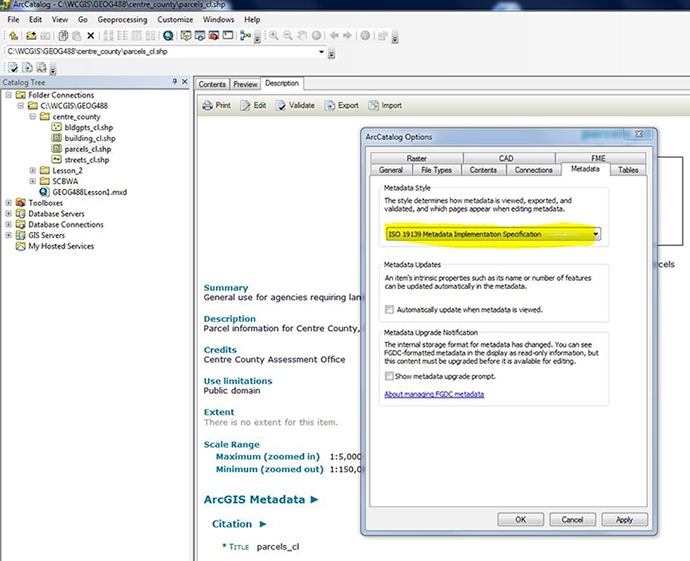
Before you start writing documentation, you need to decide which metadata standard you're going to follow. If you don't have any metadata yet and don't need to create metadata according to a specific standard, the Esri format might suffice; otherwise, the ISO format might be right for you. If you have a requirement to create FGDC metadata, if you already have FGDC metadata, or if you want to create detailed metadata, the FGDC format would be a good choice. Once you've decided which metadata standard you're going to follow, set that editor that corresponds to that standard as the default editor.This is set in ArcCatalog Options / Metadata Tab / Metadata Style. See Figure 2.1, below.
There is a metadata editor provided with ArcCatalog. It lets you create complete documentation in Esri XML format. This is a machine readable format. This is then used to produce the FGDC's Content Standard for Digital Geospatial Metadata or the ISO standard 19115, Geographic Information-Metadata. Other formats might be available in specific localized versions of the XML converter. The human readable standard Metadata is achieved with Exporting Metadata Tool or it is visible in ArcCatalog Description Tab.
Use the Standard Editor in FGDC Mode
The metadata editor lets you create a complete metadata document for the selected item in the Catalog tree that is compliant with the Default Geospatial Metadata. This is the default metadata editor as set in the ArcCatalog options above. This editor also lets you enter values for some Esri-defined elements, which are specified by the Esri Profile of the Content Standard for Digital Geospatial Metadata; this document is available as a white paper from Esri's Online Support Center.
Your organization may be required to create FGDC metadata; for example, U.S. federal government departments and state and local agencies that receive federal funds to create any data must also have FGDC metadata created with it. You may also need to create FGDC metadata to publish information about your data to the GeoData.gov portal or the NSDI Geospatial Data Clearinghouse. If you already have FGDC metadata, continue to maintain your metadata in this format.
In lesson 1 you viewed some Centre County data. All four Centre County layers have spatial metadata, but only three of the four layers have other metadata fields. The following information is available for the parcels_cl layer.
- Unzip the files for lesson 2.
- Browse the metadata for the streets_cl, building_cl, and bldgpts_cl, and parcels_cl shapefiles using the Description Tab in ArcCatalog.
- Open the metadata_parcels_cl.txt file. It will open in txt editor and you can see the extra information.
- Make sure that the ArcCatalog Option for Metadata is set to FGDC CSDGM Metadata in the Customize Drop Down Menu.
- The FGDC Metadata editor is now the default. Scroll down and you can see the metadata under the description.
- Click on the Edit metadata button
 on the Metadata toolbar.
 - Populate the few fields in the FGDC Editor with the values from the txt file.
- These are very incomplete metadata. Make a note of what fields are empty that would be important to have. This will help you compile a list of questions for anyone who provides you with data.
- That is it done with FGDC Metadata.
Use the Standard Editor in ISO Mode
The ISO 19115 metadata standard defines a core set of elements that includes a few mandatory elements and an additional set of highly recommended ones. Beyond the core set of elements, the ISO standard defines a large number of elements that can be used to thoroughly document GIS resources. This editor supports the core 19115 metadata elements that let you add documentation. Some of the core elements are supported by ArcCatalog but don't appear in the editor. When metadata is automatically created, the ISO synchronizer adds the item's properties to the appropriate ISO metadata elements. This editor generally doesn't let you edit properties of an item, only its documentation. For example, if ArcCatalog can automatically calculate the item's extent in decimal degrees, the extent page won't be editable. For more information about support for ISO metadata, see the 'Metadata standards' section of Writing documentation.
You can use different editors, one at a time, to document your data. The editor selected in the Options dialog box will appear when you click the Edit Metadata button on the Metadata toolbar. A metadata document in ArcCatalog can contain both FGDC and ISO content. These two standards can exist in parallel in the same metadata document because they each use a completely different set of XML tags to store their information. Therefore, if you provide a title using the FGDC editor and you later switch to the ISO editor, the information you previously added won't appear. Because metadata for coverages, shapefiles, and other file-based data sources is stored as XML files on disk, you can also use XML editors or other applications to edit its contents outside ArcCatalog (but it easy to destroy it, too, this way). Similarly, you can also use ArcCatalog metadata editors to edit standalone XML documents. For example, you might do this to create a metadata template; it might include standard information, such as how to purchase the data or whom to contact for more information. When editing metadata in a geodatabase, the original record in the GDB_UserMetadata table is deleted, and a new record is added with the updated metadata. To purge the deleted records from the personal geodatabase and decrease its size, right-click the database in ArcCatalog and click Compact Database.
- In order to use see the the ISO Metadata Wizard, you need to change the default metadata editor as above and choose the ISO Metadata in ArcCatalog Options.
- Browse to your roads layer and click the Description tab.
- Scroll down and you will see that there is the ISO Metadata now visible.
- Open the metadata_roads.txt file as before.
- Click on the Edit metadata button on the Metadata toolbar.
- This enables you to document your data to meet the ISO Metadata standard.
- Remember, the metadata you have refer to the CAD data from Gwin, Dobson & Foreman. Figure out how to change the metadata to reflect the fact that you created a shapefile from the data.
D. Metadata Utilities
In ArcGIS 10.x there are a number of very useful Metadata Utilities. If you want you can optionally have a look at these.
The first is a Validation tool This will check each of the headings for the information it should contain if the Metadata is complete and accurate. If you pass the validation you can then export the data. The next useful tool is the import tool that enables you to replicate Metadata between similar datasets (Do not forget to Update It After Import). These tools are available in the Toolbar under the Description Tab. In the actual ArcToolbox are lots of other tools that use scripts to synchronize Metadata, Import it Export it, Publish it, and to Translate it from one form to another. You might validate, export and publish Metadata in different formats FGDC and ISO for use by different communities or user bases. Finally, you might want to create Metadata for Data as it was manipulated so you have a record of the changes, manipulations or modification the data went through, e.g., suppose you generalized a line set to display better at a smaller scale.
Optional Exercise
There is a stand alone editor that is very useful from the EPA that is fully compatible with ArcGIS 10.x; it is worth taking a look EPA Metadata Tool here [14]
E. Metadata and Timeliness
Look at the date fields in the metadata. It is here that you will find the details of how new are the records, when they were last updated, and the interval of revisions. Some data are always current or nearly so, e.g. real-time traffic flow meters. Other data may be very old and out of date. This has enormous potential to spoil GIS analysis, and at worst, cause GIS legal liabilities. If you are looking at a phenomenon that does not change, like mountains, that is one thing, but for the water board they best know where houses are and when they are built. Should the water board be the party responsible for updating building plot lineage or should they get this from the county? How often should they get the data? What data was available at the time of a decision? Was it the most up to date? if not, why not? The answers to these decisions could result in an error becoming an act of negligence, e.g., an error in the answer to Penn One Call. If this resulted in the death of a worker for a contractor, this could have dire legal implications.
Metadata and current metadata can be the source of the information that will protect the GIS person from such liability.
That's it for Part I!
You have just completed Part I of this module, which involved editing some metadata for some data acquired from my local area. In Part II, you will begin to assess the metadata situation for your final project area. You will also look on the web for metadata in clearing houses.
Documenting Your Own Data
Module 2: Documenting Your Own Final Project
Part II: Documenting Your Own Data
A. Assess Metadata in Your Local Area
Your story:
You should have made a couple contacts in your local area by now, whether by phone, email, or in person. You should also have some sense about what data, if any, exist. If you are lucky, the data you acquire will be documented properly; they will have complete metadata that conforms to a standard.
Questions you might ask:
- Does your organization create and maintain metadata?
- Who is tasked with creating metadata?
- What metadata standard do you use?
- Is there money in your budget earmarked specifically for metadata?
- Are the metadata in a digital form?
- Would you be willing to fill in some of the gaps in data documentation so I can tell a more complete story to my class?
B. Take a Look at Some Good Examples of Data Dictionaries
Data dictionaries are an essential part of good metadata. They are the narrative description of the fields of the database, particularly the attribute data. I have found that detailed and complete data dictionaries are hard to find. We will obviously not be creating extremely detailed data dictionaries in this class, but it is important to see some examples.
- SPC GIS DATA DICTIONARY [15]
The data dictionary of the Southwestern Pennsylvania Commission (SPC), which is the regional planning agency serving the Pittsburgh 10-county area. - ROADWAY INVENTORY SEGMENTS [16]
A Pennylvania Department of Transportation (PennDOT) data dictionary for road segments.
C. Take a Look at Metadata for Layers in The National Map or other Online Web-based Portals
In this part of the lesson, we will be working with clearinghouses. It is quite likely that some of the data you will need for your final project will come from one of the many online data sources. Obviously, when downloading any data from clearinghouses, metadata are an extremely important component. Without some metadata, you may not be able to work with the data at all. Take a look at the metadata for one of the layers you might be interested in from The National Map.
- Open The National Map Viewer [17].
- Drag a box around your state with the Zoom In tool. If you don't live in North America, pick any place.
- Click the Layer Metadata or Map Information tab.
- Pick a layer and include information about what standard is used, scale, purpose, date, and data quality. Post this information in list form and be sure to include the layer name. This is just to get a sense about what types of data are currently part of The National Map.
Here are a few of the sites from which I downloaded data:
- The National Map [17]
There are quite a few national layers available here. I decided to acquire a roads layer. - GIS Data Depot [18]
I acquired TIGER data here. - Pennsylvania Spatial Data Access (PASDA) [19]
This is Pennsylvania's data clearinghouse. You've been exposed to it in previous classes. There is a wealth of data here. Since I downloaded road data from the previous two sites, I decided to acquire road data from the Pennsylvania Department of Transportation.
Looking at the data I acquired from clearinghouses is optional. It is merely a glance into my project. Again, I've been acquiring data for my local area as I want to make sure that the items in the deliverables section can be done with a reasonable amount of effort in a reasonable amount of time.
- Unzip the files for lesson 3. These include an ArcMap map document and data I downloaded from the above sites.
- Open ArcCatalog and browse the metadata (or lack thereof) for the layers in the map document. I had to define two of the layers with information from the site in order to get the data to line up. I didn't edit the metadata in any other way.
- Open the clearinghouse_data.mxd map document. If the streets layer isn't appearing, you can set the data source by right-clicking on the layer and choosing Data > Set Data Source. It can be found in the Centre_county_basemap folder.
- Browse in and out and turn layers off and on. I found this to be an interesting lesson in accuracy. I have the layers arranged from most accurate to least accurate. I can see why metadata are so important. If someone is using a roads layer and doesn't know where it originated or what the accuracy is, the data could be worthless for their application.
D. Deliverables
This module is one week in length. Please refer to the course Calendar tab, above, for the due date.
1. Readings:
Required:
- GEOSPATIAL METADATA [20]
A very light read that explains geospatial metadata in simple terms. - METADATA QUICK GUIDE [21]
A short reference guide for writing quality metadata. - UNDERSTANDING METADATA [22]
A National Information Standards Organization (NISO) publication that helps to explain metadata. - CONTENT STANDARD FOR DIGITAL GEOSPATIAL METADATA WORKBOOK [23]
A guide that includes how to read and use the CSDGM standard with graphical and textual representation of the content information, a description of profiles and user defined metadata extensions, and some metadata examples.This is a long piece and some of it can be scanned rather than read thoroughly, however, you should familiarize yourself with its general ideas. - The EPA Metadata Editor [24]in Use
Recommended:
- PUBLISHING TO GEODATA.GOV (CREATING AND PUBLISHING METADATA IN SUPPORT OF GEOSPATIAL ONE-STOP AND NSDI) [25]
A document to guide you through the process of publishing metadata online. This document will be most useful for the optional activity in Weeks 9 and 10.
2. Post a project write-up to your cumulative document or e-portfolio including:
If you have yet to post your work from week 1, do that now.
- metadata for an existing National Map layer
- documentation of the status of the metadata for the data you have started to acquire for your project (if no data exist, create metadata for future layers)
- comments on whether those metadata conform to FGDC/ISO standards
- ideas for what should be included in a data dictionary for the data acquired (or those that will be acquired)
- Continue to compile your digital rolodex. List the contacts you made this week and explain how they helped or what they contributed to your plan.
3. Discuss the weekly topic on the discussion forum.
That's it for Part II...and Lesson 2!
You have just completed module 2.
Don't forget...if you have any questions, feel free to post them to the Lesson 2 Discussion Forum.
Lesson 3: Locating and Acquiring Data
Introduction: Locating, Acquiring and Extracting Data from Online Sources
When any GIS project is first undertaken, a review of the data resources is often necessary. That is the approach you've been taking in your individual final projects. Now that you've begun to assess the availability of data in your local area, you can broaden your search to include online clearinghouses. Depending on the scope and scale of the final project, clearinghouses may or may not be a good source. Using data from clearinghouses can raise legal and ethical problems related to data accuracy and data use. In the first part of this module, you will be introduced to a scenario from a former student. You will browse clearinghouses and look for data for your own area. In the second part of the module, do a data inventory for your area. We will then look at the legal and ethical implications of using the data you have found.
A. Goals
Upon completion of this module, you will be able to acquire your own data from online clearinghouses and will be able to recognize potential legal and ethical problems related to data use.
B. Background
Data is becoming more widely available on the web these days as users and GIS developers share and publish data. Many layers of data are too costly for an individual or corporation to record, produce, or maintain themselves. For this kind of data, often at the national scale, it is imperative that it be acquired from public sources. The U.S., unlike many countries, freely provides national data. It is this freedom of access to data acquired by tax expenditures that has prompted the enormous growth in the spatial industries.
C. Module Overview
- Find and acquire GIS data using online clearinghouses
- Recognize potential errors, and legal or ethical problems related to data use
- Frustration, about now in Problem Based Learning a considerable amount of frustration might be building up because contacts and ideas are not responding. Do not become disheartened by this as this is normal. Remember that in Problem Based Learning the process is more important than the product. If you need to change course projects or modify what you had planned, do not worry I will take this into account. Remember to document your efforts and keep me informed. Contact me directly if you feel the need to discuss your plans in person. Sometimes a few words are worth a ton of emails
D. Deliverables
This module is one week in length. Please refer to the course Calendar tab, in ANGEL, for the due date.
Please see the Deliverables section at the end of Part II for this week's readings and action items.
Checklist
Lesson 3 is one week in length. Please refer to the Calendar in ANGEL for specific time frames and due dates. To finish this lesson, you must complete the actvities listed below. You may find it useful to print this page out first so that you can follow along with the directions.
| Step | Activity | Access/Directions |
|---|---|---|
| 1 | Work through Lesson 3 | You are in the Lesson 3 online content now. The overview page is previous to this page, and you are on the Checklist page right now. |
| 2 | Complete the deliverables for Lesson 3 | Page 4 has this week's deliverables. |
Reviewing Online Sources of Data
A. Download the Lesson Data
Susan's story:
Susan is a former student in the Certificate Program in GIS. Susan decided to create a GIS activity for children in a local middle school. She picked a topic that fit well with the curriculum and that is of interest to her - volcanoes in Montserrat, British West Indies. She had no data resources when she started the project and decided to search online resources and data clearinghouses.
Optional Exercise: Registered Students can download from ANGEL the Lesson 3 data (optional.lesson3files.zip) to a new folder (e.g., C:\MGIS\GEOG488\Lesson3) and look at real world examples of data mismatch.
I want to thank Susan Wheeler for the contribution of her story.
B. Look at the Data Susan Acquired
Susan has also contributed to the profession by educating others about GIS. I decided to include her story in this lesson because she did an exhaustive search of online resources. She acquired some georeferenced data and digital maps from the web, but discovered that she would probably have to create her own data to make a worthwhile activity. She searched a local library, found a topographic map, scanned it, georeferenced it and digitized layers necessary for her project.
Susan's task was fairly different from what we are doing. She was at a disadvantage because she was looking for data for a place that doesn't have much, but she was at an advantage in that she was working with an entire island and didn't have to have any large scale data to make her project work.
Susan provided a list of resources [26] she used.
The types of data found in most clearinghouses free of charge are usually more suitable for projects like Susan's because she did not need the level of accuracy that we are more likely to need in our projects. She was working at a much smaller scale; she was looking at data for an entire island. Susan was amazed at the amount of searching she had to do to acquire such a small amount of data. Without doing that search though, she wouldn't have known that the data she needed didn't exist (not that she was able to find anyway).
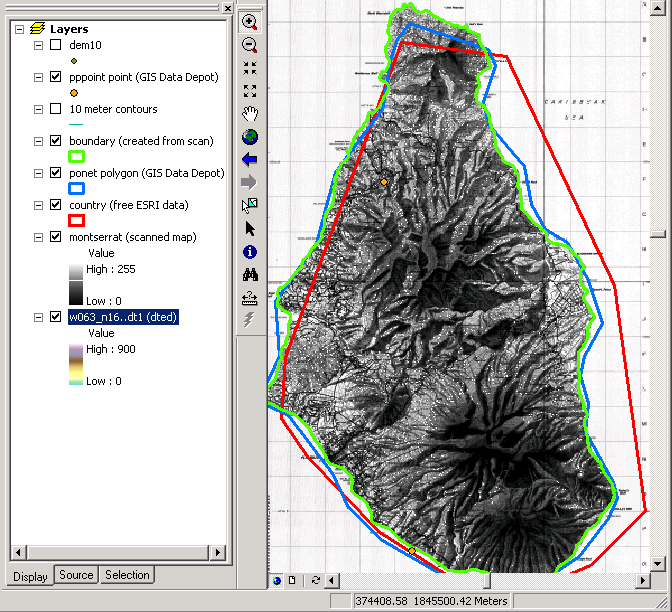
Here is an image showing some of the data Susan acquired. [27]
I should mention that this project did not only involve a search for data on the web. Susan and her family went to Montserrat (a research trip that was to take place regardless) and collected GPS data that were used in the lesson. After her Internet searches, which led to some phone calls and emails, she was fairly confident that the data she created were not part of a duplicated effort. Susan's work paid off. The kids learned GIS through a fun and interactive lesson and she was able to reach an even greater audience by writing about the experience. See an article about Susan's work entitled "Exploring Montserrat, British West Indies, With GIS" [28] in ArcNews.
C. Data for your project
Acquire Data from Clearinghouses for Your Project Area
Your story:
As part of your assessment in week 1, you might have discovered that there are online resources, such as a state clearinghouse, that have data for your project area. Perform an Internet search and compile a list of sites that contain data that might be useful for your data inventory.
Websites that provide geospatial data or links to them are popping up all over the place. It's interesting to see what the latest and greatest idea is when it comes to clearinghouses. Over the past years, we've seen quite a few clearinghouses touting themselves as a place for "one-stop shopping." The most recent, Geospatial One-Stop, even includes that in the name. How can you question that? The truth is, whether it's FDGC's Clearinghouse, or Esri's Geography Network, or the National Map and Geospatial One-Stop, most of these organizations seem to have trouble with buy-in.
Different sites have different requirements for contributors, but a good site requires complete metadata. As you likely discovered in Lesson 2 (if you weren't already aware), good metadata are hard to come by. Most organizations haven't made metadata a priority and are therefore unlikely to make the time to prepare data so they are publishable. There are also the many questions that people have. What is the quality of the data? Who can (should be allowed to) contribute? How often to I have to publish updates? What's in it for me? This last question is probably the biggest. The newest portals are so new that they may still prove themselves to be one-stop shops. It seems that GIS professionals like us should be contributing our own data to those sites.
As you're creating your list of resources, keep these questions in mind:
- Is the online source made available by the government? Is it a local, state, or national initiative?
- Are the data free of charge?
- Are there any requirements for data standards or metadata standards?
- Do the data reside on the site or is the site a portal to other sites?
- Are users encouraged to publish their own data?
That's it for Part I!
You have just completed Part I of this module, which involved perusing some data I acquired from clearinghouses and pondering legal and ethical issues related to GIS. In Part II, you will browse clearinghouses to look for data for your project area.
Sources of Error, Liability, and Ethical Considerations of using Downloaded Data
Module 3: Locating, Acquiring and Extracting Data from Online Sources
Part II: Sources of Error, Liability, and Ethical Considerations of using Downloaded Data
A. Think about Legal and Ethical Problems Related to GIS
As you're browsing the sites keep these questions in mind:
- What kind of disclaimers are listed at the sites you visited?
- How are the disclaimers different among the sites that charge for data and the sites that do not?
- Are there restrictions on who can publish?
- Are there guidelines about what can be published?
- How will the data combine in the GIS?
Aside from the topic of clearinghouses, draw from the class readings this week and think about whether there are any other legal or ethical issues you've come across in your prior work with GIS or during this project or module.
B. Errors Inherent in Data from Different Sources
You would have to be very lucky to have found data for all of your final project that was at the same scale, in the same projection, with the same datum, collected at the same time and in the same manner. What is worse is that, unless people have been very diligent in their data documentation, you will not know all of the parameters.
As soon as data from different sources, times, scales, etc., is mixed, it is subject to errors. If we use this data to derive new data, the errors propagate into the new analysis. An easy example is we overlay data on top of each other, the areas where the data do not agree forms a myriad of little slivers, if it is polygon data and over/under shoots if it is line data. Take another look at Susan's map image showing some of the data Susan acquired of Montserrat [27]. In this image the coastlines do not agree. So if you are analyzing the density of something, there will be different areas generated. The obvious choice is to use the image derived from the raster data. However, this is not correct unless all the other data are of the same scale, and the raster is in an area preserving projection. The correct choice is to generalize data to the same scale so that you do not get a sense of false precision. Looking at the data, a guess would be that the Esri data is in a different Datum. The blue line from Digital Chart of the World Ponet might be in a different projection, foreshortening the top of the image. But without documentation, these will remain guesses. Now staying with the Montserrat data, depending when the data was produced, the coastline might be wrong, because the island has grown as the active volcano has poured lava into the sea. So if you wanted to know the density of people, you would have to use an older image, as all the population was evacuated. You get the meaning.
Projections, as you know, cause distortions in at least one aspect of the data. There is no meaning in calculating area on a data set that has not preserved it, or similarly, measuring distances in a dataset that distorts distance is also wrong. Extracting data from a larger dataset can cause problems with combining data as edge effects might be present in one dataset and not another. UTM projected data, for example, are prone to edge effects. Raster data from aerial sources also have distortions that should be corrected by the orthorectification process, but sometimes they are not.
Another common data is the modifiable area problem. If you are using data that has been produced as a thematic map, it is open to this type of error. For example, the Borough of State College votes as a quite liberal place, Centre County, is slightly conservative, the Center Region is strongly conservative, and the State is equally divided. Now how would you describe a voter from Penn State? It depends on the scale that you are using to look. Unless you asked the voter directly, there is no way to know if your generalization will be correct. On average it would be correct for each scale of the investigation but not at the level of the individual. This problem is general in combining data at different scales or in using data sampled or gathered at one scale to make generalizations about another scale.
The problems of attribute comparability cannot be overcome unless there are excellent data definitions stored in a thorough data dictionary. One person's major highway is a minor road elsewhere. Just being aware of these problems and making sure you consult the metadata, data dictionaries, and documentation when you acquire data helps a lot to overcome these sources of error. The other thing is to document your own actions so that people can judge if they like what you have done, or at least understand it.
C. Data Mismatch
Data mis-match caused by missing or erroneous metadata, datum, or projection files is very common. Esri has recognized this and produced a very comprehensive book, that I whole-heartedly recommend:
Lining Up Data in ArcGIS: a Guide to Map Projections by Margaret M. Maher, Esri Press 2010. [29]
Let us conduct a thought experiment. It is common to have at least one case where downloaded data do not align. What to do?
First, look at the metadata. Unfortunately, sometimes the metadata had an error and gave the wrong projection parameters, e.g. the UTM zone did not line up with the reference longitude. This happens where people copy metadata from one layer to the next but forget to update the parts that change. The ArcHelp can be very useful for projection difficulties; try starting with: Projection basics for GIS professionals [30].
I am sure you will encounter similar problems frequently. In this case of an erroneous UTM, looking at the UTM zones [31] will help you narrow it down. You can also use the links for data where you have unknown projections Identifying an unknown coordinate system [32].
This is a case where Metadata is vital to understanding your data.
We can set a DRG of the area as a reference for data that is unknown projection. In this case, where UTM is wrongly specified, you need to pick the nearest Albers. You know it is the lower 48, so it will be one of the contiguous choices. When you select that, you will see that the projection reference parameters are different. Click modify and go in and alter these just as they are in the metadata; you will need to set the datum to NAD27 in a separate modify window at the bottom of the first. Add the map to ArcGIS and verify that it is at the coordinates you expect.
You can try adding other data to clarify which data is correct. Try adding a DRG to this area, add that, and see if that helps you see what is correct. Shape files are often digitized from standard USGS maps. This does not mean that the shapefile is correct. Cartographers often move things to make the map more easy to read. The spatial topological relationships are mostly preserved, but the location coordinates are not. An ortho-image should be correct but may not be, as there can be considerable distortion from the lens or from hilly terrain, and these distortions are not always fully corrected in the ortho-rectifying process. If in this case the error still looks too large for it to be caused by poor rectification, you could try getting a free satellite image; a mosaic for the area is sometimes best and is free on the web. Satellite images are mostly less error prone due to the extensive processing they receive before they are released.
If all these moves fail and you are near enough to use a GPS. You need to ground truth the image. The amount of correction will be restricted to the accuracy of the GPS. Find a prominent thing that is static and permanent River bends are not good enough, but a building is unless the map is very old. Get the GPS coordinates for a number of places covering the middle and edges of the area of interest. Load these into ARCGIS and see if they align. If the shape file aligns, then it is correct. If the image aligns, that is correct. You now need to spatially adjust the one that is wrong. This process of putting control points on one layer to where they need to move on the other layer, for images this geo-referencing for shapes spatial adjusting. It is virtually the same process; look at Spatial Adjustment [33]. Finally, make sure you cover the whole process of corrections and transformations in your own metadata so that you cover yourself when the data is used.
Data Mismatch can be caused by projection problems, datum errors, scales differences, errors, temporal mismatch, or distortion in sources like non-orthographic aerial photography. The first two are the most common and are possible to fix; the others are much more difficult.
D. Data Extraction
The last set of problems to consider is timeliness and data editing. In the SCWB data it will be in a constant state of flux. Almost from the time a map is made, it will be out of date due to ongoing maintenance, new construction, and changes by third parties. Sometimes the data is checked out for editing; other times on larger systems it can be edited concurrently. This causes a big problem. What happens to this kind of data when you download it? How often should you down load it? Should you only connect to the data in a mash up type of approach and down load the data only on the fly? There is no simple answer to the problem. But again, being aware of the problem is half the battle. Just be explicit in what you are doing to obtain the data.
E. Reproject or not
Supposing you are using data from another source. Do you reproject it on receipt or use ArcGIS to do that on the fly? As you can see from above, it is important that it be in a projection that is suitable for the analysis, if one is to be performed. If it is for display or location problems it is not so important, however, project-on-the-fly does take time. With FME you can reproject as you extract and load data. Finally, you must be aware of the fact that as good as reprojection algorithms are, they do not preserve the original accuracy. Remember in a new ArcMap data frame the first dataset added will set the projection for the data frame unless you go in and modify it.
F. Data Use Ethics
Finally, when we download data we have to consider how we use it. There are often restrictions placed on the user of other people's data. Think of the list carried forward from downloading enumerated above in section A. What kind of disclaimers are listed at the sites you visited? Where would you have found these? They are only in the metadata. Is free data less reliable or more reliable? If you are paying for data the person supplying it has a commercial duty to ensure it is fit for the purpose for which it is supplied. But often in downloading data they do not have any knowledge of what it is to be used for, so the liability often resides not with the provider but with the end user. Very frequently data is supplied that cannot be republished, there are no exact guidelines on how different it has to be so that it cannot be reverse engineered. Even if the data were modified so that it passes a legal test of use, is it ethical.
All GIS professionals have strict guidelines on how they treat data. Today the software industry is much better at establishing licenses for their material and definitions of fair use, etc. The data suppliers are a long way behind in supplying these definitions. The courts are even further behind. Privacy is an important consideration. As for privacy issues I think that the following case is germane. In a battle of the titans, Gabrielle Adelman, a dot com billionaire who likes beaches, flying, and photography, has flown a mission along the California coast photographing the whole thing. Barbara Streisand sued for alleging an invasion of privacy, and attempting to profit from the use of her name. After a case involving several hundreds of thousands of dollars in court costs, the pictures were eventually left online [34]. In the supreme court, the right to privacy was found to be limited and not expansive. It is not specifically mentioned in the Bill of Rights. It can only be enforced in cases where upholding the right of privacy is specific to a person's well being. I believe that in the Streisand case it was said it threatened her well being by giving access to possible intruders. It was found that in such cases where the information can be freely discovered by public means that restricting one of them is not warranted. Aerial photography is not different from, say, driving there and walking around. Also, generally, people who put themselves in the public sphere have different rights and responsibilities than do the public.
It will be interesting to see how the right to free speech plays out when there are genuine terrorist implications.
Privacy can mean more than personal privacy; is it right to identify the nest sites of say the Condor on the web when this will lead to the disturbance or destruction of an endangered species?
Whatever it is you are working on, GIS always has ethical considerations. It has been argued that the process of making a map is an act of power. Map makers make it for their own uses; they choose the data, symbolizes it, and choose where and how it is published. These actions might not be in the best interest of another party who is represented on a map but might have no power over how they are represented.
G. Deliverables
This module is one week in length. Please refer to the course Calendar tab in ANGEL for the due date.
1. Readings:
Required:
- A GIS Code of Ethics [35]
Intended to provide guidelines for GIS and help them make appropriate and ethical choices. - "Virtual Prisons: How e-Maps are Curtailing our Freedom" [36](Full Text Available Through Student Readings for Registered Students [37])
- This is an update of the geoslavery article that is also in the ethics course. I suggest you look at that, too, if you have not already seen it. "Geoslavery: a New Ethical Dilemma for Geographic Information Science" [38] An article discussing the implications of "location control"
- Liability in the Use of Geographic Information Systems and Geographic Datasets [39] (Or from Here for Registered Students [37])
A comprehensive overview of liability concepts as applied to GIS and geographic datasets from primarily a U.S. law framework
Recommended:
- A GIS Code of Ethics: What Can We Learn From Other Organizations? [40]
Discusses the task of establishing a code of ethics for GIS professionals - Guidelines for Providing Appropriate Access to Geospatial Data in Response to Securtiy Concerns [41]
Things to consider when disseminating data - GIS Certification Institute [42]
Website for GISCI
2. Post a project write-up, including:
- current list of contributions to the profession (if any)
- list of clearinghouses visited
- thoughts about potential legal and ethical issues surrounding the use of data collected from clearinghouses or in your use of GIS in general
- a map including some data you've collected so far, whether from local contacts or clearinghouses
- Finalize your digital rolodex. List the contacts you made and explain how they helped or what they contributed to your plan.
3. Discuss the weekly topic on the discussion forum.
4. Continue writing your course paper. It is due in two weeks.
5. Complete Quiz 1
That's it for Part II...and Lesson 3!
You have just completed module 3.
Don't forget...if you have any questions, feel free to post them to the Lesson 3 Discussion Forum.
Lesson 4: Integrating Remotely-Sensed Image Data
Introduction: Remote Sensing
A. Goals
Upon completion of module 1, you will be able to identify potential data sources for remotely sensed data, determine availability and cost for those data, and acquire remotely sensed data from the Web.
B. Background
Written by Doug Miller, except as noted.
John and Frank Craighead, twin brothers and Penn State Class of '39 graduates, were world renowned for their efforts in wildlife studies and habitat conservation. Their long term study of grizzly bears in North America and around the world is lauded for its long-term record and success in understanding the grizzly bear and its habitat requirements. Their research legacy lives on in the form of the Craighead Environmental Research Institute (CERI) [43] where the Craighead family continues the conservation biology efforts initiated by their fathers/grandfathers.
CERI has focused much of its efforts in conservation biology by studying the wildlife habitat connectivity using remotely sensed data. Much of this work has focused on the Greater Yellowstone Ecosystem in Wyoming and portions of Idaho and Montana. In a region with increasing human influence, habitat continues to be fragmented, necessitating continued monitoring to ensure that essential landscape connections are preserved for wildlife. CERI uses remotely sensed data to track changes in land use and land cover in an attempt to understand the impact of these changes on grizzly bear habitat.
CERI, like many modern organizations, has discovered the power of remote sensing to track changes in the environment. The ability to image the same land area at multiple times ensures that geospatial databases can be kept current and that a historic record of these changes can be maintained. The goal of this exercise will be to familiarize you with the challenge of acquiring remotely sensed data for your final project area.
C. Module Overview
- Identify potential data sources for remotely sensed data
- Determine availability and cost for remotely sensed data
- Acquire remotely sensed data
- Extract Vector Data
D. Deliverables
This module is one week in length. Please refer to the course Calendar tab, in ANGEL, for the due date.
Please see the Deliverables section at the end of Part II for this week's readings and action items.
Checklist
Lesson 4 is one week in length. Please refer to the Calendar in ANGEL for specific time frames and due dates. To finish this lesson, you must complete the actvities listed below. You may find it useful to print this page out first so that you can follow along with the directions.
| Step | Activity | Access/Directions |
|---|---|---|
| 1 | Work through Lesson 4 | You are in the Lesson 4 online content now. The overview page is previous to this page, and you are on the Checklist page right now. |
| 2 | Complete the deliverables for Lesson 4 | Page 4 has this week's deliverables. |
Assessing Sources for Remotely Sensed Data
A. Download the Lesson Data
My story:
Centre County has digital orthophotos that are available to the public, but they are becoming dated. I would like to investigate new sources of high resolution satellite imagery to see if these might be a good update for my current geodatabase of the county. I was interested in determining if current data has already been acquired for the county, it's type, format, and cost per square mile. I was also curious about remotely sensed data that could be acquired freely from the Web for my county.
I acquired aerial photography from the county, aerial photography from PASDA, and free satellite data (ETM+,GeoTIFFs) from the Global Land Cover Facility (GLCF) site. If you want to see these various products unzip lesson4files and open lesson4.mxd. As you can imagine, these data are large. I eliminated quite a few images that I wanted to show, but the .zip file is still about 344 mb. I included the images of Beaver Stadium (Penn State's football stadium) because it is a large feature that stands out. It's interesting to compare the different products. I also looked at the sources provided below to get information about acquiring high resolution satellite imagery.
Registered Students download from ANGEL the Lesson 4 data (lesson4files.zip) to a new folder (e.g., C:\MGIS\GEOG488\Lesson4).
I want to thank Doug Miller for his contributions to this lesson.
Doug's story:
In the introduction, you read about a scenario that Doug Miller is interested in. Doug teaches a remote sensing course in the Geography Department on campus and will probably be developing an online remote sensing course for the MGIS Program. The example was given to get you thinking about some scenarios in which remotely sensed data are used. I will be deferring to Doug for some of your more in-depth questions about remote sensing.
B. Get a Refresher on Remotely Sensed Data
Remote sensing is the art and science of acquiring information about an object without being in physical contact with the object. Remotely sensed imagery can be collected at scales ranging from hand-held devices to orbiting satellites. Remote sensors rely on the interaction of energy with the area of interest. Sensors mounted on aircraft or satellite can collect imagery in multiple portions of the spectrum for use in feature identification. A comprehensive discussion of remote sensing is beyond the bounds of this exercise. However, in the "Resources" section you'll find a list of several very good texts that can be consulted for detailed information concerning the remote sensing process.
Satellite remote sensing, as applied to natural resources management, has been around since the early 1970s when NASA launched the first of a series of satellites that was to eventually become the "Landsat" program. In the intervening 30+ years, the number of earth sensing satellites has grown rapidly, with increasing spectral and spatial resolution and opportunities to combine, synergistically, information from multiple sensors. Commercial vendors now vie with the government-sponsored sensor programs for the consumer audience. For a quick, self-guided overview of several current programs and sources of remotely sensed data, explore the following:
- GLOBAL LAND COVER FACILITY [44]
Free Resource: The Global Land Cover Facility (GLCF) makes available to the public a variety of Earth science data products including satellite imagery of the Earth. - CENTER FOR GLOBAL CHANGE & EARTH OBSERVATIONS LANDSAT.ORG [45]
Free Resource: Landsat.org supports educational organizations by providing access to clearinghouse services. - LANDSAT ANNOUNCES FREE ARCHIVE ACCESS [46]
Landsat image is to be made available links to the data are in this article - QUICKBIRD & GEOEYE IMAGERY PRODUCTS FROM DIGITAL GLOBE [47]
Take a look at the QuickBird Imagery Products Product Guide for Part II. (Product Information > Product Docs and Papers). - LANDSAT 7 FROM USGS [48]
- RadarSat [49]
- GEOPHYSICS [50]
That's it for Part I!
You have just completed Part I of this module, which involved getting a refresher on remote sensing and browsing some sites that provide remotely sensed data. In Part II, you will assess remotely sensed data in your local area.
Acquiring Remotely Sensed Data
A. Assess Remotely Sensed Data in Your Local Area
Your story:
Assume that as part of your GIS plan you need to provide information about the acquisition of remotely sensed data for the temporal updating of a variety of data layers in the local enterprise GIS. You've heard that new commercial remote sensing satellites now provide extremely high resolution (0.5 - 1.0 meters) imagery in the visible portion of the spectrum that can be used for applications that previously required aerial photography acquisition. This new generation of satellites has provided a new set of opportunities for organizations who want to update their geospatial information systems. This exercise will introduce you to the challenge of assessing the best option for the acquisition of remotely sensed data for integration into a GIS.
Questions to answer:
- What type of remotely sensed data will be best for the intended applications?
- Spatial Resolution
- Temporal Resolution
- Spectral Requirements
- What are the potential satellite data sources for remotely sensed data?
- What are the logistical challenges you'll be faced with in the image acquisition process?
- Coverage
- Timing
- What are the costs associated with acquiring this data over the area of interest?
- Data Format
- Options (Raw, Georeferenced, Ortho-rectified...)
Prepare a write-up that outlines your assessment and provides an initial recommendation. Your write-up should include a map of the area and a full discussion of your findings including each of the factors listed above. A complete write-up will indicate a discussion of the logistical challenges, associated costs (on a per square mile basis), and a discussion of the options that are available.
Factors to Consider:
- Logistics and Timeliness - Can the vendor acquire the data in the time frame you require; What lead time is required?
- Options and Costs - What product options does the vendor offer and what are the associated costs
B. Extracting Vector Data from Raster Data
Raster or image data can be used as a source of vector data . There are several ways that raster data can be used to extract vector data or to adjust the vector data. The underlying principle seems to be that a picture is worth a 1000 lines. In other words, people trust pictures more than they do other forms of data. First, it must be remembered that distortion in images, even ortho-rectified ones, is most often greater than that achieved by a competent land surveyor. Secondly, the rendering of a line in an image is not to the same accuracy as it is in a vector due to pixelation, and for course rasters this is much worse of a problem. Thirdly, most raster do not have associated attribute data.
The ways to make vector data are many and will only be very briefly touched here. The most common today is heads up digitizing, i.e., tracing around the edges as they are seen on an image in an editing session. This is what Susan did for Montserrat. This can be quite accurate of it is done carefully and at the same scale as the image was taken, which is the raster resolution. Tests have shown that any form of manually digitizing has error and that rarely will two operators, or even the same operator if they repeat the same segment, end up with the same line work. However, with care and good work practices, this can be very nearly as accurate as the image (it is often hard to tell how accurate an image is so the final accuracy and precision is hard to judge definitively). In Spatial Analyst there is a menu choice to convert from raster to vector. Thus it does so in a "black box" manner. Care must be taken to look at the result critically. Often it is quite good, especially for simple raters, like a simple line drawing map. It is no use at all for actual photographs. Edge extraction can be used on these but is often so messy to be useless even as a drawing guide in heads up digitizing. There is an extension in ArcGIS called ArcScan that can be used to supervise how ArcGIS converts raster data. ArcScan allows you to trace lines manually and the program follows the lines in the raster for you. It has a number of rules about when to bridge a gap in the pixels and when not to jump across a gap; it lines up with the center of a line if it is more than few pixels wide. It also has many parameters to allow scanned material to be automatically converted after it has been suitably prepared. ArcScan was used to convert nautical charts to vector data. The last method is to use an image to spatial adjust vector data. This is the opposite of ortho-rectified Anchor points placed on lines and a linkage made to where the lines have to move to line up with the same visible feature in the image data. A note of caution here, it is necessary to ensure that the image is in the same projection, same datum and is error free -- otherwise you could be ruining a perfectly good dataset to agree to something just because it is pleasing to the eye. This problem often comes up when aerial photography is used as a backdrop to vector data. For example, bridges will appear to be wrong in an aerial because they are above the surface. It is worse if the overpass is high, and even worse when they are off to the edge of an aerial where parallax makes the distortion greater. It is rare that ortho-rectification is done so carefully as to remove all such artifacts or that a DEM is available that exactly follows the surface. Further, ortho-rectification is only as good as the DEM, the height control and exactness of the camera lens mathematical model. That is a long way of saying do not always trust your own or the camera's eyes.
More information on ArcScan can be found in the ESRI Helpfiles.
C. Deliverables
This module is one week in length. Please refer to the course Calendar tab, above, for the due date.
1. Readings:
Required:
- REMOTE SENSING USERS' GUIDE [51]
A reference for information and guidance when making remote sensing decisions (opens ANGEL for download for Registered Students)
(You learned a good bit about remote sensing in Geography 5121. Browse this guide for a refresher.) - Orthophotography [52]
A basic guide to what lies behind making a basic aerial photograph spatially accurate for use with a GIS.(opens ANGEL for download for Registered Students) - Updating Basemaps with Imagery [4]
A guide to using multiple data modalities to improve base maps.(opens ANGEL for download for Registered Students) - Visual Extraction and Data [4]
Innovative way of using spatial data.(opens ANGEL for download for Registered Students)
Optional:
- Automatic Extraction of "Road Intersections from Raster Maps" [53] (YaoYi Chiang, Craig A. Knoblock, and ChingChien Chen 2005)
A paper that shows how complex geoprocessing can improve conversion of raster data. - Benthic Data in GIS [4]
A novel way of using GIS with unconventional data. (opens ANGEL for download for Registered Students)
2. Post a project write-up including:
- brief discussion of how updated remote sensing data could be used in your project
- browse for existing remotely sensed data freely available for your project area from Web resources
- list availability and costs for acquiring existing and future high resolution satellite imagery from commercial vendors
- map showing boundary of area for which remotely sensed data are to be acquired (at least) and acquired data (if possible)
3. Discuss the weekly topic on the discussion forum.
4. Begin to finish writing your course paper. Your paper is due in the Dropbox of Lesson 5 Folder next week .
You have just completed module 4.
Don't forget...if you have any questions, feel free to post them to the Lesson 4 Discussion Forum.
Lesson 5, 6: Working With Data Formats
Introduction: Data Integration
A. Goals
Upon completion of module 5/6, you will be able to describe common data formats, diagnose the characteristics of unfamiliar data types, determine appropriate data formats given intended data use, incorporate various types of GIS data (e.g., tabular data in printed form, National Map data, GPS data, CAD data, LIDAR or other remotely-sensed data) into a GIS database, transform data from one format to another, understand GIS software functionality related to data conversion, import and export, editing, updating, and revising, and explain interoperability and the initiatives that are under way to accomplish that goal.
B. Background
Now that you've done an assessment of data for your area and started the acquisition process, chances are good that you've come across data that are in different formats. Whether they are data in another software format, tabular data, in an interchange format (e.g., .e00 files), or simply in different coordinate spaces, you probably have to do some kind of manipulation to make the data work together. In this lesson we will begin to get familiar with how to bring data from different sources together. With more and more organizations becoming familiar with the importance of interoperability, this task should get easier with time, as data will be made available in formats that are more easily integrated.
C. Module Overview
- Describe common data formats
- Diagnose the characteristics of unfamiliar data types
- Determine appropriate data formats given intended data use
- Incorporate various types of GIS data into a GIS database
- Transform data from one format to another
- Understand GIS software functionality related to data conversion, import and export, editing, updating, and revising
- Explain interoperability and the initiatives that are under way to accomplish that goal
D. Deliverables
This module is two weeks in length. Please refer to the course Calendar tab, in ANGEL, for the due date.
Please see the Deliverables section at the end of Part II for this week's readings and action items.
Checklist
Lesson 5, 6 is two weeks in length. Please refer to the Calendar in ANGEL for specific time frames and due dates. To finish this lesson, you must complete the actvities listed below. You may find it useful to print this page out first so that you can follow along with the directions.
| Step | Activity | Access/Directions |
|---|---|---|
| 1 | Work through Lesson 5, 6 | You are in the Lesson 5, 6 online content now. The overview page is previous to this page, and you are on the Checklist page right now. |
| 2 | Complete the deliverables for Lesson 5, 6 | Page 4 has this week's deliverables. |
Integrating Data in Different Formats
A. Download the Lesson Data
My story:
As I acquired data for my project, I encountered quite a few manipulations that I had to do in order to make all the data work together. I found some data in different software formats. I found some data in different projections (undefined with no metadata to tell me what the projection was). I downloaded data in interchange formats that needed to be imported. We'll go through the process I used to bring some of the data together.
Registered Students download from ANGEL the Lesson 5/6 data (lesson5_6files.zip) to a new folder (e.g., C:\MGIS\GEOG488\Lesson5_6).
The data in this exercise are used by permission of the State College Borough Water Authority, Centre County GIS, and Meridian GeoSystems Inc.
B. Load the Basemap Data
We will be adding data from many different sources (e00 file, xy data from a GPS, Mapinfo Data by import), and first we will be transforming CAD data to the coordinate space of the Centre County basemap data.
- The basemap data are the reference layers to which we want to transform the CAD data. In ArcMap, add the buildings and streets layers to the data frame. These data are already defined as NAD 1983 State Plane Pennsylvania North (Feet).
- Rename the data frame to Basemap.
- Make sure that the projection is set for the base map data and that it is not in "Geographic Projection." CAD data cannot be aligned with non-projected data because CAD data is flat, so must the data that is used for the transform be also flat. More information before you start is available at the Esri Support Site: Transforming CAD Data [54] and Projecting CAD Data [55]
- Problems can arise if you are not using ArcView 9.3 or do not have the service packs up to date for 9.2 (Sp3 required)
C. Integrate CAD Data
Load Data
- The CAD drawing is the same data that you downloaded in Lesson 1, but it has been renamed to SCBWA_PGM.
- Open ArcCatalog and navigate to your Lesson5_6 folder.
- This folder should now contain the CAD drawing from lesson 1 and shapefiles for Centre County, PA. The CAD data consists of a CAD drawing file and a CAD feature dataset.
- Preview the CAD drawing in ArcCatalog. You see all of the features within all of the layers of the drawing. The symbology you see is the same as that defined in the drawing. Also notice that you are only allowed to preview the geography.
- Preview the CAD feature dataset in ArcCatalog. Notice that now the drawing is divided into CAD feature classes: points, lines, polygons, and annotation.
- Use the Identify button to identify some of the features.
- In ArcMap, insert a new data frame into your map document and name it CAD. Drag the SCBWA_PGM.dwg CAD feature dataset into ArcMap's map display area. Click OK if you get a message that the layer is missing spatial reference information.
Set Transformation
The CAD feature dataset is not in the same coordinate space as the Centre County basemap data layers. It needs to be transformed into geographic space. In ArcMap at 9.2 there are a number of ways to do this. One method is to use the georeferencing toolbar and move and manipulate the cad drawing as if it were a raster or orthophoto image file. There are a number of tools on the bar to fit the drawing to the display and rotate and move it. The final step is to click the Update Georeferencing; This will lock the CAD drawing to the geo-coordinate system and generate a Worldfile. Another method is to look at the drawings properties by right clicking in the TOC. Under the property Transformations you can set up a worldfile directly. To see all the range of ways of working with CAD Drawing transformations I suggest that you look at Esri Help File for CAD Transformations or look at it online here [56].
We are going to use a Worldfile, as this method is permanent, and suitable for ArcGIS 9.1 and earlier. The accuracy of the transformation in all methods depends upon the accuracy and precision of locating common points between the Cad Drawing and the feature set used as a coordinate source. Sometimes, doing this manually is more accurate than the interactive method in the georeferencing tool set.
By using a world file, the SCBWA data can be positioned in the same coordinate space as the Centre County basemap data. In the next few steps, you will create a CAD world file to apply a coordinate transformation to the CAD layer to make sure it overlays with your other data. The CAD world file is a simple text file that contains four coordinate pairs.
You will identify a pair of common control points that are easy to identify in both the CAD feature dataset and the reference dataset. It's always a good idea to use fixed features such as road intersections or corners of buildings as control points because they are unlikely to move with time. You can document this in the Metadata, too, so that people know how you derived the coordinate system.
Make a WorldFile
- You will use buildings to define your control points.
- Turn off all the layers except the Polyline layer.
- We will change the visibility to display only buildings. Double-click the SCBWA_PGM.dwg Polyline layer in the ArcMap Table of Contents. In the Layer Properties dialog, go to the Drawing Layers tab, click Disable All, then check the box next to EX_BUILDING and EX_ROAD. Click OK.
- Change the symbology of the layer so the roads and buildings show up in different colors. Open Layer Properties. Click the Symbology tab. Choose Unique Values under Categories. Choose Layer for the Value Field. Click Add All Values and change the symbols of the two values.
- Zoom in on the building that is inside the bend in the road in the Northeast corner of the layer. [See Figure 1 [57]] Zoom to the northern corner of the larger building [See Figure 2 [58]] to the extent where the coordinates do not change when you move the mouse slightly. [See Figure 3 [59]]
- Identify the x,y coordinates from the CAD data frame by holding the mouse pointer over this corner. Open a text editor such as Notepad or Wordpad and record the coordinates shown in the bottom right corner of your display window, separating the x coordinate and y coordinate with a comma. e.g., 52961.71, 46873.18.
- Now we will identify the x,y coordinates from the Basemap data frame. Activate the Basemap data frame. You will be switching back and forth between data frames. There are shortcuts to do that. The F11 key activates a selected data frame. You can also hold down the Alt key and click a data frame to activate it.
- Discover more shortcuts in the ArcGIS Desktop Help. From the Help menu, selectArcGIS Desktop Help. Click the Index tab, type shortcuts and double-click for ArcMap in the list that appears in the Help window.
- Locate the same building and zoom in on the same corner shown. You can search the streets layer for Scott Rd. and then zoom to that feature to get in the general area. Hover your mouse over the corner and enter the x,y coordinates into the text editor the same as you did above.
Tip: You can use snapping to assist with the accurate creation of the control points. Snapping requires an active session, so you will need to have an editable vector layer in the map (preferably the editable layer will serve as the snapping layer).
- Format the coordinates you just collected in your text editor as follows: cadx,cady refx,refy. The coordinate values themselves don't contain commas. There is only one space character in this file and it is between the CAD values and the reference file (Basemap) values (cadx,cady refx,refy).
- Locate a second control point. Using the same procedure you used above, obtain a second pair of control points using the building found at the intersection of Butternut St. and Water St. [See Figure 4 [60] for a view of the building in the CAD data frame and Figure 5 [61] for a view of the building in the Basemap data frame.]
- Remember to identify the x,y coordinates from the CAD data frame first, followed by the corresponding x,y coordinates in the Reference (Basemap) data frame.
- Add the second set of point values to the second line of the text editor so the values are in the following format (The words "cad" and "ref" are used here only to distinguish the difference between the coordinates. Do not use them in your table.):
cadx,cady refx,refy
cadx,cady refx,refy
- Save the text file as SCBWA_PGM.wld in your Lesson5_6 folder. The world file is named the same as the CAD file, so it will be applied automatically whenever it is added to ArcGIS. This file must have exactly the same name (case sensitive) or it won't be recognized as part of the CAD files.
- When you save the file, be sure the file type specified is All files or (*.*), or the text editor will append a .txt extension onto the file, making the world file unrecognizable by ArcMap.
- We will now apply the transformation. Activate the CAD data frame.
- Display the Layer Properties for SCBWA_PGM.dwg. Click the Transformations tab and check Enable Transformations.
- For World File Name, click Browse, navigate to your Lesson5_6 folder, and open SCBWA_PGM.wld.
- Click OK to close the Layer Properties dialog.
- As the two line world file rotates, re-scales, and moves the CAD data to the new coordinate space, you no longer see SCBWA_PGM.dwg displayed. You'll get to see this at the end of the next step.
This is called an affine transformation and it changes the display by scaling and rotating, it is the moving the cad drawing to be concordant with the lines in the shape file. It is important that this method of moving CAD files only uses two reference points, unlike spatial adjust or georeferencing imagery. Done as an affine transformation parallel lines stay parallel and angles are correct, the strengths of the CAD system are preserved and the drawing is fitted to geographic space. What if they do not line up exactly? Well, data integration will not solve every problem. Unless you know for certain which is correct there is no basis for changing the drawing or the shapefile. - We will now define a spatial reference. The CAD layer is now in the correct coordinate space, but you still need to define a spatial reference for the data. Be aware, however, that defining a coordinate system is not the same as changing the coordinate system. The coordinate system you specify must be that used by the data. It is the same coordinate system used by the Basemap data.
- In ArcCatalog, right-click the SCBWA_PGM.dwg CAD feature dataset and click Properties. The CAD Feature Dataset Properties dialog appears.
- Click the Spatial Reference tab.
- Click Edit. The Spatial Reference Properties dialog appears.
- Click Import. The Browse for Dataset dialog box appears.
- Browse to one of the basemap layers and click Add.
- Click Save As. The Save Coordinate System dialog appears.
- Save the file as SCBWA_PGM.prj in your Lesson5_6 folder.
- Click OK to close the Spatial Reference Properties dialog.
- Click OKto close the CAD Feature Dataset Properties.
- Confirm that your data is in the correct coordinate space. In ArcMap, insert a new Data frame named Centre_County. Add both the buildings.shp file as well as the SCBWA_PGM.dwg CAD feature dataset to your map. The data should now line up.
- Browse over the image to see how they do line up. You will see that the CAD Drawing buildings are not identical to those in the Building Feature Set. The CAD buildings are more generalized, and appear to be more out of date. These kinds of Problems are common in mixing data sets, interoperability means that we can operate with both, but should not be assumed to mean data identity.
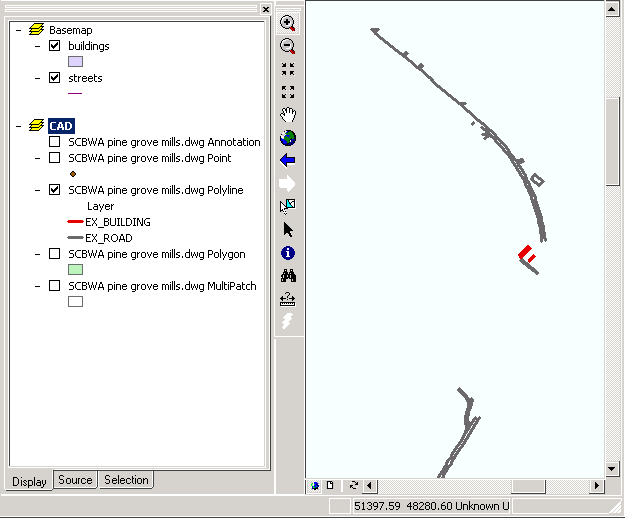
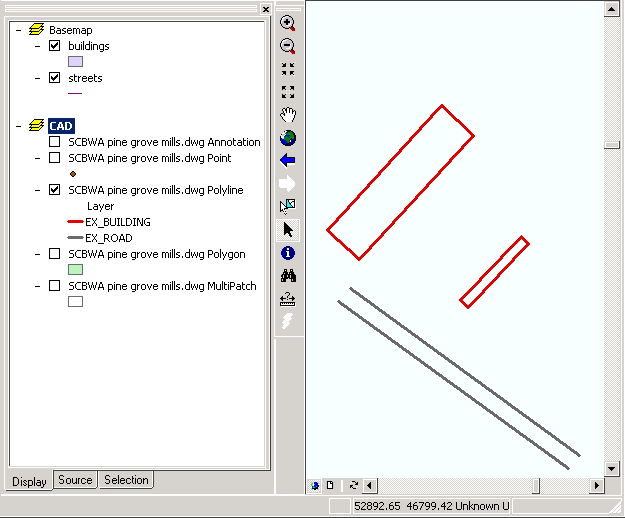
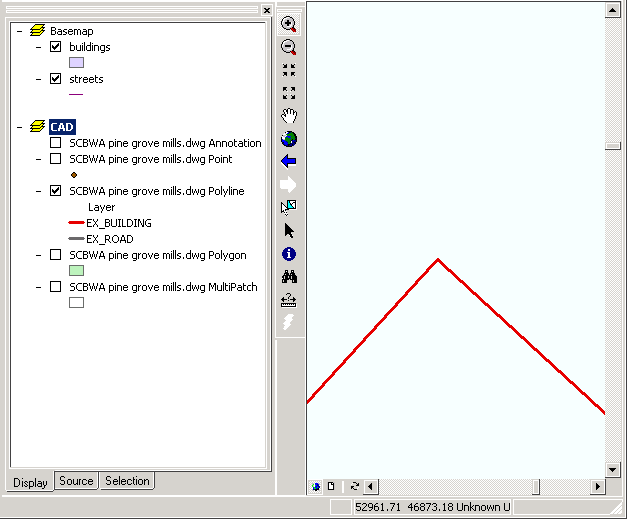
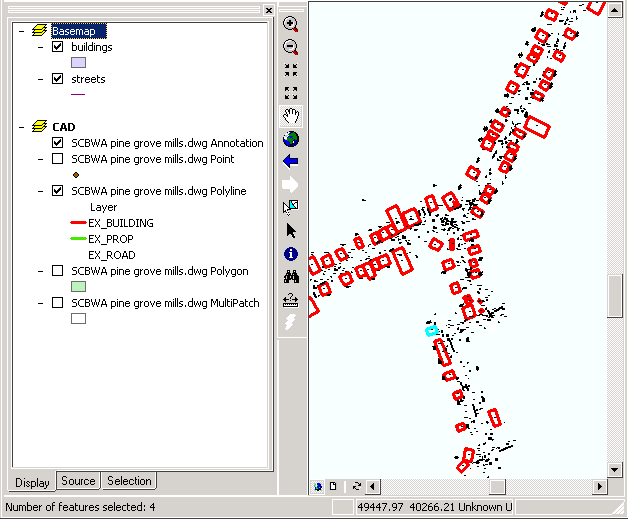
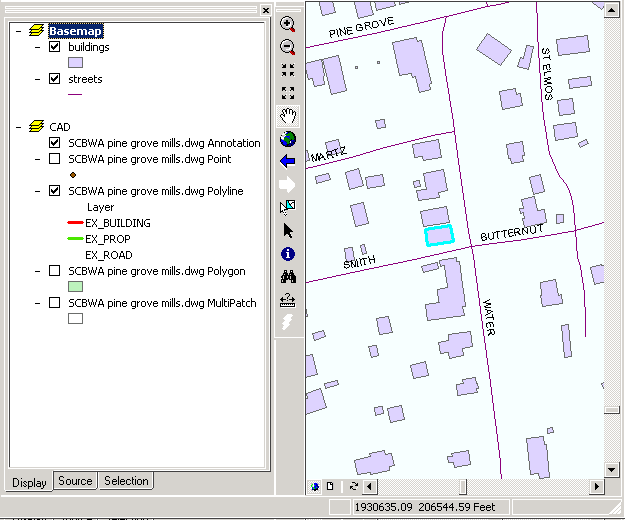
Optional Conversion
The easiest way to convert CAD files into ArcGIS shape or geodatabase is to use the CAD tool (example [62]). Make sure to export using the data frame coordinate system, not the source, or they will revert to CAD space instead of geographic space. You will need to set the projection for the files after as the Esri tool does not support this function. With this tool you can run a selection SQL statement to choose just the features you require. If you do not do this, all the lines will end up in the same shape file. You have to repeat this action for each geometry type, point, line, polygon, annotation.
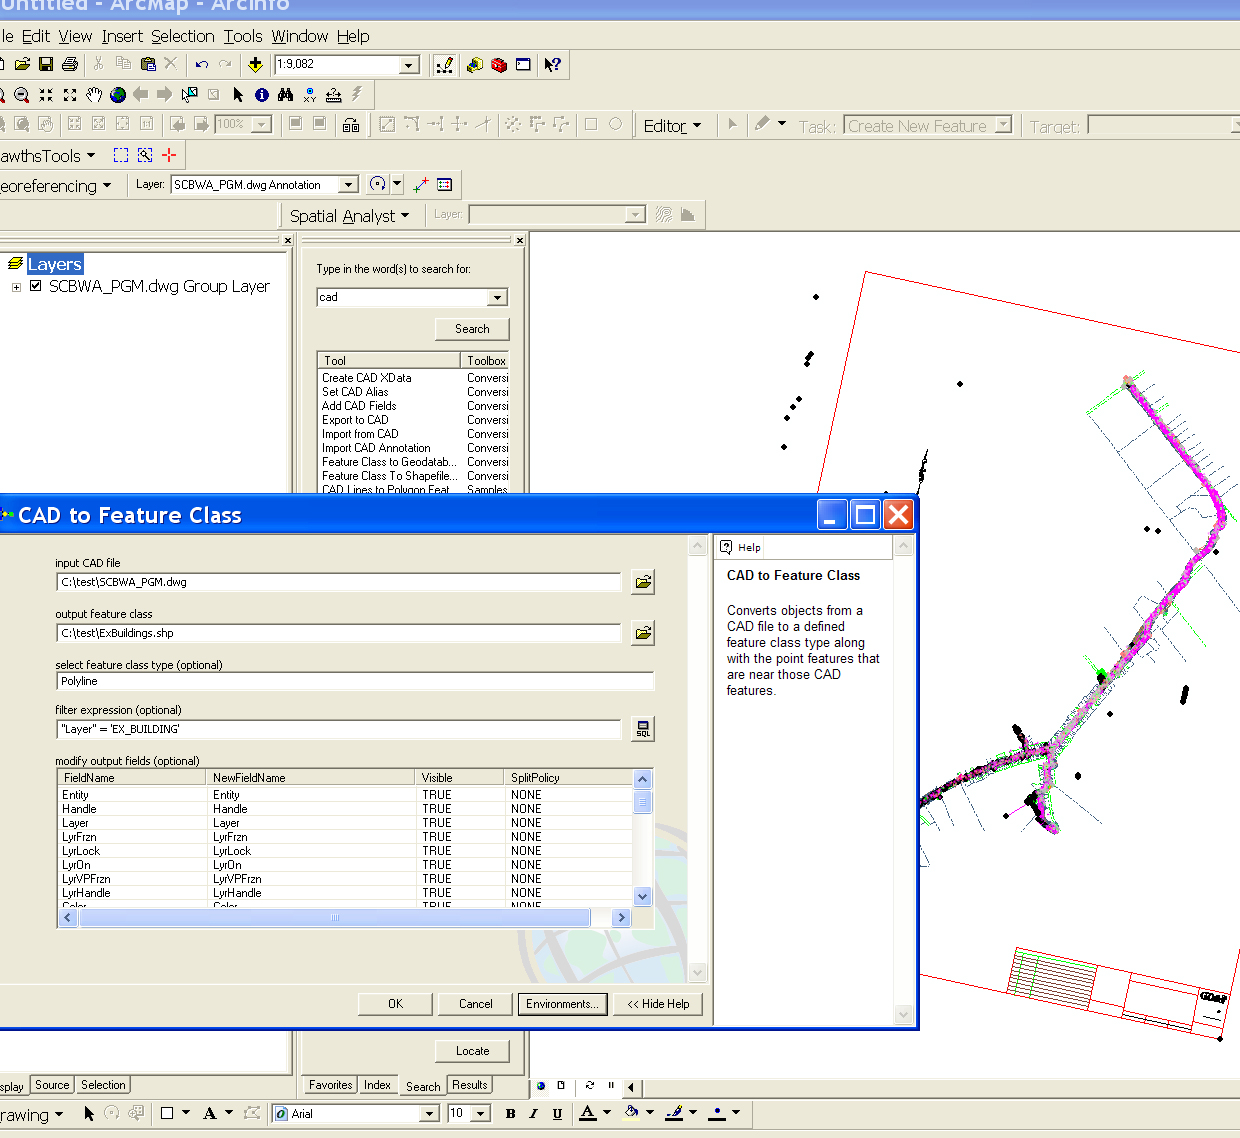
D. Integrate Coordinates from a GPS
These are a few points of interest on the Penn State Campus.
- Add the table campus_loc.txt to your Centre_County data frame.
- Click Tools > Add XY Data.
- Choose x for the X Field and y for the Y Field and click OK.
- Export the Events layer to a shapefile or feature class.
E. Integrate .e00 Files
These are school district data for Pennsylvania. Again you will see that there is no metadata and no coordinate system defined.
- Open the FMS Universal Translator.
- Under file menu pick Translate
- In the window set format from the format gallery to Esri e00
- Pick the data set as sch-centre.e00 from the Lesson 5_6 folder where you extracted the data
- Leave Coordinate System as read from source ...
- Choose the destination format as Esri Shapefile.
- Choose the destination dataset as a folder of your choice.
Hint e.g. Schools Example, Figure 6. [63] - Set the destination projection to be the same as the streets, which in this case is EPSG-2271 or PA83 NF
- Run translation
- Open ArcCat and navigate to new folder.
- Delete points shapefile that were converted but are not needed
- Rename Polygon output to SchoolDist
- Change to ArcMap and add the new Shape file
- Make sure they line up with streets shapefile
- FME also supports buttons and drag drop for lots of functions. Also the translator will let you increase the density of vertices, clip to a subsection and many other functions that we do not need here.
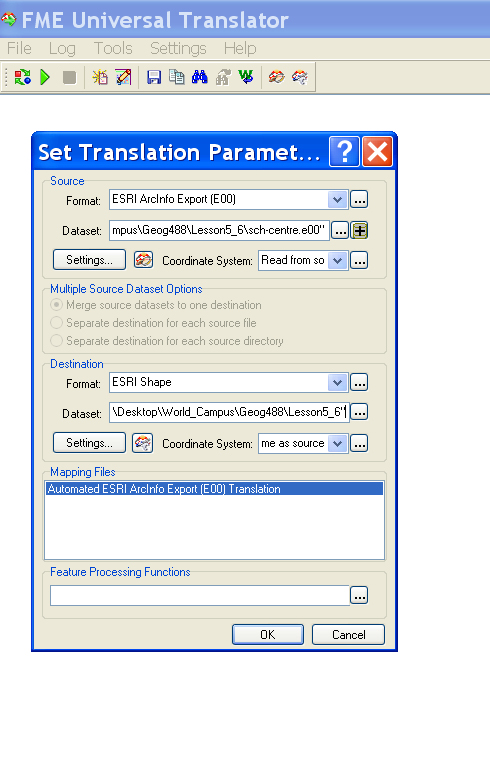
F. Integrate MapInfo Data
This is forest data for Pennsylvania. Again, devoid of the information, you need to be able to easily utilize the data. (I personally recommend noting when data is received without metadata and the assumptions you made to utilize the data in your own metadata you create. This will partly cover you if your guess turns out to be wrong.)
- Open the FME Universal Translator
- Under file menu, pick Translate
- In the window, set format from the format gallery to MapInfo MID/MIF
- Pick the data set as pa_forest.MIF from the Lesson 5_6 folder where you extracted the data
- Leave Coordinate System as read from source ...
- Choose the destination format as Esri GeoDatabase (Personal).
- Choose the destination dataset as a folder of your choice.
- Set the destination projection to be the same as the streets, which in this case is EPSG-2271 or PA83 NF
- Run translation
- Change to ArcMap and add the new Feature Set from the Geodatabase
- Make sure they line up with streets shapefile.
Optional
Take time to look around in the many features and help files in FME Universal Translator. In particular go through the supported feature types and look at their attributes.
CAD users who need to move data constantly between GIS and CAD programs must follow naming conventions as outlined in the guidelines of United States National CAD Standard. The documentation of the standard is costly to buy but they are based on those of the Department of Homeland Security Geospatial Data Model that can be viewed here DHS CAD Standard [64]. If you have time look at the standard to get an idea of the requirements.
That's it for Part I!
You have just completed Part I of this module, which involved integrating ArcView shapefiles, an ArcInfo coverage (.e00), a MapInfo layer (.mif), and CAD data. In Part II, you will explore additional data formats.
Exploring Data Formats
A. Share the Different Data Sources You've Come Across in Your Project
Your story:
As part of your data search, you may have come across data in different formats. Most organizations pick one software and stick with it. Many clearinghouses pick one data format, but provide data translators in case you are using a different software. In Part I, we worked with data in just a few formats. What other formats are out there? Take time to look at the FME Format Gallery. What data formats are the organizations you've come in contact with using?
ArcGIS Desktop Help
Take a look at the data types supported in ArcGIS in the ArcGIS Desktop Help. From the Help menu, select ArcGIS Desktop Help. Click the Index tab, type data and double-click types supported in ArcGIS in the list that appears in the Help window.
Do you subscribe to any GIS newsletters? If not, now is a good time to do so. There is a lot of information relevant to this class. Find an article related to data integration or interoperability. A few examples of online newsletters are:
- Directions Magazine - http://www.directionsmag.com/ [65]
- OGC News - http://www.opengeospatial.org/press/?page=newsletter [66]
- Vector One Magazine [67]
B. Deliverables
This module is two weeks in length. Please refer to the course Calendar tab in ANGEL for the due date.
1. Readings:
Required:
- ESRI EXPANDS SUPPORT FOR DATA INTEROPERABILITY AND STANDARDS [68]
Describes two new ESRI extensions. - THE IMPORTANCE OF GOING OPEN [69]
An Open Geospatial Consortium (OGC) White Paper (the fourth paper on the page) - "DATA INTEGRATION AND INTEROPERABILITY: ISO/OGC STANDARDS FOR GEO-INFORMATION" [70]
Article in Directions Magazine
Recommended:
- GEOGRAPHY MARKUP LANGUAGE (GML) [71]
Story announcing the release of GML Version 3.1 - SPATIAL DATA TRANSFER INFORMATION SITE [72]
USGS Site with information about SDTS
2. Post a project write-up including:
- map of georeferenced CAD data overlayed with Centre County basemap and school district data, and PA forest data;
- list of GIS data formats used in your project describing the data in terms of structure, topology, 2d or 3d, vector or raster, projected or not. If your project is slow getting going or has only a few data types, describe the data in the State College Integration Exercise.
- discussion of the data formats used in your local area and the interoperability of those data;
3. Write a brief essay on how you would explain to your boss that the data sets you have just acquired cannot be lined up and have discrepancies between them. Put in the Week 6 Drop Box. This should be business formal standard communication, not an informal note.
4. Discuss the weekly topics on the discussion forum.
5. Complete Quiz 2
6. Make sure you have posted the completed Course Paper in Week 5 in the Lesson 5 Drop Box.
That's it for Part II and Lesson 5/6!
You have just completed module 5/6.
Don't forget...if you have any questions, feel free to post them to the Lesson 5/6 Discussion Forum.
Lesson 7: Integrating GPS Data
Introduction: Acquiring and Integrating GPS Data
A. Goals
Upon completion of module 7, you will be able to recognize the accuracy of different grades of GPS receivers, explain the basics of how a GPS works, use a GPS to acquire your own data, explain how hand-held field units can be used for data acquisition, outline various data creation methods, and describe what's involved in publishing data.
B. Background
Until now we've been focusing on the acquisition of data that already exist. Your assessment of data in your project may have yielded a need for some new data layers. Depending upon the scale of your project, data you acquire with a basic, non commercial-grade GPS receiver may or may not meet your project specifications. For the purposes of getting practice with acquiring GPS data and integrating them into GIS, we will assume that the accuracy of a handheld recreational-use receiver is adequate for your needs.
C. Module Overview
- Recognize the accuracy of different grades of GPS receivers (recreational, mapping, surveying)
- Explain how GPS works
- Use a GPS to find a Geodetic monument
- Explain how hand-held field units can be used for data acquisition, ex. ArcPad
- Outline various data creation methods
D. Deliverables
This module is one week in length. Please refer to the course Calendar tab, in ANGEL, for the due date.
Please see the Deliverables section at the end of Part II for this week's readings and action items.
Checklist
Lesson 7 is one week in length. Please refer to the Calendar in ANGEL for specific time frames and due dates. To finish this lesson, you must complete the actvities listed below. You may find it useful to print this page out first so that you can follow along with the directions.
| Step | Activity | Access/Directions |
|---|---|---|
| 1 | Work through Lesson 7 | You are in the Lesson 7 online content now. The overview page is previous to this page, and you are on the Checklist page right now. |
| 2 | Complete the deliverables for Lesson 7 | Page 4 has this week's deliverables. |
Bringing GPS Data into a GIS
A. Download the Lesson Data
My story:
If you recall, one of the layers that the State College Borough Water Authority identified on their GIS wish list was fire hydrants. I decided to acquire hydrant data for this activity even though that type of data may call for sub-meter accuracy, something my recreational grade Garmin eTrex receiver will not give me. I noticed that there are some new developments in Pine Grove Mills that aren't included in the CAD data yet. Acquiring features in new developments is a great use for GPS.
NOTE -- If you are going to be collecting data in neighborhoods or in some place where your activities may look suspicious, it is a good idea to let the police department know where you will be and what you are doing in case someone calls. In these days of heightened security awareness, I suggest that you stay away from obvious military or government facilities.
Registered Students download from ANGEL the Lesson 7 data [73] (lesson7files.zip) to a new folder (e.g., C:\MGIS\GEOG488\Lesson7). This .zip file is about 73 mb.
B. Load the Basemap and GPS Data
We will be overlaying the GPS data I acquired with some of the county basemap data you've seen in previous lessons.
- Add the streets layer first. The data frame will assume the projection of that layer.
- Add the digital orthophoto clip_9230a.tif.
- Add the PGM_hydrants layer. These are the hydrants I acquired with the GPS. My receiver units are: Position Format: degrees, minutes, seconds; Map Datum: WGS 84.
- Rather than adding attributes directly into the GPS unit, I took notes in the field, being sure to include the waypoint number with each hydrant number. I personally always keep a data log incase of subsequent problems with the unit. Add the hydrants_lookup.dbf table into ArcMap.
- Join the hydrants_lookup.dbf table to the PGM_hydrants layer using the waypoint number for the join.
- In the next section, you will be adding fields and populating them. Export this layer to make the join permanent. Give the layer a new name such as PGM_hyd_ids.
- If you zoom around the ortho, you can see that one hydrant I acquired (z2-10-05) is in a development that was put in since the aerials were flown.
C. Add X and Y Coordinates
You'll notice that the X and Y coordinates are not included in the table.
- Open the Attributes of PGM_hyd_ids table.
- Add fields to hold the coordinates, e.g. X_coord and Y_coord. Be sure to specify parameters that will be able to hold the values, e.g. type: double, precision: 10, scale:6
- Right-click the field heading for the X field and click Calculate Geometry.
- Calculate the X Coordinate of a Point
- Right-click the field heading for the Y field and click Calculate Geometry.
- Calculate the Y Coordinate of a Point
D. Compare GPS Coordinates to a Known Location
- Add the benchmarks layer. These are benchmarks from the National Geodetic Survey site [74] [http://www.ngs.noaa.gov/] [75].
- Add the digital orthophoto clip_9243c.tif.
- Add the psu_ngs layer. These are GPS points I collected for one of the NGS benchmarks on the PSU campus.
- Measure the distances between the collected points and the benchmark with known coordinates. The 16 locations I acquired are off between 2 feet and 15 feet - not bad!
Now, you will be given some instructions on how to acquire these benchmarks from the NGS site to test the accuracy of your receiver.
E. GPS a National Geodetic Survey Control Station
- Go to the National Geodetic Survey [74] site [http://www.ngs.noaa.gov/] [75].
- Click the datasheets link.
- Click the Shapefiles button.
- You can pick from any of the Retrieval Methods, but these instructions will be for a Radial Search.
- Enter a Center Latitude and Center Longitude. These can be acquired with your GPS receiver.
- Enter a Radius.
- Keep the defaults for Data Type, Stability, and Compression Options.
- Enter a File Prefix and click Submit.
- A list of stations should appear. Highlight the stations you want to download or click Select All and click Get Shapefile.
- Save the file to your Lesson 7_8 directory. Unzip the file and add the shapefile to ArcMap.
- Now, you should now GPS these stations to see how accurate your GPS data are.
F. Optional Go Further into GPS and Location
Here is a look at geodetics and GPS [76]
That's it for Part I!
You have just completed Part I of this module, which involved looking at acquired GPS data and adding X and Y coordinates. In Part II, you will load GPS data you've acquired.
Acquiring Local GPS Data
A. Acquire GPS Data for your Area
Your story:
By now you should have identified a layer that you would like to acquire with your GPS receiver (this will be local cultural monuments unless you have something directly for your own project you need to collect with a GPS). Again, depending on the scale and accuracy requirements of your project, the layer may or may not meet your project specifications, but it will be good practice to start using a GPS receiver and to integrate the acquired data into GIS.
- Make sure WAAS is enabled if you have that capability on your receiver. On the Garmin eTrex units that are WAAS compatible, you can enable WAAS by going to Main Menu & Setup & System & WAAS.
- Check the units of your receiver. On the Garmin eTrex units you can do this by going to Main Menu & Setup & Units.
- Make sure that the Almanac is up to date by having turned your unit on and left it reading long enough to acquire the satellite data. For some units, this may take 30 minutes.
- Check that your battery is in good condition and will last long enough to finish the task.
- Check that the Datum is correct (default for all GPS is WGS1984). However, if you want to find something on a map, you will need to be in the same datum as the map you are working with.
- Acquire the points you identified for your project or those of local cultural units like monuments, historic markers, or buildings. On the Garmin eTrex units, you can mark a waypoint by holding in the button (what Garmin calls the "click stick") on the front of the unit. You can change the label of the waypoint by using the click stick to highlight the label and then selecting it to enter a new name or number. Once you are done editing the waypoint, click OK with the click stick.
- Make sure you collect the x y location, a name, a description, error, and your name and date, into a tab delimited text file.
- For better accuracy it is better to collect a point by averaging it.
- Make sure that your satellite geometry is good before you decide to record the way point. It needs to have a number of satellites visible in different parts of the sky and reasonably high off the horizon. The error reported by the unit may help you in assessing the quality of the reading.
- Acquire at least ten locations. In the next section, we will bring the data into ArcMap.
- As I said before, I always note the readings and other data in a position logging book in case I drop, lose, otherwise destroy the unit, or accidentally delete the waypoints when downloading. Often the things I record are once only events or are too far away or difficult to acquire again. I work in inhospitable areas like northern Kenya.
B. Load the GPS Data
Garmin eTrex GPS receivers are recommended for this class because they are affordable and there is an interface that can be downloaded from the Esri site or an alternative from http://www.dnr.state.mn.us/mis/gis/tools/arcview/extensions/DNRGarmin/DNRGarmin.html [77] .
****If you aren't using a Garmin receiver, you should be able to get a table of coordinates from your receiver via a cable. You can then use the Add XY Data tool that you used in the last lesson to create spatial features from the coordinates. If you have questions about how to do this with your receiver, I will help as much as I can, but I do not know how to use all receivers.****
 The following section is for Garmin eTrex receivers only.
- Go to the Esri Support page [78] and type gpsi in the textbox under the Search Our Site section in the upper left corner of the page and click the green Search button.
- You will see that there is one result in the Downloads section. Click Downloads and then click GPSi (GPS Interface). Read the summary and then click the green Download button.
- An alternative that some prefer is this download tool. The GSPi does not seem to work with all GPS units. (This is a problem as software becomes ever more integrated). http://www.dnr.state.mn.us/mis/gis/tools/arcview/extensions/DNRGarmin/DNRGarmin.html [77] The general method remains the same if you use this interface. Other units may well come with upload software.
- Read the disclaimer, and then if you accept, click the green accept button.
- A File Download dialog box will pop up. Specify where you want to save the file. (I created a folder in my ArcGIS directory called downloads and created a folder within that folder called GPSi. )
- Browse to the directory where you saved the file (AS12749.zip) and unzip the files.
- Open the readme.txt file and follow the installation instructions.
- Once you have completed the installation, the GPSi toolbar should appear in ArcMap.
- Connect the GPS cable to your receiver and to your computer. Turn the GPS unit on.
- Click GPS Interface > Waypoints > Download Waypoints.
In the summary of the utility, there is a note about Error 429. If you experience this error, you need to download the Mscomm32.ocx [79] file. You then need to register the file. This can be done by clicking the Start menu and choosing Run. Type regsvr32 and then the path where you downloaded the file in the text box and click OK.
e.g. regsvr32 D:\Geog_488\Project_7_8\mscomm32.ocx
- Select the waypoints you want to download. You can click the All or None buttons to make the selection of waypoints easier.
- Click Save. Save the waypoints as a shapefile to your Lesson 7_8 directory and add the layer to ArcMap. Do the points line up with your other data layers?
- Create metadata for your newly acquired layer.
- Check your data to see all fields were downloaded. A number of programs drop some fields; the most egregious is the elevation field. If it is dropped and you will want it for your final project, you will need to add it manually.
C. Explore Geocaching (Optional recreational activity but good practice with the GPS)
What is geocaching?
- Go to the Geocaching [80] [http://www.geocaching.com/] [81] site and find out.
- You can locate the nearest geocaches by entering your zip code. My zip code (16801) has 91 geocaches and I've visited four of them.
- Pick a geocache near you and at the very least post a few details about it in your write-up for this week. If you feel adventurous, visit one of the geocaches and take a little something and leave a little something.
D. GPS a Confluence (really optional)
- Go to the Degree Confluence Module [82] [http://www.confluence.org/] [83] site.
- If you are in the U.S. (lower 48) it is unlikely that you have an unvisited confluence near you, but you may still have fun visiting and acquiring your location. Browse around the site and take a look at the pictures of the confluence nearest you.
- Pick a confluence that has yet to be documented that you would like to visit. I think I'll go and take a picture of 13°S 30°E.
E. Deliverables
This module is One week in length. Please refer to the course Calendar tab in ANGEL for the due date.
1. Readings:
Required:
- "Recreational Versus Professional GPS: What's the Difference?" [84]
Article from ArcUser discussing some of the things to consider when deciding what grade of GPS receiver you need. - Trimble GPS Tutorial [85]
Trimble offers a basic walk-through GPS tutorial that doesn't focus on their brand. - Texas DOT GPS Manual [86]
A comprehensive manual for GPS surveyors and a good example of the level of documentation used in the field -- First, skim this weighty document but read the sections on accuracy completely, if you have time read as much as you can. - Cell Phones as new mass data collection technologies from Nature [87].
Recommended:
- GPS Guide for Beginners [88]
Garmin offers a fairly in-depth guide to GPS. - "ARCPAD: Mobile GPS" [89]
An ESRI white paper about ArcPad. - "The National Map Corps: Volunteer for a Changing World." [90]
The only requirements needed to contribute to this effort include owning a GPS receiver and having Internet access. - Fun Thing To Do: Listen to a BBC World Service Podcast on Spatial & GPS Technologies (Click Here to Listen [91]).
2. Post a project write-up including:
- discussion about what grade of receiver would be necessary to acquire data for your project (if the unit you are using is adequate for the data you are collecting, what additional layers might call for a different grade?);
3. Send the point layer shapefile for the cultural monuments you have collected including metadata.
If you are collecting data for your project then send a point layer shapefile for that data instead.
This should be sent to the Lesson Seven Cultural Points Drop Box as a Layer Package.
Layer packages can be made from the tool in the Data Management Toolbox (to see an example click here [92]).
4. Discuss the weekly topics on the discussion forum.
5. Frustration Revisited. Having got so far, now the final project might look pretty uncoordinated. Do not become disheartened by this, as this is normal. As you begin to write it up it will all fall together. Remember that in Problem Based Learning the process is more important than the product. If you need to change course, project expected deliverables, or want to modify what you had planned, do not worry. I will take this into account at this point, too. Remember to document all your efforts and keep me informed. Contact me directly if you feel the need to discuss your plans in person. Sometimes a few words are worth a ton of emails
That's it for Part II and Lesson 7!
You have just completed module 7.
Don't forget...if you have any questions, feel free to post them to the Lesson 7 Discussion Forum.
Lesson 8: Publishing GIS Data
Introduction: Publishing Data
A. Goals
Upon completion of module 8, you will be able to describe what's involved in publishing data.
B. Background
Until now we've been focusing on the acquisition of data that already exist. Your assessment of data in your project may have yielded a need for some new data layers. You will have acquired these by now and quite likely created some new data with the GPS or by analysis of other data to create new data.
C. Module Overview
- Describe the steps to share data
- Describe the steps to move data from various sources into an integrated data format
- Describe what's involved in contributing newly created data to The National Map or a GIS portal
D. Deliverables
This module is one week in length. Please refer to the course Calendar tab, in ANGEL, for the due date.
FME saved Workbench FMW file, the workbench log and metadata for one layer.
Please see the Deliverables section at the end of Part II for this week's readings and action items.
Checklist
Lesson 8 is one week in length. Please refer to the Calendar in ANGEL for specific time frames and due dates. To finish this lesson, you must complete the actvities listed below. You may find it useful to print this page first so that you can follow along with the directions.
| Step | Activity | Access/Directions |
|---|---|---|
| 1 | Work through Lesson 8 | You are in the Lesson 8 online content now. The overview page is previous to this page, and you are on the Checklist page right now. |
| 2 | Complete the deliverables for Lesson 8 | Page 4 has this week's deliverables. |
Bringing Data into a Unified Format
A. Rationale
My story:
If you recall, the layers that the State College Borough Water Authority identified on their GIS wish list came from many sources. We have added GPS, schools data, forest data, Centre County data and the CAD Drawing. These were imported from a number of sources and comprise a lot of different data types. Now, we wish to hand the project off, and to do this we will give them a unified data source.
B. Load the Data into FME Workbench
Workbench is the real workplace of the FME package. It has an industrial strength Database Management System that is optimized for spatial datasets. The same thing can be achieved by using ArcMap and ArcCatalogue. To it in these packages each piece of data will have to be treated separately and it is once only operation. In Workbench, the action can be saved and run again as things are needed. Workbench also keeps extensive log files so that work actions and flows can be recorded and documented.
- Open FME Workbench (If you have a support problem the course instructor, not FME, is the person to contact).
- Drag the Building Plots Shape File into the workspace or use the Add Reader button or dialog.
- Click the Add Writer button or menu and navigate to a directory and set up Esri Geodatabase, file based personal geodatabase, name the geodatabase "SCBWAGIS"
- Add a Feature and set feature. Name the variable to something descriptive, e.g. "Building Plot Polygons."
- Set feature geometry to suit the incoming geometry; in this case "polygons."
- Connect workflow arrow to it. (To set a destination there is not a button or dropdown menu on the application. Look for the little yellow can and the green arrow pointing to the right. That is the button that will take you to the place where you go to set the destination for the buildings and streets layers to the FileBasedGeodatabase; just drag it across.)
- Do the same thing for Streets. The work flow is drag in a data set, set a destination in the writer, and connect the two with an arrow.
- Continue adding data sources and setting the connections to the geodatabase as per the first connection.
 .
. - Run the model to populate the geodatabase (when it has run it will have the number of features as a label on the arrow line (See Figure 8.1, above).
- Save the FME workspace so that it can be run again if the data are updated.
- Document your work, save the logfile from FME with the Geodatabase. Save any metadata you have received for the layers you included (in this case it will be none). You will need to create Metadata if there is none; do this for one of the layers only using the Esri metadata creator in ArcCatalogue.
Look around in FME and you will see lots and lots of features that we do not have time to look into, but you can select, subset, transform, generalize, simplify, and otherwise modify data as it is loaded. This can be particularly useful if you are transferring data from a different program. It is also the time to generalize data to a similar scale. The repeatability of these programs really is useful if you are receiving data from another source on a regular basis. For example, the works department has data on government owned and controlled buildings and the planning department has information on new buildings and you also have parcel data. These different departments might send you new data on a update basis or might send out a weekly data update. These you have to integrate each week to ensure that you are working on the same data. It would be nice if all the data were in the same format, but as it has different sources, it quite likely will not be standardized. If you have a lot of interactions with CAD based data that is not in geographic coordinates but is in arbitrary CAD space units, it is sometimes better to build a custom CAD projection so that ArcGIS knows how to reproject them, rather than transforming them. The custom projection takes a flat projection like UTM and then provides a custom offset (False Easting and False Northing ) to line it up. It might also take a custom scaling index to ensure a similar scale. This is really worth doing if you have lots of CAD drawings in the same source coordinates or if you have a frequent update series.
C. Use open interchange propriety or interchange formats?
In the example above, we have used the scenario of a consultant working with a variety of other authorities to create a GIS for the Water Board. When we hand it off, they want to have the data in their GIS with minimal work. Assuming that they had an ArcGIS system, the geodatabase is the best choice for delivery. It is richer than the open source standard, the shapefile. Shapefiles do not have anywhere near the amount of information about domains, topology and time (temporality) that a geodatabase can or an ArcInfo coverage can have. If you want exchange files on a regular basis, as when a corporation updates files and passes them on to another entity, then it pays to have inbuilt translation methodology like FME Workbench. If the data are to be put on the web for anybody, then a widespread propriety file like ArcGIS or even ArcInfo Coverage e00 export file are okay, but open source data would be better. Most GIS systems have routines to deal with common propriety file types, and Esri is now the de facto statndard. How about if the downloader runs a rarer GIS? Has anyone received GRASS or SmallWorld files? These can be difficult to work with and not everyone has the Interoperability Extension or FME. Open source files are fine for simple geometries without topology and are probably the best in many situations. However, they are not universally the best. Sometimes, a more complex spatial entity is better preserved in a more complex data type. Make a lfinal ist of file types you have incorporated into your project and add it to your document e-portfolio.
That's it for Part I!
You have just completed Part I of this module, Part II, you will load GPS data you've acquired.
Sharing and Publishing Data
A. Acquired Data
Your story:
By now you should have acquired data for your project. As the project is completed you will be effectively publishing the data you have collected (even if the data is for restricted distribution, think of it as publishing it only to me). You may be sharing the data with the organization you have teamed up with. You may be making a map and making that available. You may have done some analysis and be supplying the results of the analysis. Technically, these are all uses of the data and may or may not be affected by any license you have signed or agreed to when you obtained the data.
Assessing you permissions and duties
- First, look at any agreements you have signed or agreed to.
- Now look at the metadata with the data, as this often has restrictions.
- Consider the fair use requirements and see if your data usage and publishing fits these.
- Many data suppliers agree to you publishing data if it has been changed from the original. If you have developed derivative data from your source data, is this reverse-engineerable? If it is simple to do, this might not qualify as derrivative data, e.g. if you have a raster and multiply the values by 10, this will not count as deriveritive data. If you instead take a raster image, apply a non linear stretch to it and not publish the stretch formula, this might in fact be derivative. How much difference is enough is a bit like the question, "How long is a piece of string?" It is not quantifiable.
- Sharing raw data will be more problematic than publishing a final project map.
- Putting it on the web with unrestricted access will cause more problems than publishing it within a closed Local Area Network. But what about your colleagues. Will they obey restrictions or will they share?
- Quite often a not-for-profit clause will allow scientifc work to be published in a journal but not in a textbook.
- It is always safer to be cautious when republishing restricted data. Much data is in the public realm, but then again much is not. Outside of the the USA, and for all data you pay for, most data will have legal restrictions.
- Always supply data that originated elswhere with attribution to the source and licenses that it came with.
Data You Created
- Provide data completely (if you subset the data say so)
- Provide metadata
- Provide a projection file if it is an ArcGIS format
- Provide data disclaimers
- Provided a scale and accuracy report
- Limit liability
- Put restrictions on further sharing
- Zip or otherwise compress it into a single package (so that the metadata travels with shape files)
- If the final product is an image, not data, place copyright information
- Send me a copy of the FME saved Workbench FMW file, the logfile, and metadata for one layer. The metadata should include all the things needed.
B. Deliverables
This module is one week in length. Please refer to the course Calendar tab in ANGEL for the due date.
1. Readings:
Required:
- "Esri Standards and Interoperability" [93]
Esri whitepaper on concerns in operability with reference to standards - FME Powerpoint [94]
A useful Powerpoint from the FME Users' conference showing how complex feature manipulation can be achieved in a realworld environment.
Recommended:
- "Arc/Info Export (E00) Format Analysis" [95] (Look at this but do not try to learn it. This paper is useful to show how the data is stored in a single file)
- "GIS data exchange problems, solutions." by Zoltán Siki [96]. Hungarian difficulties with interoperability
2. Make sure you have sent the FME saved Workbench FMW file, the log and metadata for one layer from Part I.
3. Post a project write-up including:
- map of imported GPS coordinates for your project data that you sent last week. Should be added to your project.. if you have collected only cultural points these can be added to your e-portfolio;
- map of GPSed survey control stations for your area overlayed with the shapefile you acquired from the NGS site;
- information about a geocache in your area;
- (optional) map of waypoints and/or track acquired when geocaching in your area;
- (optional) picture of degree confluence near you.
4. Discuss the weekly topics on the discussion forum.
5. Complete Quiz 3.
C. Register with Geospatial One-Stop (This optional if you want to publish your data for the community) for extra credit.
In addition to posting your final project to your portfolio, you can publish your data to a clearinghouse for extra credit.
- Register to become a geodata.gov [97] publisher.
- Familiarize yourself with the instructions for publishing data.
- Publish data at geodata.gov [98] publisher (for extra credit).
That's it for Part II and Lesson 8!
You have just completed module 8.
Don't forget...if you have any questions, feel free to post them to the Lesson 8 Discussion Forum.
Lesson 9, 10: Compilation and Presentation of Class Final Project
Introduction
A. Goals
This project wraps up the course and requires you to integrate components from previous lessons into a comprehensive presentation of your work throughout the course. Upon completion of the project, you will be able to demonstrate how to tackle a GIS data acquisition project, including assessment, acquisition, integration, creation, and publication.
B. Background
GIS courses and trainings are a common way for people to get introduced to the field or to add some formal education to their resumes. All too often these courses use canned data that get plugged into fun, "real-world" scenarios. In the real world, data are hard to come by. It's also hard to learn GIS tools and concepts when the data aren't familiar. This course was designed with those issues in mind. In this final project, you will present your findings from the first eight weeks. You will summarize your project idea and present the work you've done in an organized fashion. You will discuss the challenges you faced and document the process you followed to complete the assigned course objectives.
C. Module Overview
- Integrate components from previous lessons into a comprehensive presentation of class project
- Create a workflow that outlines the steps, procedures and data necessary for the finished project
D. Deliverables
This module is two weeks in length. Please refer to the course Calendar tab, in ANGEL, for the due date.
Please see the Deliverables section at the end of Part II for this week's readings and action items.
Checklist
Lesson 9/10 is two weeks in length. Please refer to the Calendar in ANGEL for specific time frames and due dates. To finish this lesson, you must complete the actvities listed below. You may find it useful to print this page first so that you can follow along with the directions.
| Step | Activity | Access/Directions |
|---|---|---|
| 1 | Work through Lesson 9/10 | You are in the Lesson 9/10 online content now. The overview page is previous to this page, and you are on the Checklist page right now. |
| 2 | Complete the deliverables for Lesson 9/10 | Page 3 has this week's deliverables. |
Presenting and Publishing Your Work
A. Present the Final Project in Your Portfolio
(or in a Cumulative Document if Access is restriced)
Your portfolio is a very valuable showcase for the work you've completed in this entire program. Approach the presentation of this project as if it will be viewed by a potential employer who is looking to hire a GIS Director for her organization. The presentation should highlight your resourcefulness when it comes to starting a new GIS project.
Some things you should include:
- Include a summary of your project idea. This should provide enough information to someone who is looking at your project for the first time. Why did you pick this project? Did you start off with another scenario and then change? If so, why?
- Discuss the challenges you faced with the project. e.g. Were there too many data? Were data scarce? Were you able to find contacts who provided good information? Were you able to find metadata?
- Document the process you followed to complete the assigned course objectives. You should have been keeping a log of the steps you've taken throughout the course. You've done a lot of work; show that off here. What goes into taking on a data assessment/acquisition project?
- Create maps showing the data you acquired and provide captions.
- List at least five things you learned as a result of taking on this data acquisition and integration project. Were you successful? If so, why? How do you define success? If not, why? What should you have done differently? What advice would you give someone else starting a similar project?
Some things you might want to include:
- How did you identify contacts?
- What questions did you ask? What additional questions would you ask if you were to do it all again?
- How hard was it to track down data?
- Do organizations in your area communicate about existing GIS data or future GIS needs? Are there data duplication problems?
- Did you encounter any issues with data integration? How do you feel about the progress of interoperability - data or software?
- Did you identify a need for additional data in your area? If yes, can those data be acquired with GPS? What grade of receiver would be necessary?
- How was the process of publishing your data? Do you foresee more and more users publishing their own data to a site like geodata.gov?
B. (Optional) Upload Data to a Web Portal
- Many of your projects will have useful and important data for the public, so you might like to share it -- extra credit if you do.
- By now you should have already registered with geodata.gov. Log in to that site.
- Click Publish a New Record.
- You can choose to complete the online metadata form or to upload a metadata file. If you complete the online metadata form, you can upload your data directly to the site instead of only providing the metadata for your data. Be sure to provide complete metadata, as the publishing process will be made much faster.
NOTE The review process can take up to 24 hours, so please try to publish your data a couple days before the end of the course.
C. Deliverables
This module is two weeks in length. Please refer to the course Calendar tab in ANGEL for the due date.
1. Readings:
Required:
- "The Spatial Web" [99]
An Open GIS Consortium (OGC) White Paper about data production and sharing via the web. (Click on the link to "The Spatial Web" from the list of White Papers.)
Recommended:
- How to Publish Your Data on GEODATA.GOV [98]
Answers to common questions about publishing data on geodata.gov. (On the left frame under "About This Site," click on the link to "How to find the maps & data you need and how to publish your data here." Read the "How to Publish Your Data on geodata.gov" and the "Frequently Asked Questions" sections.)
2. Post your final project presentation, including:
- Summary of your project idea;
- A discussion about the challenges you faced throughout the course;
- Documentation or workflow of the process you followed to complete the assigned course objectives;
- Maps showing data you acquired from local sources, clearinghouses, and GPS (be sure to include descriptions of each map);
- List of things (at least five) you've learned as a result of taking on this data acquisition and integration project.
3. Discuss the weekly topics on the discussion forum.
4. End of Course Evaluation [100].
From: Janet May, Associate Director for World Campus Evaluation
Penn State's College of Earth and Mineral Sciences and the World Campus are dedicated to offering educational programs that best meet the educational needs of our learners. Your feedback is important for improving Penn State online courses and services. We are requesting that you submit an end-of-course evaluation for the course you are currently completing.
That's it for Part I and the Final Project!
You have just completed module 9/10.
Don't forget...if you have any questions, feel free to post them to the Lesson 9/10 Discussion Forum.