When any GIS project is first undertaken, a review of the data resources is often necessary. That is the approach you've been taking in your individual final projects. Now that you've begun to assess the availability of data in your local area, you can broaden your search to include online clearinghouses. Depending on the scope and scale of the final project, clearinghouses may or may not be a good source. Using data from clearinghouses can raise legal and ethical problems related to data accuracy and data use. In the first part of this module, you will be introduced to a scenario from a former student. You will browse clearinghouses and look for data for your own area. In the second part of the module, do a data inventory for your area. We will then look at the legal and ethical implications of using the data you have found.
Upon completion of this module, you will be able to acquire your own data from online clearinghouses and will be able to recognize potential legal and ethical problems related to data use.
Data is becoming more widely available on the web these days as users and GIS developers share and publish data. Many layers of data are too costly for an individual or corporation to record, produce, or maintain themselves. For this kind of data, often at the national scale, it is imperative that it be acquired from public sources. The U.S., unlike many countries, freely provides national data. It is this freedom of access to data acquired by tax expenditures that has prompted the enormous growth in the spatial industries.
This module is one week in length. Please refer to the course Calendar tab, in ANGEL, for the due date.
Please see the Deliverables section at the end of Part II for this week's readings and action items.
Lesson 3 is one week in length. Please refer to the Calendar in ANGEL for specific time frames and due dates. To finish this lesson, you must complete the actvities listed below. You may find it useful to print this page out first so that you can follow along with the directions.
| Step | Activity | Access/Directions |
|---|---|---|
| 1 | Work through Lesson 3 | You are in the Lesson 3 online content now. The overview page is previous to this page, and you are on the Checklist page right now. |
| 2 | Complete the deliverables for Lesson 3 | Page 4 has this week's deliverables. |
Susan's story:
Susan is a former student in the Certificate Program in GIS. Susan decided to create a GIS activity for children in a local middle school. She picked a topic that fit well with the curriculum and that is of interest to her - volcanoes in Montserrat, British West Indies. She had no data resources when she started the project and decided to search online resources and data clearinghouses.
Optional Exercise: Registered Students can download from ANGEL the Lesson 3 data (optional.lesson3files.zip) to a new folder (e.g., C:\MGIS\GEOG488\Lesson3) and look at real world examples of data mismatch.
I want to thank Susan Wheeler for the contribution of her story.
Susan has also contributed to the profession by educating others about GIS. I decided to include her story in this lesson because she did an exhaustive search of online resources. She acquired some georeferenced data and digital maps from the web, but discovered that she would probably have to create her own data to make a worthwhile activity. She searched a local library, found a topographic map, scanned it, georeferenced it and digitized layers necessary for her project.
Susan's task was fairly different from what we are doing. She was at a disadvantage because she was looking for data for a place that doesn't have much, but she was at an advantage in that she was working with an entire island and didn't have to have any large scale data to make her project work.
Susan provided a list of resources [1] she used.
The types of data found in most clearinghouses free of charge are usually more suitable for projects like Susan's because she did not need the level of accuracy that we are more likely to need in our projects. She was working at a much smaller scale; she was looking at data for an entire island. Susan was amazed at the amount of searching she had to do to acquire such a small amount of data. Without doing that search though, she wouldn't have known that the data she needed didn't exist (not that she was able to find anyway).
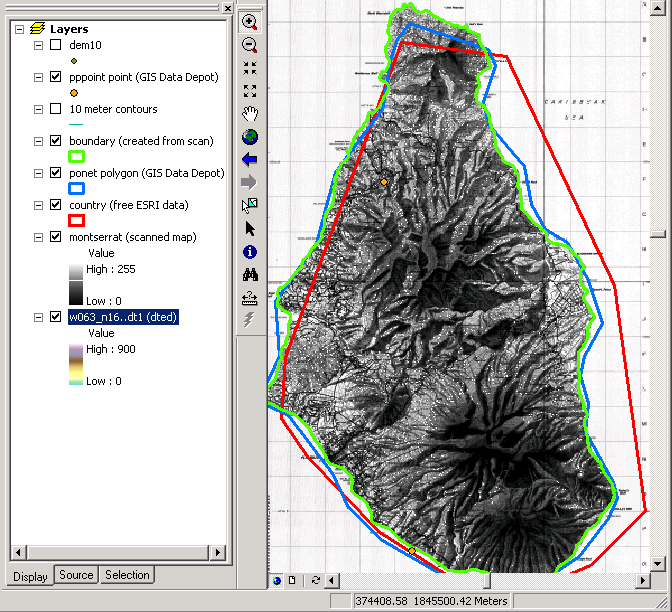
Here is an image showing some of the data Susan acquired. [2]
I should mention that this project did not only involve a search for data on the web. Susan and her family went to Montserrat (a research trip that was to take place regardless) and collected GPS data that were used in the lesson. After her Internet searches, which led to some phone calls and emails, she was fairly confident that the data she created were not part of a duplicated effort. Susan's work paid off. The kids learned GIS through a fun and interactive lesson and she was able to reach an even greater audience by writing about the experience. See an article about Susan's work entitled "Exploring Montserrat, British West Indies, With GIS" [3] in ArcNews.
Acquire Data from Clearinghouses for Your Project Area
Your story:
As part of your assessment in week 1, you might have discovered that there are online resources, such as a state clearinghouse, that have data for your project area. Perform an Internet search and compile a list of sites that contain data that might be useful for your data inventory.
Websites that provide geospatial data or links to them are popping up all over the place. It's interesting to see what the latest and greatest idea is when it comes to clearinghouses. Over the past years, we've seen quite a few clearinghouses touting themselves as a place for "one-stop shopping." The most recent, Geospatial One-Stop, even includes that in the name. How can you question that? The truth is, whether it's FDGC's Clearinghouse, or Esri's Geography Network, or the National Map and Geospatial One-Stop, most of these organizations seem to have trouble with buy-in.
Different sites have different requirements for contributors, but a good site requires complete metadata. As you likely discovered in Lesson 2 (if you weren't already aware), good metadata are hard to come by. Most organizations haven't made metadata a priority and are therefore unlikely to make the time to prepare data so they are publishable. There are also the many questions that people have. What is the quality of the data? Who can (should be allowed to) contribute? How often to I have to publish updates? What's in it for me? This last question is probably the biggest. The newest portals are so new that they may still prove themselves to be one-stop shops. It seems that GIS professionals like us should be contributing our own data to those sites.
As you're creating your list of resources, keep these questions in mind:
You have just completed Part I of this module, which involved perusing some data I acquired from clearinghouses and pondering legal and ethical issues related to GIS. In Part II, you will browse clearinghouses to look for data for your project area.
As you're browsing the sites keep these questions in mind:
Aside from the topic of clearinghouses, draw from the class readings this week and think about whether there are any other legal or ethical issues you've come across in your prior work with GIS or during this project or module.
You would have to be very lucky to have found data for all of your final project that was at the same scale, in the same projection, with the same datum, collected at the same time and in the same manner. What is worse is that, unless people have been very diligent in their data documentation, you will not know all of the parameters.
As soon as data from different sources, times, scales, etc., is mixed, it is subject to errors. If we use this data to derive new data, the errors propagate into the new analysis. An easy example is we overlay data on top of each other, the areas where the data do not agree forms a myriad of little slivers, if it is polygon data and over/under shoots if it is line data. Take another look at Susan's map image showing some of the data Susan acquired of Montserrat [2]. In this image the coastlines do not agree. So if you are analyzing the density of something, there will be different areas generated. The obvious choice is to use the image derived from the raster data. However, this is not correct unless all the other data are of the same scale, and the raster is in an area preserving projection. The correct choice is to generalize data to the same scale so that you do not get a sense of false precision. Looking at the data, a guess would be that the Esri data is in a different Datum. The blue line from Digital Chart of the World Ponet might be in a different projection, foreshortening the top of the image. But without documentation, these will remain guesses. Now staying with the Montserrat data, depending when the data was produced, the coastline might be wrong, because the island has grown as the active volcano has poured lava into the sea. So if you wanted to know the density of people, you would have to use an older image, as all the population was evacuated. You get the meaning.
Projections, as you know, cause distortions in at least one aspect of the data. There is no meaning in calculating area on a data set that has not preserved it, or similarly, measuring distances in a dataset that distorts distance is also wrong. Extracting data from a larger dataset can cause problems with combining data as edge effects might be present in one dataset and not another. UTM projected data, for example, are prone to edge effects. Raster data from aerial sources also have distortions that should be corrected by the orthorectification process, but sometimes they are not.
Another common data is the modifiable area problem. If you are using data that has been produced as a thematic map, it is open to this type of error. For example, the Borough of State College votes as a quite liberal place, Centre County, is slightly conservative, the Center Region is strongly conservative, and the State is equally divided. Now how would you describe a voter from Penn State? It depends on the scale that you are using to look. Unless you asked the voter directly, there is no way to know if your generalization will be correct. On average it would be correct for each scale of the investigation but not at the level of the individual. This problem is general in combining data at different scales or in using data sampled or gathered at one scale to make generalizations about another scale.
The problems of attribute comparability cannot be overcome unless there are excellent data definitions stored in a thorough data dictionary. One person's major highway is a minor road elsewhere. Just being aware of these problems and making sure you consult the metadata, data dictionaries, and documentation when you acquire data helps a lot to overcome these sources of error. The other thing is to document your own actions so that people can judge if they like what you have done, or at least understand it.
Data mis-match caused by missing or erroneous metadata, datum, or projection files is very common. Esri has recognized this and produced a very comprehensive book, that I whole-heartedly recommend:
Lining Up Data in ArcGIS: a Guide to Map Projections by Margaret M. Maher, Esri Press 2010. [4]
Let us conduct a thought experiment. It is common to have at least one case where downloaded data do not align. What to do?
First, look at the metadata. Unfortunately, sometimes the metadata had an error and gave the wrong projection parameters, e.g. the UTM zone did not line up with the reference longitude. This happens where people copy metadata from one layer to the next but forget to update the parts that change. The ArcHelp can be very useful for projection difficulties; try starting with: Projection basics for GIS professionals [5].
I am sure you will encounter similar problems frequently. In this case of an erroneous UTM, looking at the UTM zones [6] will help you narrow it down. You can also use the links for data where you have unknown projections Identifying an unknown coordinate system [7].
This is a case where Metadata is vital to understanding your data.
We can set a DRG of the area as a reference for data that is unknown projection. In this case, where UTM is wrongly specified, you need to pick the nearest Albers. You know it is the lower 48, so it will be one of the contiguous choices. When you select that, you will see that the projection reference parameters are different. Click modify and go in and alter these just as they are in the metadata; you will need to set the datum to NAD27 in a separate modify window at the bottom of the first. Add the map to ArcGIS and verify that it is at the coordinates you expect.
You can try adding other data to clarify which data is correct. Try adding a DRG to this area, add that, and see if that helps you see what is correct. Shape files are often digitized from standard USGS maps. This does not mean that the shapefile is correct. Cartographers often move things to make the map more easy to read. The spatial topological relationships are mostly preserved, but the location coordinates are not. An ortho-image should be correct but may not be, as there can be considerable distortion from the lens or from hilly terrain, and these distortions are not always fully corrected in the ortho-rectifying process. If in this case the error still looks too large for it to be caused by poor rectification, you could try getting a free satellite image; a mosaic for the area is sometimes best and is free on the web. Satellite images are mostly less error prone due to the extensive processing they receive before they are released.
If all these moves fail and you are near enough to use a GPS. You need to ground truth the image. The amount of correction will be restricted to the accuracy of the GPS. Find a prominent thing that is static and permanent River bends are not good enough, but a building is unless the map is very old. Get the GPS coordinates for a number of places covering the middle and edges of the area of interest. Load these into ARCGIS and see if they align. If the shape file aligns, then it is correct. If the image aligns, that is correct. You now need to spatially adjust the one that is wrong. This process of putting control points on one layer to where they need to move on the other layer, for images this geo-referencing for shapes spatial adjusting. It is virtually the same process; look at Spatial Adjustment [8]. Finally, make sure you cover the whole process of corrections and transformations in your own metadata so that you cover yourself when the data is used.
Data Mismatch can be caused by projection problems, datum errors, scales differences, errors, temporal mismatch, or distortion in sources like non-orthographic aerial photography. The first two are the most common and are possible to fix; the others are much more difficult.
The last set of problems to consider is timeliness and data editing. In the SCWB data it will be in a constant state of flux. Almost from the time a map is made, it will be out of date due to ongoing maintenance, new construction, and changes by third parties. Sometimes the data is checked out for editing; other times on larger systems it can be edited concurrently. This causes a big problem. What happens to this kind of data when you download it? How often should you down load it? Should you only connect to the data in a mash up type of approach and down load the data only on the fly? There is no simple answer to the problem. But again, being aware of the problem is half the battle. Just be explicit in what you are doing to obtain the data.
Supposing you are using data from another source. Do you reproject it on receipt or use ArcGIS to do that on the fly? As you can see from above, it is important that it be in a projection that is suitable for the analysis, if one is to be performed. If it is for display or location problems it is not so important, however, project-on-the-fly does take time. With FME you can reproject as you extract and load data. Finally, you must be aware of the fact that as good as reprojection algorithms are, they do not preserve the original accuracy. Remember in a new ArcMap data frame the first dataset added will set the projection for the data frame unless you go in and modify it.
Finally, when we download data we have to consider how we use it. There are often restrictions placed on the user of other people's data. Think of the list carried forward from downloading enumerated above in section A. What kind of disclaimers are listed at the sites you visited? Where would you have found these? They are only in the metadata. Is free data less reliable or more reliable? If you are paying for data the person supplying it has a commercial duty to ensure it is fit for the purpose for which it is supplied. But often in downloading data they do not have any knowledge of what it is to be used for, so the liability often resides not with the provider but with the end user. Very frequently data is supplied that cannot be republished, there are no exact guidelines on how different it has to be so that it cannot be reverse engineered. Even if the data were modified so that it passes a legal test of use, is it ethical.
All GIS professionals have strict guidelines on how they treat data. Today the software industry is much better at establishing licenses for their material and definitions of fair use, etc. The data suppliers are a long way behind in supplying these definitions. The courts are even further behind. Privacy is an important consideration. As for privacy issues I think that the following case is germane. In a battle of the titans, Gabrielle Adelman, a dot com billionaire who likes beaches, flying, and photography, has flown a mission along the California coast photographing the whole thing. Barbara Streisand sued for alleging an invasion of privacy, and attempting to profit from the use of her name. After a case involving several hundreds of thousands of dollars in court costs, the pictures were eventually left online [9]. In the supreme court, the right to privacy was found to be limited and not expansive. It is not specifically mentioned in the Bill of Rights. It can only be enforced in cases where upholding the right of privacy is specific to a person's well being. I believe that in the Streisand case it was said it threatened her well being by giving access to possible intruders. It was found that in such cases where the information can be freely discovered by public means that restricting one of them is not warranted. Aerial photography is not different from, say, driving there and walking around. Also, generally, people who put themselves in the public sphere have different rights and responsibilities than do the public.
It will be interesting to see how the right to free speech plays out when there are genuine terrorist implications.
Privacy can mean more than personal privacy; is it right to identify the nest sites of say the Condor on the web when this will lead to the disturbance or destruction of an endangered species?
Whatever it is you are working on, GIS always has ethical considerations. It has been argued that the process of making a map is an act of power. Map makers make it for their own uses; they choose the data, symbolizes it, and choose where and how it is published. These actions might not be in the best interest of another party who is represented on a map but might have no power over how they are represented.
This module is one week in length. Please refer to the course Calendar tab in ANGEL for the due date.
1. Readings:
Required:
Recommended:
2. Post a project write-up, including:
3. Discuss the weekly topic on the discussion forum.
4. Continue writing your course paper. It is due in two weeks.
5. Complete Quiz 1
You have just completed module 3.
Don't forget...if you have any questions, feel free to post them to the Lesson 3 Discussion Forum.
Links
[1] https://www.e-education.psu.edu/geog488/node/2072
[2] https://www.e-education.psu.edu/geog488/sites/www.e-education.psu.edu.geog488/files/image/montserrat_map.gif
[3] http://www.esri.com/news/arcnews/fall03articles/exploring-monteserrat.html
[4] http://www.esri.com/news/arcuser/0610/liningup.html
[5] http://help.arcgis.com/en/arcgisdesktop/10.0/help/index.html#/Projection_basics_for_GIS_professionals/003r00000002000000/
[6] http://www.dmap.co.uk/utmworld.htm
[7] http://help.arcgis.com/en/arcgisdesktop/10.0/help/index.html#//003r00000004000000.htm
[8] http://help.arcgis.com/en/arcgisdesktop/10.0/help/index.html#//001t000000v3000000.htm
[9] http://www.californiacoastline.org/streisand/pressrelease-decision.html
[10] http://www.gisci.org/code_of_ethics.aspx
[11] http://www.newscientist.com/article/mg20727670.900-virtual-prisons-how-emaps-are-curtailing-our-freedom.html?full=true
[12] https://cms.psu.edu/section/default.asp?id=201112SPWD%5F%5F%5FIGEOG%5F488%5F001
[13] http://www.ucgis.org/priorities/research/2002researchPDF/shortterm/c_social_implications.pdf
[14] http://www.spatial.maine.edu/~onsrud/pubs/liability40.pdf
[15] http://www.urisa.org/files/vol5no2.pdf
[16] http://www.fgdc.gov/policyandplanning/Access%20Guidelines.pdf
[17] http://www.gisci.org/