It is time to apply what we learned about writing classes, inheritance, and polymorphism in a larger project. In this walkthrough we are going to build an application that processes GPS tracks of buses to detect certain events like a bus being stopped for more than a minute, two buses encountering each other along their routes, etc. Such an application might be used by a public transportation manager to optimize schedules or be warned about irregularities occurring in a real-time tracking data stream. In the walkthrough code, we will be defining classes for real-world objects from the domain like a class Bus, a class Depot, etc. and for abstract concepts like a GPS point with timestamp information and for the events we are looking for. The classes for the different event types we are interested in will be organized into a hierarchy like the geometry classes in section 4.9.
The data we will be using for this project comes from Ireland’s open data portal. The Dublin City Council has published bus GPS data across Dublin City for November 2012 and January 2013 in the form of daily .csv files that list GPS points for active bus vehicles in chronological order with timestamps measured in microseconds since January 1st, 1970. This is a common way of measuring time called Unix or Posix time. GPS measurements for an active vehicle appear in intervals of approximately 20 seconds in the data. The locations are given in WGS84 (EPSG:4326) latitude and longitude coordinates.
We extracted the bus data for 1.5 hours in the late evening of January 30 and morning of January 31, 2013 and cleaned it up a bit, filtering out some outliers and vehicles for which there were only a very small number of GPS points. We manually created a second input file with bounding box coordinates for a few bus depots in Dublin that we will need for detecting certain events and then combined the two input files with some other resources that we will need for this project and the actual source code consisting of several Python .py files. Please download the resulting .zip file and extract it into a new folder.
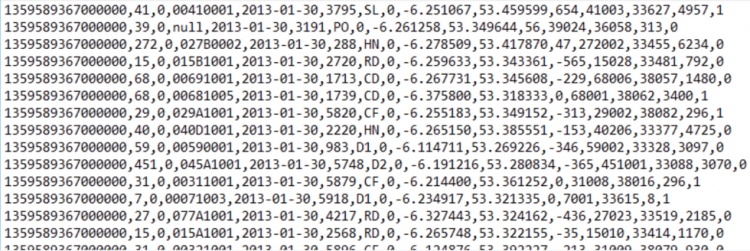
Have a quick look at the file dublin_bus_data.csv containing the bus GPS points. We are mainly interested in column 1 that contains the time information, column 6 that contains the ID of the bus vehicle, and columns 9 and 10 that contain the latitude and longitude coordinates. We will also use column 2 that contains the number of the line this bus belongs to, but only for information display.
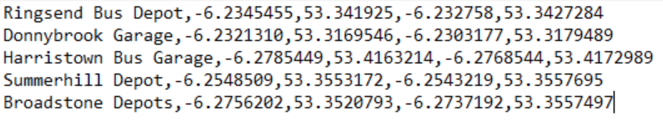
The file dublin_depots.csv contains the bus depot information with columns for the depot name and latitude-longitude pairs for the bottom left and top right corners of the bounding box as a rough approximation of the depot’s actual location and area.
In this walkthrough, we will focus on writing the code for the main classes needed for reading in the data, processing the data and detecting the events, and producing output vector data sets with the bus tracks and detected events. In addition, we will create a QT widget that displays the status of the different buses while the data is being processed. In the following optional part (Sections 4.11 and 4.12), we will further develop this project into a QGIS plugin that includes this widget and shows developing bus trajectories and detected events live as developing layers on the QGIS map canvas.