In this homework assignment, we want you to practice working with pandas and the other Python packages introduced in this lesson some more, and you are supposed to submit your solution as a nice-looking Jupyter Notebook including well-formatted explanations of each step. While the assignment could be solved using pandas, geopandas, and the Esri Python API alone, we are asking you to use GDAL/OGR for one of the steps involved so that you get some further practice with that library as well. To solve the task, you will occasionally have to use the packages in ways that we did not show in the lesson materials. In addition, you will have to work with the Python datetime module for representing dates & times in Python code. That means you will also have to practice working with the respective documentations and complementing web resources a bit. However, we did include some pointers in the instructions below, so that you have an idea of where to look, and also provided some examples.
The situation is the following: You have been hired by a company active in the northeast of the United States to analyze and produce different forms of summaries for the traveling activities of their traveling salespersons. Unfortunately, the way the company has been keeping track of the related information leaves a lot to be desired. The information is spread out over numerous .csv files. Please download the .zip file containing all (imaginary) data you need for this assignment and extract it to a new folder. Then open the files in a text editor and read the explanations below.
Explanation of the files:
File employees.csv: Most data files of the company do not use the names of their salespersons directly but instead refer to them through an employee ID. This file maps employee name to employee ID number. It has two columns, the first contains the full names in the format first name, last name and the second contains the ID number. The double quotes around the names are needed in the csv file to signal that this is the content of a single cell containing a comma rather than two cells separated by a comma.
"Smith, Richard",1234421
"Moore, Lisa",1231233
"Jones, Frank",2132222
"Brown, Justine",2132225
"Samulson, Roger",3981232
"Madison, Margaret",1876541
Files travel_???.csv: each of these files describes a single trip by a salesperson. The number in the file name is not the employee ID but a trip number. There are 75 such files with numbers from 1001 to 1075. Each file contains just a single row; here is the content of one of the files, the one named travel_1001.csv:
2132222,2016-01-07 16:00:00,2016-01-26 12:00:00,Cleveland;Bangor;Erie;Philadelphia;New York;Albany;Cleveland;Syracuse
The four columns (separated by comma) have the following content:
- the ID of the employee who did this trip (here: 2132222),
- the start date and time of the trip (here: 2016-01-07 16:00:00),
- the end date and time of the trip (here: 2016-01-26 12:00:00),
- and the route consisting of the names of the cities visited on the trip as a string separated by semi-colons (here: Cleveland;Bangor;Erie;Philadelphia;New York;Albany;Cleveland;Syracuse). Please note that the entire list of cities visited is just a single column in the csv file!
File ne_cities.shp: You already know this shapefile from the lesson content. It contains larger cities in the northeast U.S.A. as WGS84 points. The only attribute relevant for this exercise in addition to the point geometry is the NAME field containing the city names.
There are a few more files in the folder. They are actually empty but you are not allowed to delete these from the folder. This is to make sure that you have to be as specific as possible when using regular expressions for file names in your solution.
Your Task
The Python code you are supposed to write should take three things as input:
- a list of employee names (e.g., ['Jones, Frank', 'Brown, Justine', 'Samulson, Roger'] ),
- a start date (e.g., '2016-06-26'),
- and an end date as input (e.g., '2017-05-11').
It should then produce two output files:
- A new .csv file that lists the trips made by employees from the given employee name list that took place between the given start and end dates with all information from the respective travel_???.csv files as well as the name of the employee and the duration of each trip in days. The rows should be ordered by employee name -> trip duration -> start date -> end date. The figure below shows the exemplary content of this output file.
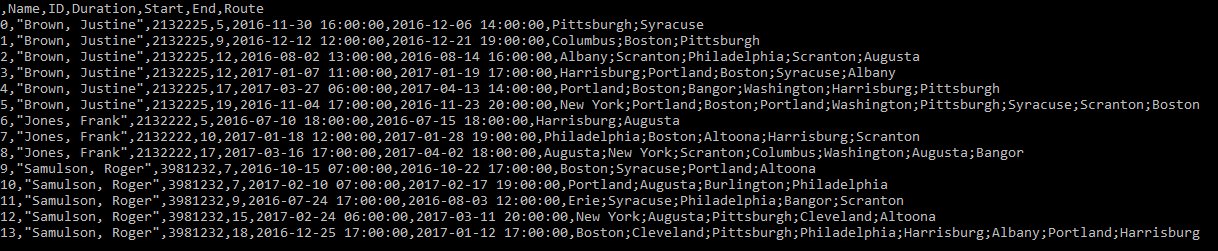 Example CSV Output File
 - A WGS1984 shapefile that shows the individual trips from the csv file created in (1) as polyline features. The attributes of the shapefile should be the name of the employee, the city list as a single string attribute, and the duration only. You will also have to zip this shapefile and upload & publish it as a feature service on ArcGIS Online.
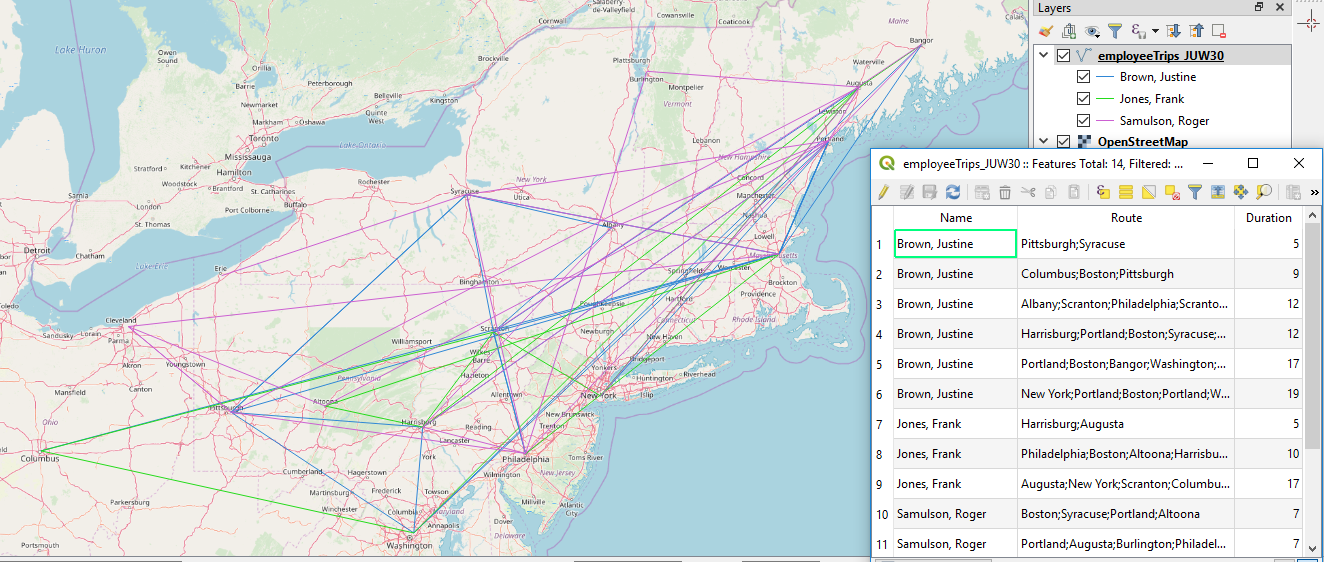 Example Output Shapefile Shown in QGIS
You should develop your solution as a Jupyter notebook with nicely formatted explanations of each step in your solution, similar to the L3 walkthrough notebook. Your notebook should at the end contain a map widget from the Esri Python API that displays the polyline feature service as a layer (similar to the lesson walkthrough notebook). You will submit this notebook file together with your write-up to the L3 assignment drop box on Canvas. The two images above have been produced using the example input values we gave above, so the name list 'Jones, Frank', 'Brown, Justine', and 'Samulson, Roger', the start date 2016-06-26, and the end date 2017-05-11. You can use this example for testing your solution.
Preparation
The assignment will require you to work with objects of the classes datetime and timedelta defined in the module datetime of the Python standard library to represent time stamps (combinations of date & time) and differences between them. The official documentation for the module is available at this Python documentation page. In addition, you can find two links to introductions to datetime below that may be a bit easier to digest. Please check these out and make sure you understand how to work with the datetime class, how to compare datetime objects to see whether one is earlier than the other and how to calculate a timedelta object for the difference between two datetime objects. Time zones won’t matter in this assignment.
- Python DateTime, TimeDelta, Strftime (Format) with Examples
- Working with datetime objects and timezones in Python
Below are a few examples illustrating how to create datetime objects representing concrete dates, how to calculate the time difference (datetime object timedelta) between two datetime objects, and how to compare two datetime objects using the < or > operators. These examples should be easy to understand, in particular when you have read through the documentation linked above. If you have any remaining questions on using datetime, please ask them on the course forums.
import datetime

# create datetime objects for specific dates
date1 = datetime.datetime(2019, 1, 31, 17, 55)  # create datetime object for January 31, 2019, 17:55pm
date2 = datetime.datetime(2019, 3, 12, 0, 0)    # create datetime object for March 12, 2019, 0am
print(date1)
print(type(date1))
print(date2)
Output:
2019-01-31 17:55:00
<class 'datetime.datetime'>
2019-03-12 00:00:00
# calculate the time difference between two datetime objects
delta = date2 - date1
print(delta)
print(type(delta))
print(delta.days)     # difference in days
print(delta.seconds)  # difference in seconds
Output:
39 days, 6:05:00
<class 'datetime.timedelta'>
39
21900
# comparing datetime objects
if (date2 < date1):
    print('before')
else:
    print('after')
Output:
after
Steps in Detail:
Your notebook should roughly follow the steps below; in particular you should use the APIs mentioned for performing each of the steps:
- The input variables defined at the beginning of your notebook should include
- the list of employee names to include in the output
- the start date and end dates as datetime.datetime objects
- the folder that contains the input files
- the name of the output shapefile (include your initials or ID in the name to make the name unique for uploading it to AGOL)
- the name of the output csv file
- Use pandas (Section 3.8) to read the data from employees.csv into a data frame (see Hint 1).
- Use pandas to create a single data frame with the content from all 75 travel_???.csv files. The content from each file should form a row in the new data frame. The dates should be represented as datetime objects in the data frame (see Hints 1 and 2). Use regular expression and the functions from the re package for this step (Section 3.3) to only include files that start with "travel_", followed by a number, and ending in ".csv".
- Use pandas operations to join (see Section 3.8.5) the two data frames from steps (2) and (3) using the employee ID as key. Derive from this combined data frame a new data frame with
- only those rows that contain trips of employees from the input name list and with a start date after the given start date and an end date before the given end date (see Hint 3)
- an additional column that contains the duration of the trips in days (computed by subtracting start from end date)
- columns appearing in the order “Name”, “ID”, “Duration”, “Start”, “End”, and “Route” with these labels, and row labels being integer numbers 0,1,2,… (see image of example csv output file above)
- rows sorted by employees' names as the first criterion, followed by duration (meaning all trips for the same person are ordered from shortest to longest), start date, and end date as criteria.
- Write the data frame produced in the previous step to a new csv file using the specified output file name from (1) (see Hint 1 and image of example csv output file above).
- Use geopandas (Section 6.1 of the Juypter notebook from the lesson walkthrough) and its read_file(...) function to read the ne_cities.shp shapefile into a data frame. Reading a shapefile with the read_file(...) geopandas function is straightforward and you shouldn’t have any trouble finding some examples on the web. The result is a special geopandas data frame object that has a column called geometry which contains Shapely Point objects with WGS84 coordinates for the cities.
- Use GDAL/OGR (Section 3.9) to create a new shapefile with polyline features for each trip in the combined data frame from step (5) and attributes “Name” with the employee's name, “Route” with the city list for that trip, and “Duration” in days (see image of example output shapefile above). The polyline features need to be created from the city lists in the Route column and the point coordinates available in the geometry column of the ne_cities geopandas data frame produced in the previous step.
To create the new shapefile and populate it with features you can follow the general steps from creating the centroid buffer file in the last part of Section 3.9.1. The most tricky part will be to translate each trip into a WKT LineString that you then can create an OGR polyline feature from using the ogr.CreateGeometryFromWkt(...) function replacing the centroid and buffering part in the example from 3.9.1. Hint 4 shows how all the WKT LineStrings can be created to then be added as a new column to the combined data frame from step (5). This is done all in a single line with nested list comprehensions. If you feel very confident in your Python skills, you can try to write this code yourself (it doesn't necessarily have to be just a single line of code), else we recommend that you just use the code provided in the hint to do the translation. - Zip the shapefile produced in the previous step, then upload and publish it as a feature service on ArcGIS Online with the Esri API and include a map widget in your notebook showing the feature service as a layer (see Section 3.10 and the lesson walkthrough). You are allowed to reuse the code from the lesson walkthrough for this including the zipfile(...) function. Make sure that the name of the uploaded file is unique by incorporating your initials or ID).
Hint 1:
Pandas provides functions for reading and writing csv files (and quite a few other file formats). They are called read_csv(...) and to_csv(...). See this Pandas documentation site for more information and also the Python datetime documentation for datetime parsing specifics. When your input file contains dates that you want to become datetime objects, you should use the parse_dates and date_parser keyword arguments of read_csv(…) to let the method know which columns contain dates and how to interpret them (see the subsection on "Date Handling" on the page linked above). Here is an example of how this kind of command needs to look. The None for the header argument signals that the table in the csv file does not contain column names as the first row. The [...] for the parse_dates argument needs to be replaced by a list of column indices for the columns that contain dates in the csv file. The lambda function for the date_parser argument maps a date string we find in the input .csv file to a datetime object.
import pandas as pd
import datetime
df = pd.read_csv(r'C:\489\test.csv', sep=",", header=None, parse_dates=[...], date_parser= lambda x: datetime.datetime.strptime(x, '%Y-%m-%d %H:%M:%S'))
Hint 2:
The pandas concat(…) function can be used to combine several data frames with the same columns stored in a list to form a single data frame. This can be a good approach for this step. Let's say you have the individual data frames stored in a list variable called dataframes. You'd then simply call concat like this:
combinedDataFrame = pd.concat(dataframes)
This means your main task will be to create the list of pandas data frames, one for each travel_???.csv file before calling concat(...). For this, you will first need to use a regular expression to filter the list of all files in the input folder you get from calling os.listdir(inputFolder) to only the travel_???.csv files and then use read_csv(...) as described under Hint 1 to create a pandas DataFrame object from the csv file and add this to the data frame list.
Hint 3:
You can compare a datetime object (e.g. the start or end date) to a datetime column in a pandas data frame resulting in a Boolean vector that tells you whether the comparison is true or not for each row. Furthermore, you can use the pandas method isin(…) to check whether the string in the cells of a data frame or single column are contained in a given list of strings. The result is again a Boolean data frame/column. Together this allows you to select the desired rows via Boolean indexing as shown in Section 3.8.6. Here is a simple example showing how isin(...) is used to create a Boolean vector based on whether or not the name of each row is from a given list of names:
import pandas as pd
names = ['Frank', 'James', 'Jane', 'Stevie']    # names we are interested in
df = pd.DataFrame([['Martin', 5],               # simple data frame with two columns
                   ['James', 3],
                   ['Sue', 1],
                   ['Mark', 11],
                   ['Stevie',3 ]] , columns=['Name', 'Grade'])
booleanVector = df.Name.isin(names)
print(booleanVector)
Output:
0    False
1     True
2    False
3    False
4     True
Name: Name, dtype: bool
Hint 4:
The GDAL cookbook contains several examples of creating a polyline geometry from a WKT LineString that should be helpful to implement this step. In principle, the entire translation of the semi-colon-separated city list into a WKT LineString can be done with the following expression using two nested list comprehensions, but it is also ok if you break this down into several steps.
wkt = [ 'LineString (' + ','.join([ '{0} {1}'.format(cities[cities.NAME == city].geometry.x.iloc[0], cities[cities.NAME == city].geometry.y.iloc[0]) for city in r.split(';') ])+')' for r in fullInfoSorted.Route]
This code assumes that the geopandas data frame with the city data is stored in variable cities and that the combined trip data from step (5) is stored in variable fullInfoSorted such that fullInfoSorted.Route refers to the column with the route information consisting of city names separated by semicolons. In the outer list comprehension, we have variable r go through the cells (= rows) in the Route column. In the inner list comprehension
[ '{0} {1}'.format(cities[cities.NAME == city].geometry.x.iloc[0], cities[cities.NAME == city].geometry.y.iloc[0]) for city in r.split(';') ]
we then split the cell content at all semicolons with r.split(';') and have variable city go through all the cities in the given route. With the expression cities[cities.Name == city] we get the row for the given city from the cities data frame and, by appending .geometry.x.iloc[0] or .geometry.y.iloc[0], we get the corresponding x and y coordinates from the content of the geometry column of that row. The result of this inner list comprehension is a list of strings in which the x and y coordinates for each city are separated by a space, e.g. ['cx1 cy1', 'cx2 cy2', ... 'cxn cyx'] where cxi / cyi stands for the x/y coordinate of the i-th city in the trip. By using 'LineString (' + ','.join(...) + ')' in the outer list comprehension, we turn this list into a single string separated by comma, so 'cx1 cy1,cx2 cy2,...,cxn cyx' and add the prefix "LineString (" at the beginning and the closing ")" at the end producing the WKT string expression "LineString (cx1 cy1,cx2 cy2,...,cxn cyx)" for each trip. The resulting list of WKT LineStrings in variable wkt can now be added as a new column to the fullInfoSorted data frame as a basis for creating the GDAL features for the new shapefile by using ogr.CreateGeometryFromWkt(...) for each individual WKT LineString.
Grading Criteria
The criteria your notebook submission will be graded on will include how elegant and efficient your code is (e.g. try to make use of regular expressions and use list comprehension instead of for-loops where a simple list comprehension is sufficient) and how well your notebook documents and describes your solution in a visually appealing way.
Successful completion of the above requirements and the write-up discussed below is sufficient to earn 90% of the credit on this project. The remaining 10% is reserved for "over and above" efforts which could include, but are not limited to, the following:
- increase the flexibility of the notebook (e.g. allow for specifying a minimum and maximum duration for the trips that should be included),
- extend your solution to perform other analyses of the data (e.g. compute some statistics) using pandas as much as possible and writing the results to suitable output files,
- use GDAL or the ESRI Python API to incorporate some GIS analysis of the data or produce shapefiles that show the data in a different way (e.g. all cities visited by each of the employees from the list as individual point shapefiles).
Write-up
Produce a 400-word write-up on how the assignment went for you; reflect on and briefly discuss the issues and challenges you encountered and what you learned from the assignment. Please also briefly mention what you did for "over and above" points in the write-up.
Deliverable
Submit a single .zip file to the corresponding drop box on Canvas; the zip file should contain:
- Your Jupyter notebook file
- Your 400-word write-up