4.12 Optional: Turning the Bus Event Analyzer into a QGIS Plugin
As said at the beginning of Section 4.11, this section about turning the Bus Track Analyzer code into a plugin that adds new layers to the current QGIS project and displays the analysis progress live on the map canvas can be considered optional. Feel free to just briefly skim through it and then watch the video from Section 4.12.7 showing the final Bus Track Analyzer for QGIS plugin. While creating a QGIS plugin yourself is one option that would give you full over&above points in this lesson's homework assignment, the content of these two sections is not required for the assignment and the quiz. You can always come back to this section if you have time left at the end of this lesson or after the end of the class.
Now that you know how to create plugins for QGIS, let us apply this new knowledge to create a QGIS plugin version of our bus event analyzer from Section 4.10. We will call this plugin “Bus Track Analyzer for QGIS”. The process for this will be roughly as follows:
- Set up a new plugin with Plugin Builder using the Tool “button with dock widget” template
- Copy all the needed files from the project into the plugin folder
- Adapt the default GUI for the dock widget with QT Designer
- Make some smaller modifications to the project files including changes to class BusTrackAnalyzer to define QT signals that we can connect to
- Adapt the code in the dock widget class definition to wire up the GUI and to implement a modified version of the functionality we had in the main program in main.py of the Bus Track Analyzer project
- Implement and integrate a new class QGISEventAndTrackLayerCreator that will be responsible for showing the bus tracks and events detected so far in the QGIS main map window during the analysis
4.12.1 Create Template with Plugin Builder
To create a folder with a template version for this plugin, please follow the steps below.
- Run the Plugin Builder plugin and fill out the first page as follows before clicking “Next >”:
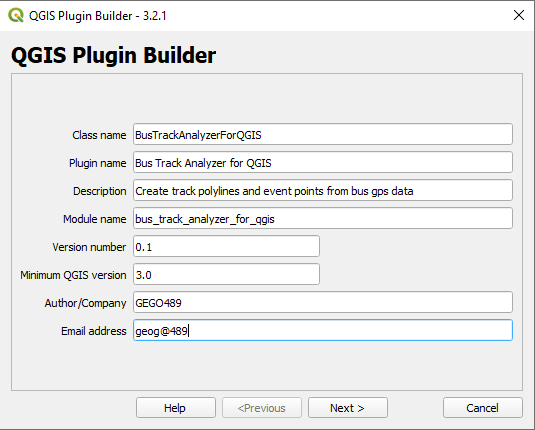 Figure 4.40 First Plugin Builder dialog page with information about the new plugin
 - Just click “Next >” again as we will skip the description part and then on the next page pick the “Tool button with dock widget” template at the top and fill out the rest of the information as shown below before pressing “Next >” again.
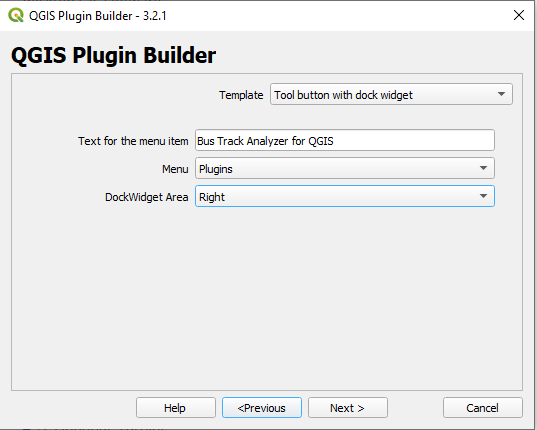 Figure 4.41 Picking the "Tool button with dock widget" template in Plugin Builder
 - We will keep the default settings for the following setup pages, so just keep pressing “Next >” until you arrive at the last page where the button is called “Generate” instead. Take a look at the paths where Plugin Builder is going to create the folder for the new plugin. It might be a good idea to copy the path to somewhere from which you can retrieve it at any time. Now click on “Generate” and the folder for the plugin will be created.
- If you now navigate to the plugins folder from the previous step, it will contain a new folder called “bus_track_analyzer_for_qgis”. Enter that folder and check out the files that have been created. The content should look like this:
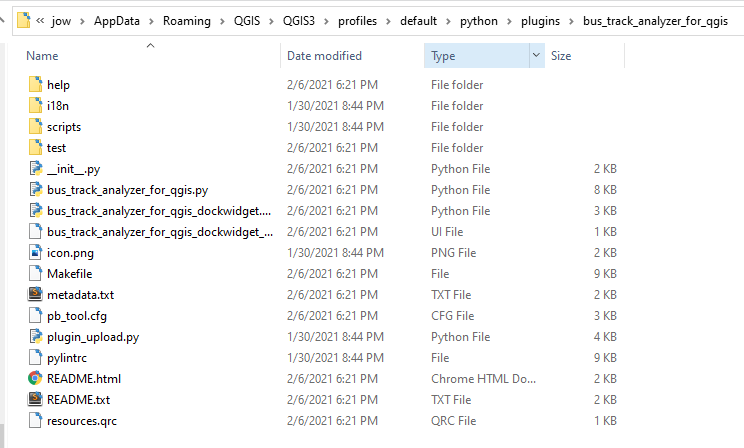 Figure 4.42 Newly created plugin folder with files for our plugin
 - Please close QGIS for a moment. We still need to compile the file resources.qrc into a Python .py file with the help of pyrcc5 as we did in Section 4.11. For this, run OSGeo4W.bat from your OSGeo4W/QGIS installation and, in the shell that opens up, navigate to the folder containing your plugin, e.g. type in the following command but adapt the path to match the path from steps 3 and 4:
cd C:\Users\xyz\AppData\roaming\QGIS\QGIS3\profiles\default\python\plugins\bus_track_analyzer_for_qgis
- Finally, compile the file with the command below. There should now be a file called resources.py in your plugin folder.
pyrcc5 resources.qrc –o resources.py
- You can now restart QGIS and open the plugin manager where “Bus Track Analyzer for QGIS” should now appear in the list of installed plugins. Enable it and then check the Plugins menu to make sure there is now an entry “Bus Track Analyzer for QGIS” there. Start the plugin and a rather empty dock widget will appear in the right part of the QGIS window. Try moving this dock widget around. You will see that you can move it to the other areas of the main QGIS window or completely undock it and have it as an independent window on the screen.
4.12.2 Copy Files into Plugin Folder
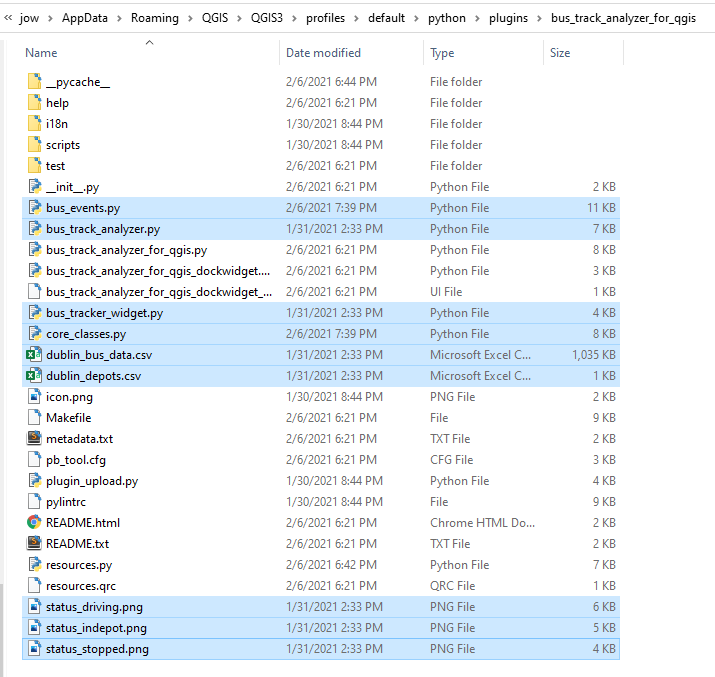
For the next steps, it’s best if you again close QGIS for a bit. In case you made any changes to the files during the bus tracking project in Section 4.10, it would be best if you re-download them from here [1]. Then copy the following files from the Section 4.10 project folder (if you didn't edit anything) or the fresh download into the folder for the Bus Tracker plugin:
bus_events.py
bus_track_analyzer.py
bus_tracker_widget.py
core_classes.py
dublin_bus_data.csv
dublin_depots.csv
status_driving.png
status_indepot.png
status_stopped.png
Please note that we are intentionally not including main.py. Also, it wouldn’t really be necessary to include the input data sets (csv files), but there is also no harm in doing so, and it means that we have everything needed to create and run the plugin together in the same folder.
4.12.3 Adapt the GUI with QT Designer
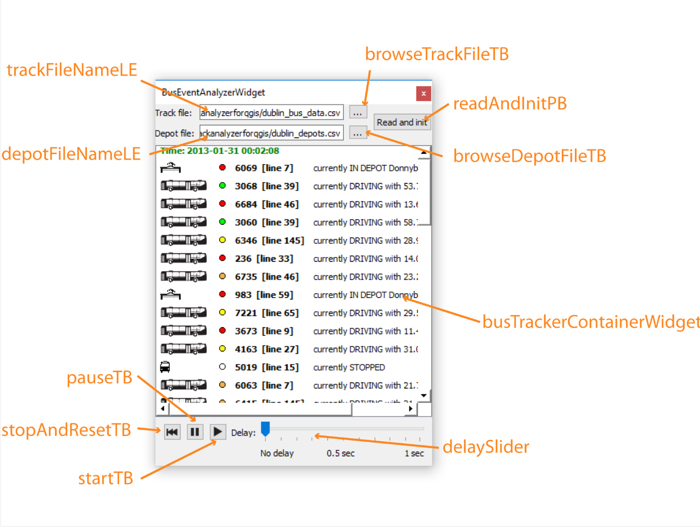
The GUI we will be using for our dock widget is shown in the image below. It has an area at the top where the user can select the GPS and depot input files and a button “Read and init” for reading in the data from the selected files. The central area contains a QScrollArea widget that will host our BusTrackerWidget in the same way as we had it embedded into the main window in the original project. In the area at the bottom, we have the controls for running the analysis consisting of three buttons “Stop and reset”, “Pause”, and “Start” and a QSlider widget for setting the delay between consecutive analysis steps. The image also shows the object names of the important GUI elements that will become instance variables of class BusTrackAnalyzerForQGISDockWidget that we can access and connect to.
If you look at the files in the folder for our plugin, you will see that Plugin Builder has created a file called bus_track_analyzer_for_qgis_dockwidget.py. This file contains the definition of class BusTrackAnalyzerForQGISDockWidget derived from QDockWidget with the GUI for our plugin. The class itself directly reads the GUI specification from the file bus_track_analyzer_for_qgis_dockwidget_base.ui as explained in Section 4.11.
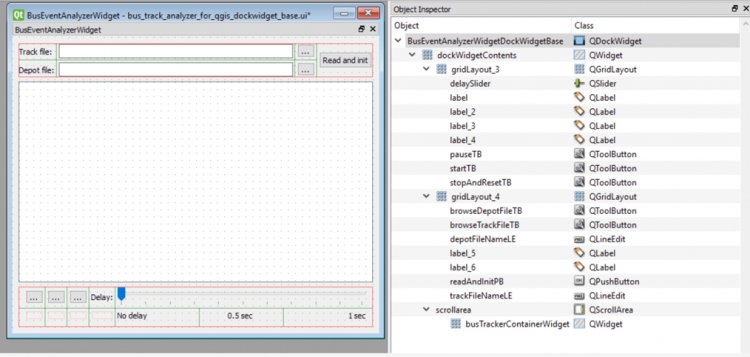
So the next thing we are going to do is open that .ui file in QT Designer and modify it so that we get the GUI shown in the previous image. The image below shows the new GUI and its widget hierarchy in QT Designer. You don’t have to create this yourself. It is okay if you download the resulting .ui file [2] and extract it into the plugin folder overwriting the default file that is already there (you might need to rename the downloaded file to match the default file). Then open the .ui file in QT Designer for a moment and have a closer look at how the different widgets have been arranged.
4.12.4 Modifications to the Original Project Files
The next thing we are going to do is make a few smaller changes to the files we copied over from the original project. First of all, it is unfortunately required that we adapt all import statements in which we are importing .py files located in the project folder. The reason is that when we write something like
from core_classes import BusTracker
, this will work fine when the file core_classes.py is located in the current working directory when the program is executed. This is usually the same folder in which the main Python script is located. Therefore, we didn’t have any problems when executing main.py since main.py and the other .py files we wrote are all in the same directory. However, when being run as a QGIS plugin, the working directory will not be the folder containing the plugin code. As a result, you will get error messages when trying to import the other .py files like this. What we have to do is adapt the import statements to start with a dot which tells Python to look for the file in the same folder in which the file in which the import statement appears is located. So the previous example needs to become:
from .core_classes import BusTracker
Here is quick overview of where we have to make these changes:
- In bus_events.py change the import statement at the beginning to:
from .core_classes import Depot, BusTracker
- In bus_track_analyzer.py change the two import statement at the beginning to:
from .bus_events import BusEvent
from .core_classes import BusTracker, Observation, Depot
- Lastly, in bus_tracker_widget.py change the import statement at the beginning to:
from .core_classes import BusTracker
In addition to adapting the import statement, we are going to slightly adapt the bus_track_analyzer.py code to better work in concert with the GUI related classes of our plugin code: we are going to add the functionality to emit signals that we can connect to using the QT signal-slot approach. The two signals we are going to add are the following:
- observationProcessed: This signal will be emitted at the end of the nextStep() method, so whenever the BusTrackAnalyzer object is done with processing one observation, the observation object that has just been processed will be included with the signal.
- eventDetected: This signal will be emitted for each new event that is added to the allEvents list. The emitted signal includes the new bus event object.
Both signals will be used to connect an object of a new class we are going to write in Section 4.12.6 that has the purpose of showing the developing bus tracks and detected events live in QGIS. For this, it is required that the object be informed about newly processed observations and newly detected events, and this is what we are going to facilitate with these signals. Luckily, adding these signals to bus_track_analyzer.py just requires you to make a few small changes:
- Add the following PyQt5 import statement somewhere before the line that starts the class definition with “class BusTrackAnalyzer …”:
from PyQt5.QtCore import QObject, pyqtSignal
- To be able to emit signals we need the class BusTrackerAnalyzer to be derived from the QT class QObject we are importing with the newly added import statement. Therefore, please change the first line of the class definition to:
class BusTrackAnalyzer(QObject):
- Then directly before the start of the constructor with “def __init__...", add the following two lines indented relative to the “class BusTrackAnalyzer…” but not part of any method:
observationProcessed = pyqtSignal(Observation)
eventDetected = pyqtSignal(BusEvent)
With these two lines we are defining the two signals that can be emitted by this class and the types of the parameters they will include.
- Since we are now deriving BusTrackAnalyzer from QObject, we should call the constructor of the base class QObject from the first line of our __init__(…) method. So please add the following line there:
super(BusTrackAnalyzer, self).__init__()
- The last two changes we need to make are both in the definition of the nextStep() method. We therefore show the entire new version of that method here:
  def nextStep(self):
         """performs next step by processing Observation at the front of the Observations priority queue"""
         observation = heapq.heappop(self._observationQueue)           # get Observation that is at front of queue

         # go through list of BusEvent subclasses and invoke their detect() method; then collect the events produced
         # and add them to the allEvents lists
         for evClass in self._eventClasses:
             eventsProduced = evClass.detect(observation, self._depotData, self.allBusTrackers) # invoke event detection method
             self.allEvents.extend(eventsProduced)  # add resulting events to event list
             for event in eventsProduced:
                 self.eventDetected.emit(event)

         # update BusTracker of Observation that was just processed
         observation.busTracker.lastProcessedIndex += 1
         observation.busTracker.updateSpeed()

         if observation.busTracker.status == BusTracker.STATUS_STOPPED: # if  duration of a stopped event has just expired, change status to "DRIVING"
             if observation.timepoint.time > observation.busTracker.statusEvent.timepoint.time + observation.busTracker.statusEvent.duration:
		        observation.busTracker.status = BusTracker.STATUS_DRIVING
                observation.busTracker.statusEvent = None

         # if this was not the last GPS Timepoint of this bus, create new Observation for the next point and add it to the Observation queue
         if observation.timepointIndex < len(observation.busTracker.bus.timepoints) - 1:  # not last point
             heapq.heappush(self._observationQueue, Observation(observation.busTracker, observation.timepointIndex + 1)  )

         # update analyzer status
         self.lastProcessedTimepoint = observation.timepoint

         self.observationProcessed.emit(observation)
In lines 10 and 11 of this new version we added a for-loop that goes through the events produced by the previous call of detect(…) and emit an eventDetected signal for each using the bus event object as a parameter. In the last line of the method, we do the same with the observationProcessed signal including the just processed Observation object.
4.12.5 Implement Main Functionality in BusTrackAnalyzerForQGISDockWidget class
At this point, our plugin is still missing the code that ties everything together, that is, the code that reads in the data from the input files when the “Read and init” button is clicked and reacts to the control buttons at the bottom of the BusTrackAnalyzerForQGISDockWidget widget by starting to continuously call the analyzer’s nextStep() method, pausing that process, or completely resetting the analysis to start from the beginning. We are going to place the code for this directly in the definition of class BusTrackAnalyzerForQGISDockWidget in bus_track_analyzer_for_qgis_dockwidget.py, so you should open that file for editing now. Here is the code that needs to be added, together with some explanations.
- First, we need to important quite a few classes from our own .py files and also a few additional PyQt5 classes; so please change the import statements at the beginning of the code to the following:
import os

from PyQt5 import QtGui, QtWidgets, uic
from PyQt5.QtCore import pyqtSignal, QTimer, QCoreApplication

# added imports
from .bus_track_analyzer import BusTrackAnalyzer
from .bus_tracker_widget import BusTrackerWidget
#from .qgis_event_and_track_layer_creator import QGISEventAndTrackLayerCreator
from .core_classes import Bus, Depot
from .bus_events import LeavingDepotEvent, EnteringDepotEvent, BusStoppedEvent, BusEncounterEvent
Note that we again have to use the notation with the dot at the beginning of the module names here. Also, please note that there is one import statement that is still commented out because it is for a class that we have not yet written. That will happen a bit later in Section 4.12.6 and we will then uncomment this line.
-
Next, we are going to add some initialization code to the constructor, directly after the last line of the __init__(…) method saying “self.setupUi(self)”:
         # own code added to template file

         self.running = False # True if currently running analysis
         self.delay = 0       # delay between steps in milliseconds

         self.eventClasses = [ LeavingDepotEvent, EnteringDepotEvent, BusStoppedEvent, BusEncounterEvent ] # list of event classes to detect
         self.busFileColumnIndices = { 'lon': 8, 'lat': 9, 'busId': 5, 'time': 0, 'line': 1 } # dictionary of column indices for required info

         # create initial BusTrackAnalyzer and BusTrackerWidget objects, and add the later to the scroll area of this widget
         self.analyzer = BusTrackAnalyzer({}, [], self.eventClasses)
         self.trackerWidget = BusTrackerWidget(self.analyzer)
         self.busTrackerContainerWidget.layout().addWidget(self.trackerWidget,0,0)
         self.layerCreator = None    # QGISEventAndTrackLayerCreator object, will only be initialized when input files are read

         # create a QTimer user to wait some time between steps
         self.timer = QTimer()
         self.timer.setSingleShot(True)
         self.timer.timeout.connect(self.step)

         # set icons for play control buttons
         self.startTB.setIcon(QCoreApplication.instance().style().standardIcon(QtWidgets.QStyle.SP_MediaPlay))
         self.pauseTB.setIcon(QCoreApplication.instance().style().standardIcon(QtWidgets.QStyle.SP_MediaPause))
         self.stopAndResetTB.setIcon(QCoreApplication.instance().style().standardIcon(QtWidgets.QStyle.SP_MediaSkipBackward))

         # connect play control buttons and slide to respetive methods defined below
         self.startTB.clicked.connect(self.start)
         self.pauseTB.clicked.connect(self.stop)
         self.stopAndResetTB.clicked.connect(self.reset)
         self.delaySlider.valueChanged.connect(self.setDelay)

         # connect edit fields and buttons for selecting input files to respetive methods defined below
         self.browseTrackFileTB.clicked.connect(self.selectTrackFile)
         self.browseDepotFileTB.clicked.connect(self.selectDepotFile)
         self.readAndInitPB.clicked.connect(self.readData)
What happens in this piece of code is the following:
- First, we introduce some new instance variables for this class that are needed for reading data and setting up a BusTrackAnalyzer object (you probably recognize the variables eventClasses and busFileColumnIndices from the original main.py file) and for controlling the analysis steps. Variable running will be set to True when the analyzer’s nextStep() method is supposed to be called continuously with small delays between the steps whose length is given by variable delay. It is certainly not optimal that the column indices for the GPS data file are hard-coded here in variable busFileColumnIndices but we decided against including an option for the user to specify these in this version to keep the GUI and code as simple as possible.
- In the next block of code, we create an instance variable to store the BusTrackAnalyzer object we will be using, and we create the BusTrackerWidget widget and place it within the scroll area in the center of the GUI. Since we have not read any input data yet, we are using an empty bus dictionary and empty depot list to set these things up.
- An instance variable for a QTimer object is created that will be used to queue up the execution of the method step() defined later when the widget is in continuous execution mode.
- The next code block simply sets the icons for the different control buttons at the bottom of the widget using standard QT icons.
- Next, we connect the “clicked” signals of the different control buttons to different methods of the class that are supposed to react to these signals. We do the same for the “valueChanged” signal of the QSlider widget in our GUI to be able to adapt the value of the variable delay when the slider is moved by the user.
- Finally, we link the three buttons at the top of the GUI for reading in the data to the respective event handler methods.
-
Now the last thing that needs to happen is adding the different event handler methods we have already been referring to in the previously added code. This is another larger chunk of code since there are quite a few methods to define. Please add the definitions at the end of the file after the definition of the method closeEvent(…) that is already there by default.
     # own methods added to template file

     def selectTrackFile(self):
         """displays open file dialog to select bus track input file"""
         fileName, _ = QtWidgets.QFileDialog.getOpenFileName(self,"Select CSV file with bus track data", "","(*.*)")
         if fileName:
             self.trackFileNameLE.setText(fileName)

     def selectDepotFile(self):
         """displays open file dialog to select depot input file"""
         fileName, _ = QtWidgets.QFileDialog.getOpenFileName(self,"Select CSV file with depot data", "","(*.*)")
         if fileName:
             self.depotFileNameLE.setText(fileName)

     def readData(self):
         """reads bus track and depot data from selected files and creates new analyzer and creates analyzer and layer creator for new input"""
         if self.running:
             self.stop()
         try:   # read data
             depotData = Depot.readFromCSV(self.depotFileNameLE.text())
             busData = Bus.readFromCSV(self.trackFileNameLE.text(), self.busFileColumnIndices)
         except Exception as e:
             QtWidgets.QMessageBox.information(self, 'Operation failed', 'Could not read data from files provided: '+ str(e.__class__) + ': ' + str(e), QtWidgets.QMessageBox.Ok)
             busData = {}
             depotData = []

         # create new analyzer and layer creator objects and connect them
         self.analyzer = BusTrackAnalyzer(busData, depotData, self.eventClasses)
         self.trackerWidget.analyzer = self.analyzer
#         self.createLayerCreator()
         self.trackerWidget.updateContent()

     def stop(self):
         """halts analysis but analysis can be continued from this point"""
         self.timer.stop()
         self.running = False

     def reset(self):
         """halts analysis and resets analyzer to start from the beginning"""
         self.stop()
         self.analyzer.reset()
#         self.createLayerCreator()
         self.trackerWidget.updateContent()

     def start(self):
         """starts analysis if analysis isn't already running"""
         if not self.running:
             self.running = True
             self.step()

     def step(self):
         """performs a single analysis step of the BusTrackAnalyzer but starts singleshot timer after each step to call itself again"""
         if self.running:
             if self.analyzer.isFinished():
                 self.stop()
             else:
                 self.analyzer.nextStep()               # perform next analysis step
                 self.trackerWidget.updateContent()     # redraw tracker widget
                 self.timer.start(max([5,self.delay])) # start timer to call this method again after delay

     def setDelay(self):
         """adapt delay when slider has been moved"""
         self.delay = 10 * self.delaySlider.value()
         if self.running:                           # if analysis is running, change to the new delay immediately
             self.timer.stop()
             self.timer.start(max([5,self.delay]))
The first two methods selectTrackFile() and selectDepotFile() are called when the “…” buttons at the top are clicked and will open file dialog boxes for picking the input files. The method readData() is invoked when the “Read and init” button is clicked. It stops all ongoing executions of the analyzer, attempts to read the data from the selected files, and then creates a new BusTrackAnalyzer object for this input data and connects it to the BusTrackerWidget in our GUI. The code of this function contains another two lines that are commented out and that we will uncomment later.
The other methods we define in this piece of code are the event handler functions for the control buttons at the bottom:
- stop() is called when the “Pause” button in the middle is clicked and simply stops the timer if its currently running and sets the variable running to False so that the analyzer’s nextStep() method won’t be called anymore.
- reset() is called when the control button on the left is called and it also stops the execution but, in addition, resets the analyzer so that the analysis will start from the beginning when the “Start” button is clicked again.
- start() is called when the right control button (“Play”) for continuously performing analysis steps is clicked. It sets variable running to True and then invokes method step() to run the first analysis step.
- step() is either called from start() or by the timer it sets up itself after each call of the analyzer’s nextStep() method to perform the next analysis step after a certain delay until all observations have been processed. Please note that we are using minimum delay of 5 milliseconds to make sure that the QGIS GUI remains responsive while we are running the analysis.
- setDelay() is called when the slider is moved and it translates the slider position into a delay value between 0 and 1 second. It also immediately restarts the timer to use this new delay value.
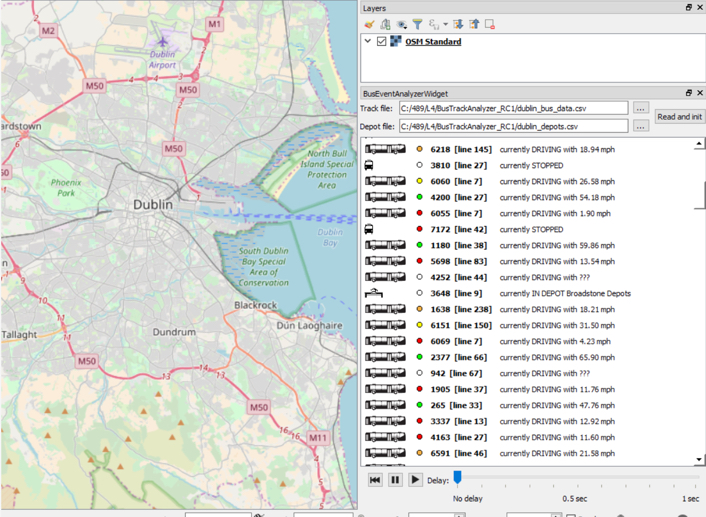
Our plugin is operational now and you can open QGIS and run it. In case you already have QGIS running or you encounter any errors that need to be fixed, don’t forget to reload the plugin code with the help of the Plugin Reloader plugin. Once the dock widget appears at the right side of the QGIS window (as shown in the figure below), do the following:
- Use the “…” buttons to select the input files for the bus GPS and depot data.
- Click “Read and init”; after that you should see the initial bus tracker configuration in the central area of the dock widget.
- Press the “Play” button to start the analysis; the content of the BusTrackerWidget should now continuously update to reflect the current state of the analysis
- Test out the “Pause” and “Rewind” buttons as well as changing the delay between steps with the slider to control the speed the analysis is run at.
So far, so good. We have now turned our original standalone project into a QGIS plugin and even added in some extra functionality allowing the user to pause and restart the analysis and control the speed. However, typically a QGIS plugin in some way interacts with the content of the project that is currently open in QGIS, for instance by taking some of its layers as input or adding new layers to the project. We will add this kind of functionality in the next section and this will be the final addition we are making to our plugin.
4.12.6 Create and Integrate New Class QGISEventAndTrackLayerCreator
In addition to showing the current bus tracker states in the dock widget, we want our plugin to add two new layers to the currently open QGIS project that show the progress of the analysis and, once the analysis is finished, contain its results. The two layers will correspond to the two output files we produced in the original project in Section 4.10:
- a polyline layer showing routes taken by the different bus vehicles with the bus IDs as attribute,
- a point layer showing the detected events with the type of the event and a short description as attributes.
Since we don’t want to just produce these layers at the end of the analysis but want these to be there from the start of the analysis and continuously update whenever a new bus GPS observation is processed or an event is detected, we are going to write some code that reacts to the observationProcessed and eventDetected signals emitted by our class BusTrackAnalyzer (see the part of Section 4.12.4 where we added these signals). We will define a new class for all this that will be called QGISEventAndTrackLayerCreator and it will be defined in a new file qgis_event_and_track_layer_creator.py. The class definition consists of the constructor and two methods called addObservationToTrack(…) and addEvent(…) that will be connected to the corresponding signals of the analyzer.
Let’s start with the beginning of the class definition and the constructor. All following code needs to be placed in file qgis_event_and_track_layer_creator.py that you need to create in the plugin folder.
import qgis

class QGISEventAndTrackLayerCreator():

     def __init__(self):
         self._features = {}    # dictionary mapping bus id string to polyline feature in bus track layer
         self._pointLists = {}  # dictionary mapping bus id string to list of QgsPointXY objects for creating the poylines from

         # get project currently open in QGIS
         currentProject = qgis.core.QgsProject.instance()

         # create track layer and symbology, then add to current project
         self.trackLayer = qgis.core.QgsVectorLayer('LineString?crs=EPSG:4326&field=BUS_ID:integer', 'Bus tracks' , 'memory')
         self.trackProv = self.trackLayer.dataProvider()

         lineMeta = qgis.core.QgsApplication.symbolLayerRegistry().symbolLayerMetadata("SimpleLine")
         lineLayer = lineMeta.createSymbolLayer({'color': '0,0,0'})
         markerMeta = qgis.core.QgsApplication.symbolLayerRegistry().symbolLayerMetadata("MarkerLine")

         markerLayer = markerMeta.createSymbolLayer({'width': '0.26', 'color': '0,0,0', 'placement': 'lastvertex'})
         symbol = qgis.core.QgsSymbol.defaultSymbol(self.trackLayer.geometryType())
         symbol.deleteSymbolLayer(0)
         symbol.appendSymbolLayer(lineLayer)
         symbol.appendSymbolLayer(markerLayer)

         trackRenderer = qgis.core.QgsSingleSymbolRenderer(symbol)
         self.trackLayer.setRenderer(trackRenderer)

         currentProject.addMapLayer(self.trackLayer)

         # create event layer and symbology, then add to current project
         self.eventLayer = qgis.core.QgsVectorLayer('Point?crs=EPSG:4326&field=TYPE:string(50)&field=INFO:string(255)', 'Bus events' , 'memory')
         self.eventProv = self.eventLayer.dataProvider()

         colors = { "BusEncounterEvent": 'yellow', "BusStoppedEvent": 'orange', "EnteringDepotEvent": 'blue', "LeavingDepotEvent": 'green' }

         categories = []
         for ev in colors:
             categories.append( qgis.core.QgsRendererCategory( ev, qgis.core.QgsMarkerSymbol.createSimple({'name': 'square', 'size': '3.0', 'color': colors[ev]}), ev ))

         eventRenderer = qgis.core.QgsCategorizedSymbolRenderer("TYPE", categories)
         self.eventLayer.setRenderer(eventRenderer)

         currentProject.addMapLayer(self.eventLayer)
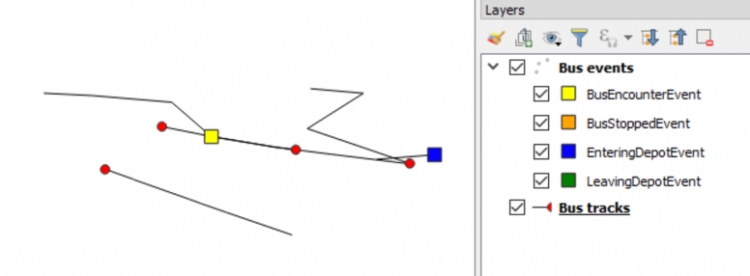
To be able to build polylines for the bus tracks and update these whenever a new observation has been processed by the analyzer, we need to maintain dictionaries with the QGIS features and point lists for each bus vehicle track. These are created at the beginning of the constructor code in lines 6 and 7. In addition, the constructor accesses the currently open QGIS project (line 10) and adds the two new layers called “Bus tracks” and “Bus events” to it (lines 29 and 44). The rest of the code is mainly for setting the symbology of these two layers: For the track layer, we use black lines with a red circle marker at the end to indicate the current location of the vehicle (lines 16 to 27) as shown in the image below. For the events, we use square markers in different colors based on the TYPE of the event (lines 35 to 42).
Now we are going to add the definition of the method addObservationToTrack(…) that will be connected to the observationProcessed signal emitted when the analyzer object has completed the execution of nextStep().
	def addObservationToTrack(self, observation):
         """add new vertex to a bus polyline based on the given Observation object"""
         busId = observation.busTracker.bus.busId;

         # create new point for this observation
         p =  qgis.core.QgsPointXY(observation.timepoint.lon, observation.timepoint.lat)

         # add point to point list and (re)create polyline geometry
         if busId in self._features:      # we already have a point list and polyline feature for this bus
             feat = self._features[busId]
             points = self._pointLists[busId]
             points.append(p)

             # recreate polyline geometry and replace in layer
             polyline = qgis.core.QgsGeometry.fromPolylineXY(points)
             self.trackProv.changeGeometryValues({feat.id(): polyline})

         else:                            # new bus id we haven't seen before
             # create new  polyline and feature
             polyline = qgis.core.QgsGeometry.fromPolylineXY([p])
             feat = qgis.core.QgsFeature()
             feat.setGeometry(polyline)
             feat.setAttributes([int(busId)])
             _, f = self.trackProv.addFeatures([feat])
             # store point list and polyline feature in respective dictionaries
             self._features[busId] = f[0]
             self._pointLists[busId] = [p]

         # force redraw of layer
         self.trackLayer.triggerRepaint()
         qgis.utils.iface.mapCanvas().refresh()
The Observation object given to this method as a parameter provides us with access to all the relevant information we need to update the polyline feature for the bus this observation is about. First, we extract the ID of the bus (line 3) and create a new QgsPointXY object from the Timepoint stored in the Observation object (line 6). If we already have a polyline feature for this vehicle, we get the corresponding feature and point lists from the features and pointLists dictionaries, add the new point to the point list and create a new polyline geometry from it, and finally change the geometry of that feature in the bus track layer to this new geometry (lines 10 to 16). If instead this is the first observation of this vehicle, we create a point list for it to be stored in the pointList dictionary as well as a new polyline geometry with just that single point, and we then set up a new QgsFeature object for this polyline that is added to the bus track layer and also the features dictionary (lines 19 to 27). At the very end of the method, we make sure that the layer is repainted in the QGIS map canvas.
Now we add the code for the addEvent(…) method completing the definition of our class QGISEventAndTrackLayerCreator:
		def addEvent(self, busEvent):
         	"""add new event point feature to event layer based on the given BusEvent object"""
            # create point feature with information from busEvent
            p =  qgis.core.QgsPointXY(busEvent.timepoint.lon, busEvent.timepoint.lat)
            feat = qgis.core.QgsFeature()
            feat.setGeometry(qgis.core.QgsGeometry.fromPointXY(p))
            feat.setAttributes([type(busEvent).__name__, busEvent.description()])

            # add feature to event layer and force redraw
            self.eventProv.addFeatures([feat])

            self.eventLayer.triggerRepaint()
            qgis.utils.iface.mapCanvas().refresh()
This method is much simpler because we don’t have to modify existing features in the layer but rather always add one new point feature to the event layer. All information required for this is taken from the bus event object given as a parameter: The coordinates for the next point feature are taken from the Timepoint stored in the event object (line 4), for the TYPE field of the event we take the type of the event object (line 7), and for the INFO field we take the string returned by calling the event object’s description(…) method (also line 7).
To incorporate this new class into our current plugin, we need to make a few more modifications to the class BusTrackAnalyzerForQGISDockWidget in file bus_track_analyzer_for_qgis_dock_widget.py. Here are the instructions for this:
- Remove the # at the beginning of the line “from .qgis_event_and_track_layer_creator import …” to uncomment this line and import our new class.
- Now we add a new auxiliary method to the class definition that has the purpose of creating an object of our new class BusTrackAnalyzerForQGISDockWidget and connecting its methods to the corresponding signals of the analyzer object. Add the following definition as the first method after the “closeEvent” method, so directly after the comment “# own methods added to the template file”.
	def createLayerCreator(self):
         """creates a new QGISEventAndTrackLayerCreator for showing events and tracks on main QGIS window and connects it to analyzer"""
         self.layerCreator = QGISEventAndTrackLayerCreator()
         self.analyzer.observationProcessed.connect(self.layerCreator.addObservationToTrack)
         self.analyzer.eventDetected.connect(self.layerCreator.addEvent)
We already set up an instance variable layerCreator in the constructor code and we are using it here for storing the newly created layer creator object. Then we connect the signals to the two methods of the layer creator object.
- Now we just need to uncomment two lines to make sure that the method createLayerCreator() is called at the right places, namely after we read in data from the input files and when the analyzer is reset. In both cases, we want to create a new layer creator object that will set up two new layers in the current QGIS project. The lines that you need to uncomment for this by removing the leading # are:
- the line “# self.createLayerCreator()” in method readData()
- the line “# self.createLayerCreator()” in method reset()
You should make sure that the indentation is correct after removing the hashmarks.
That’s it, we are done with the code for our plugin!
4.12.7 Try It Out
To try out this new version of the plugin, close the dock widget if it’s currently still open in QGIS and then run the Plugin Reloader plugin to load this updated version of our plugin. Add a basemap to your map project and zoom it to the general area of Dublin. When you then load the input files, you will see the two new layers appear in the layer list of the current QGIS project with the symbology we are setting up in the code. When you now start the analysis, what you see should look like the video below with the bus tracker widget continuously updating the bus status information, the bus tracks starting to appear in the QGIS map window, and square symbols starting to pop up for the events detected.
[NOTE: This video (3:04) does NOT contain sound]
The delay slider can be used to increase the breaks between two analysis steps, which can be helpful if the map window doesn’t seem to update properly because QGIS has problems catching up with the requests to repaint layers. This in particular is a good idea if you want to pan and zoom the map in which case you may notice the basemap tiles not appearing if the delay is too short.
Overall, there is quite a bit that could be optimized to make sure that QGIS remains responsive while the plugin and analysis are running as well as other improvements and extensions that could be made. But all this would increase the amount of code needed quite a bit and this has already been a rather long project to begin with, requiring you to read and understand a lot of code. As we said before, it is not required to understand each line in the code; the crucial points to understand are how we are using classes, objects, and inheritance in this project and make use of the other techniques and concepts taught in this lesson. Reading and understanding other people’s code is one of the main ways to become a better programmer and since we are approaching the end of this course, this was a good place to practice this a bit and maybe provide some inspiration for your term project. However, we certainly don’t expect your term project to be nearly as complex as the plugin created in this section!