You've learned how to serve and style a single layer as a WMS using GeoServer and some basic SLD examples. Now, you'll go a bit further and use QGIS to set up your styles for you. You'll also see how you can group multiple WMS layers using GeoServer.
Some of the steps require you to apply the skills you learned in the previous walkthrough. You may need to pause and review in order to complete these steps.
Creating SLDs with QGIS
QGIS allows you to save out your current layer symbology as an SLD. You then apply the SLD in GeoServer using the same procedure you learned in the previous walkthrough. Styling layers in QGIS is a lot easier than writing XML. However, be aware that some features, such as labels, are not saved in the SLD. Also, the style may look slightly different when you apply it in GeoServer. Be prepared to use some trial and error to get things exactly right.
Let's style a couple of the other Philadelphia base layers that we used in previous lessons, such as roads and the city boundary. We'll eventually group these together with the neighborhoods layer within the same WMS.
- Use the procedure from the previous walkthrough to publish your Philadelphia/roads.shp and Philadelphia/city_limits.shp files as layers in GeoServer. This should be relatively easy because you do not have to create a new workspace and store. Use the geog585 workspace and the Philadelphia store that you already set up. Just start from the step where you click the Layers link in the left-hand menu.
When you finish, you should have two new layers in your layer list.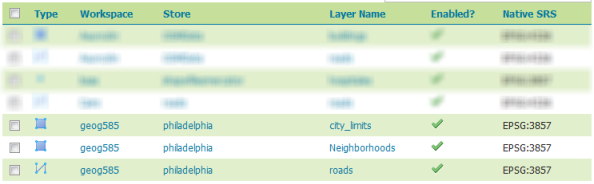 Figure 4.17 Layer list in GeoServer
 - Launch QGIS and add the Philadelphia/roads.shp and Philadelphia/city_limits.shp files as layers. Make sure you are adding the shapefiles, not the newly published WMS services.
Note: If the layers are vertically offset by 20 km, right-click each layer in the layer list and click Set Layer CRS. Then set the CRS to EPSG:3857. Even though you projected all these layers to EPSG:3857 using OGR, sometimes QGIS needs you to tell it to use its definition for EPSG:3857. - Style the city limits as a very light gray fill with no outline.
- Style the roads as a slightly darker gray, using a thin line (the default width is fine). You should have something like this:
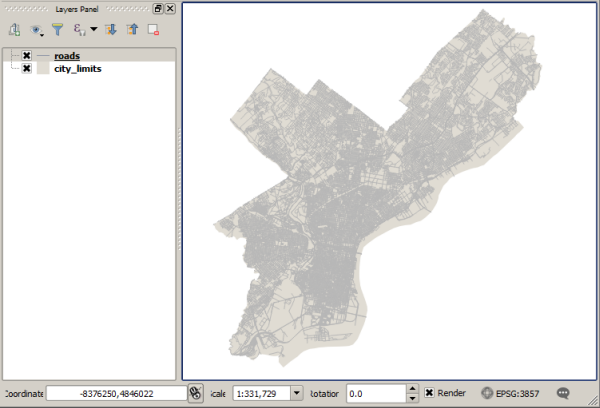 Figure 4.18 QGIS showing layers added
 - In the layer list, double-click the roads layer and choose the Symbology tab.
- At the bottom left, select Style > Save Style..., then select the "As SLD style file" option and save it anywhere as grayroads.sld.
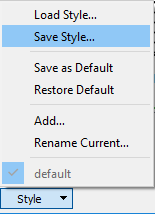 Figure 4.19 Save SLD dialog
 - Go back to the GeoServer Web Admin page and click Styles in the left-hand menu.
- Use the procedure from the previous walkthrough to create a new style called grayroads. As part of this process, upload the grayroads.sld file that you saved out of QGIS.
- Use the procedure from the previous walkthrough to apply your grayroads style as the default style for the Philadelphia roads layer that you have published in GeoServer. Preview your layer in OpenLayers to ensure the styling was applied as expected.
The above steps are significant because you were able to achieve the desired styling without editing any XML.
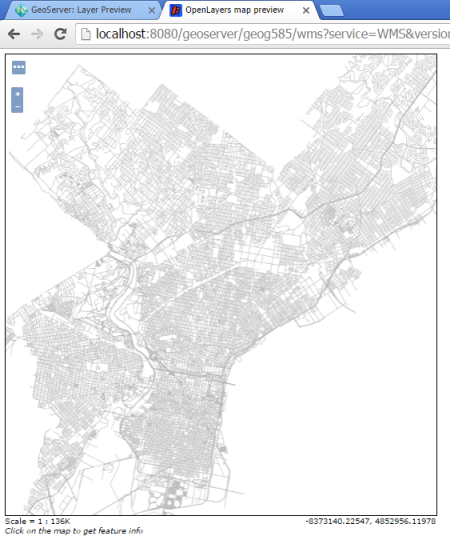 Figure 4.20 GeoServer preview of map layer
 - Repeat the above steps for the light gray city boundary style. Specifically, save the light gray polygon styling out as an SLD, create a style in GeoServer using this SLD, and then apply it as the default style for the city_limits layer. If you run into trouble, post a message on the course discussion forums.
Grouping multiple layers in a WMS using GeoServer
In some cases, you'll use WMS for your thematic layer and lay it in on top of a non-WMS basemap that uses tiles. This is what you did in the previous walkthrough. In some cases, when you have a very simple map, you may use a WMS for both the thematic layers and the base layers. Let's take a look at how GeoServer allows you to group multiple layers together in a single WMS. We'll use the neighborhoods layer, the city boundaries layer, and the roads layer that you have already published and styled in your geog585 workspace.
- Open the GeoServer Web Admin page and click Layer Groups in the left-hand menu.
- Click Add new layer group.
- Set up the first four properties as follows:
Name - NeighborhoodMap
Title - Philadelphia Neighborhood Map
Abstract - Map of Philadelphia neighborhoods using data derived from Zillow.com
Workspace - geog585 - Scroll down, and add your three layers using the Add Layer link. Use the arrows to put them in the order shown below. Notice that the top layer in the list is drawn first, the second layer in the list is drawn on top of that, etc., resulting in a layer list in reverse order from what you'd expect.
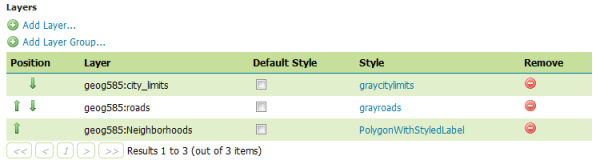 Figure 4.21 GeoServer Add Layer GUI
 - Scroll up a bit, and set the coordinate reference system to EPSG:3857. Then click Generate Bounds to calculate the bounding coordinates for the service.
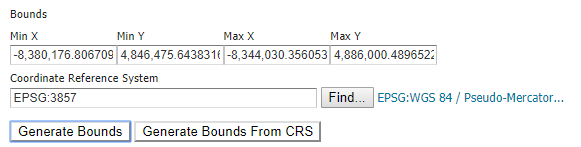 Figure 4.22 GeoServer Generate Bounds dialog
 - Go to the Tile Caching tab, and uncheck Create a cached layer for this layer group. Although GeoServer allows you to create a tile cache for this layer, we will focus on creating tiles in the next lesson using the superior drawing options of QGIS.
- Click Save. You should see your new group layer in the list. If you get a nullPointerException in GeoServer, proceed ahead with the next steps anyway, if you can. If they don't work, please check your previous steps and make sure everything was completed accurately, then post on the Technical Discussion Forum if you are still having issues.
- Use the Layer Preview link to preview your group layer in the OpenLayers viewer. You should see something like the styling below (note that I have zoomed in the preview from its initial extent).
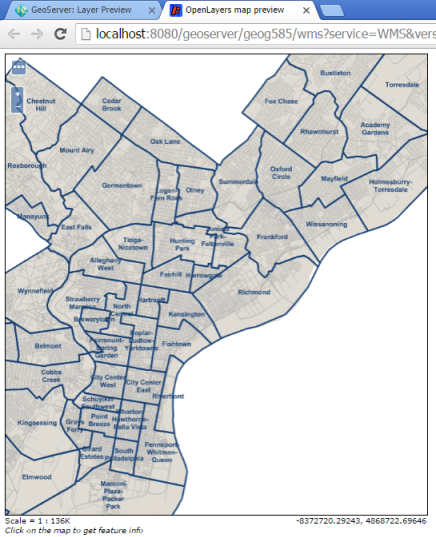 Figure 4.23 GeoServer preview of styled layer
 - Open a new map in QGIS, and connect to the group layer using the techniques from the previous walkthrough (click Connect again in the dialog box below to see an updated list of layers in your WMS). Remember to set the CRS to EPSG:3857.
The layer should appear in your QGIS layer list as a single entity:
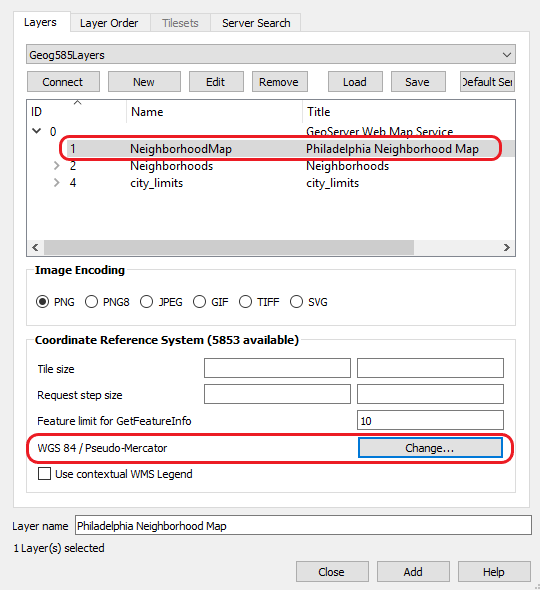 Figure 4.24 QGIS add WMS layer GUI
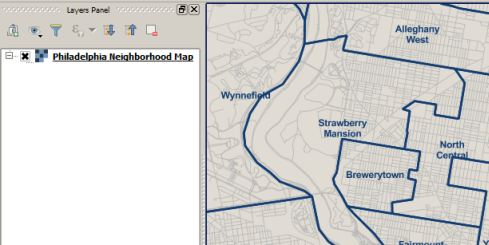 Figure 4.25 QGIS layer list sample
If you get an error when adding the layer, try cleaning out your QGIS WMS cache by clicking the Settings menu > Options, go to the Network tab of the options box, and then click the little red garbage can icon to clear the cache.
This exercise has shown how you can style any number of layers and group them together as a dynamically drawn WMS in GeoServer. If you have many layers to combine, it's faster and more scalable to use tiles, which you'll learn about in the next lesson. However, the techniques you've learned with WMS are sufficient to launch a quick and easy web map if you'll only have a few layers or a limited number of people using the map.