ARCHIVED - 2017.08.02
Overview
So far, you've been able to create several different types of layers, such as a dynamically-served web map service (WMS) and a static tiled web map. You've previewed these layers in various ways but have probably come to the conclusion that they're not very useful or easy to share using these preview mechanisms. You will learn how to create more types of layers in future lessons, but, for now, we are going to pause for a week and learn how you can program a web application that combines your layers, creating an easily shareable "front end" for your web maps. You will learn what the OpenLayers API is and how to use it for this purpose. It's impossible to learn OpenLayers in a single week (or even in a single course), so, in this lesson, you'll just get a taste of the basics. Future lessons continue to use OpenLayers and expand on the knowledge you gain this week.
If you are new to web programming, it is recommended that you take some time to review the W3Schools HTML and JavaScript tutorials that you studied during orientation week. You don't need to know everything, but you do need to be familiar enough with the code and markup patterns that you can interpret most of what you are seeing when you view the examples later in the lesson. The prerequisite for this course is prior familiarity with at least one programming language, and it is expected in this lesson that you apply this familiarity to understanding the JavaScript syntax for loops, functions, decision structures, and so forth. Exerting a little extra time and effort, you should be able to see how JavaScript relates to the language(s) that you already know.
Objectives
- Identify commonly-used web mapping APIs (both proprietary and FOSS) and recognize programming patterns that are common to each.
- Choose developer examples that relate to your web mapping task and adjust the code to meet the needs of your own application.
- Use OpenLayers to create a mashup from a tiled basemap and a WMS thematic layer.
- Create informational popups for your web map features using OpenLayers.
Checklist
- Read the Lesson 6 materials on this page.
- Complete the walkthrough.
- Complete the Lesson 6 assignment (note that it has two distinct deliverables).
- Complete the "second quiz" on Canvas. This covers material from Lessons 4 - 6.
What is a web mapping API?
An API (Application Program Interface) is a framework that you can use to write a program. It provides a set of classes and functions that help you avoid writing all the low-level code to perform specific actions. For example, web mapping APIs typically include classes for maps and layers so that you don't have to write all the low-level code for displaying an interactive map image and drawing a new layer on it. Instead, you can just create a new map object, create a new layer object, and call some method such as map.addLayer(layer). The API abstracts the complexity of the task and makes it easy for you to focus on the mapping aspects of your application, rather than spending time on the low-level logistics.
You've probably heard of general purpose APIs such as Java and the Microsoft .NET Framework that can be used to write all kinds of programs on desktop, web, and mobile platforms. There are also more specialized APIs built around certain products and functionalities. For example, you may have heard of Google App Engine, Amazon Web Services, and Microsoft Windows Azure that are designed for proprietary cloud computing environments.
APIs designed specifically for the purpose of making web maps include OpenLayers, Leaflet, the Google Maps API, and the ArcGIS API for JavaScript. The latter two are even more specific in that they are designed around particular proprietary platforms. This lesson introduces some of the different APIs and application development approaches, then gets into detail on how to use the OpenLayers API.
Be aware that an API is not a programming language; rather, it is a set of building blocks that you invoke using a language. Some APIs are supported for use with multiple programming languages and other APIs are tied to one specific language. For example, there is both a language and an API named Java. The Java language is used to work with the Java API (and other APIs). In contrast, the .NET Framework is solely an API; there is no language called .NET. Applications using the .NET Framework are typically programmed using the C# or Visual Basic languages.
Choosing a web mapping API
When you set out to create a web map, one of the most important choices you will make is which API to use. If your application is large in scope with many clients, this one decision can affect your professional activities and trajectory for years. How can you select an API that will be the best fit for your requirements and skill set?
The selection of an API is often tightly coupled with the decision of a platform and programming language. These two factors affect the APIs available to you. For example, if you know that your application is required to run on Android tablets, you first need to decide whether you are going to build a full-fledged native app (in other words, one that is available in Google Play and has access to the device hardware such as the camera) or one that simply runs in a web browser on the Android tablet. Developing a native app most likely means that you'll be using Java, while developing a browser-based app allows more flexibility and can be done with JavaScript and HTML, perhaps employing an API that's designed to be mobile-friendly (in other words, it supports touch gestures, resizes to device width, and so forth).
From this example, you can probably also tell that it's important to consider which languages and platforms your developers are familiar with. If you have people on staff who know Java or Objective C, your options increase for developing native mobile apps. However, knowledge of HTML and JavaScript is usually sufficient to build browser-based apps. Most FOSS APIs for web mapping are geared toward an HTML and JavaScript approach, so this is what we'll focus on in Geog 585. Note that commercial providers may offer more language and platform choices, such as Esri's ArcGIS APIs for iOS, Android, Flex, Silverlight, and so forth; however, the plugin-based APIs (e.g., for Flex and Silverlight) have lagged in popularity in recent years due to HTML5 uptake and plugin deprecation.
Examples of FOSS web mapping APIs
Below are some examples of FOSS web mapping APIs for building browser-based apps with HTML and JavaScript.
OpenLayers
OpenLayers [3] is a mature and richly featured JavaScript API for building web map applications. It has an extensive collection of documentation and samples, although some of the materials can be difficult for beginners to grasp. One of nicest things about OpenLayers is the large developer community using the API. This community has created a mass of tips and examples on forums such as GIS Stack Exchange [4]. In my experience, most OpenLayers questions typed into Google will lead to an answer somewhere in the documentation or these online discussions.
Although OpenLayers is not as approachable for beginners as some of the other APIs, I have decided to teach it in this course because of its widespread use, its accumulation of online help resources, and its support for many layer types from both FOSS and commercial sources. I have also decided to teach OpenLayers 2 in this course for the time being rather than the newer OpenLayers 3/4. The reasoning for this will be discussed further later in the lesson.
Leaflet
Leaflet [5] is a younger FOSS web mapping API that is designed to be lightweight, mobile-friendly, and easy to get started with. It places heavy emphasis on the use of tiled maps and client-side vector graphics drawn from sources such as GeoJSON (you will learn more about the latter in the next lesson). For basic maps that use these layer types, Leaflet is an excellent choice that has already endeared itself to many GIS developers.
Leaflet contains a full API reference but only a handful of full working examples. For example, support for OGC layer types such as WMS is described in the API reference but is not available in the examples. Going beyond the examples can be tricky for beginners. If you feel comfortable with JavaScript and OpenLayers after this lesson and decide you would like to use Leaflet for your final project, you are welcome to go ahead, keeping in mind these limitations.
D3
D3 [6] is a FOSS data visualization library that is frequently used for charting but also contains many map examples. It binds data elements to the page's document object model (DOM), allowing for interesting and flexible data animations and transitions. Although it has a steeper learning curve for newbies, D3 is a nice option for composing a web app with interactive maps and charts. It also offers examples for using non-Mercator projections [7].
Polymaps
Polymaps is simple FOSS mapping API primarily designed for mashing up map tiles with vector features drawn from GeoJSON and other sources. However, the developer examples also show how Polymaps can transform and overlay a raster image [8] onto an existing tile set. The k-means clustering example [9] demonstrates a unique ability of the Polymaps API to generalize a large set of points on the fly.
ModestMaps
ModestMaps [10] is a lightweight FOSS API for displaying tiled maps. By design, it lacks a lot of the functionality of the other APIs [11]mentioned above. Running JavaScript code requires transferring that code to the browser. Why load hundreds of functions if you know that you just want to display a map?
Examples of proprietary web mapping APIs
Several proprietary web mapping APIs created by commercial software companies have become very popular. In this context, "proprietary" means that the API's source code cannot be downloaded and/or is not permitted to be modified and/or cannot be deployed without paying a royalty.
I include this section on proprietary options because you will hear about them all the time, many are free to use (under various conditions), and some of them will work with the types of layers we're using in this course. Just be aware that proprietary APIs may be oriented toward the purchase of a particular product or service and may cost money if you deploy them for monetary benefit or if they incur enormous amounts of traffic. Always check the API's license agreement before you deploy any application on a server outside your own development machine.
Google Maps and Bing Maps APIs
The Google Maps API [12] gives developers the opportunity to overlay their own data on top of tiled map layers from Google Maps. The overlayed data is typically supplied through KML files, and is displayed as interactive vector graphics drawn on the client side. These graphics can be restyled by the developer to use custom marker symbols, and can be bound to popups or tables to show additional information on a mouse click.
Perhaps the biggest advantage of the Google Maps API is that it brings the look and feel of Google Maps to an application. Many Internet users have experience with Google Maps and may feel more comfortable when they see the Google Maps navigation control or map style, even when this is embedded in an unfamiliar third-party application. The Google Maps API is arguably no more robust or easier to use than some of the FOSS APIs described above; however, it is thoroughly documented and offers a large developer community.
Applications that use the Google Maps API for free must be publicly accessible and not incur over 25,000 map loads per day. Organizations whose applications that do not meet this criterion must purchase a Google Maps API for Business license (see here [13] for the most up-to-date information on Google's Pricing and Plans).
Microsoft's Bing Maps [14], another large commercial maps provider, offers APIs for web and mobile applications that are similar in scope to Google's. Like Google, Bing Maps offers a free usage tier and an enterprise license (see details here [15]). One difference is that the Bing Maps API places less emphasis on KML usage, since Google popularized the KML format and is a primary platform used to create KML files.
The Google and Bing mapping APIs are a popular choices among developers of place-finder applications that display real estate listings [16], businesses [17], churches [18], etc. However, some sites are beginning to adopt FOSS alternatives. For example, Craigslist [19] has adopted a Leaflet + OpenStreetMap approach when showing the results of real estate searches.
ArcGIS APIs
Esri has created web mapping APIs that fit into its ArcGIS platform, some of which are relatively rich in function compared to the Google Maps API and many of the FOSS APIs. The APIs support multiple languages and platforms, such as JavaScript, Flex, Silverlight, iOS, and Android. In theory, they are roughly equal in functionality, although, in practice, they have matured and thrived at different levels. The ArcGIS API for JavaScript [20] is one of the most fully featured and actively developed of these APIs.
The ArcGIS APIs are primarily designed to work with web services that you have published using ArcGIS Online [21] and ArcGIS Enterprise [22] (comprising ArcGIS Server [23] and Portal for ArcGIS [24]). However, some of the APIs can also display OGC services, KML, and generic tiled map services (such as the one we built with TileMill). One of the more distinguishing advantages of the APIs is their ability to tap into web services originating from ArcToolbox that perform geoprocessing on the server. This is an area where FOSS solutions lack an equivalent GUI experience (see the section on WPS services in Lesson 8).
The APIs are free to use for development or educational use, but require a fee if you are selling the application or embedding advertising within it. Esri has published their terms of use in "plain language" here [25].
If you are interested in learning the Google Maps API and/or the ArcGIS API for JavaScript, the Penn State course materials for Geog 863 [26] provide an excellent place to get started.
Other web mapping APIs
A multitude of other free and proprietary APIs have appeared over the years for doing pretty much the same things as the ones listed above. Please take a detour to read about some of them in this GIS Stack Exchange post [27]. You will refer back to the post when you complete this week's assignment.
Programming patterns with web mapping APIs
If you distinguish yourself within your organization as a person who can develop web maps, it's likely you'll eventually be called upon to use more than just one of the APIs described in the previous section. As noted, project circumstances and requirements can force the selection of different APIs for differing endeavors. As a programmer, it's important to understand the general structures, patterns, and architectures behind the APIs and languages you use, so that you can learn new ones on the fly. Technology is always changing, and you will limit your utility if you tie yourself to a single development mode.
The following section describes some patterns and features that are held in common among many (but not all) of the web mapping APIs described earlier. I include this section before diving into OpenLayers, so that you get an idea of what things are not unique to OpenLayers when we begin looking at the code. However, I also include example snippets to show how the concept is implemented in OpenLayers.
Nearly all pages that use web mapping APIs include the following:
References to JavaScript files and stylesheets
Before you can get off the ground, your HTML page needs to include a <script> tag pointing at the web mapping API's JavaScript files. Be aware that the more JavaScript you are referencing, the longer it will take to load your page. Some APIs are slimmer than others (hence a name like ModestMaps) but may offer fewer features. Be aware that OpenLayers is one of the largest APIs in functionality and loading time. When adopting one of the larger APIs, some developers build and reference their own smaller version of the API that contains just the functions they want to offer.
There are a couple of ways to reference the API. One approach is to download and host the API on your own server, thus minimizing load times and allowing you to customize the API. The second approach is to reference the API on someone else's server. Sites called content delivery networks (CDNs) specialize in hosting commonly-referenced APIs. This is what a CDN URL looks like for OpenLayers, referenced within a script tag within the page head:
<script src="http://cdnjs.cloudflare.com/ajax/libs/openlayers/2.12/OpenLayers.js"></script>
In this course, we'll reference OpenLayers through the CDN, for simplicity. However, be aware that if you were developing an internal application, needed full control over the APIs hardware, or needed to customize the API in any way, you would need to download and host the API yourself.
Many web mapping APIs offer some stylesheets that can get you started with making nice-looking applications. You can reference these stylesheets in the form of CSS files, either by hosting them on your own server or using a CDN. In this course, we will use the stylesheet from the OpenLayers examples and put it on our own server, rather than using the stylesheet from the CDN. However, for reference, the stylesheet from the CDN is brought into the page within the head using syntax like this:
<link rel="stylesheet" href="http://cdnjs.cloudflare.com/ajax/libs/openlayers/2.12/theme/default/style.css" type="text/css">
The map div and object
When you want to put a map in your page, you will typically carve out some space using an HTML <div> tag. You then create a map object using the API and relate it to your div.
For example, with OpenLayers, you can create a map div like this in the body of your page.
<div id="map"></div>
Elsewhere in your page, in your JavaScript code, you can can create an OpenLayers.Map object and relate it to the div. The OpenLayers.Map constructor takes the div name as an argument.
var myMap;
myMap = new OpenLayers.Map("map");
With this approach, you can potentially put multiple maps in your page. Each map would likely have its own div and OpenLayers.Map object.
The map also has a spatial reference system associated with it that affects the appearance of the map and determines the format of the coordinates that you use. Here's a little more complex example that shows how you could explicitly define the coordinate system of the map to use the common web-friendly Mercator projection:
var toProjection = new OpenLayers.Projection("EPSG:900913"); // to Spherical Mercator Projection
var map;
map = new OpenLayers.Map("map", {projection:toProjection});
When you invoke the OpenLayers.Map constructor, you can optionally pass in a JavaScript object containing a whole realm of optional parameters. The above example takes advantage of this to set the projection to EPSG:900913, or spherical Mercator.
The map contains methods for adding layers, getting the current layer set, centering the map, zooming to given coordinates, and so forth. In many web mapping APIs, the map is one of the most powerful objects. Whenever you adopt a new mapping API, take a look at the reference documentation for the map object to understand what it can do and the syntax for invoking the most common methods.
Layer objects
Most web mapping APIs provide ways to define layer objects, which you add to the map object one by one to create your mashup. It is very important to note that a layer, in this sense, could represent a web service such as a WMS or tiled service that itself contains many underlying data layers. However, you would only need one layer object to bring this type of web service into your map. Other layer objects that reference single data files, such as KML or GeoJSON, are simpler to conceptualize.
In many web mapping APIs, the layer is an abstract class offering a set of common properties, and is exposed to the developer only through more specific classes. Take a look at the properties offered in the OpenLayers.Layer class. These include projection, units, scales, attribution, and other properties found in all layers. Now look at the properties of some of the more specific derived classes such as OpenLayers.Layer.WMS and OpenLayers.Layer.Vector to see some of the more specific properties associated with these layer types. You will typically be working with the API help documents at this lower level; however, it is important to remember that you still have all the properties of the Layer class available to you whenever you use any of these specialized layer types.
When you create a new layer in OpenLayers, you're generally expected to provide the URL or file path containing the source data for the layer. The layer will not show up until you call a function on the map that adds it. Here's one way you could create a layer referencing a WMS and add it onto your basemap:
layer = new OpenLayers.Layer.WMS(
  "WMS", "http://localhost:8080/geoserver/philadelphia/wms",
  {
    LAYERS: 'philadelphia:FarmersMarkets',transparent: true
  },
  {
    singleTile:true,
    isBaseLayer: false
  }
);
map.addLayer(layer);
Don't worry if the meaning of all the parameters above is not immediately apparent. The important thing is to recognize that the layer required you to supply a URL and a layer name before it could recognize the WMS. Other properties such as singleTile and isBaseLayer just provide details how the layer is to be displayed in the map.
The addLayer method on the Map object is what actually adds the layer onto the map and makes it visible. If you call addLayer again and pass in some other layer, it will be placed on top of the first layer.
Some layer types like OpenStreetMap have commonly known URLs, thus OpenLayers includes a specific class that lets you type in the user-friendly name of the layer rather than its URL. For example, here's how you could add the basic OpenStreetMap tileset to your map:
var osm = new OpenLayers.Layer.OSM( "Simple OSM Map");
map.addLayer(osm);
Note the use of the class OpenLayers.Layer.OSM specifically for adding OpenStreetMap data. The class is able to interpret "Simple OSM Map" and you are not required to supply the URL.
Layer styling mechanisms
Layers that come already drawn by the server, such as tiled maps and WMS images, already have styling applied, but for layers drawn by the browser such as GeoJSON or GeoRSS, you must define how the layer will be styled. Web mapping APIs typically offer a group of properties that you can set on a layer like this to define how the browser should draw it. These properties include things like fill width, fill color, outline width, outline color, and so forth. Many APIs allow you to use a custom image for a marker, rather than placing a simple dot.
The OpenLayers example below shows how you could add a GeoJSON layer of grocery stores to your map and style it with a shopping cart icon saved in an SVG (scalable vector graphics) file called grocery.svg. This could just as easily be a PNG file or other rasterized image type.
var fromProjection = new OpenLayers.Projection("EPSG:4326");
var groceryLayer = new OpenLayers.Layer.Vector("Grocery", {
  projection: fromProjection,
  strategies: [new OpenLayers.Strategy.Fixed()],
  protocol: new OpenLayers.Protocol.HTTP({
    url: "supermarkets.geojson",
    format: new OpenLayers.Format.GeoJSON()
  }),
  style: {
    externalGraphic: 'svg/grocery.svg',
    graphicWidth: 25,
    graphicHeight: 25,
    graphicYOffset: 0
  }
});

map.addLayer(groceryLayer);
The result might look something like this when put on top of a basemap layer:
Don't worry if all the code above is not completely clear to you yet. Just make sure you can see where the style is being defined via a JavaScript object. In Lesson 7, you will get some more exposure to GeoJSON and styling browser-drawn graphics.
Events and interactive elements
Web mapping APIs offer interactive elements that help your map become more than just a static picture on an HTML page. The map and layer objects described above typically allow you to run code in response to certain user actions, such as clicking the mouse. The user action is called an event (or firing an event). The code you run in response is called the event handler, and it typically goes into its own function block of code. Sometimes the event can supply arguments to the handler function that tell things about the event, such as the screen coordinates of the mouse click that fired the event.
For example, you might instruct the map to "listen" for a mouse click event. You could then write a handler function that takes the screen coordinates of the event argument (in other words, the coordinates of the clicked pixel) and converts them to map coordinates, then writes the coordinates into a label in the HTML page so they can be seen by the user. An even greater measure of interactivity could be achieved by wiring up this handler function to a hover event, instead of a click. You would then get the effect of always seeing the coordinates of your mouse as you moved it around the screen.
Web map users often want to obtain more detailed information about specific features in the map. It is very common to handle a click event by showing a popup window with more information about the clicked feature; so common, in fact, that many web APIs have special classes and methods for popups that don't require you to write the typical amount of event listening logic. You will learn more about popups in OpenLayers in future lessons in this course.
Sometimes popups are too limited in space or complexity for the content you want to show. Even if your mapping API allows you to cram large images or tabbed interfaces into a popup, it often makes more sense to show this type of content in an HTML div elsewhere on the page. Web mapping APIs allow you to perform queries on a clicked point and retrieve attribute information from the clicked features (often as part of a handler function like the ones mentioned above). You can then do anything you want with this handler function in order to display the information in HTML. You might even pass the information to a different specialized API that draws charts, queries Wikipedia, finds nearby homes for sale, and so forth.
Another common piece of desired interactivity is the ability to switch layers off and on. Remember that in this sense, a "layer" is an entire web service. It is obviously not possible to toggle the visibility of individual sublayers inside a tiled map because all the layers are "burned into" the tiled image. However, you could turn off the entire tiled map, or turn off a WMS or GeoJSON layer placed on top of it.
Because the OpenLayers Map object allows the retrieval of all its layer objects and the Layer object has a setVisibility method, you can write a relatively simple function to toggle the visibility of a layer. Here's an example of a function that toggles layer visibility when a user clicks a table of content element:
function toggleLayerViz(layerName){
  var layerToToggle = map.getLayersByName(layerName)[0];
  if (layerToToggle.visibility){
    layerToToggle.setVisibility(false);
  }
  else {
    layerToToggle.setVisibility(true);
  }
}
The function finds all the layers with the given name and takes the first one (index 0) in the case that multiple layers have the same name (you should avoid this anyway). It then checks whether the layer is already visible and then calls the setVisibility method to toggle the visibility off or on accordingly. This type of function could be wired up to any type of button or checkbox that you want to construct.
Now that you are familiar with the different elements of a web mapping API and have seen how these are expressed in OpenLayers, we'll move forward and take a look at some full functioning examples.
Examining some OpenLayers examples
Now that you have received an introduction to web mapping APIs and their basic elements, you need to start experimenting with one in order to make any more significant progress. The way you will learn OpenLayers, and any other API, is by taking a look at its developer code samples, trying to run them, and experimenting with adjustments or tweaks to suit your fancy. Indeed a strategy for building any web application is to find the combination of samples that best approximates what you want to do and then start experimenting with merging those samples, testing the functionality one piece at a time until you've met all your requirements.
In this spirit of exploration and experimentation, we are going to take some time to look through some of the OpenLayers developer samples. These samples are shown not because of laziness on the part of the instructor ("Couldn't he write his own samples?"), but because these are the very samples that you'll be working with as you complete your final project and even as you continue OpenLayers development beyond this course. I want to make sure you can use and interpret them effectively.
After going through several of these examples, you will complete a walkthrough in the next section that will combine some of the functionality of the examples into a useful objective. Namely, the goal for the walkthrough is to be able to put your PhillyBasemap tiles that you made with TileMill into the map, and then place a WMS on top of them. The user should be able to click a feature in the WMS and see a popup with basic information about that feature. The completed walkthrough will look something like this:
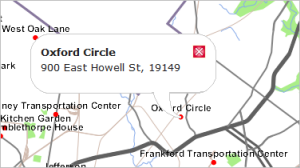
There are many different combinations of functionality you could make with OpenLayers, but this is a nice basic way to start. With that in mind, in this section, you will study some of the developer samples that could be applied toward this goal.
Before we start, one final word on OpenLayers in general: When the course was designed, the most current version of OpenLayers available was 2.12. In the meantime, new versions of OpenLayers 2 have been released that are backwards compatible with 2.12 (OpenLayers 2.13.1 is the most current one). That means the examples you find in the course materials will work in 2.12 and 2.13.x. However, when searching on the web or browsing the OpenLayers web pages, you will notice that there is also a newer branch of OpenLayers releases available that started with version 3.0.0 and at the moment goes up to version 4.0.1. OpenLayers 3 was officially released in August 2014 and was a complete rewrite of the library that is not compatible with the OpenLayers 2 branch. In early 2017, this new branch adopted Semantic Versioning and version 4 was released indicating that it contained certain changes (mainly removal of deprecated functions) that are not backwards compatible with earlier versions. Nevertheless, in contrast to the change from OpenLayers 2 to OpenLayers 3, which was a complete redesign, OpenLayers versions 4.x.y are direct advancements of OpenLayers 3.
Overall, the situation between OpenLayers 2 and OpenLayers 3/4 is similar to what you saw with Python in GEOG485 in that currently both branches coexist, and most likely will continue to do so for quite a while. We made the decision to stick with OpenLayers 2 for the foreseeable future for the following two main reasons: OpenLayers 3/4 is still less mature and tested, and fewer high-quality resources exist on the web to help you get started compared to OpenLayers 2; and there is much more OpenLayers 2 code out there on the web that still needs to be maintained and is being reused. So, if you join an existing project, it is more likely to be using OpenLayers 2. The good news is that despite the incompatibility issues, it is rather easy to transfer what you learn here about OpenLayers 2 over to OpenLayers 3 and other web mapping APIs as well. In addition, we will also link to OpenLayers 3 implementations of the main code examples from the walkthroughs of lessons 6-8 so that you can check out the differences between the versions on your own.
Selecting examples that fit the goal
First, take a look at the OpenLayers Examples page (or alternatively here). It's not the prettiest page or the easiest to navigate, but it's a treasure trove for you. It is your first place of recourse for finding the code you might need in your projects.
Click a few of the examples that look interesting to you, and use your browser to view the page source (post to the course forums if you don't know how to do this). Comb through the code, and see how much you can figure out on your own.
Which of these examples would be most helpful in learning how to add a tiled layer, add a WMS, and enable popups on the WMS? I will mention right now that none of the examples fit our scenario exactly. However, there are three that will get you close:
- Basic ESRI Map Cache Example - Although this example uses an Esri map cache, the purpose of the code is to show how you could add any type of tiled layer based on knowing the level, row, and column in the URL structure. In OpenLayers parlance, this is known as an XYZ tiled layer. It's how you add unpacked rasterized tile sets from TileMill like the one you made in Lesson 5.
- Basic Single WMS Example - This is the simplest OpenLayers example showing how to use a WMS. In the walkthrough, you'll tweak it a bit because your WMS won't be the basemap layer, but this example will at least get you started.
- Feature info in popup - Recall that the way you query a WMS is to call GetFeatureInfo. OpenLayers provides a way to make this query and show the result in a popup. In the walkthrough, you will adjust the popup format somewhat from the default shown in this example.
Let's take a closer look at these examples one by one. We will focus on the content within the <script> tags. The peripheral content (in other words, the HTML headers, the JavaScript file references, and CSS links) are all virtually the same in these examples, and there will be more discussion in the walkthrough about how you'll adjust these on your own machine. Also, do not get too concerned with the content in the <body> tag in these examples, other than noting that a map div is created in each:
<div id="map" class="smallmap"></div>
Tiled map example
Examine the page source code for the Basic ESRI Map Cache Example, focusing on the content in the <script> tag. It should look like this:
var map, layer;
function init(){
    var layerExtent = new OpenLayers.Bounds( -13758743.4295939,  5591455.28887228, -13531302.3472101 , 5757360.4178881);
    map = new OpenLayers.Map( 'map', {'restrictedExtent': layerExtent} );
    layer = new OpenLayers.Layer.XYZ( "ESRI",
	"http://server.arcgisonline.com/ArcGIS/rest/services/World_Topo_Map/MapServer/tile/${z}/${y}/${x}",
	{sphericalMercator: true} );
    map.addLayer(layer);
    map.zoomToExtent(map.restrictedExtent);
}
When you are trying to interpret a chunk of code like this for the first time, it's helpful to write out a plain language "pseudocode" description of what is happening in each line. With particularly difficult code snippets, I sometimes like to print out the code on a sheet of paper and mark it up with a pen line by line. Another approach is to try to put a descriptive code comment above each line. In pseudocode, the above example might look like:
- Set up some variables for the map and layer objects.
- Set the maximum allowed bounding coordinates for the layer (useful to keep people from zooming outside the tiled area).
- Create the map object, passing in the map div name and the maximum extent defined in item 2 above.
- Create the layer object, passing in a unique name for the layer, the URL structure of the tiles, and an optional property indicating that the tiles are in the spherical Mercator projection.
- Add the layer to the map.
- Zoom the map to its maximum allowed bounding coordinates as defined in items 2-3.
Take a minute to examine how each item in the numbered list above corresponds with the lines in the code sample (print this page and draw lines if necessary). Note that items 2-6 are placed inside of a function init() that runs when the page loads. Item 1 is placed outside this function so that the map and layer variables will be global in scope. Global variables can be accessed from any function, not just init().
Although it's a best practice to minimize the number of global variables in your code, sometimes it's necessary to make the map (and possibly some layers) global in scope. Perhaps acknowledging this, the authors of the sample made the map and layer variables global, even though it wasn't required in this particular example.
This example uses the OpenLayers.Layer.XYZ class to bring in the tiled layer. Think for a minute about how you would adjust this code to display your Philadelphia basemap tiles that you made in Lesson 5 with TileMill. You would definitely need to change the bounding coordinates. You would also need to change the tile URL to point at your PASS space instead of the Esri server. Most of the other code would require little or no alteration.
WMS example
Now view the page source for the Basic Single WMS Example, focusing on the JavaScript. This example displays one layer from a WMS running on a public server:
var map, layer;
function init(){
    map = new OpenLayers.Map( 'map' );
    layer = new OpenLayers.Layer.WMS( "OpenLayers WMS",
	"http://vmap0.tiles.osgeo.org/wms/vmap0",
	{layers: 'basic'} );
    map.addLayer(layer);
    map.zoomToMaxExtent();
  }
In structure, this example is identical to the one you viewed previously. The only difference is the way that the layer is created. Notice that this time the OpenLayers.Layer.WMS class is used instead of OpenLayers.Layer.XYZ. To use this class, you have to provide a few essential pieces of information in the constructor, such as a name for the layer, the URL of the WMS, and a list of layers in the WMS that you want to display. In this case, a single layer called 'basic' is requested from the WMS.
Query and popup example
Now take a look at the JavaScript source code for the Feature info in popup example. This example allows you to click a WMS and get a popup window showing information about what you clicked. There's a lot more going on here in the JavaScript, so let's take it piece by piece:
OpenLayers.ProxyHost = "proxy.cgi?url=";
When your application calls a remote web service asynchronously (for example, to query the WMS and display a popup), the request needs to go through a script called a ProxyHost that is installed on your server. This line of code is just indicating the location of the ProxyHost, and OpenLayers knows how to do the rest of the work of routing the request through it.
Setting up the ProxyHost is out of scope in this course, so, in the walkthrough, we'll set up the HTML page on the same server that hosts the WMS in order to avoid the ProxyHost requirement.
var map, info;

function load() {
    map = new OpenLayers.Map({
	div: "map",
	maxExtent: new OpenLayers.Bounds(143.834,-43.648,148.479,-39.573)
    });


    var political = new OpenLayers.Layer.WMS("State Boundaries",
	"http://demo.opengeo.org/geoserver/wms",
	{'layers': 'topp:tasmania_state_boundaries', transparent: true, format: 'image/gif'},
	{isBaseLayer: true}
    );

    var roads = new OpenLayers.Layer.WMS("Roads",
	"http://demo.opengeo.org/geoserver/wms",
	{'layers': 'topp:tasmania_roads', transparent: true, format: 'image/gif'},
	{isBaseLayer: false}
    );

    var cities = new OpenLayers.Layer.WMS("Cities",
	"http://demo.opengeo.org/geoserver/wms",
	{'layers': 'topp:tasmania_cities', transparent: true, format: 'image/gif'},
	{isBaseLayer: false}
    );

    var water = new OpenLayers.Layer.WMS("Bodies of Water",
	"http://demo.opengeo.org/geoserver/wms",
	{'layers': 'topp:tasmania_water_bodies', transparent: true, format: 'image/gif'},
	{isBaseLayer: false}
    );

    var highlight = new OpenLayers.Layer.Vector("Highlighted Features", {
	displayInLayerSwitcher: false,
	isBaseLayer: false
    });

    map.addLayers([political, roads, cities, water, highlight]);
. . .
}
The above code may look intimidating, but, upon closer examination, you should recognize that it's just creating a number of WMS layers and adding them to the map. The pattern for adding these WMS layers is the same as in the previous example, except a few more options are specified. For example, the desired image format (gif) is specified, and each layer is marked to indicate whether it is the base layer or not.
You can ignore the part about creating a vector layer called "Highlighted Features" in this example. It is not necessary for this example to function.
Now, on to the query and popup code:
info = new OpenLayers.Control.WMSGetFeatureInfo({
	        url: 'http://demo.opengeo.org/geoserver/wms',
	        title: 'Identify features by clicking',
	        queryVisible: true,
	        eventListeners: {
	            getfeatureinfo: function(event) {
	                map.addPopup(new OpenLayers.Popup.FramedCloud(
	                    "chicken",
	                    map.getLonLatFromPixel(event.xy),
	                    null,
	                    event.text,
	                    null,
	                    true
	                ));
	            }
	        }
	    });

map.addControl(info);
info.activate();
The above code allows for querying of the map using a WMS GetFeatureInfo call. It gets a little complex due to the way OpenLayers is designed to work with GetFeatureInfo. Notice that you must create an OpenLayers.Control.WMSGetFeatureInfo object. In the above example, four pieces of information are passed to this constructor:
- The URL of the WMS to query.
- A title for the object, which is not used anywhere in this example.
- A boolean flag indicating whether features in hidden layers should be queried.
- An event listener that defines what should happen when the query occurs.
The first three items are pretty self-explanatory when you look at the code example. It's the fourth item above that requires the most code and could potentially be the most confusing for a beginner. Let's take a closer look at just that piece:
        eventListeners: {
	            getfeatureinfo: function(event) {
	                map.addPopup(new OpenLayers.Popup.FramedCloud(
	                    "chicken",
	                    map.getLonLatFromPixel(event.xy),
	                    null,
	                    event.text,
	                    null,
	                    true
	                ));
	            }
	        }
To make any sense of this, you first have to know that WMSGetFeatureInfo can listen for an event called getfeatureinfo. This seems redundant, but it's the necessary syntax as described in the documentation. See OpenLayers.Control.WMSGetFeatureInfo.
This control handles click or hover events, attempts to parse the results using an OpenLayers.Format, and fires a ‘getfeatureinfo’ event with the click position, the raw body of the response, and an array of features if it successfully read the response.
From the above, you learn that the event returns some information (an event object) about the queried feature. The event handler function in this example takes the returned information and puts it in a popup. This event handler code is enclosed in the block function(event){ . . . }.
To actually add the popup, you call the addPopup method on the map object. This method takes a popup as an argument. How do you get a popup to pass in to this method? This particular code creates the popup on the fly. Hence, you get a constructor function showing up in the middle of your code that creates one of the various types of OpenLayers popups, a new OpenLayers.Popup.FramedCloud:
new OpenLayers.Popup.FramedCloud(
	        "chicken",
	        map.getLonLatFromPixel(event.xy),
	        null,
	        event.text,
	        null,
	        true
	     ));
What things are passed into this constructor? Follow along with the documentation at OpenLayers.Popup.FramedCloud (scroll down to the Constructor section):
- A unique ID for the popup. This is rarely going to be used so the authors of this example somewhat humorously put the word "chicken".
- The longitude and latitude where the popup is to be anchored. This is where the event object comes in handy. It contains an xy property with this information.
- The size of the content in the popup. If left as null, the popup should auto-size to fit the content.
- The text content to put in the popup. In this case, the WMS returns some HTML with an attribute table for the queried feature. You get this HTML from the text attribute of the event object (event.text). OpenLayers will read it and happily draw the table.
- The object to which the popup will be anchored. This is left as null in this example.
- A boolean flag indicating whether a red box with an X should appear on the popup so that the user can explicitly close the popup.
At this point, you may be in panic mode, frantically wondering, "How do you expect me to write a bunch of code like this from scratch when I'm just barely getting familiar with JavaScript?!" The answer is that you don't have to write code like this from scratch. You only need to know enough to interpret and adapt a working example. Using the documentation and examining the code line by line, you should be able to get at least a basic idea of what is happening. If there's a parameter you don't understand, you can zero in on it. But don't worry about grasping everything.
Experienced developers sometimes say that the way to learn an API is to "play with it." This can drive beginners insane. Play with what? How do I even know what to do? In this lesson, you have hopefully learned to pick out simple code examples that are most relevant to what you want to do, then examine them line by line and see if you can tell what each line of the code is doing. Then make minor adjustments to the code to fit it to your own data and scenario. (This is the "playing with it" part.) Let's go to the walkthrough to see how the above three examples could be adapted to some of your own web map services.
Walkthrough: Overlaying a WMS on a tiled map with OpenLayers
The goal of this walkthrough is to get some practice overlaying different kinds of web services in OpenLayers. You were already introduced to the purpose of this walkthrough in the previous section. To review, you will first publish a WMS showing farmers' markets in Philadelphia. You will then use OpenLayers to place this layer on top of the Philadelphia basemap tiles you made with TileMill in the previous lesson. You'll also add code, so that a user of your application can click any farmers market and see some more information in a popup.
Setting up the farmers' markets WMS
The first step is setting up a (passably) good-looking WMS showing farmers' markets in Philadelphia. In this application, the farmers' markets WMS will play the role of the business layer.
Setting up this WMS will be a nice review of some of the skills you learned in Lesson 4. In places where step-by-step instructions are lacking, you should be able to go back to the Lesson 4 walkthrough to remember the procedures.
- Download this shapefile of Philadelphia farmers' markets. This was obtained from the City of Philadelphia via the PASDA library. It's probably easiest if you extract it into your C:\data\Philadelphia folder.
- Open the GeoServer web admin page, and publish the farmers market shapefile as a layer in GeoServer using coordinate system EPSG:3857. Put it into your geog585 workspace. It should look like the following when you preview the layer.
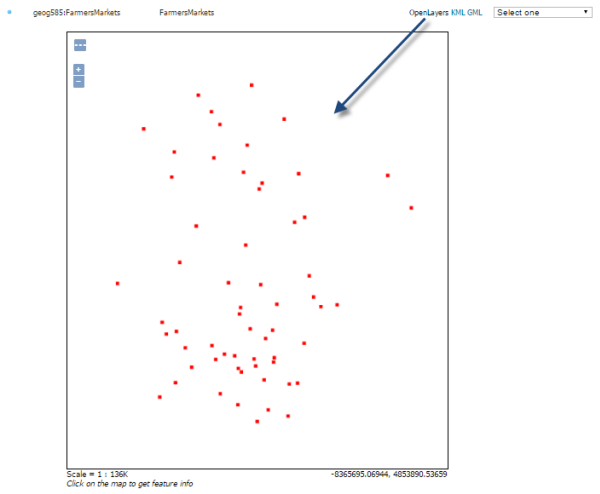 Figure 6.5
 - Using the SLD Cookbook example for Point With Styled Label, create an SLD named point_pointwithstyledlabel. If you don't remember how to do this, see the Lesson 4 walkthrough. You did exactly the same thing in that lesson using a polygon example.
Remember that the SLD is case-sensitive when reading the field that contains the label name. In this FarmersMarkets shapefile, the field you want to use for the label text is called NAME, in all caps, therefore, you will have to change the SLD code so that NAME is in all caps:<Label> <ogc:PropertyName>NAME</ogc:PropertyName> </Label> - Apply the point_pointwithstyledlabel SLD to your farmers market WMS so that it is the only available SLD, or at least the default. Again, see the Lesson 4 walkthrough if you're having trouble remembering how to do this.
When you have successfully applied the SLD, the WMS should look like the following when you preview the layer in GeoServer:You've now successfully prepared the WMS that you will overlay on your tiled map later in this walkthrough.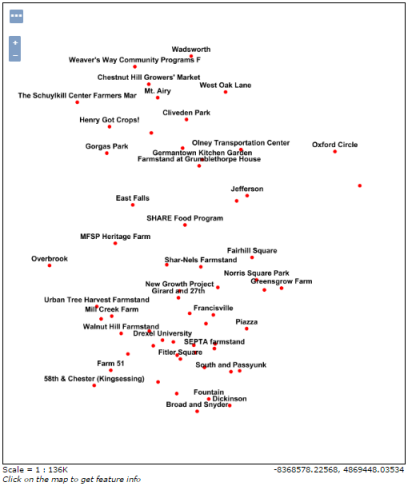 Figure 6.6
Preparing the web development environment
Now you'll make a few preparations for writing a simple OpenLayers application. As mentioned earlier in the lesson, OpenLayers won't let you query a WMS from a server running on a different address unless you are running a proxy host. Setting up the proxy host is beyond the scope of this course; therefore, we'll develop and test our HTML page on the same server that is running the WMS.
Recall that our WMS address begins with http://localhost:8080/... This is the address of the mini web server named Jetty that is installed with GeoServer for ease of getting started. You can create a folder in Jetty to put your HTML pages so that they also run on http://localhost:8080/... This way you avoid the need for a proxy host.
The following walkthrough instructions will show you how to accomplish this configuration. Just remember that in "the real world" you would probably get your IT staff to install an enterprise grade web server, such as Apache where you could run both GeoServer and your HTML pages. If you don't have an IT staff, you may even be lucky enough to do this yourself someday! :-)
- Stop GeoServer. (All Programs > GeoServer 2.x.x > Stop GeoServer)
Important note: If you are using version 2.9.2 or higher of GeoServer, steps 2-4 below will not be needed. Please post on the Technical Discussion forum if you run into any problems with the rest of the walkthrough.
- Open the file c:\Program Files\GeoServer 2.x.x\etc\jetty.xml in a text editor.
- Find the following text:
    <New class="org.mortbay.jetty.servlet.Context">
      <Arg><Ref id="contexts"/></Arg>
      <Arg>/javadoc</Arg>
      <Set name="resourceBase"><SystemProperty name="jetty.home" default="."/>/javadoc/</Set>
      <Call name="addServlet">
        <Arg>org.mortbay.jetty.servlet.DefaultServlet</Arg>
        <Arg>/</Arg>
      </Call>
    </New>
Replace it with:<New class="org.mortbay.jetty.servlet.Context"> <Arg><Ref id="contexts"/></Arg> <Arg>/</Arg> <Set name="resourceBase"><SystemProperty name="jetty.home" default="."/>/root/</Set> <Call name="addServlet"> <Arg>org.mortbay.jetty.servlet.DefaultServlet</Arg> <Arg>/</Arg> </Call> </New> - Save and close jetty.xml. If you get an access denied message, save the file to a different location (such as c:\temp) and then copy it into the intended directory, providing administrator permission when prompted.
- Create a folder c:\Program Files\GeoServer 2.x.x\webapps\geog585
As you develop web pages, you will put all your HTML pages and stylesheets in this folder. - Start GeoServer (All Programs > GeoServer 2.x.x > Start GeoServer)
As long as GeoServer is started, you should now be able to access your HTML pages through a URL such as http://localhost:8080/geog585/mypage.html (where mypage.html needs to be replaced by the name of the actual html file).
Your HTML pages will often use stylesheets to define how the page should be drawn. The OpenLayers examples use a stylesheet that we'll use in the walkthrough. You will now copy the stylesheet into this new folder. - Open this page in a web browser.
- View the source code for the page, and copy all of it into a brand new text file on your machine.
- Save the file in your new Jetty folder as c:\Program Files\GeoServer 2.x.x\webapps\geog585\style.css. If you get an access denied error, you will have to modify the access rights of the geog585 folder so that your user has read and write access rights to the folder.
- Test that your CSS is accessible by opening a browser to http://localhost:8080/geog585/style.css. You should see the same CSS file.
Note that when you also put your HTML pages in this folder, you can refer to this file simply as style.css instead of supplying the entire URL. Because most of the OpenLayers examples already refer to just "style.css," you won't even have to change the code.
We are going to make one change to this stylesheet so that the map is a little bit bigger. This will accommodate the Philadelphia shape better. - Open style.css in a text editor, and modify the height dimension in the smallmap class as shown below. (If you get an error when saving, try stopping GeoServer and saving again.):
.smallmap { width: 512px; height: 512px; border: 1px solid #ccc; } - Save and close style.css.
Creating the HTML page and writing the code
Now you'll create an HTML page and insert the JavaScript code that configures the map and popups. The steps below do not provide the code linearly; you are expected to insert the code in the correct places as given in the instructions. Code is hierarchical, in the sense that some blocks run within others. It's more intuitive to describe the blocks of code rather than to give the code in its exact sequence. If you get confused about where the code is supposed to go, refer to the full example code at the end of this walkthrough page.
- Create an empty text file and save it as markets.html in your Jetty web folder (in other words, c:\Program Files\GeoServer 2.x.x\webapps\geog585\).
Tip: If you are trying to edit this file later in the lesson and your text editor won't let you save it, stop GeoServer. You can start GeoServer after you have saved your edits and are ready to preview. - Place the following code in your text file (unlike Python, indentation doesn't matter in HTML, so don't worry if the indentation doesn't come through exactly):
<!DOCTYPE html>
<html>
  <head>
    <meta http-equiv="Content-Type" content="text/html; charset=utf-8">
    <meta name="viewport" content="width=device-width, initial-scale=1.0, maximum-scale=1.0, user-scalable=0">
    <meta name="apple-mobile-web-app-capable" content="yes">
    <title>Farmers markets in Philadelphia</title>
    <link rel="stylesheet" href="http://cdnjs.cloudflare.com/ajax/libs/openlayers/2.12/theme/default/style.css" type="text/css">
    <link rel="stylesheet" href="style.css" type="text/css">
    <script src="http://cdnjs.cloudflare.com/ajax/libs/openlayers/2.12/OpenLayers.js"></script>
    <script type="text/javascript">
    </script>
</head>
<body onload="init()">
    <h1 id="title">Farmers markets in Philadelphia</h1>

    <div id="map" class="smallmap"></div>

    <div id="docs">
        <p>This page shows farmers markets in Philadelphia, Pennsylvania. Click a market to get more information.</p>
     </div>
   </body>
</html>
The above code contains the HTML head and body. It is largely copied from the OpenLayers developer examples, although I have simplified it a bit. This should give you a shell of a page, although you won't see the map show up yet.
In the head, notice the references to the OpenLayers javascript file and the OpenLayers CSS file, both running on the CloudFlare CDN. There's also a reference to the style.css that you placed in your web folder earlier, which in some cases overrides the OpenLayers stylesheet.
In the body, notice there is a div called "map," with a CSS class applied to it called "smallmap." This class is defined in style.css and it defines the width and the height of the map in pixels. If you wanted to change the map width and height, you would modify the CSS.
From this point on, we will not make any changes to the head or body. We will be inserting JavaScript logic in the <script> tag. - Within the
<script type="text/javascript"></script>
tag, insert the following code, so that you have:var fromProjection = new OpenLayers.Projection("EPSG:4326"); // WGS 1984 var toProjection = new OpenLayers.Projection("EPSG:900913"); // Spherical Mercator Projection var map; function init() { . . . }This sets up some global variables you'll need in your code. These variables represent the coordinate systems used in the page, as well as the map. In some cases, you may also have layers defined as global variables, but this is not necessary in this particular example. Remember that 900913 is the historic name for the spherical Meractor projection EPSG:3857 and you will often still encounter it in older OpenLayers code. However, you can just as well use "EPSG:3857" in this example.
The above code also creates an initialization function init() that will run when the page is loaded. You will insert the remaining JavaScript inside of this init function. - Insert the following code within the init() function (in other words, find the ". . ." in the code above and replace it with the following):
map = new OpenLayers.Map("map", {projection:toProjection});

// Add the tiled layer
var tiles = new OpenLayers.Layer.XYZ(
   "PhillyBasemap",
   [
    "http://personal.psu.edu/<Your PSU ID>/tiles/PhillyBasemap/${z}/${x}/${y}.png"
   ],
   {
    attribution: "Data copyright OpenStreetMap contributors",
    sphericalMercator: true,
    wrapDateLine: true,
    numZoomLevels: 18
   }
 );
map.addLayer(tiles);
This code creates a map object and defines its coordinate system. Then, it creates a tiled layer that references your PhillyBasemap that you made with TileMill in Lesson 5. In the code above, you must modify the URL to contain your PSU Access Account ID so that the URL correctly points at your PASS space. Your code may require other modifications if the URL for your tiles is slightly different. Check your PASS space folder structure if you have doubts.
The examples you looked at previously in this lesson should have prepared you to interpret this code. Notice that this is the same OpenLayers.Layer.XYZ class that was used to add the Esri ArcGIS Server cache in the example we already looked at. All that's different is the URL format. -
Still within the init() function, insert the following code immediately after the above code:
// Add the WMS
var layer = new OpenLayers.Layer.WMS(
  "WMS", "http://localhost:8080/geoserver/geog585/wms",
  {
    LAYERS: 'geog585:FarmersMarkets',transparent: true
  },
  {
    singleTile:true,
    isBaseLayer: false
  }
);
map.addLayer(layer);
This code adds the WMS farmers' markets layer on top of the tiled layer. The singleTile property just tells the WMS to request one image for the full map view, rather than requesting a series of tessellated square images from the WMS to fill the map view. It has nothing to do with pregenerated tiles like the ones we examined in Lesson 5.
The isBaseLayer property is also useful. It ensures that the WMS will be placed in the correct order and exhibit a transparent background.
Note that this code is very similar to example code that you looked at earlier in the lesson. You should be starting to see patterns in the way that you define and add layers, even when those layers come from a variety of different server addresses. - Still within the init() function, insert the following code immediately after the above code:
// Center the map
map.setCenter(new OpenLayers.LonLat(-75.145, 40).transform(fromProjection,toProjection), 11);
This code centers the map on Philadelphia and zooms it to tile level 11 (remember there are approximately 20 tile levels if you were to build tiles from the world scale down to the city block scale). It may take some trial and error with your application to figure out the coordinates and tile level you want to use in your initial view. Note that if your map is in spherical Mercator, like we are using, then you need to apply a transformation (i.e., reprojection). You can see this occurring in the above code. -
Still within the init() function, insert the following code immediately after the above code:
// Configure the query on click
			var info = new OpenLayers.Control.WMSGetFeatureInfo({
			  url: 'http://localhost:8080/geoserver/geog585/wms',
			  title: 'Identify features by clicking',
			  queryVisible: true,
			  infoFormat: "application/json",
			  eventListeners: {
			    getfeatureinfo: function(event) {
			      // Read and parse the query response, if there is one
			      var response = JSON.parse(event.text);
			      if(response.features.length !== 0){
			        var returnedFeature = response.features[0];
			        // Configure the popup
			        map.addPopup(new OpenLayers.Popup.FramedCloud(
			          "marketInfo",
			          map.getLonLatFromPixel(event.xy),
			          null,
			          "<b>" + returnedFeature.properties.NAME + "</b><br />" + returnedFeature.properties.ADDRESS,
			          null,
			          true
			        ));
			      }
			    }
			  }
			});

			map.addControl(info);
			info.activate();
This is obviously a more complicated block of code, and I have placed a few comments within it to point out key sections. It is not too different from the example you looked at earlier in the lesson, that added a popup in response to a query. In fact, pause right now, and take a moment to compare the two.
The biggest difference between this code and the popup example you looked at earlier in the lesson is that this code has been modified to request a JSON response from the WMS instead of HTML. Recall that the example from earlier in the lesson just crammed a huge HTML table into the popup; there was no way to customize the content. Requesting a JavaScript object (i.e., JSON) instead allows you much more flexibility with what to put in the popup. You are still putting HTML into the popup, but you are defining the HTML and customizing it to include just the properties of the response that are important to you. Thus, this very important line that appears above:"<b>" + returnedFeature.properties.NAME + "</b><br />" + returnedFeature.properties.ADDRESS,
Here you have a string being constructed that defines the popup content. The string combines HTML markup such as <b> with properties from the query response, such as the NAME and ADDRESS field values coming from the queried farmers market.
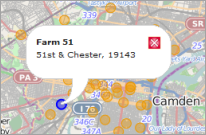
Even if you do not fully comprehend this code now, the important thing is that you can identify these key sections and make a reasonable attempt in the future at adapting them to your own web services. Remember, very rarely will you sit down and compose this type of code from scratch; you will almost always be modifying an example. - Test your map by opening http://localhost:8080/geog585/markets.html. It should look like the image below. If it doesn't, continue reading for some troubleshooting tips.
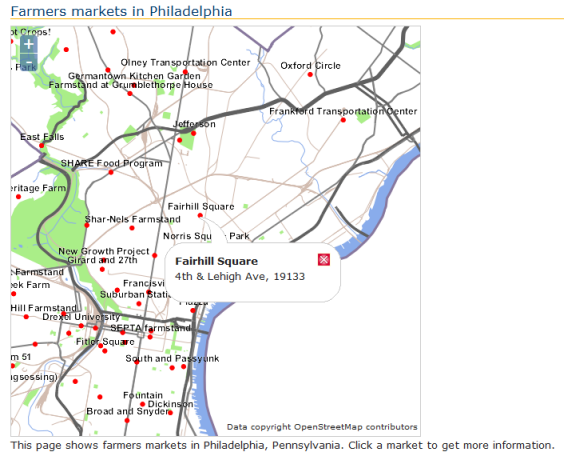 Figure 6.7
Troubleshooting
If you don't get the expected result at the end of the walkthrough, please verify the following:
- Make sure that you are connected to the Internet. In this course, we always reference OpenLayers from a content delivery network (CDN) website rather than hosting it on our own server. All of the OpenLayers logic is being pulled from the Internet in our case.
- Check that GeoServer is started. Note that you may need to stop GeoServer while making adjustments to your code, then start it when you have made your edits and want to preview your work.
- Check that you have inserted your Penn State Access Account ID into the tile URL as described above.
- Make sure your code exactly matches the final code below.
Final code for the walkthrough
Below is the code used in this walkthrough from start to finish. This should help you get some context of where each block should be placed. If you are interested in how the code for this example would look like in OpenLayers 3, you can have a look at the html file contained in the zip you can download here.
<!DOCTYPE html>
	<html>
	  <head>
	    <meta http-equiv="Content-Type" content="text/html; charset=utf-8">
	    <meta name="viewport" content="width=device-width, initial-scale=1.0, maximum-scale=1.0, user-scalable=0">
	    <meta name="apple-mobile-web-app-capable" content="yes">
	    <title>Farmers markets in Philadelphia</title>
	    <link rel="stylesheet" href="http://cdnjs.cloudflare.com/ajax/libs/openlayers/2.12/theme/default/style.css" type="text/css">
	    <link rel="stylesheet" href="style.css" type="text/css">
	    <script src="http://cdnjs.cloudflare.com/ajax/libs/openlayers/2.12/OpenLayers.js"></script>
	    <script type="text/javascript">
	      var fromProjection = new OpenLayers.Projection("EPSG:4326"); // WGS 1984
	      var toProjection = new OpenLayers.Projection("EPSG:900913"); // Spherical Mercator Projection
	      var map;
	      function init() {
	        map = new OpenLayers.Map("map", {projection:toProjection});

	        // Add the tiled layer
	        var tiles = new OpenLayers.Layer.XYZ(
	          "PhillyBasemap",
	          [
	            "http://personal.psu.edu/sdq107/tiles/PhillyBasemap/${z}/${x}/${y}.png"
	          ],
	          {
	            attribution: "Data copyright OpenStreetMap contributors",
	            sphericalMercator: true,
	            wrapDateLine: true,
	            numZoomLevels: 18
	          }
	        );
	        map.addLayer(tiles);

	        // Add the WMS
	        var layer = new OpenLayers.Layer.WMS(
	          "WMS",
	          "http://localhost:8080/geoserver/geog585/wms",
	          {
	            LAYERS: 'geog585:FarmersMarkets',transparent: true
	          },
	          {
	            singleTile:true,
	            isBaseLayer: false
	          }
	        );
	        map.addLayer(layer);

	        // Center the map
	        map.setCenter(new OpenLayers.LonLat(-75.145, 40).transform(fromProjection,toProjection), 11);

	        // Configure the query on click
	        var info = new OpenLayers.Control.WMSGetFeatureInfo({
	          url: 'http://localhost:8080/geoserver/geog585/wms',
	          title: 'Identify features by clicking',
	          queryVisible: true,
	          infoFormat: "application/json",
	          eventListeners: {
	            getfeatureinfo: function(event) {
	              // Read and parse the query response, if there is one
	              var response = JSON.parse(event.text);
	              if(response.features.length !== 0){
	                var returnedFeature = response.features[0];
	                // Configure the popup
	                map.addPopup(new OpenLayers.Popup.FramedCloud(
	                  "marketInfo",
	                  map.getLonLatFromPixel(event.xy),
	                  null,
	                  "<b>" + returnedFeature.properties.NAME + "</b><br />" + returnedFeature.properties.ADDRESS,
	                  null,
	                  true
	                ));
	              }
	            }
	          }
	        });
	        map.addControl(info);
	        info.activate();

	      }

	    </script>
	  </head>
	  <body onload="init()">
	    <h1 id="title">Farmers markets in Philadelphia</h1>

	    <div id="map" class="smallmap"></div>

	    <div id="docs">
	        <p>This page shows farmers markets in Philadelphia, Pennsylvania. Click a market to get more information.</p>
	    </div>
	  </body>
	</html>
Lesson 6 assignment: Overlay your own data in OpenLayers and examine real world use of a web mapping API
This week's assignment has two parts:
- The first piece of the assignment requires you to adapt the Lesson 6 walkthrough to your own data. Recall that in the Lesson 4 assignment, you served a WMS using some of your term project data. For this week's assignment, overlay this WMS on a tiled map using OpenLayers. Get the popups working on the WMS as well.
The tiled map can either be the map you made in the Lesson 5 assignment or it can be a third-party hosted set of OpenStreetMap tiles.
This task will require just some minor adaptation of the walkthrough code.
The deliverables for this part of the project are A) your code, and B) a screenshot of the two maps overlayed with a popup displayed (just like the graphics in the walkthrough.
- Read this GIS Stack Exchange post: How do various JavaScript mapping libraries compare? Then find and critique a web map made using OpenLayers, Leaflet, or another web mapping API. Examine the source code and then submit an approximately 300 - 500 word evaluation describing:
- The URL of the app (so that I can also see it).
- Which API was used?
- Which services/layers are brought into this map?
- What principal features/classes of the API were used? For full credit, include links to the API reference documentation for these classes.
- What is one coding technique you learned by looking at the source code of this map?
- Which features could have been added to improve the map?
Zip these deliverables into a single folder and place them in the Lesson 6 assignment drop box on Canvas.