ARCHIVED - 2017.08.02
Last week, you used a server-drawn image from a WMS to display your business layer (the farmers markets). This week, you'll learn about an alternative way to display your business layers on the map; namely, sending the raw data to the client (such as a web browser) to be drawn. This is a common technique in many web maps that can provide for much interactivity and potentially faster performance if used appropriately. You may have even been exposed to this practice when you reviewed a web map for your assignment last week.
This lesson describes two common formats used for sending vector GIS data to the browser (KML and GeoJSON) and shows how you can add these types of layers in OpenLayers.
Objectives
- Describe benefits and challenges of drawing thematic vector map layers on the client.
- Choose between KML, GeoJSON, and other formats for drawing vector data on the client.
- Understand how vector layers can be symbolized on the fly to provide a more interactive web map experience.
- Draw thematic vector layers in a web map using OpenLayers and change the symbolization in response to map events.
Checklist
- Read the Lesson 7 materials on this page.
- Complete the walkthrough.
- Complete the Lesson 7 assignment.
Benefits and challenges of drawing vector layers on the client side
Last week, you used a server-drawn image from a WMS to display your business layer (the farmers markets). This week, you'll learn about an alternative way to display your business layers on the map; namely, sending the raw data to the client (such as a web browser) to be drawn. This is a common technique in many web maps that can provide for much interactivity and potentially faster performance if used appropriately. You may have even been exposed to this practice when you reviewed a web map for your assignment last week.
This lesson describes two common formats used for sending vector GIS data to the browser (KML and GeoJSON) and shows how you can add these types of layers in OpenLayers.
Objectives
- Describe benefits and challenges of drawing thematic vector map layers on the client.
- Choose between KML, GeoJSON, and other formats for drawing vector data on the client.
- Understand how vector layers can be symbolized on the fly to provide a more interactive web map experience.
- Draw thematic vector layers in a web map using OpenLayers and change the symbolization in response to map events.
Checklist
- Read the Lesson 7 materials on this page.
- Complete the walkthrough.
- Complete the Lesson 7 assignment.
Working with vector KML
KML (Keyhole Markup Language) is a popular format for vector GIS features due to its association with Google Earth and Google Maps. KML is just XML formatted according to an open specification, previously maintained by Google, but now enshrined in an OGC standard. Although KML can define the placement of raster layers, we will focus on vector KML in this lesson.
The key XML tag behind KML is the placemark. This defines a geographic feature, a symbol, and extra information that can appear in a popup. You can see some placemarks if you save the example KML file and open it in a text editor. This isn't the cleanest file, but it will do for the purposes of seeing a placemark:
<Placemark>
	   <name>Sundial, Plymouth, Devon, UK</name>
               <description><![CDATA[The gnonom is 27 foot high, the pool has 21 feet diameter.  It was designed by architect Carole Vincent from Boscastle in Cornwall and was unveiled by Her Majesty the Queen on Friday July 22nd 1988 for a cost of  cost £70,000 . The sundial runs one hour and seventeen minutes behind local clocks.
	<img src="http://www.photoready.co.uk/people-life/images/sundial-fountain.jpg">
	Image source:<a href="www.photoready.co.uk</a>]]>
           </description>
	   <LookAt>
	      <longitude>-4.142398271107962</longitude>
	      <latitude>50.37145390235462</latitude>
	      <altitude>0</altitude>
	      <range>63.33410419881957</range>
	      <tilt>0</tilt>
	      <heading>-0.0001034131369701296</heading>
	   </LookAt>
	   <styleUrl>#msn_sunny_copy69</styleUrl>
	   <Point>
	      <coordinates>-4.142446411782089,50.37160252809223,0</coordinates>
	   </Point>
	</Placemark>
This particular placemark has a single coordinate, contained in the Point tag. For polylines and polygons, the LineString and Polygon tags are used, respectively, although these do not appear in the above example.
Notice that the Description tag can contain HTML, which gives you more control over formatting popups.
The full KML file is much longer, and luckily you do not have to parse it. The OpenLayers.Layer.Vector class allows you to just supply the path of the KML, and OpenLayers will do the rest of the work of displaying the contents.
Take a look at the KML Layer Example, and view the page source code. Then find and scrutinize the following code block to understand how the KML was added into the map:
var sundials = new OpenLayers.Layer.Vector("KML", {
   projection: map.displayProjection,
   strategies: [new OpenLayers.Strategy.Fixed()],
   protocol: new OpenLayers.Protocol.HTTP({
      url: "kml/sundials.kml",
      format: new OpenLayers.Format.KML({
         extractStyles: true,
         extractAttributes: true
      })
   })
	});

	map.addLayers([wms, sundials]);
Notice how the strategy is defined as Fixed. This means that all the features in the KML file will be loaded into the browser at the time the map is loaded.
The KML is invoked using the OpenLayers.Protocol.HTTP object (as opposed to the OpenLayers.Protocol.SQL object which connects to databases). You have to specify the path to the file (which can be a full URL or a relative path like the one above) and then specify that the format is OpenLayers.Format.KML. If you look at all the OpenLayers.Format classes in the API reference table of contents (see sidebar on the left, click on "Format" to unfold the list), you will see many types of data you can add to your map as vectors.
Again, don't worry about memorizing all the syntax. In most scenarios, you should just be able to tweak the above example to connect to your own KML. The API reference and other online samples can help you further with understanding all the available properties.
Working with GeoJSON
GeoJSON is a widely-used data format for displaying vectors in web maps. It is based on JavaScript object notation, a simple and minimalist format for expressing data structures using syntax from JavaScript. In GeoJSON, a vector feature and its attributes are represented as a JavaScript object, allowing for easy parsing of the geometry and fields.
GeoJSON is less bulky than XML-based structures such as KML; however, GeoJSON does not always contain styling information like KML does. You must define the styling on the client, which in your case means writing JavaScript code or taking the OpenLayers default styling. This is covered in the next section of the lesson.
GeoJSON's simplicity and loading speed have made it popular, perhaps even trendy, among developers in the FOSS world. For example, in a tongue-in-cheek Internet poll, GIS practitioners recently voted "The answer is always GeoJSON" as the most likely attribute to define a 'GeoHipster'.
Here's what a piece of GeoJSON looks like. GeoJSON vectors are commonly bundled into a unit called a FeatureCollection. The FeatureCollection below holds just one feature (the state of Montana) but could hold other features. The bulk of the GeoJSON below contains the vertices that define the state outline, but you should also notice a few attributes, such as "fips" and "name":
{"type":"FeatureCollection","features":[{"type":"Feature","id":"USA-MT","properties":{"fips":"30","name":"Montana"},"geometry":{"type":"Polygon","coordinates":[[[-104.047534,49.000239],[-104.042057,47.861036],[-104.047534,45.944106],[-104.042057,44.996596],[-104.058488,44.996596],[-105.91517,45.002073],[-109.080842,45.002073],[-111.05254,45.002073],[-111.047063,44.476286],[-111.227803,44.580348],[-111.386634,44.75561],[-111.616665,44.547487],[-111.819312,44.509148],[-111.868605,44.563917],[-112.104113,44.520102],[-112.241036,44.569394],[-112.471068,44.481763],[-112.783254,44.48724],[-112.887315,44.394132],[-113.002331,44.448902],[-113.133778,44.772041],[-113.341901,44.782995],[-113.456917,44.865149],[-113.45144,45.056842],[-113.571933,45.128042],[-113.736241,45.330689],[-113.834826,45.522382],[-113.807441,45.604536],[-113.98818,45.703121],[-114.086765,45.593582],[-114.333228,45.456659],[-114.546828,45.560721],[-114.497536,45.670259],[-114.568736,45.774321],[-114.387997,45.88386],[-114.492059,46.037214],[-114.464674,46.272723],[-114.322274,46.645155],[-114.612552,46.639678],[-114.623506,46.705401],[-114.886399,46.809463],[-114.930214,46.919002],[-115.302646,47.187372],[-115.324554,47.258572],[-115.527201,47.302388],[-115.718894,47.42288],[-115.724371,47.696727],[-116.04751,47.976051],[-116.04751,49.000239],[-111.50165,48.994762],[-109.453274,49.000239],[-104.047534,49.000239]]]}}]}
In the GeoJSON above, notice the use of several JavaScript objects embedded within one another. At the lowest level, you have a Polygon object. The Polygon object is contained within a Feature object. The feature is part of a FeatureCollection object. The GeoJSON specification gives precise details about how these objects are to be structured. It's important to be familiar with these structures, although you will rarely have to read or write them directly. You will typically use convenience classes or converter programs that have been developed to simplify the experience of working with GeoJSON.
You can use GeoJSON within your main JavaScript code file, but, to keep your things looking simple, it's most common to maintain the GeoJSON in its own separate file. You then reference this file from the appropriate place in your code. Here's an example of how you would use a file containing the Montana GeoJSON above to define a vector layer using OpenLayers. The excerpt below comes directly from one of the OpenLayers GeoJSON developer examples.
var vector = new OpenLayers.Layer.Vector("GeoJSON", {
    projection: "EPSG:4326",
    strategies: [new OpenLayers.Strategy.Fixed()],
    protocol: new OpenLayers.Protocol.HTTP({
        url: "geojson-reprojected.json",
        format: new OpenLayers.Format.GeoJSON()
    })
	});
Note that this is very similar to the way you created a vector layer using KML. The only essential differences are the "url" and "format" properties for the OpenLayers.Protocol.HTTP. The url property points at the JSON file and can be a full URL or a relative URL (in this case it is relative; geojson-reprojected.json lives at the same level of the folder structure as the main JavaScript file). For simplicity, I have omitted the line of code that adds this layer to the map, but you would add it in the same fashion as any other layer.
When you use any web mapping API to create a GeoJSON layer, take note of how the API requires you to define, structure, and reference your GeoJSON file. In OpenLayers, you can reference pure GeoJSON, (seen here), but with Leaflet you have to define the GeoJSON as a JavaScript variable (seen here) using syntax such as
var <yourVariableName> = <yourGeoJSON>;
You can save any vector layer in QGIS as GeoJSON, and most web mapping APIs offer easy-to-use classes for GeoJSON as a vector display format. In the proprietary software realm, Esri has dragged its feet on GeoJSON support, offering its own JSON-based geometry formats as part of the GeoServices REST Specification and the ArcGIS REST API; however, Esri has informally shared an open source JavaScript library to convert between the two formats.
The GeoJSON specification is not an OGC specification. At the time of this writing, OGC conspicuously lacks a JSON-based specification for defining vector GIS objects (OGC publishes the XML-based GML specification for vectors). This lack of an OGC-endorsed JSON specification played a role in the FOSS community's 2013 debate about whether the OGC should adopt the Esri-generated GeoServices REST Specification. The specification would have given OGC a JSON-based GIS data format, but some were wary of the format's association with a proprietary software company. The geoMusings "OGC Abandons the Web" blog post gives one FOSS geo-developer's opinion on the episode (read the comments, too).
Symbolizing vector layers in OpenLayers
When you bring in vector datasets to be drawn by the browser, you may need to do some work to define the symbol that will draw the feature. With data formats like GeoJSON that don't contain any styling information, you don't get ready-made styling like you would get if you just requested an image from the server. If you don't define a symbol for your graphics, you'll probably see your API's default symbol.
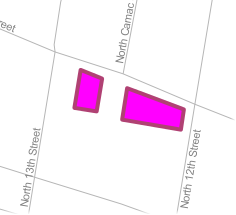
You can define a style directly within the vector layer's constructor. Below is some code that creates a GeoJSON layer to show urban gardens (as polygons). The style is defined directly within the constructor as a JSON object shown in bold below:
var gardensLayer = new OpenLayers.Layer.Vector("Gardens", {
   projection: fromProjection,
   strategies: [new OpenLayers.Strategy.Fixed()],
   protocol: new OpenLayers.Protocol.HTTP({
      url: "gardens.geojson",
      format: new OpenLayers.Format.GeoJSON()
   }),
   style: {
      'strokeWidth':4,
      'fillColor':'#ff00ff',
      'strokeColor':'#B04173'
   }
});
Notice that the properties include stroke width, fill color, and stroke color. The colors are defined using hex notation. In this case, the symbol is a magenta fill with a purple outline (Sorry! I wanted it to stand out...). When writing your own code, use an online color picker to get the hex values of the colors you want.
You can read more about styling in OpenLayers here. At the bottom of this page, you find a list of style properties available. You should be able to accomplish most of what you want to do using working examples and a little bit of experimentation.
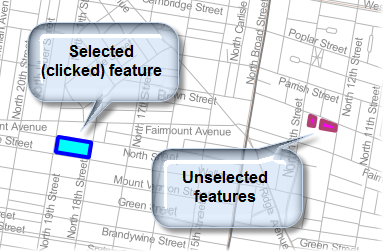
The advantage of drawing vector layers in the browser is that you can quickly change the styling in response to certain events. For example, you can change the color of a single symbol when a user clicks it. Using OpenLayers, you can define various styles using the OpenLayers.Style object and connect them to map events.
The OpenLayers.StyleMap is a special object that holds multiple styles and rules about when they should be used. The code below demonstrates how a style map could be used to "highlight" a garden feature when it's clicked. The selected garden would change to a blue fill:
Don't worry about running this code right now, because you'll use some nearly identical code in the lesson walkthrough in a working example. Just pay attention to the code patterns and what is happening in each line.
First, use OpenLayers.Style objects to define the unselected and selected styles:
// Set up symbols for gardens
// Purple symbol for unselected gardens
var gardenStyle = new OpenLayers.Style({
   'strokeWidth':4,
   'fillColor':'#ff00ff',
   'strokeColor':'#B04173'
});

// Blue symbol for selected gardens
var selectedGardenStyle = new OpenLayers.Style({
   'strokeWidth':4,
   'fillColor':'#00fffb',
   'strokeColor':'#0000ff'
});
Then, use the OpenLayers.StyleMap object to define the default symbol and the selection symbol:
// Set up style map for gardens
var gardenStyleMap = new OpenLayers.StyleMap({'default': gardenStyle,'select': selectedGardenStyle});
Define the gardens GeoJSON layer, being sure to reference the StyleMap (see bold code):
// Define the gardens GeoJSON layer
var gardensLayer = new OpenLayers.Layer.Vector("Gardens", {
    projection: fromProjection,
    strategies: [new OpenLayers.Strategy.Fixed()],
    protocol: new OpenLayers.Protocol.HTTP({
    url: "gardens.geojson",
    format: new OpenLayers.Format.GeoJSON()
  }),
  styleMap: gardenStyleMap
});
Add an OpenLayers.Control.SelectFeature control into your map. This nifty object listens for click events and is "smart" enough to read your style map and apply it to selected and unselected features.
// Listen for feature selection events.
selectControl = new OpenLayers.Control.SelectFeature(gardensLayer);
map.addControl(selectControl);
selectControl.activate();
A map user should now be able to click any garden and see it highlighted in blue. When the user clicks off the garden, it goes back to its original purple symbol.
To summarize this part of the lesson, vector layers drawn by the browser require a little more work on the developer's part, because the developer must define the symbols. However, with that work comes a variety of options for interactivity that would not be possible with rasterized image tiles or layers drawn by the server. Although the resymbolize-on-click functionality seems rudimentary, think about the difficulty (if not outright futility) of getting this type of effect with a WMS or rasterized tile layer.
This section of the lesson has discussed uniform symbols for each feature in the layer (except for the occasional selected feature); however, OpenLayers allows you to go further by defining style rules, or classes, based on attribute values. This opens the door for choropleth maps, proportional symbols, and so forth. Some of these techniques will be covered in Lesson 8.
Allowing developers untrained in cartographic principles to select map symbols may present some challenges of its own. It may be a good idea to have the developer consult with a cartographer in order to determine the most appropriate widths, colors, and fills for the vector symbols.
Walkthrough: Adding interactive GeoJSON layers in OpenLayers
This walkthrough builds on some of the previous sections of the lesson to show how you can add interactive GeoJSON layers to your web map using OpenLayers. You will build a map containing your Philadelphia basemap tiles and two GeoJSON layers on top representing urban gardens and food pantries (i.e., food banks). A user can click one of the gardens or food pantries to see the name of the feature below the map (as an alternative to using popups). The clicked feature changes color while it is selected. Hopefully, you can think of many ways to apply these pieces of functionality to the web map you're building for your term project.
Note that this is a sample dataset culled from OpenStreetMap and is not a comprehensive list of these features in Philadelphia. If you know of any other gardens or food pantries, please add them in OpenStreetMap (more about this in Chapter 9)!
Downloading the data
Before continuing, download and unzip the data for this project. Copy its contents into your Jetty home folder which should have a path such as
c:\Program Files\GeoServer 2.x.x\webapps\geog585\
This is the same folder where you saved your Lesson 6 walkthrough and where your local stylesheet style.css (required for this exercise) is located.
This folder contains two GeoJSON files and two SVG (scalable vector graphics) files that will be used for symbolizing the food pantries. The yellow symbol will be for the unselected features and the blue symbol for the selected features.
There are a couple of ways that you could get this kind of data for your own applications.
- QGIS can save any vector layer as GeoJSON format.
- All the icons available in QGIS are available on your machine in a folder named something like:
C:\Program Files\QGIS <name of your version>\apps\qgis\svg
I used the open source program Inkscape to change the color of the icon.
Setting up the HTML file
Before diving into the JavaScript code, create an empty text file and insert the following code. Then save it as lesson7.html next to all the other files you just downloaded and copied into your home folder.
<!DOCTYPE html>
   <html>
     <head>
        <meta http-equiv="Content-Type" content="text/html; charset=utf-8">
	<meta name="viewport" content="width=device-width, initial-scale=1.0, maximum-scale=1.0, user-scalable=0">
	    <meta name="apple-mobile-web-app-capable" content="yes">
	    <title>Food resources: Community gardens and food banks</title>
	    <link rel="stylesheet" href="http://cdnjs.cloudflare.com/ajax/libs/openlayers/2.12/theme/default/style.css" type="text/css">
	    <link rel="stylesheet" href="style.css" type="text/css">
	    <script src="http://cdnjs.cloudflare.com/ajax/libs/openlayers/2.12/OpenLayers.js"></script>
	    <script type="text/javascript">
	     . . .
	    </script>
   </head>
	 <body onload="init()">
	   <h1 id="title">Food resources: Community gardens and food pantries</h1>
	   <div id="map" class="smallmap"></div>
	   <div id="summaryLabel">
	       <p>Click a garden or food pantry on the map to get more information.</p>
	   </div>
	  </body>
	</html>
If you open this, you should see an empty map surrounded by an HTML title and descriptive text. Now let's add the OpenLayers code that creates the map and layers.
Writing the JavaScript
- Find the script tag for your JavaScript code and replace the . . . with the following lines so that you have:
var fromProjection = new OpenLayers.Projection("EPSG:4326"); // transform from WGS 1984
		var toProjection = new OpenLayers.Projection("EPSG:900913"); // to Spherical Mercator Projection
		var map;
		function init() {
		  map = new OpenLayers.Map("map", {projection:toProjection});
                   . . .
		}
This creates some global variables for coordinate systems that will be used in this app, as well as the map. It also creates a function that will run when the page initializes. The map itself is created within this function. - Add the following code within function init() immediately above the ending } of the function (in other words, replacing the . . . in the code above). This defines the tiled basemap layer for Philadelphia. This should be familiar because you did it in the previous walkthrough. Remember to edit the URL so that it points at your own PASS space.
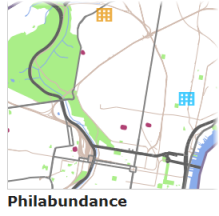
// Define the Philadelphia basemap tiled layer
		var tiles = new OpenLayers.Layer.XYZ(
		  "PhillyBasemap",
		  [
		   "http://personal.psu.edu/<your PSU ID>/tiles/PhillyBasemap/${z}/${x}/${y}.png"
		  ],
		  {
		    attribution: "Data copyright OpenStreetMap contributors",
		    sphericalMercator: true,
		    wrapDateLine: true,
		    numZoomLevels: 18
		  }
		);
Note that the layer is not added to the map yet. You could add it if you wanted, but, in this walkthrough, I want to show you a different way to add layers that allows adding all the layers at once. - Add the following immediately after the above code:
// Set up symbols for gardens
		// Purple symbol for unselected gardens
		var gardenStyle = new OpenLayers.Style({
		    'strokeWidth':4,
		    'fillColor':'#ff00ff',
		    'strokeColor':'#B04173'
		});
		// Blue symbol for selected gardens
		var selectedGardenStyle = new OpenLayers.Style({
		    'strokeWidth':4,
		    'fillColor':'#00fffb',
		    'strokeColor':'#0000ff'
		});
		// Set up style map for gardens
		var gardenStyleMap = new OpenLayers.StyleMap({'default': gardenStyle,'select': selectedGardenStyle});
		// Define the gardens GeoJSON layer
		var gardensLayer = new OpenLayers.Layer.Vector("Gardens", {
		    projection: fromProjection,
		    strategies: [new OpenLayers.Strategy.Fixed()],
		    protocol: new OpenLayers.Protocol.HTTP({
		        url: "gardens.geojson",
		        format: new OpenLayers.Format.GeoJSON()
		    }),
		    styleMap: gardenStyleMap
		});
This is nearly identical to the code in the previous section of the lesson. It defines two different symbols for the gardens layer (a default symbol and a selected symbol). It then puts the symbols in a style map and creates the layer. Now, we'll do the same thing for the food pantries layer. - Add the following immediately after the above code:
// Set up symbols for pantries
		// Yellow symbol for unselected pantries
		var pantryStyle = new OpenLayers.Style({
		    externalGraphic: 'pantries.svg',
		    graphicWidth: 25,
		    graphicHeight: 25,
		    graphicYOffset: 0
		});

		// Blue symbol for selected pantries
		var selectedPantryStyle = new OpenLayers.Style({
		    externalGraphic: 'pantries_selected.svg',
		    graphicWidth: 25,
		    graphicHeight: 25,
		    graphicYOffset: 0
		});

		// Set up style map for pantries
		var pantryStyleMap = new OpenLayers.StyleMap({'default': pantryStyle,'select': selectedPantryStyle});

		// Define the food pantries GeoJSON layer
		var pantriesLayer = new OpenLayers.Layer.Vector("Pantries", {
		  projection: fromProjection,
		  strategies: [new OpenLayers.Strategy.Fixed()],
		  protocol: new OpenLayers.Protocol.HTTP({
		    url: "pantries.geojson",
		    format: new OpenLayers.Format.GeoJSON()
		  }),
		  styleMap: pantryStyleMap
		});
This creates a default symbol and a selected symbol for the food pantries. Find the lines of code that reference the .svg files. Notice that the default and selected symbols point at different .svg files (one is yellow, and one is blue). Because this is a point symbol, stroke and fill colors do not need to be specified. Other than that, the code is nearly identical to the gardens code. - Add the following code immediately after the above code:
// Add the layers and center the map
		map.addLayers([tiles,gardensLayer,pantriesLayer]);
		map.setCenter(new OpenLayers.LonLat(-75.15, 40).transform(fromProjection,toProjection), 12);
This code adds the layers to the map and sets the map to its initial center point and zoom level. Notice how you can add all three layers to the map at once by passing them into the addLayers() method as an array. - Add the following code immediately after the above code:
// Listen for feature selection and unselection events.
		selectControl = new OpenLayers.Control.SelectFeature([gardensLayer,pantriesLayer], {
		    onSelect: onFeatureSelect,
		    onUnselect: onFeatureUnselect
		});

		map.addControl(selectControl);
		selectControl.activate();
This code adds a new SelectFeature control to your map that will listen for click events on a feature. Notice that we explicitly "wire up" both the gardens layer and the pantries layer to this control via the first parameter in the control's constructor.
Although you saw the SelectFeature control in the previous section of the lesson, the example here is a little more complex because we will add special event handling logic for both the select and unselect events. Notice that there are two functions referenced here, onFeatureSelect and onFeatureUnselect, that we have not defined yet. We will do this in the next step. - Add the following code immediately after the above code:
// Handle the feature selection even
		function onFeatureSelect(feature){
		  var featureName = feature.attributes.name || "Unnamed feature";
		  // Insert some HTML with the feature name
		  document.getElementById('summaryLabel').innerHTML = '<p style="font-size:18px"><b>' + featureName + '</b></p>';
		}

		// Handle the feature unselection event
		function onFeatureUnselect(feature){
		  // Set the HTML back to what it was before
		  document.getElementById('summaryLabel').innerHTML = '<p>Click a garden or a food pantry on the map to get more information.</p>';
		}
Here we have two handler functions that will be invoked by the SelectFeature control. The first function, onFeatureSelect, is invoked when a user clicks a feature. This function drills into the selected GeoJSON feature and gets the "name" attribute of the feature. The only reason this works on both the pantries and gardens layers at the same time is because both of these layers have an attribute called "name". If a name isn't found, then the name is set to "Unnamed feature."
Then the function uses a special method to change the HTML appearing within the 'summaryLabel' div. This is how we get the feature name to display below the map. We could potentially insert some very complex HTML here, perhaps displaying many other attributes besides the feature name. Placing attribute information in an HTML sidebar or below the map in this fashion is a flexible alternative to using popups. For this walkthrough, I have kept things very simple; however, you will see some more complex HTML in Lesson 8, and I encourage you to think of ways you might provide a richer set of attribute information (perhaps inserted into an HTML table) in your term projects.
The onFeatureUnselect function is invoked when a user clicks away from a selected feature. This function sets the HTML in the "summaryLabel" div back to its original state, instructing users to click a feature to see more information. - Run your page, and click some of the garden and pantry features. When you click a feature, it should turn blue, and the feature name should display below the map. When you click away from a feature (or click a different feature), the feature should return to its original color, and the feature name should be removed (or updated if you clicked a different feature).
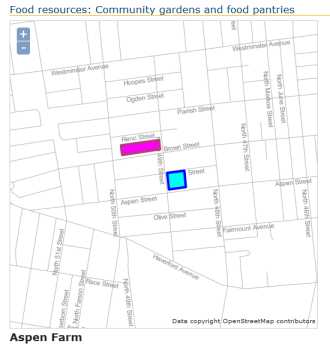 Figure 7.4
Final code for the walkthrough
If your page does not work, carefully compare your code to the full code below to make sure you have inserted everything in the right place. Also:
- verify that you are connected to the Internet when you run the page, so that you can retrieve the OpenLayers code from the CDN;
- make sure that you have inserted the URL to your own PASS space when you reference the tiled basemap;
- make sure that GeoServer is started (because you are running the page through its Jetty web servlet) and that you are referencing the page through a URL similar to the following: http://localhost:8080/geog585/lesson7.html.
An OpenLayers 3 version of the walkthrough code is available here. The final code for the OpenLayers 2 version is below:
<!DOCTYPE html>
	<html>
	  <head>
	    <meta http-equiv="Content-Type" content="text/html; charset=utf-8">
	    <meta name="viewport" content="width=device-width, initial-scale=1.0, maximum-scale=1.0, user-scalable=0">
	    <meta name="apple-mobile-web-app-capable" content="yes">
	    <title>Food resources: Community gardens and food banks</title>
	    <link rel="stylesheet" href="http://cdnjs.cloudflare.com/ajax/libs/openlayers/2.12/theme/default/style.css" type="text/css">
	    <link rel="stylesheet" href="style.css" type="text/css">
	    <script src="http://cdnjs.cloudflare.com/ajax/libs/openlayers/2.12/OpenLayers.js"></script>
	    <script type="text/javascript">
	      var fromProjection = new OpenLayers.Projection("EPSG:4326"); // transform from WGS 1984
	      var toProjection = new OpenLayers.Projection("EPSG:900913"); // to Spherical Mercator Projection
	      var map;
	      function init() {

	        map = new OpenLayers.Map("map", {projection:toProjection});

	        // Define the Philadelphia basemap tiled layer
	        var tiles = new OpenLayers.Layer.XYZ(
	          "PhillyBasemap",
	          [
	            "http://personal.psu.edu/<your PSU ID>/tiles/PhillyBasemap/${z}/${x}/${y}.png"
	          ],
	          {
	            attribution: "Data copyright OpenStreetMap contributors",
	            sphericalMercator: true,
	            wrapDateLine: true,
	            numZoomLevels: 18
	          }
	        );

	        // Set up symbols for gardens
	        // Purple symbol for unselected gardens
	        var gardenStyle = new OpenLayers.Style({
	            'strokeWidth':4,
	            'fillColor':'#ff00ff',
	            'strokeColor':'#B04173'
	        });

	        // Blue symbol for selected gardens
	        var selectedGardenStyle = new OpenLayers.Style({
	            'strokeWidth':4,
	            'fillColor':'#00fffb',
	            'strokeColor':'#0000ff'
	        });

	        // Set up style map for gardens
	        var gardenStyleMap = new OpenLayers.StyleMap({'default': gardenStyle,'select': selectedGardenStyle});

	        // Define the gardens GeoJSON layer
	        var gardensLayer = new OpenLayers.Layer.Vector("Gardens", {
	            projection: fromProjection,
	            strategies: [new OpenLayers.Strategy.Fixed()],
	            protocol: new OpenLayers.Protocol.HTTP({
	                url: "gardens.geojson",
	                format: new OpenLayers.Format.GeoJSON()
	            }),
	            styleMap: gardenStyleMap
	        });

	        // Set up symbols for pantries
	        // Yellow symbol for unselected pantries
	        var pantryStyle = new OpenLayers.Style({
	            externalGraphic: 'pantries.svg',
	            graphicWidth: 25,
	            graphicHeight: 25,
	            graphicYOffset: 0
	        });

	        // Blue symbol for selected pantries
	        var selectedPantryStyle = new OpenLayers.Style({
	            externalGraphic: 'pantries_selected.svg',
	            graphicWidth: 25,
	            graphicHeight: 25,
	            graphicYOffset: 0
	        });

	        // Set up style map for pantries
	        var pantryStyleMap = new OpenLayers.StyleMap({'default': pantryStyle,'select': selectedPantryStyle});

	        // Define the food pantries GeoJSON layer
	        var pantriesLayer = new OpenLayers.Layer.Vector("Pantries", {
	          projection: fromProjection,
	          strategies: [new OpenLayers.Strategy.Fixed()],
	          protocol: new OpenLayers.Protocol.HTTP({
	            url: "pantries.geojson",
	            format: new OpenLayers.Format.GeoJSON()
	          }),
	          styleMap: pantryStyleMap
	        });

	        // Add the layers and center the map
	        map.addLayers([tiles,gardensLayer,pantriesLayer]);
	        map.setCenter(new OpenLayers.LonLat(-75.15, 40).transform(fromProjection,toProjection), 12);

	        // Listen for feature selection and unselection events.
	        selectControl = new OpenLayers.Control.SelectFeature([gardensLayer,pantriesLayer], {
	            onSelect: onFeatureSelect,
	            onUnselect: onFeatureUnselect
	        });

	        map.addControl(selectControl);
	        selectControl.activate();

	        // Handle the feature selection event
	        function onFeatureSelect(feature){
	          var featureName = feature.attributes.name || "Unnamed feature";
	          // Insert some HTML with the feature name
	          document.getElementById('summaryLabel').innerHTML = '<p style="font-size:18px"><b>' + featureName + '</b></p>';
	        }

	        // Handle the feature unselection event
	        function onFeatureUnselect(feature){
	          // Set the HTML back to what it was before
	          document.getElementById('summaryLabel').innerHTML = '<p>Click a garden or a food pantry on the map to get more information.</p>';
	        }

	      }

	    </script>
	  </head>
	  <body onload="init()">
	    <h1 id="title">Food resources: Community gardens and food pantries</h1>

	    <div id="map" class="smallmap"></div>
	    <div id="summaryLabel">
	        <p>Click a garden or food pantry on the map to get more information.</p>
	    </div>
	  </body>
	</html>
Lesson 7 assignment: Make your own mashup with a vector layer drawn in the browser
In this week's assignment, you'll make a mashup consisting of a vector layer drawn by the browser on top of your own tiled basemap. The easiest way to do this is by adapting the walkthrough techniques to your own data. Follow the instructions below to prepare this assignment:
- Examine your term project's tiled basemap. This could either be the one you created in the Lesson 5 assignment or a tiled map from OpenStreetMap that you want to use.
- Choose or create a vector dataset to overlay on top. This should result in a KML, GeoJSON, or other (with instructor approval) vector data file suitable for direct use on the web. Shapefiles are not to be used in this assignment.
You can create KML using Google Earth or Google Maps. You can create GeoJSON using QGIS.
Although you are overlaying this data on your term project basemap, you don't have to commit to using this vector layer in your term project (although it will give you a head start if you do).
- Use the patterns in this lesson to create an OpenLayers map with your tiled layer as a basemap and your vector layer on top. Clicking any vector feature should A) highlight the feature in a different color and B) display some HTML of the feature attributes somewhere in the page, as was accomplished in the Lesson 7 walkthrough. Clicking off the feature should unhighlight it.
- Host the HTML page and the data file on your PASS space so that I can evaluate the functionality. This is possible because we are just using static files; there is no GeoServer involved this week.
- Create a text document with the URL to the page and a brief (less than 300 word) writeup summarizing how things went for you with preparing the assignment, and what you learned. If you failed to achieve the needed functionality, please explain your best guess as to where the problem lies.
- Post this document in the Lesson 7 assignment drop box on Canvas.